
Abstract
Atlantic killifish (Fundulus heteroclitus) inhabiting the Atlantic Wood Industries region of the Elizabeth River, Virginia, have passed polycyclic aromatic hydrocarbon (PAH) resistance to their offspring as evidenced by early life stage testing of developmental toxicity after exposure to specific PAHs. Our study focused on environmentally relevant PAH mixtures in the form of Elizabeth River sediment extract (ERSE). Juvenile (5 month) F1 progeny of pollution-adapted Atlantic Wood (AW) parents and of reference site (King’s Creek [KC]) parents were exposed as embryos to ERSE. Liver alterations, including nonneoplastic lesions and microvesicular vacuolation, were observed in both populations. ERSE-exposed KC fish developed significantly more alterations than unexposed KC fish. Interestingly, unexposed AW killifish developed significantly more alterations than unexposed KC individuals, suggesting that AW juveniles are not fully protected from liver disease; rapid growth of juvenile fish may also be an accelerating factor for tumorigenesis. Because recent reports show hepatic tumor formation in adult AW fish, the differing responses from the 2 populations provided a way to determine whether embryo toxicity protection extends to juveniles. Future investigations will analyze older life stages of killifish to determine differences in responses related to chronic disease.
Keywords
Introduction
The Elizabeth River, located in southeastern Virginia, USA, has been the focus of ecologists, toxicologists, and developmental biologists for decades (Vogelbein et al. 1990; Di Giulio and Clark 2015). Of particular interest is the Atlantic Wood Industries (AWI) Superfund site (hereafter referred to as Atlantic Wood [AW]), on the southern branch of the river, where AWI Inc. operated a wood-treatment facility from 1926 to 1992 (Walker and Dickhut 2001; Jung et al. 2011). Over 20 years after the plant closure and until recent remediation sequestered the most contaminated sediment, this polluted area reflected the adverse consequences of creosote contamination (Di Giulio and Clark 2015). Creosote, the major mixture used by this operation, is comprised of numerous organic molecules, including polycyclic aromatic hydrocarbons (PAHs; Wills et al. 2010; Van Veld and Nacci 2008). In the 1960s, creosote spills of 20,000 and 30,000 gallons contaminated the river, resulting in the accumulation of PAHs in river sediment (Walker and Dickhut 2001; Vogelbein and Unger 2006). Native organisms including the Atlantic killifish (Fundulus heteroclitus) have been exposed to this pollution since wood-treatment facilities began production (Vogelbein and Unger 2006).
Some PAHs act as agonists of the aryl hydrocarbon receptor pathway in teleost fish, resulting in the upregulation of certain genes including cytochrome P450 enzymes that can transform some PAHs into products that bind to DNA and cause alterations (Rotchell et al. 2008). If not repaired or repaired wrongly, this can lead to cancer (Rotchell et al. 2008). Some PAHs also result in developmental abnormalities similar to that seen with dioxin-like compounds such as 2,3,7,8-tetrachlorodibenzo-p-dioxin (Spitsbergen et al. 1991; Helder 1981; Di Giulio and Clark 2015). Elizabeth River killifish developed resistance to the teratogenicity of these contaminants (Meyer and Di Giulio 2002)—an inherited resistance in first- and second-generation laboratory-raised fish (Meyer and Di Giulio 2003) from AW populations. However, this resistance comes with fitness costs in the form of susceptibility to other stressors (e.g., hypoxia; Meyer and Di Giulio 2003).
AW killifish larvae may genetically inherit adaptations that prevent cardiac abnormalities observed in non-PAH-adapted populations (Clark et al. 2014; Meyer and Di Giulio 2003; Ownby et al. 2002; Wills et al. 2010; Clark et al. 2013), and Wills et al. (2010) reported that 9-month-old AW killifish appear to inherit resistance to hepatic lesions caused by benzo[a]pyrene (BaP); however, few laboratory studies have analyzed the toxic effects of PAH mixtures. Use of sediment extract from the AW site coupled with controlled laboratory experiments on progeny of differing killifish populations provides environmentally relevant approaches to examine the toxicity of PAH mixtures.
Previous research on killifish primarily involved adults of unknown age captured at specific sites (Cooper, Vogelbein, and Van Veld 1999; Frederick, Van Veld, and Rice 2007; Jung et al. 2011; Pinkney and Harshbarger 2006; Schmalz, Hernandez, and Weis 2002; Stine et al. 2004; Vogelbein et al. 1999; Vogelbein et al. 1990; Vogelbein and Unger 2006); and after spawning captured adults, embryo progeny were analyzed (Clark et al. 2014; Meyer and Di Giulio 2003; Ownby et al. 2002; Wills et al. 2010; Weis and Weis 1989; Clark et al. 2013). In field-collected AW killifish, tumors were found in 33% of adults (Vogelbein et al. 1990) but could not be exclusively linked to PAH exposure, since the animals were taken directly from the Elizabeth River where they were likely exposed to a complex mixture of creosote and industrial wastes. Such reports have been compared to other sites such as Lake Erie where PAHs were associated with effluents from a steel plant and associated coking facility (Baumann, Harshbarger, and Hartman 1990).
The AW site has undergone remediation by the U.S. Environmental Protection Agency (U.S. EPA 2002) that has cleared the site of sediments, covered it with new soils, and separated it from the Elizabeth River by an impermeable wall barrier (Di Giulio and Clark 2015). Strategically, prior to these actions, sediment samples and killifish were collected for laboratory studies. Our study focuses on a juvenile F1 generation of these fish, addressing a current gap in the literature for this life stage. This life stage is important not only for body growth and development but, given the maintenance of a liver to body weight ratio, there is a potential for populations of mutated hepatocytes to undergo uncontrolled cell proliferation (Ames, Shigenaga, and Gold 1993), leading to advanced steps in the tumorigenic process.
The killifish is an ideal organism for this analysis because it is currently among the few species of fish that both exhibit pollution-induced hepatic lesions in the wild and can be reared in the laboratory (Vogelbein and Unger 2006) where the full complement of modern tools is available (Burnett et al. 2007). Due to the relative nonmigratory nature of killifish (Vogelbein et al. 1990; Meyer and Di Giulio 2003; Pinkney and Harshbarger 2006; Vogelbein and Unger 2006), the identification of carcinogenic precursor lesions in juvenile PAH–exposed killifish can be used to draw conclusions about the condition of the animals’ native environment as well as their susceptibility or resistance to chronic disease (Wills et al. 2010; Vogelbein et al. 1990; Vogelbein and Unger 2006).
Our study focused on the occurrence of hepatic alterations among PAH-adapted and nonadapted juvenile killifish after embryonic exposure to Elizabeth River sediment extract (ERSE), with the goal of linking early life stage exposure to later life consequences.
Materials and Methods
Site Characteristics and Sediment Extraction
Sediment samples from AWI Inc. (36°48′ 27.2″N, 76°17′ 38.1″W) were collected in November 2011, before remediation of the site. Sample preparation and chemical analysis of ERSE were described by Fang et al. (2014). Previous research suggests that pore water (ERSE), a mixture of water and suspended solids, is a more accurate representation of environmentally relevant compounds for aquatic species than whole sediment (Fang et al. 2014). For fish exposures, ERSE was diluted to 0.1% and 1.0%, corresponding to 5.04 and 50.45 μg/L of total PAHs, respectively (Table S1).
Fish Collection and Exposure
Adult killifish were collected from AW and KC reference site (37°18′ 6.2″ N, 76°24′ 58.9″ W; Figure 1) in Virginia (April–September 2012–2013) using wire mesh minnow traps. They were maintained in labs at Duke University, Durham, North Carolina, in 30- or 40-L tanks in a flow-through system with artificial seawater (15 ppt, Instant Ocean, Foster and Smith, Rhinelander, WI) at 25° to 28°C and a 14:10-hr light:dark cycle. Adults were fed ad libitum with pelleted feed (Aquamax® Fingerling Starter 300; PMI Nutritional International, LLC, Brentwood, MO).
The Chesapeake Bay map (A, scale bar 10 miles) includes locations for Atlantic Wood (B, arrow, scale bar 2 miles) and King’s Creek (C, arrow, scale bar 2 miles) killifish collection sites.
In vitro fertilization, as per Brown et al. (2016), produced F1 killifish embryos for this study. At 24 hours post fertlization (hpf), embryos, confirmed to show normal development (Oppenheimer 1937; Armstrong and Child 1965), were exposed to 10 ml of 0% (control), 0.1%, or 1.0% ERSE in 20-ml glass scintillation vials (VWR International, Wheaton WorldWide, Millville, NJ) for a total period of 120 hr and then transferred to Petri dishes lined with absorbent filter paper and maintained in an incubator at 27°C for up to 14 days postfertilization. Next, following filter paper removal, artificial seawater was added and dishes were transferred to an orbital shaker until hatching was complete.
After hatching, larvae (eleutheroembryos) were maintained in 2-L beakers at 27°C in an incubator for 1 week and fed a diet of Artemia nauplii (Brine Shrimp Direct, Aquatic Habitats, Apopka, FL). Next, larvae were evenly distributed, with 3 fish per L, in 10-L tanks among 2 recirculating AHAB systems (Aquatic Habitats) at 28°C on a 14:10-hr light:dark cycle for 5 months grow out. For the initial 2 weeks, larvae were fed Artemia nauplii, after which they were fed Ziegler’s Adult Zebrafish Complete Diet (Aquatic Habitats) and Cyclop-eeze (Argent Chemical Laboratories, Redmond, WA). All care and maintenance were noninvasive and followed a protocol reviewed and approved by the Duke University Institutional Animal Care and Use Committee.
Fixation and Histological Staining
At 5 months of age, killifish were euthanized and fixed in 10% neutral buffered formalin (VWR). Fixative entry was ensured by a midline incision through the ventral body wall extending from anus to near pectoral girdle. Next, a disposable transfer pipette with extended fine tip was used to introduce fixative to all abdominal organs, after which the pipette was introduced to the buccal cavity and fixative flushed into the pharynx and proximal digestive tract. Processing, embedment, sectioning, and staining were completed at the Histology Laboratory, Department of Population, Health and Pathobiology, North Carolina State University College of Veterinary Medicine, Raleigh. Fish were decalcified in 10% formic acid for 48 hr, washed, and placed in an automated tissue processor (Thermo Shandon PathCentre, Grand Island, NY) for ethanol dehydration followed by clearing and embedment in paraffin, with each individual fish oriented in left lateral recumbency. A Leica 2135 rotary microtome (Leica Biosystems Inc., Buffalo Grove, IL) was used to section individuals. Planes of section were from the retina of the left eye to the middle of the contralateral eye. Step sections were made until the liver was encountered, then 5-μm thick serial sections were made through the entire organ. Slides were routinely stained by hematoxylin and eosin (H&E). Based on the body axis of F. heteroclitus, parasagittal sections in this orientation provided thorough representations of the liver, adjacent extrahepatic biliary system, and pancreas. A total of 41 progeny from AW parents and 40 from KC parents were included.
Initial Qualitative Screening, Slide Selection, and Blinding
All slides were screened with a 2× objective lens using a Nikon Eclipse E600 compound microscope (Nikon Instruments Inc., Melville, NY) for sections along or near the midline that provided ample liver area. One slide (7 sections) per fish was selected for further analysis. Gonads were visible and yielded sex of individuals in all but 6 fish (Table S3). Selected slides were then randomized and blind labeled by a second party placing opaque stickers numbered 1 to 81 over slide labels, which were maintained until all evaluations were completed.
Liver Evaluation and Image Processing
On each slide, 3 nonoverlapping sections (at least 10 μm apart) were selected, and within each, 3 nonoverlapping fields of the liver (2 for smaller individuals) were imaged with a 20× objective lens. Microscopic fields were restricted to the following liver regions: (1) rostral apex, (2) dorsal, adjacent to the gut, and (3) adjacent to the ventral body wall. This subsampling methodology allowed for later measurements of area fraction to have reduced sampling and systematic biases (Howard and Reed 2004). Images were captured using a Nikon Eclipse E600 microscope with a Nikon DMX1200 digital camera and NIS-elements 3.20.01 software (Nikon Instruments Inc.). Across the 81 slides, 243 sections were analyzed and 699 images were generated.
In addition, whole livers on each of the selected sections were evaluated semiquantitatively for the occurrence (presence/absence) of lesions (basophilic foci, clear cell foci, mixed foci, and adenomas). In addition to these counts, qualitative observations were recorded for microvesicular vacuolation, apparent lipid accumulation, and staining properties of the liver. Foci and adenoma identifications were based on Vogelbein et al. (1990), Boorman et al. (1997), Vethaak and Wester (1996), and Blazer et al. (2006). Microvesicular vacuolation identification was based on Tandra et al. (2011), and areas of lymphocyte accumulation were compared to images and descriptions in Boorman et al. (1997). As in other histopathological studies, the identification of lesions can be challenging due to stain variation, sex differences, and fixation inconsistencies (Boorman et al. 1997), and as such, normal parenchyma was diagnosed based on the staining within each individual liver.
In conjunction with these counts, all livers were scored using a severity index for degree of vacuolation based on a scale from 0 to 4 (Table S2) modified from Köhler, Deisemann, and Lauritzen (1992) and Shackelford et al. (2002). The ethanol dehydration process extracted lipids, leaving vacuoles with smooth margins as apparent sites of former lipid. Therefore, lipid vacuoles were identified based on their shape (circular) and precise margins (van Dyk, Pieterse, and van Vuren 2007; Wills et al. 2010; Wolf et al. 2015; Wolf and Wolfe 2005).
To supplement severity scoring, percent area of vacuolation for each image was measured in ImageJ 1.48 (Rasband 2014) using the color deconvolution plugin set to the predefined H&E 2 vectors (Landini 2015; Ruifrok and Johnston 2001). If computer-generated percent area of vacuolation did not correspond to recorded assessments (Table S2), then scores were determined based on visual evaluation. Additional details on this method are provided in Supplementary Materials.
To calculate percent area of the liver occupied by alterations, lesions were traced in ImageJ. Because the structures of interest were within the hepatocellular compartment of the parenchyma, removal of other structures/components was necessary. For this, area occupied by hepatopancreas, blood vessels and bile ducts ≥ 1.25-μm diameter, and sectioning artifacts were measured; smaller ducts and vessels were disregarded (Fournie and Vogelbein 1994). These measurements were averaged across sections on each slide and subtracted from the total image area to generate total parenchymal area. Percent area of alteration(s) was computed by comparing average lesion area to parenchymal area.
Statistical Analysis
After slides were unblinded, all statistical tests were run in R (R Core Team 2015) and significance was declared if p ≤ .05. Count data were tested for normality with a Shapiro–Wilk test and were then square root transformed. These transformed data passed Bartlett’s test for equality of variances and allowed us to use a nested analysis of variance (ANOVA) with a post hoc Tukey test.
Data comparing basophilic foci counts and total alterations to the sex of each fish were also square root transformed, passed Bartlett’s test, and used for 1-way ANOVA with a post hoc Tukey test (Table S3). In this analysis, 6 individuals were excluded because the sex of these fish was unclear due to inadequate gonadal tissue in the sections. In addition, numbers of individuals with alterations were compared within and between AW and KC populations using a χ2 goodness-of-fit test. Lastly, severity scores were compared within and between AW and KC populations using a Kruskal–Wallis test and compared to occurrence of microvesicular vacuolation using a Spearman rank correlation coefficient.
One AW control individual displayed numerous (N = 47) eosinophilic foci, a noteworthy phenotype. These foci were irregularly shaped with sharp borders, had cleft-like spaces between enlarged hepatocytes, contained binucleated hepatocytes, but had no mitotic figures (Vogelbein et al. 1990; Okihiro and Hinton 2000; Boorman et al. 1997; Blazer et al. 2006; Braunbeck et al. 1992; Figure S2). However, while this single occurrence may indicate that AW killifish are not fully protected from liver disease, the extreme number of foci in this individual categorized it as an outlier in the data set, and therefore it was removed from all statistical analyses.
Results
Within 2 months after ERSE exposure, AW fish in all groups, including the control, had higher mortality relative to KC fish, and only KC fish exposed to 1.0% ERSE had significantly higher mortality relative to other KC groups (Brown et al. 2016). By 5 months, no differences in mortality between any exposure groups were seen (Brown et al. 2016).
Histological evaluation of control and ERSE-exposed KC and AW livers yielded the following hepatic alterations: basophilic foci, clear cell foci, mixed foci, adenomas, and lymphocyte aggregates (Figure 2). Uniform staining characterized normal parenchyma (Figure 2A). Classifications of basophilic foci (Figure 2B and D), clear cell foci (Figure 2C), and adenomas (Figure 2E) were consistent with descriptions from Vogelbein et al. (1990), Boorman et al. (1997), and Vethaak and Wester (1996). Nonneoplastic lesions, predominantly clear cell and basophilic foci, were the most commonly encountered alterations (Table 1, Figure 3B, Figure S1). Slightly more than half of adenomas (57%) were classified as clear cell lesions as shown in Figure 2E. Additionally, one basophilic adenoma was identified due to its sharp border and dark staining.
Morphology of liver and hepatocellular alterations in Fundulus heteroclitus. (A) Normal parenchyma, note uniformity of hepatocytes and their staining. Altered liver: (B) Basophilic focus (bf); v, sections through veins. Due to the absence of overt hepatopancreas, venous profiles cannot be identified as portal (afferent) or hepatic (efferent). (C) Clear cell focus; arrows point to border of lesion; v, vein. (D) Mixed focus composed of bf and microvesicular vacuolation (m) surrounding the focus. (E) Clear cell adenomas (a1 and a2) are separated by a band of normal appearing tissue. (F) Lymphocyte aggregate (L) in hepatic parenchyma near bile ductules (bd); s, sinusoid; venous profile at upper left of field shows portion of exocrine pancreatic tissue (p), likely indicating portal vein. All scale bars 10 μm. 20×, H&E.
Summary of Raw Counts of Alterations and Transformed Averages of Lesions per Fish in Each Exposure Group.
Note. Gray line denotes split cells. The top values of which represent raw counts and bottom values represent transformed means. Different superscript letters indicate statistical differences in each row. Nested analysis of variance with post hoc Tukey test (p ≤ .05). ERSE = Elizabeth River sediment extract.
Histogram representing total alterations (A) and total foci (B) in King’s Creek (gray bars) and Atlantic Wood (black bars) populations across all Elizabeth River sediment extract treatment groups. Bars represent means of transformed data with error bars representing standard error of the mean. Different letters indicate statistical differences. Nested analysis of variance with post hoc Tukey test (p ≤ .05).
Overall, AW fish (control and exposed) had significantly more total alterations (p = .042), total foci (p = .037), and clear cell foci (p = .035) than did KC fish (control and exposed). More specifically, AW control fish had significantly more total alterations (p = .031) and total foci (p = .027) than did KC control individuals (Figure 3). The 0.1% ERSE–exposed KC fish had significantly more total alterations (p < .001), total foci (p = .001), and basophilic foci (p = .014) than did KC control individuals (Table 1, Figure 3, Figure S1A). The 1.0% ERSE–exposed AW fish had significantly more clear cell foci than the 0.1% exposed AW individuals (p = .023; Table 1, Figure S1B). Interestingly, lymphocyte aggregates were restricted to 0.1% ERSE–exposed KC fish, and nearly 27% of individuals in this group showed this condition (Figure 2F, Table 1).
Individuals in each control and treatment group were analyzed for lesion prevalence (as percentage of individuals in each treatment displaying at least 1 alteration; Table 2) and lesion area. Despite robust testing, no significant differences were observed, but trends were noted with respect to basophilic and clear cell foci in each population (Table 2) that were similar to that of count data above. For example, ERSE exposure increased the number of individuals with basophilic foci in a dose-dependent manner in the KC population. However, a near doubling of individuals in the AW control contained basophilic foci and exposure to ERSE did not appreciably affect this number. In addition, out of the 36 occurrences of microvesicular vacuolation, 25 (69%) were observed in fish that scored a 2, 3, or 4 on the vacuolation severity index. The correlation between these 2 observations was not determined to be statistically significant but could also be indicative of a trend.
Hepatic Lesion Prevalence. Percentages of Individuals Exhibiting a Specific Alteration Calculated as the Number of Individuals with at Least One Occurrence of that Alteration within a Treatment.
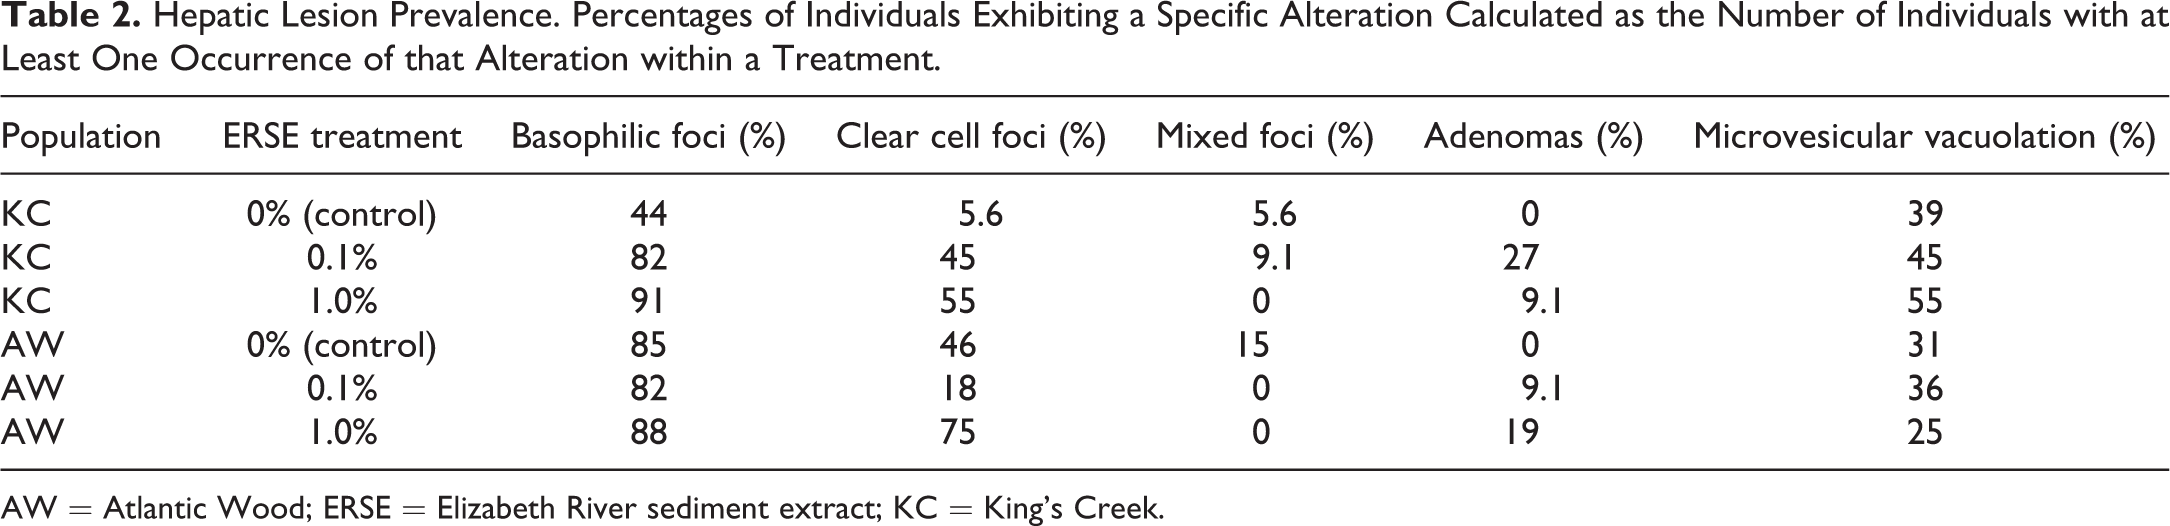
AW = Atlantic Wood; ERSE = Elizabeth River sediment extract; KC = King’s Creek.
Regarding the 80 fish assessed in the vacuolation severity index (Table S2), the quantitative ImageJ methodology matched severity scores in 44 (55%) of fish examined. The remaining individuals were evaluated semiqualitatively to assign a severity score (see additional discussion in Supplementary Materials). Comparisons of assigned severity scores did not yield statistically significant differences. Based on the relative compatibility of the quantitative, semiquantitative, and qualitative methods for evaluating vacuolation, we believe that lipids were identified to the best of our ability given that a lipid-specific stain was not performed.
Discussion
PAH adaptation in F. heteroclitus from creosote-contaminated areas of the Elizabeth River is a currently evolving area of research. Early studies by Vogelbein et al. (1990) demonstrated that field-collected, creosote-exposed killifish developed 93% more hepatocellular lesions than reference site fish. Work on AW embryos suggests that offspring may be resistant to the effects of PAHs (Clark et al. 2014; Meyer and Di Giulio 2003; Ownby et al. 2002; Wills et al. 2010; Clark et al. 2013), but posthatch stages do not appear to reflect this protection (Vogelbein and Unger 2006). Although Wills et al. (2010) reported that 9-month-old fish may be protected from hepatic lesion development, their study was based on killifish exposed to only BaP, whereas our study exposed fish to contaminated sediment extract, which contained a mixture of PAHs and other compounds (Fang et al. 2014).
Our use of sediment extract as opposed to single PAHs may partially explain the differences we observed. Similarly, Braunbeck (1998) found that exposing zebrafish to a mixture of 3,4-dichloroaniline and lindane induced different hepatocellular alterations compared to individual exposures. Our study supports previous findings from Vogelbein et al. (1990), Pinkney and Harshbarger (2006), Schmalz, Hernandez, and Weis (2002), Vogelbein and Unger (2006), and Wills et al. (2010) confirming that PAH exposure induces hepatic lesions in killifish. As we expected, ERSE exposure induced hepatic lesion development in KC fish, and significant differences were observed between control and exposed populations for lesion prevalence. PAH-adapted killifish from the AW site were able to pass these features to their offspring (Clark et al. 2014; Meyer and Di Giulio 2003; Ownby et al. 2002; Wills et al. 2010), yet our study found somewhat different results. Our results support a summary from Weis and Weis (1989) on the trade-offs of pollution tolerance and stress. They reported that pollution-adapted killifish began life as tolerant embryos, but when adapted fish that had been exposed to methylmercury and inorganic mercury as embryos were evaluated as adults, they showed more signs of stress (slower regeneration rate, reduced feeding, etc.) compared to reference killifish (Weis and Weis 1989). Our findings agree that the AW adaptation may protect the fish until sexual maturity, but our results also suggest that this protection from liver disease may not be conferred to later life stages. Furthermore, AW control individuals appeared different from KC control (i.e., more alterations in the former than the latter). Taken together, AW killifish may not be completely protected from the development of hepatic lesions, and the protection related to the heart may not extend to the liver. As Weis and Weis (1989) discuss, this is evolutionarily logical because acute effects—such as cardiac abnormalities—can drive adaptations at a population level whereas chronic conditions such as liver neoplasia are not often associated with population-wide genetic changes.
Meyer and Di Giulio (2003) found that F1 AW larvae showed reduced survivorship under clean laboratory conditions compared to offspring of reference site individuals. These findings suggest that pollution-adapted fish may undergo a “reverse” selection when grown in the laboratory (i.e., removed from a polluted environment; Meyer and Di Giulio 2003). Additionally, our use of a single exposure may not be sufficient to result in hepatic tumor formation. Accordingly, laboratory studies of longer duration and repeated exposures may be needed for us to determine whether tumors result from ERSE exposure. Continued field studies should allow us to determine over time, whether the recent remediation of the AW site will affect tumor abundance in neighboring native killifish.
Wills et al. (2010) showed that lesion incidence in killifish increased with increasing concentrations of BaP—a potent carcinogenic PAH. Our data support this and suggest that exposure to ERSE was related to higher hepatic lesion prevalence in the KC population. Such was not the case in the AW population, whose rate of alterations remained fairly constant across all treatment groups. In our study, differences between KC 0.1% ERSE–exposed fish and KC control were most pronounced in terms of lesion development. The 0.1%-exposed KC population was the only cohort that showed all alterations and the only group to have lymphocyte aggregates, indicating that it could be the most adversely affected group in our study. Because no other groups showed these aggregates, protection/alteration may involve the immune system. While this is potentially of importance, it remains conjecture at this point. Perhaps more metabolic transformation of PAHs occurred among the 0.1% ERSE–exposed KC population. With more host metabolism, procarcinogens in PAHs could have been activated to carcinogenic forms. PAH metabolites could be one of the main drivers of cancer (Gupta 2012; Stalker et al. 1991; Aas et al. 2001), resulting in more hepatocellular changes including neoplastic alterations (Hinton et al. 2008). Likewise, Hendricks et al. (1985) found increased hepatocellular alterations, specifically basophilic foci and carcinomas, in rainbow trout (Salmo gairdneri) exposed to BaP by diet or intraperitoneal injection. The lack of carcinomas in our study was not surprising given the age of the fish, for advanced neoplastic lesions are rarely observed in young individuals (Wills et al. 2010). During the initial screening process, we noted that numerous females showed advanced stages of oocyte development, but other individuals had not yet achieved sexual maturation. At 5 months of age, some individuals are juveniles while others are young adults. Although not quantified, the observation that numerous 5-month-old killifish were sexually mature suggests that PAH adaptation may allow the organism to reach sexual maturity and reproduce, but the fish is highly prone to developing liver disease later in life. As such, this adaptation may not be sustainable for the life of the organism.
Although exposed KC fish developed more basophilic foci, no advanced neoplastic lesions such as carcinomas of liver or pancreas were observed in our study. It is possible that these advanced lesions will occur in some older fish or that single early life exposure is not enough of a perturbation to result in appreciable tumor prevalence. Foci and adenomas like we observed are known to play important roles in the pathogenesis of teleost liver tumors. Work by Vethaak and Wester (1996) on flounder (Platichthys flesus) from a polluted Dutch estuary found that a decrease in foci diameter corresponded to an increase in neoplasm diameter; furthermore, foci prevalence decreased with age while neoplasm prevalence increased. These findings suggest that, over time, foci develop into neoplasms (Vethaak and Wester 1996). While very interesting, similarities to Vethaak and Wester (1996) will have to await our evaluation of individuals older than 5 months of age. However, our findings with individuals of known origin and age will be important. Will the lesions seen at 5 months develop into overt liver neoplasms? To address this question, our observation period in laboratory studies will need to be extended to give us a better understanding of host response along the continuum between early life exposure and later life effects.
Throughout the course of our study, attention was drawn to clear cell foci with vacuolated cells along the border of the liver. This was observed in 17 fish, 13 of which were exposed to ERSE. With the large number of individuals in our study, special stains were not possible, but our experience in processing killifish livers employing osmium tetroxide fixation helped to illustrate the size, shape, and abundance of lipid in Fundulus hepatocytes (Blickley 2010). Vacuoles were also compared to the work by Wills et al. (2010) and van Dyk, Pieterse, and van Vuren (2007) in paraffin-embedded livers processed by graded ethanol dehydration that did not include frozen sections and special fat stains. There, putative lipid-storing cells were similarly identified based on empty vacuole characteristics such as round, spherical shape, and sharp borders (van Dyk, Pieterse, and van Vuren 2007; Wills et al. 2010; Wolf et al. 2015; Wolf and Wolfe 2005). Vacuolated cells of clear cell foci in our evaluation did not appear to fit the description of fatty cysts from Boorman et al. (1997). Our observations could represent hepatocytes that have lost volume regulatory control and are retaining large amounts of fluids in cytoplasmic spaces (i.e., endoplasmic reticulum). A certain degree of lipid accumulation appears to be normal for killifish, and additional descriptions of nonalcoholic fatty liver disease versus lipid storage in these teleosts are needed for further differentiation.
By storing PAHs in lipid droplets, animals facilitate sequestration of harmful chemicals (Gupta 2012). If the PAH is catabolized, it becomes metabolically available for the organism, which can lead to lesion development (Gupta 2012). Au (2004) cites several examples of PAH exposure increasing hepatocellular lipid content in fish. Schmalz, Hernandez, and Weis (2002) found that killifish in a PAH-contaminated environment had more than twice the amount of lipid as a nonadapted reference population, but our study found no correlation between lipid content and ERSE exposure. In their overview of toxicity indicators of fish liver, Wolf and Wolfe (2005) noted that the lipid content of laboratory reared flounder (Paralichthys olivaceus) decreased dramatically after return to the wild, possibly due to artificial diet and/or decreased physical activity under laboratory conditions. Similarly, liver lipid content in killifish of our study may have increased due to laboratory conditions.
The improved resolution provided by glycol methacrylate embedment and/or transmission electron microscopy in future studies could address cellular alterations that may be confused as lipid. For example, Howarth et al. (2010) used these methods to show enlarged and damaged hepatocyte mitochondria and small bile ductular alterations that could be considered as lipid vacuoles in standard H&E survey morphology. Du et al. (2015) addressed BaP toxicity mechanistically and showed it to affect mitochondrial function in adult KC killifish compared to AW. They showed that BaP disrupted mitochondrial membrane potential and ion flow (Du et al. 2015), and they posited that excess water may be crossing altered membranes and accumulating within organelles, causing them to appear as cytoplasmic vacuoles in light microscopic preparations.
Although the microvesicular vacuolation we observed resembles steatosis, additional staining and resolution are needed to resolve the differences between these phenotypes. In mammals, mitochondrial dysfunction has been linked to nonalcoholic steatohepatitis and drug-induced liver injury (Vickers 2009; Pessayre 2007). Köhler, Deisemann, and Lauritzen (1992) suggested that steatosis—fatty liver disease—can be a precursor for the development of basophilic and clear cell foci, and there is a correlation between microvesicular steatosis and markers of cellular injury including “megamitochondria,” advanced fibrosis and ballooning (Tandra et al. 2011). Although we did not explicitly identify these markers, we observed microvesicular vacuolation to contrast with neighboring parenchyma and noted that some of the empty vacuoles could be distended mitochondria. Our observation of microvesicular vacuolation across all populations suggests that AW and KC killifish may develop metabolic diseases whether or not they are exposed to ERSE. More definitive analysis will be needed to address similarities and differences with respect to PAH toxicity, genetic adaptation and metabolic alteration emanating from exposure to multiple agents in sediment such as those in Cooper, Vogelbein, and Van Veld (1999).
In summary, by examining the response of juvenile killifish to ERSE, our study provides new insight on liver alterations in this life stage and suggests that PAH-adapted killifish may not be protected from liver disease. Although the AW adaptation may promote embryo survival, the health of the organism in later stages could be negatively affected. The AW adaptation also seems to be highly dependent on the precise components of the pollutant mixture (i.e., ERSE). AW killifish may be protected from certain PAHs while exposure to multiple compounds does not seem to protect fish from deleterious effects. PAH adaptation is known to have a strong genetic component (Meyer and Di Giulio 2003; Clark et al. 2014; Ownby et al. 2002; Wills et al. 2010; Clark et al. 2013), but our study demonstrates that environmental aspects should also be considered.
Future work will include evaluations of the immune system, expression of genes at the juvenile life stage, effects of sex and reproductive status of the individual, and a detailed histopathological evaluation of other organs because studies to date have focused on heart, large veins, and the liver. In addition, effects of repeated or longer term exposures on the rate of tumorigenesis could elucidate important environmental factors. Finally, future studies could provide more insights on the regulation of genetic adaptations as well as the long- and short-term effects of PAH exposure on the health and survival of aquatic organisms.
Footnotes
Acknowledgments
We would like to thank the Analytical Chemistry Core at Duke University, specifically Ellen Cooper, for their assistance with ERSE characterization. Any findings, conclusions, opinions, and recommendations are those of the authors and do not necessarily reflect the view of the NIH.
Author Contribution
All authors (AR, MC, DB, DH, RD) contributed to conception or design; data acquisition, analysis, or interpretation; drafting the manuscript; and critically revising the manuscript. All authors gave final approval and agreed to be accountable for all aspects of work in ensuring that questions relating to the accuracy or integrity of any part of the work are appropriately investigated and resolved.
Declaration of Conflicting Interests
The author(s) declared no potential conflicts of interest with respect to the research, authorship, and/or publication of this article.
Funding
The author(s) disclosed receipt of the following financial support for the research, authorship, and/or publication of this article: This work was funded by the NIH Superfund Research Center (NIEHS P42-ES010356) and completed as part of Center-supported research for undergraduates program.
References
Supplementary Material
Please find the following supplemental material available below.
For Open Access articles published under a Creative Commons License, all supplemental material carries the same license as the article it is associated with.
For non-Open Access articles published, all supplemental material carries a non-exclusive license, and permission requests for re-use of supplemental material or any part of supplemental material shall be sent directly to the copyright owner as specified in the copyright notice associated with the article.