
Abstract
The objective of this study was to determine the effects of the phytoestrogen genistein (GEN) on the time of onset and/or the incidence of type 1 diabetes (T1D) in female nonobese diabetic (NOD) mice, when administered GEN by gavage once every day for up to 180 days. Five groups of mice (approximately 24 animals/group; 6–7 weeks of age) were included: naive control, vehicle control (25 mM Na2CO3 in water), and 3 GEN treatment groups (2 mg/kg, 6 mg/kg, and 20 mg/kg). Mice were maintained on a soy- and alfalfa-free diet (5K96) during the study and were monitored for blood glucose changes every week. When compared to the vehicle control, exposure to 2-mg/kg GEN produced significant decreases ranging from 55 to 79% in the total incidences of diabetes (blood glucose ≥ 250 mg/dl) and severe diabetes (blood glucose ≥ 400 mg/dl) starting at week 14 of the study. However, during the later stages of the study (i.e., after week 23), the 2-mg/kg dose had no effect on disease incidence. In animals treated with 6-mg/kg and 20-mg/kg GEN, significant decreases in the total incidence of diabetes were observed starting at week 16, while the incidence of severe diabetes was significantly decreased with the changes being observed initially at weeks 18 and 17 for the 6-mg/kg and 20-mg/kg GEN treatment groups, respectively. Several lines of evidence, including histopathological analysis, suggested that GEN protected the pancreas from autoimmune destruction. However, this protective effect of GEN was absent when female NOD mice were maintained on NTP-2000 rodent diet, which contained 5% soybean meal and 7.5% alfalfa meal (the total concentrations of phytoestrogens ranged between 95 and 134 mg/kg). In summary, oral dosing of GEN reduced the incidence and increased the time to onset of T1D in female NOD mice but only when fed a soy- and alfalfa-free diet.
Introduction
The incidence of type 1 diabetes (T1D) has been increasing globally at a rate of approximately 3% per year since the 1960s (Onkamo et al. 1999; Pitkäniemi et al. 2004), and it varies in different parts of the world, with high figures in the Nordic countries (∼30 cases/year/100,000 individuals) and the opposite in the countries of East Asia such as China and Japan with ∼1 case/year/100,000 individuals (Kitts et al. 1997; Frisk et al. 2008). These geographical differences in T1D incidence may be related to food consumption (Frisk et al. 2008), as large quantities of soy products are widely used in traditional Asian diets, which are typically low in fat. Soy consumption and reduced fat intake have been linked to the low incidences of breast cancer in Asian women (Wu et al. 2008).
T1D is mainly caused by autoimmune destruction of the pancreatic insulin producing β islet cells of Langerhans (Gepts 1965). Islets of Langerhans have a central core of β cells surrounded by a mantle of α, δ, and F cells or pancreatic polypeptide producing cells (PP cells). The α cells produce glucagon, β cells produce insulin, δ cells secrete gastrin and somatostatin, and F cells produce pancreatic polypeptide. In addition, diabetic kidney disease (diabetic nephropathy) is a complication that occurs in some people with T1D (Qian et al. 2008), and glomerulosclerosis is known to be a classic change characteristic of the chronic phase of diabetic nephropathy. Glomerulosclerosis is histologically exemplified by proliferation of mesangial cells, expansion of the mesangium, or thickening of the glomerular basement membrane. The other major change characteristic of diabetic nephropathy is renal tubular hypertrophy, which often develops in the early stages of the disease (Ziyadeh 1993; Hostetter 1995).
The isoflavone genistein (GEN; 4,7,4′-trihydroxyisoflavone), which is known to interact with the estrogen receptors (ERs) and act as an antioxidant, is a phytoestrogen found at high levels in soy products (Patisaul and Jefferson 2010). GEN exhibits weak estrogenic activity in the order of 10−2 to 10−3 compared to that of estradiol (Miksicek 1994), but it is present in the body in concentrations (μM) much higher than those of endogenous estrogens (Adlercreutz, Markkanen, and Watanabe 1993). The exact role of estrogen in T1D is unknown. The peak age for T1D onset occurs earlier in girls (8–14) than boys (10–16). This difference suggests that estrogen might be an accelerator of T1D because endocrine and metabolic changes in association with earlier puberty in females affect insulin resistance (Gillespie et al. 2005). However, after age 25, the male to female T1D incidence ratio is approximately 1.5 (Dorman, LaPorte, and Songer 2003). Several studies have demonstrated that hormone therapy in postmenopausal women decreased fasting glucose levels or hemoglobin A1c levels, a test that measures the average blood glucose control for the past 2 to 3 months, and reversed menopause-associated changes in insulin secretion and elimination (Kanaya et al. 2003; Godsland et al. 2004). Codner (2005) has reported that girls with T1D had lower leuprolide (a synthetic analog of gonadotropin-releasing hormone)-stimulated estrogen levels than nondiabetic girls, highlighting a protective role of estrogen in T1D. In addition, exposure to endocrine disrupting chemicals during development has been proposed to cause T1D later in life (U.N. Environment Programme 2013).
It has been suggested that GEN may modulate autoimmune processes in T1D and alter disease outcomes in murine models of diabetes (Choi et al. 2008). The widely used nonobese diabetic (NOD) mouse spontaneously develops autoimmune pancreatitis and, subsequently, diabetes that shares many immunogenetic features with human T1D (Makino et al. 1980; Leiter 1993). NOD mice develop infiltration of macrophages and lymphocytes around pancreatic islets of Langerhans and pancreatic ducts as early as 3 weeks of age (peri-insulitis, periductulitis) with infiltration of islets of Langerhans by macrophages and destruction of β cells (insulitis) by 3 months of age. Females are known to be more susceptible than males with 80% becoming diabetic compared to 20 to 30% of the males by 6 months of age (Anderson and Bluestone 2005). Treatment with estrogen can reduce glucose levels in these mice (Yashida, Da Silva Faria, and Caldeira 2011). We hypothesized that exposure to the common soy phytoestrogen GEN could modulate autoimmune responses in female NOD mice to decrease or delay the development of T1D through an estrogen-related mechanism. Progressive loss of β-cells in T1D can be recognized by the detection of islet autoantibodies (Bingley et al. 1994; Verge et al. 1996). Several autoantibodies can be detected at the onset of T1D, such as islet cell autoantibodies (ICA), anti-insulin autoantibodies (IAA), and autoantibodies against glutamic acid decarboxylase (GAD), and NOD mice share some common islet antigens with human insulin–dependent diabetes mellitus (IDDM; Karounos and Thomas 1990; Quinn et al. 2001). Senescent NOD mice also develop antinuclear autoantibodies (ANA) and other characteristics of nonorgan specific autoimmunity (O’Brien et al. 2006). Thus, an additional goal of this study was to determine whether serum levels of autoantibodies could be an early indicator for onset of T1D in female NOD mice.
Materials and Methods
Study Design
In completing this report, 3 studies were conducted. In the 180-day study, 5 groups of female NOD mice (22–24 animals/group) were included: naive control, vehicle control (25 mM Na2CO3 in water), and 3 GEN treatment groups (2 mg/kg, 6 mg/kg, and 20 mg/kg). GEN was administered by gavage daily for 180 days. In addition to the 180-day study, a 90-day study (8 female NOD mice/group) was conducted to determine the histopathological changes associated with disease onset. In both studies, mice were maintained on a soy- and alfalfa-free diet (5K96, Purina Mills, St. Louis, MO) and tap water ad libitum. The 5K96 diet is based on the NIH-31 formula, except that casein replaces the protein contributed by soy and alfalfa, and soy oil is replaced by corn oil, to preclude other phytoestrogens that might be present. The control diet was assayed for GEN and daidzein, another isoflavone compound, after hydrolysis of conjugates. The concentrations of both GEN and daidzein were found to be below the limit of detection (0.5 ppm; Guo et al. 2002). In the third study, 4 groups of female NOD mice (12 animals/group) were included: vehicle control and 3 GEN treatment groups (2 mg/kg, 6 mg/kg, and 20 mg/kg). The purpose of this study was to determine the effect of NTP-2000 diet on the development of diabetes in female NOD mice. The NTP-2000 diet contains 5% soybean meal and 7.5% alfalfa meal, and the combined levels of daidzein and GEN ranged between 95 and 134 mg/kg feed (Thigpen et al. 1999; Degen et al. 2002).
Animals and GEN Treatment
Female NOD/MrkTac mice were purchased from Taconic Farms (Germantown, NY). Mice were housed under pathogen-free conditions. Upon arrival, the mice were quarantined for at least 7 days prior to commencement of treatment, and they were approximately 7 weeks old at the beginning of the study. Mice were housed 4 per cage in polycarbonate cages with hardwood bedding (Harlan Teklad Laboratory Grade Sani-Chips) and cage covers. The temperature of the animal rooms was kept between 21° and 24°C and the relative humidity between 40 and 70%. The light/dark cycle was maintained on 12-hr intervals. All animal procedures were conducted under an animal protocol approved by the Virginia Commonwealth University Institutional Animal Care and Use Committee. Animals were observed at the time of dosing for any clinical signs, and they were also monitored twice daily for signs of moribundity. Mice were humanely sacrificed if 2 consecutive measurements of ≥600 mg/dl were obtained, due to the high probability of morbidity occurring in such animals. Other special actions taken for care of these diabetes-prone mice included changing cages and water bottles more frequently.
GEN (CAS# 446-72-0; Mol. Wt. 270.24; Product Number: G-6055) was obtained from LC Laboratories (Woburn, MA) and contained >99% GEN. The vehicle control for this study was 25 mM Na2CO3 (Sigma-Aldrich) prepared in sterile water (Guo et al. 2001). The vehicle control animals received the same volume (0.1 ml/10 g of body weight) as the GEN-treated animals. Three concentrations of GEN solution were utilized (0.2, 0.6, and 2 mg/ml), which, when administered at 0.1 ml/10 g of body weight, were equivalent to doses of 2-mg/kg, 6-mg/kg, and 20-mg/kg body weight, respectively. The doses selected for these studies were based on the physiologically relevant concentrations of GEN that have been previously shown to enhance cell-mediated immune responses in mice (Guo et al. 2001).
Measurement of Blood Glucose Levels
Monitoring of glycemic status was initiated prior to the beginning of treatment to ensure that there were no significant differences between groups in blood glucose levels. Thereafter, the animals were monitored for blood glucose changes every week. Blood glucose levels were measured directly from small samples of venous blood by tail nick using an Accu-Chek Diabetes monitoring kit (Roche Diagnostics, Indianapolis, IN). Mice with a serum blood glucose concentration ≥250 mg/dl were considered diabetic, and mice with a serum blood glucose concentration ≥400 mg/dl were classified as severely diabetic (Li, Kaminski, and Fischer 2001).
Histopathological Analysis of Pancreas
On the day of study termination, a necropsy was performed. Mice were weighed and euthanized by anesthetizing with carbon dioxide. Terminal body weights and organ weights were recorded. Histological examination of pancreas and left kidney was performed to evaluate the degree of lesions associated with diabetes and treatments. Tissues were fixed in 10% phosphate-buffered formalin for 24 hr at 4°C. Thick sections of 5 μm were cut from paraffin-embedded blocks, collected onto poly-L-lysine-coated slides, and stained with hematoxylin and eosin (H&E). To better identify and more thoroughly evaluate the pancreatic islet cells at low magnification, an immunohistochemical analysis of formalin-fixed, paraffin-embedded tissue was performed using the Anti-insulin (K36AC10) antibody (Abcam, ab6995, Cambridge, MA; Figure 1A). The tissues were deparaffinized in xylene and rehydrated through graded ethanol. Endogenous peroxidase blocking was done by immersing the sections in 3% H2O2 for 15 min; after which heat-induced epitope retrieval was performed using a Citrate Buffer (Biocare Medical, CA) in a pressure chamber for 5 min at 12°C. The Vectastain Mouse Elite Kit (Vector Laboratories, Burlingame, CA) with included protocol was used as the detection system for this stain. The slides were incubated in mouse anti-insulin at 1:500 for 30 min at room temperature. Staining was visualized using 3-diaminobenzidine (DAB) chromagen (DakoCytomation, Carpenteria, CA), and counterstained with hematoxylin. The slides were dehydrated through graded ethanol, cleared in xylene, and coverslipped. Sections were examined under a bright field microscope and reviewed by board-certified pathologists. Photomicrographs were obtained using an Olympus DP50 camera.
Representative images of treatment and nontreatment-related findings in pancreases from female NOD mice maintained on a soy- and alfalfa-free diet. (A) The evaluation of pancreatic islets and inflammation was supplemented with insulin immunohistochemistry. Insulin immunoperoxidase staining shows brown cytoplasmic staining of islets (black arrows). The darker blue cells surrounding the islets are inflammatory cells (red arrow). (B) Islet with a severity grade of minimal, characterized by few focal infiltrates (1–3 cells thick) of mononuclear cells (primarily lymphocytes with lesser numbers of macrophages, presumptive) at the periphery of the islets, white arrows; (C) Islet with a severity grade of mild, characterized by a more prominent and circumferential cellular infiltrate (>3 cell layers in width) of mononuclear cells with mononuclear cells infiltrating the islets and the presence of hypertrophied islet cells as well as vacuolated/degenerated islet cells. (D) Islet with a severity grade of moderate characterized by a more prominent cellular infiltrate and loss (atrophy) of islet cells. (E) Islet with marked severity grade characterized by islet cell atrophy and histiocytic inflammatory cells (arrow). Severe atrophy and/or complete loss of islets was a feature of end-stage islet disease. (F) Periductulitis and perivasculitis, mild, characterized by an infiltrate composed primarily of lymphocytes, with occasional macrophages, in the periductular and perivascular connective tissue stroma. NOD = nonobese diabetic.
For each animal, 1 section of the left lobe of the pancreas, adjacent to the spleen, was evaluated and all islets within each tissue section were evaluated. A longitudinal horizontal section was taken through the largest area of the pancreas in order to provide a section with the largest cut surface area. Islet inflammation and atrophy were graded on the severity and character of the mononuclear cell infiltrate and changes in the islet cell population. The evaluation of pancreatic islets and inflammation was supplemented with insulin immunohistochemistry (Figure 1A). A minimal grade was characterized by islets with minimal focal infiltrates (1–3 cells thick) of mononuclear cells (primarily lymphocytes with lesser numbers of macrophages) at the periphery of the islets and occasionally evidence of vacuolated/degenerated islet cells (Figure 1B). A mild grade was characterized by islets with a more prominent and circumferential infiltrate (>3 cell layers in width) of mononuclear cells affecting less than 25% of the islets in the section, often with evidence of vacuolated/degenerated islet cells (Figure 1C). A moderate severity grade was characterized by islets with a more prominent or circumferential cellular infiltrate (>3 cell layers in width) of mononuclear cells affecting greater than 50% of the islets in each section, with some evidence of mononuclear cells infiltrating the islets and the presence of vacuolated/degenerated islet cells or loss of islet cells (Figure 1D). Other than lymphocytes, the mononuclear cells infiltrating the islets often had a slightly elongated nucleus with a scant amount of pale cytoplasm. The exact identity of these cells was undetermined although they were presumed to be macrophages or possibly remaining non-β islet cells, that is, α cells, δ cells, or PP cells (Figure 1E). A marked severity grade was characterized by islets that were generally decreased in number and size (atrophied) and often the islets were either totally absent or very rare (1–3 per section of pancreas). Remaining islets were usually composed almost entirely of mononuclear cells with elongated nuclei (Figure 1E). Some islets with marked severity still had prominent lymphocytic/macrophage infiltrate, as did a few surviving islets, but the majority of the islets in the section were atrophied. In some cases, lymphocytes were forming lymphoid follicles with germinal centers. Commonly, pancreases with marked severity, characterized by no or few islets, had very scant inflammatory cell infiltrates (lymphocytes and macrophages) in remaining islets and/or periductular and perivascular infiltrates. It is thought that after complete destruction of islet cells, the inflammation in the pancreas regresses (Detlefsen and Drewes 2009). These pancreases with no or a few atrophied islets were considered to have “end-stage” islet disease.
Periductulitis and perivasculitis were characterized by an infiltrate composed primarily of lymphocytes, with occasional macrophages, in the pancreatic connective tissue stroma around pancreatic ducts (Figure 1F) and blood vessels. Lymphocytes were also noted distending small lymphatics.
No islets were diagnosed when no islets could be found throughout the entire section of pancreas. Rare islets were diagnosed when only 1 to 3 islets were found throughout the entire section of pancreas and were often small in size. Islet hyperplasia was diagnosed when islets occupied approximately ≥10% of the area of a high power (40×) microscopic field (the cell size was normal). Within hyperplastic islets, individual islet cells were often slightly enlarged with enlarged nuclei. Hyperplastic islets were often surrounded and infiltrated by inflammatory cells (lymphocytes with lesser numbers of macrophages), which somewhat obscured islet borders.
Histopathological Analysis of Kidney
Similar to pancreas, histological examination of left kidney was performed to evaluate the degree of lesions associated with diabetes and treatments. Renal tubular hypertrophy was characterized by dilated tubules lined by enlarged tubular epithelial cells. The cells had increased eosinophilic cytoplasm and were generally 2 times larger than the typical proximal convoluted tubular epithelial cells. The cells maintained normal orientation in the tubule, and hyperplasia was not noted. Proteinaceous casts were characterized by generally 1 to several tubules containing dense eosinophilic homogeneous material (protein) with mild flattening of the surrounding tubular epithelium. It was noted that cast formation was very minimal, that is, an entire kidney section contained only 1 to a few casts. Tubular basophilia (regeneration) was characterized by 1 to several small clusters of tubules with sparse basophilic cytoplasm. Glomerular deposits were characterized by round globular deposits of homogeneous eosinophilic material in glomerular tufts. Sometimes the deposits appeared to be within vessels, while other times the location could not be determined due to deposits effacing the architecture of the glomerulus. Perivascular lymphocytic/plasmacytic infiltrates were noted primarily around vessels in the corticomedullary junction.
Serum Isolation
Blood was obtained via the submandibular vein for ICA determination on day 28 of GEN exposure from mice that were on the 180-day study. In all other studies, blood was obtained via cardiac puncture at terminal sacrifice. Serum samples were isolated and stored individually at −70°C until use.
Enzyme-linked Immunosorbent Assay (ELISA) for Insulin
Serum insulin levels were measured using the Ultra Sensitive Mouse Insulin ELISA Kit (Crystal Chem, Inc., Downers Grove, IL) according to kit instructions. Briefly, 5 μl of sera (or insulin standard) were mixed with 95 μl of sample diluent in insulin antibody–coated microplate wells, and the plates were incubated for 2 hr at 4°C. Following 5× washes, 100 μl of anti-insulin enzyme conjugate were added per well, and the plates were incubated for 30 min at room temperature. Following 7× washes, 100 μl of enzyme substrate solution were added per well, and the plates were incubated for 40 min at room temperature while avoiding exposure to light. The enzyme reaction was stopped by adding 100 μl of stop solution per well, and optical densities (ODs) were measured at 450 nm and 630 nm. Insulin concentrations were calculated using the standard curve generated.
ELISA for IAA, ICA, ANA, and Anti-GAD Autoantibodies
NOD mice share some common islet antigens with human IDDM (Karounos and Thomas 1990). Therefore, kits for measurements of human ANA, IAA, ICA, and autoantibodies against GAD were adapted to detect autoantibodies in mice by changing the secondary (detector) antibody. Sera were tested for ANA using an ELISA kit (BINDAZYME ANA Screen) obtained from The Binding Site (San Diego, CA) as described by Leffel et al. (2003). For the detection of circulating ICA, IAA, and autoantibodies against GAD, qualitative ELISA kits were obtained from Biomerica, Inc. (Newport Beach, CA). Precoated plates (supplied in the kits) contained the corresponding purified antigens of interest. Following the establishment of the linear region of dilutions, sera were diluted at 1:4 for ICA ELISA. For all other ELISAs, sera were diluted starting at 1:4 with the sample diluent provided in the kit and samples were added to the plate in a volume of 100 μl/well. One well, containing diluent with no mouse serum, provided a background control. After incubation, plates were washed and the secondary antibody, horseradish peroxidase–conjugated goat anti-mouse IgG (Southern BioTech) was added to the wells (100 μl/well at a 1:2000 dilution). After incubation and washing, 3,3′,5,5′-tetramethylbenzidine substrate was added and incubated in the dark for 30 min. Stop solution (2N H2SO4) was added and the absorbance was read at 450 nm.
Determination of Serum Creatinine
The levels of serum creatinine were determined using the Creatinine Assay Kit obtained from Cayman Chemical (Ann Arbor, MI), according to kit instructions.
Statistical Analysis
To determine the type of analysis to be used, the Bartlett’s test for homogeneity of variances was conducted. Homogenous data were analyzed using a one-way analysis of variance, and the Dunnett’s test was used to determine differences between the vehicle control and experimental groups. Nonhomogenous data were analyzed using a nonparametric analysis of variance and the Wilcoxon rank-sum test to determine pairwise differences between the vehicle control group and exposure groups. The Jonckheere’s trend test was used to test for dose-related trends across the vehicle and the GEN exposure groups. A two-tailed Student’s t-test was utilized to compare the naive and vehicle groups. For diabetes incidence and histopathological findings, the one-tailed Fisher’s exact test was used. A group was considered significantly different from the control group at p ≤ .05. Correlation analysis of linear fit for Figure 4 was conducted using JMP Pro 10 software. Correlations were classified as “strong” for R 2 values >.8.
Results
Clinical observations, gross pathology, body weight, and organ weights in female NOD mice fed a soy- and alfalfa-free diet. All animals receiving GEN treatment tolerated exposure well and showed no overt signs of toxicity. Diabetic mice might have had more urine output because there were more frequent saturations of the bedding in their cages. In addition, water bottles needed to be refilled more frequently for diabetic mice, suggesting increased water consumption. Animals euthanized at the end of the study or during the study due to high blood glucose levels, indicating severe diabetes, were examined for any gross pathological lesions, and none were noted.
GEN treatment had no effects on animal survival; however, some mice (6–18/group) from each group were humanely euthanized during the study due to high blood glucose levels. When compared to the naive group, treatment with vehicle had no significant effects on the terminal body or organ weights for the animals in the 180-day study excluding early euthanized mice. Moreover, no differences were observed between the GEN-exposed mice and the vehicle controls with respect to terminal body or organ weights (either absolute or relative weight; data not shown). The mean starting weight of the vehicle-exposed mice was 20.2 g and the mean ending weight for the vehicle-exposed mice was 23.5 g. Mice gained weight normally in the first 40 to 45 days of the study, after which the mean body weight began to plateau. When we combined data from early deaths with data from later deaths on each organ individually (Table 1), there was a significant increasing trend for the average combined body weight, but no dose group was significantly different from the vehicle control group. GEN treatment resulted in a significant decrease in the average combined relative weights of the liver at the 20-mg/kg dose (Table 1). GEN treatment also decreased the average combined relative kidney weights when compared to the vehicle control mice at both the 6-mg/kg and 20-mg/kg dose levels (Table 1). GEN treatment had no significant effects on the average combined weights of the pancreas, spleen, lungs, or thymus (Table 1).
Combined analysis of body weight and organ weights in female NOD mice exposed to genistein for up to 180 days.
Note: H = homogeneous data; NH = nonhomogeneous data; NS = not significant; NOD = nonobese diabetic.
Female NOD mice were either untreated (naive) or administered vehicle (25 mM Na2CO3) or genistein (GEN) by gavage daily for up to 180 days. Mice were necropsied and indicated organs weighed. Combined body and organ weights include all the animals that were euthanized during the study and those that survived to the end of the study. Values represent the M ± standard error (SE) derived from the number of animals indicated in parentheses.
a N = 20.
*p ≤ .05. **p ≤ .01 when compared to vehicle control.
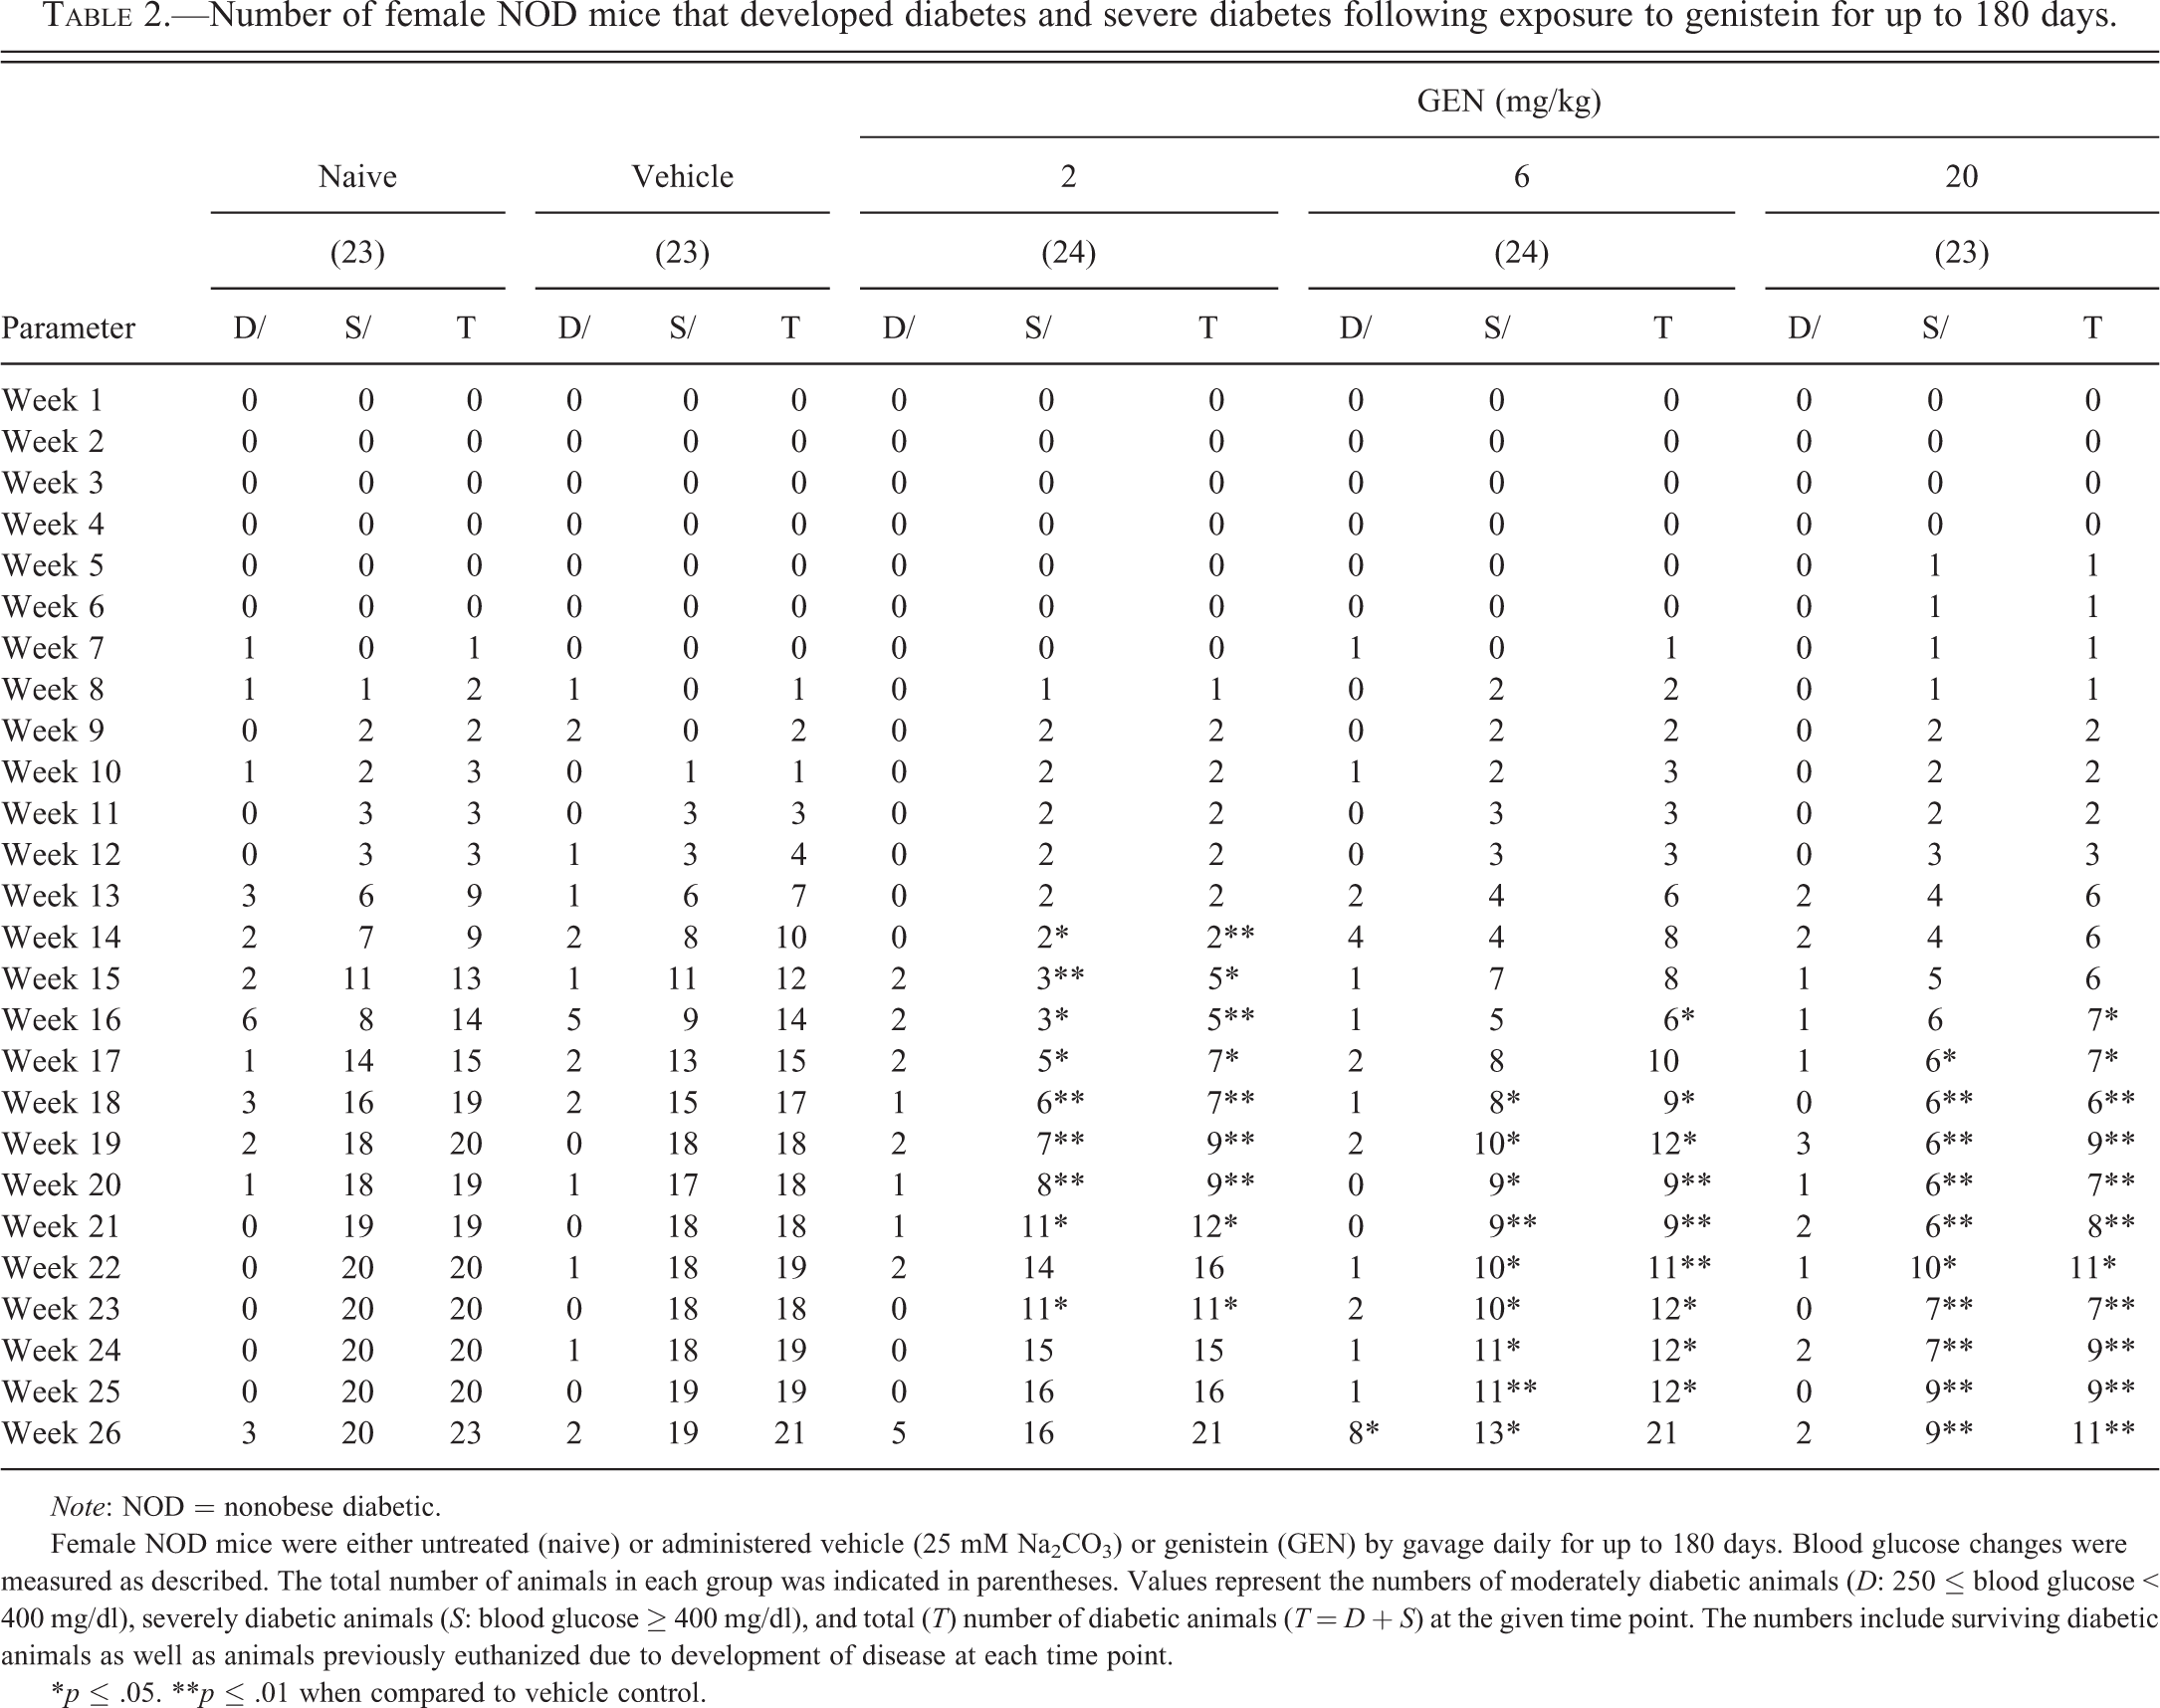
GEN decreased the incidence of diabetes in female NOD mice fed a soy- and alfalfa-free diet for up to 180 days. Blood glucose levels were measured weekly, and total incidence of diabetes (blood glucose ≥ 250 mg/dl) and the incidence of severe diabetes (blood glucose ≥ 400 mg/dl) over time are shown in Figure 2. When compared to the vehicle control, exposure to 2-mg/kg GEN produced significant decreases ranging from 55% to 79% in the total incidence of diabetes (Figure 3A) and the incidence of animals with severe diabetes (Figure 2B) starting at week 14 of the study. However, during the later stages of the study (i.e., after week 23), disease incidence in the GEN mice at the 2-mg/kg dose was not significantly different from that in the vehicle control group. The total incidences of diabetes were significantly lower starting at week 16 for animals treated with 6 mg/kg and 20 mg/kg GEN (Figure 2A). The incidence of severe diabetes was significantly lower beginning at week 18 and week 17 for the 6-mg/kg and 20-mg/kg GEN treatment groups, respectively (Figure 2B). In addition to diabetes incidence, the numbers of mice in each group that developed moderate diabetes (250 ≤ blood glucose < 400 mg/dl) and severe diabetes (blood glucose ≥ 400 mg/dl) with time and total number of diabetic mice (blood glucose ≥ 250 mg/dl) are shown in Table 2.
The incidence of diabetes and severe diabetes with time in female NOD mice exposed to genistein for up to 180 days when maintained on a soy- and alfalfa-free diet. (A) Total incidences of diabetes (blood glucose ≥250 mg/dl) for female NOD mice exposed to genistein. When compared to VH control, significant differences were observed for the 2-mg/kg genistein group from week 14 to 21 and in week 23; for the 6-mg/kg genistein group in week 16 and from week 18 to 25; and for the 20-mg/kg genistein group from week 16 to 26. (B) Incidences of severe diabetes (blood glucose ≥400 mg/dl) for female NOD mice exposed to genistein. When compared to VH control, significant differences were observed for the 2-mg/kg genistein group from week 14 to 21 and in week 23; for the 6-mg/kg genistein group from week 18 to 26; and for the 20-mg/kg genistein group from week 17 to 26. There were no significant differences between VH and NA groups at any time point for either (A) or (B). The numbers of mice in each group are shown in Table 2. NA = Naive; VH = Vehicle (25 mM Na2CO3). NOD = nonobese diabetic.
A combined analysis of serum insulin levels in female NOD mice exposed to genistein for up to 180 days. Sera were collected at the time of euthanization either at the end of the study or during the study due to high blood glucose levels. Values represent the M ± SE. N = 19 to 24. Mice were maintained on a soy- and alfalfa-free diet. **p ≤ .01 when compared to VH (Vehicle, 25 mM Na2CO3). NOD = nonobese diabetic; SE = standard error.
Number of female NOD mice that developed diabetes and severe diabetes following exposure to genistein for up to 180 days.
Note: NOD = nonobese diabetic.
Female NOD mice were either untreated (naive) or administered vehicle (25 mM Na2CO3) or genistein (GEN) by gavage daily for up to 180 days. Blood glucose changes were measured as described. The total number of animals in each group was indicated in parentheses. Values represent the numbers of moderately diabetic animals (D: 250 ≤ blood glucose < 400 mg/dl), severely diabetic animals (S: blood glucose ≥ 400 mg/dl), and total (T) number of diabetic animals (T = D + S) at the given time point. The numbers include surviving diabetic animals as well as animals previously euthanized due to development of disease at each time point.
*p ≤ .05. **p ≤ .01 when compared to vehicle control.
GEN had no consistent effects on blood glucose levels in nondiabetic mice fed a soy- and alfalfa-free diet for up to 180 days. The levels of blood glucose over time in nondiabetic mice (i.e., blood glucose level < 250 mg/dl) are shown in Supplemental Table 1. There was a wide variation in observed blood glucose levels, and no clear pattern of effect due to GEN treatment in nondiabetic mice was present.
GEN increased serum insulin levels in female NOD mice fed a soy- and alfalfa-free diet up to 180 days. To further determine whether the protective effect of GEN was related to its action on the pancreas, insulin levels in the sera from mice (both early deaths and terminal deaths) that had been treated with GEN for up to 180 days were measured. There were increases in serum insulin levels in the 6- and 20-mg/kg dose groups with a significant change observed in the 6-mg/kg dose group when compared to the vehicle group (Figure 3); however, these changes did not correlate with blood glucose levels (data not shown).
Histopathology of pancreas in female NOD mice fed a soy- and alfalfa-free diet. The pancreases from animals euthanized at the end of the study or during the study due to high blood glucose levels were subjected to histopathological evaluation. In addition to the 180-day study, a 90-day interim evaluation (8 mice/group) was conducted to determine the histopathological changes that might be masked by longer exposure. General findings in the pancreas in both the 90-day and 180-day studies included no islets of Langerhans, rare islets (islet atrophy), islet hyperplasia, islet inflammation, and periductulitis/perivasculitis (Figure 1A–F). Periductulitis and perivasculitis were characterized by an infiltrate composed primarily of lymphocytes, with occasional macrophages, in the connective tissue stroma surrounding ducts and blood vessels (Figure 1F). Lymphocytes were also noted distending small lymphatics in this connective tissue stroma. The finding of lymphocytes in lymphatics was included in the term “periductulitis and perivasculitis” in the data tables presented subsequently.
Findings in the Pancreas from the 90-day Study
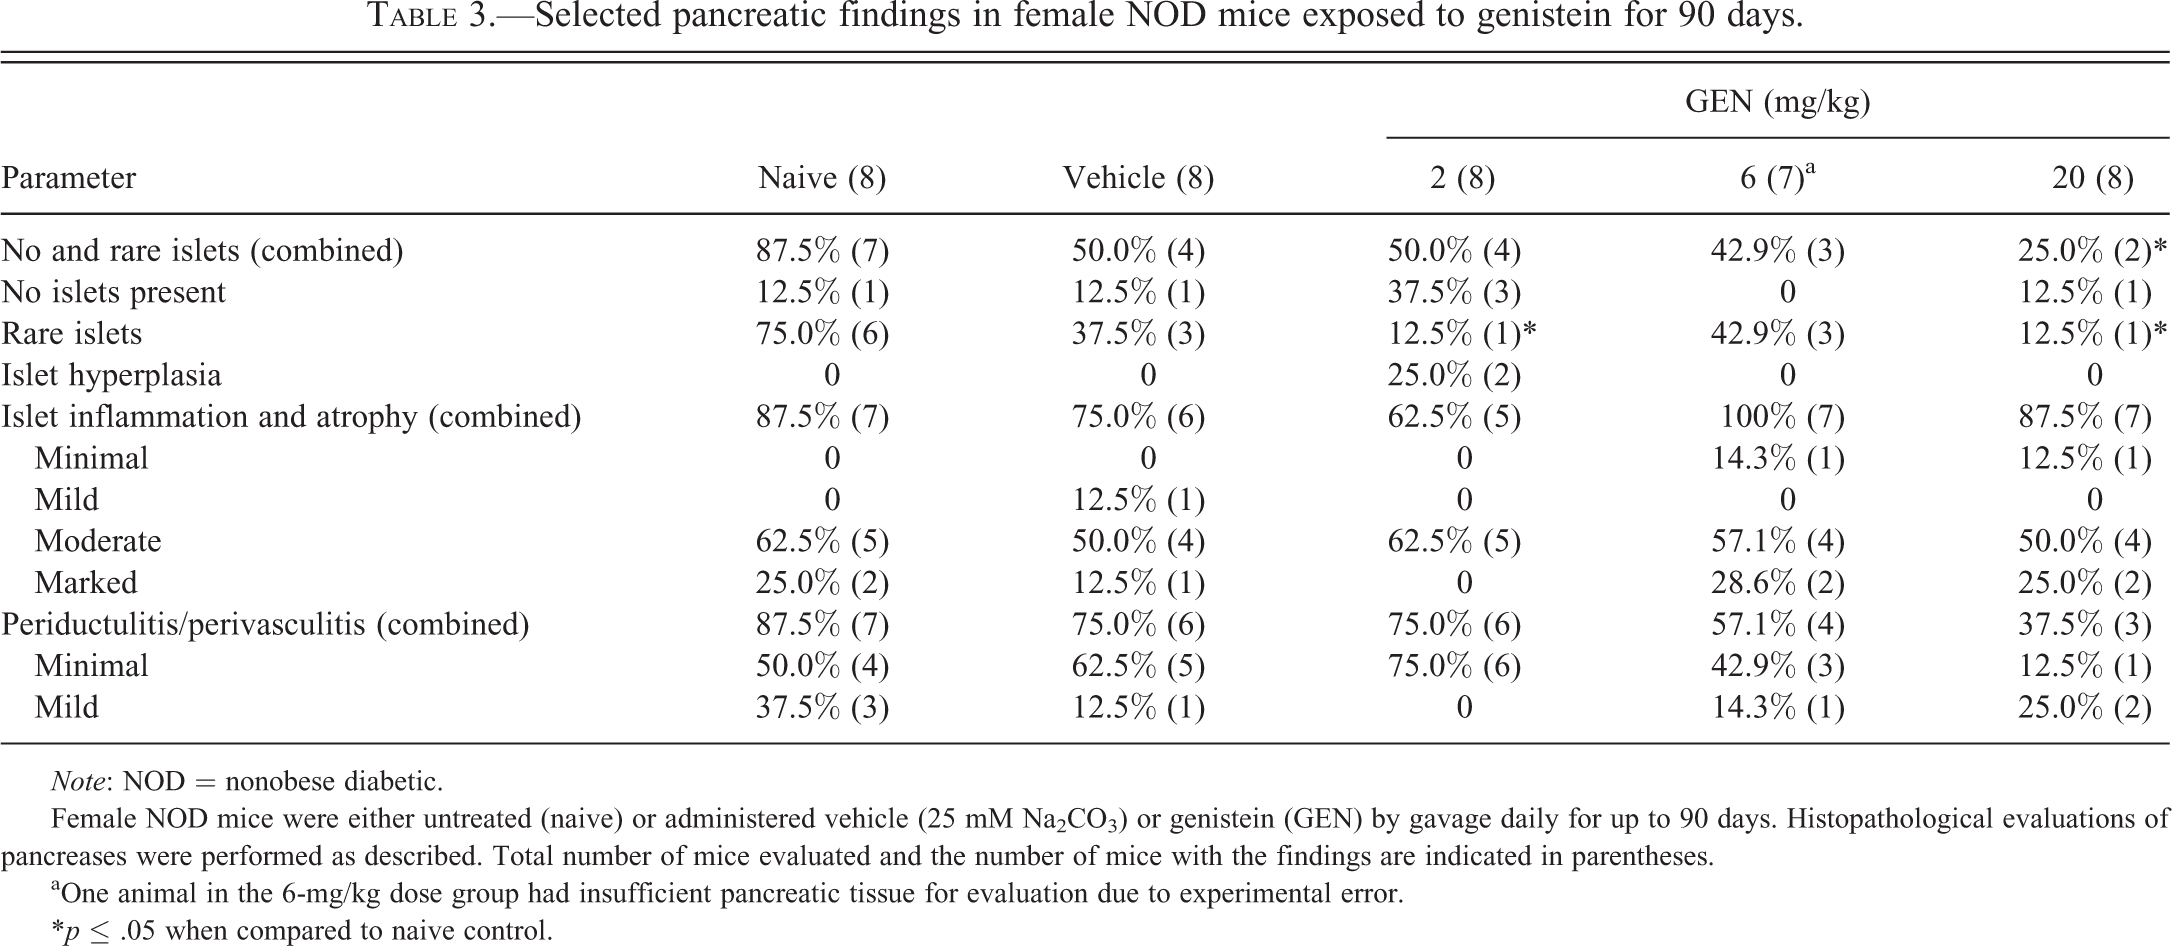
Although not statistically significant when compared to vehicle control, a decrease in the number of mice with rare islets was noted in the 2-mg/kg and 20-mg/kg dose groups (Table 3). The combined number of mice with no and rare islets was 3 of the 7 and 2 of the 8 in the 6-mg/kg and 20-mg/kg dose groups, respectively, compared to 4 to 7 of the 8 in the other dose groups (e.g., naive, vehicle control and the 2-mg/kg dose group). Moreover, a decrease in the incidence of periductulitis/perivasculitis was noted in the 6-mg/kg and 20-mg/kg dose groups when compared to the other dose groups (4 of the 7 and 3 of the 8 for the 6-mg/kg and 20-mg/kg dose groups, respectively, compared to 6 to 7 of the 8 in the other groups). These findings suggested that fewer mice in the 6-mg/kg and 20-mg/kg dose groups had reached the “end-stage” level of islet disease, and the inflammation was less advanced in the 6-mg/kg and 20-mg/kg dose groups at the end of the 90-day period than in the other groups. In addition, 2 mice in the 2-mg/kg dose group had hyperplastic islets.
Selected pancreatic findings in female NOD mice exposed to genistein for 90 days.
Note: NOD = nonobese diabetic.
Female NOD mice were either untreated (naive) or administered vehicle (25 mM Na2CO3) or genistein (GEN) by gavage daily for up to 90 days. Histopathological evaluations of pancreases were performed as described. Total number of mice evaluated and the number of mice with the findings are indicated in parentheses.
aOne animal in the 6-mg/kg dose group had insufficient pancreatic tissue for evaluation due to experimental error.
*p ≤ .05 when compared to naive control.
Findings in the Pancreas from the 180-day Study
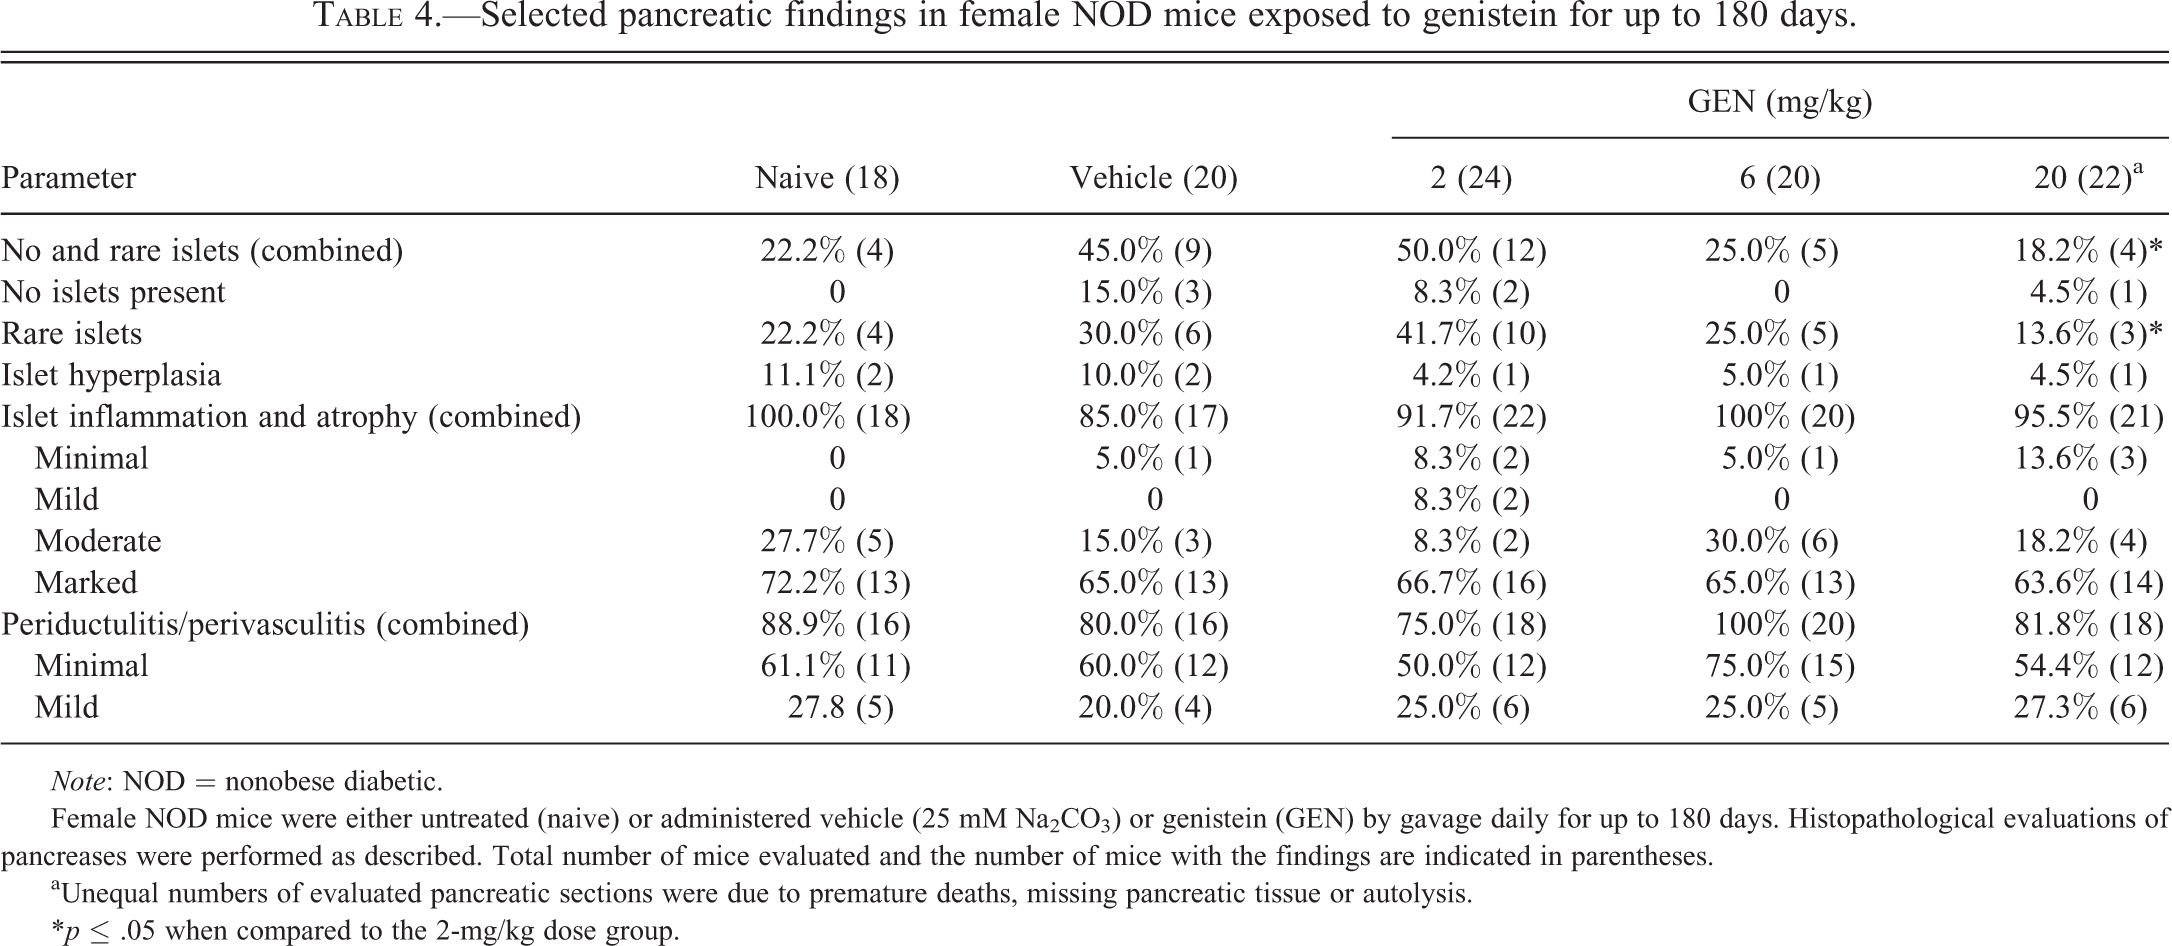
The vehicle and 2-mg/kg dose groups had more mice with no islets and rare islets, and combined rare and no islets when compared to the naive, 6-mg/kg, and 20-mg/kg dose groups (Table 4). These findings suggest that fewer mice in the naive, 6-mg/kg, and 20-mg/kg dose groups had reached end-stage islet disease by the end of the 180-day period when compared to the vehicle and 2-mg/kg dose groups. There were no apparent treatment-related effects on islet hyperplasia, islet inflammation/atrophy, or periductulitis/perivasculitis at 180 days of exposure.
Selected pancreatic findings in female NOD mice exposed to genistein for up to 180 days.
Note: NOD = nonobese diabetic.
Female NOD mice were either untreated (naive) or administered vehicle (25 mM Na2CO3) or genistein (GEN) by gavage daily for up to 180 days. Histopathological evaluations of pancreases were performed as described. Total number of mice evaluated and the number of mice with the findings are indicated in parentheses.
aUnequal numbers of evaluated pancreatic sections were due to premature deaths, missing pancreatic tissue or autolysis.
*p ≤ .05 when compared to the 2-mg/kg dose group.
Regardless of groups, that is, controls or GEN treated, of all mice in which inflammation/atrophy was diagnosed, the majority of the animals in the 90-day study had moderate inflammation in contrast to the 180-day study in which the majority of the animals had marked inflammation/atrophy. Some of the nonspecific inflammation in the islets was clearly destructive as evidenced by degeneration of islet cells and presence of macrophages. However, in some cases, the destruction appeared immune associated as evidenced by lymphoid follicle formation. Proportionally fewer mice in the 6-mg/kg and 20-mg/kg dose groups in the 90-day study had periductulitis and perivasculitis than in the 180-day study groups. A number of other incidental findings, not associated with GEN treatment, were observed in both the 90- and 180-day studies. Several pancreases had focal aggregates of lymphocytes in the interacinar/interstitial exocrine areas of the pancreas. In addition, several pancreases had small focal areas of lymphocytes, plasma cells, and macrophages involving the exocrine pancreatic acini.
Histopathology of kidney in female NOD mice fed a soy- and alfalfa-free diet. Similar to pancreas, the left kidney from animals euthanized at the end of the study or during the study due to high blood glucose levels were subjected to histopathological evaluation. General findings in the kidney of both the 90- and 180-day studies included renal tubular hypertrophy, tubular basophilia (regeneration), proteinaceous cast formation, glomerular deposits of amorphous eosinophilic material, and perivascular lymphocytic/plasmacellular infiltrates. These findings were present in mice from all groups, and GEN treatment had no effects on their incidence or severity.
Findings in the Kidney from the 90-day Study
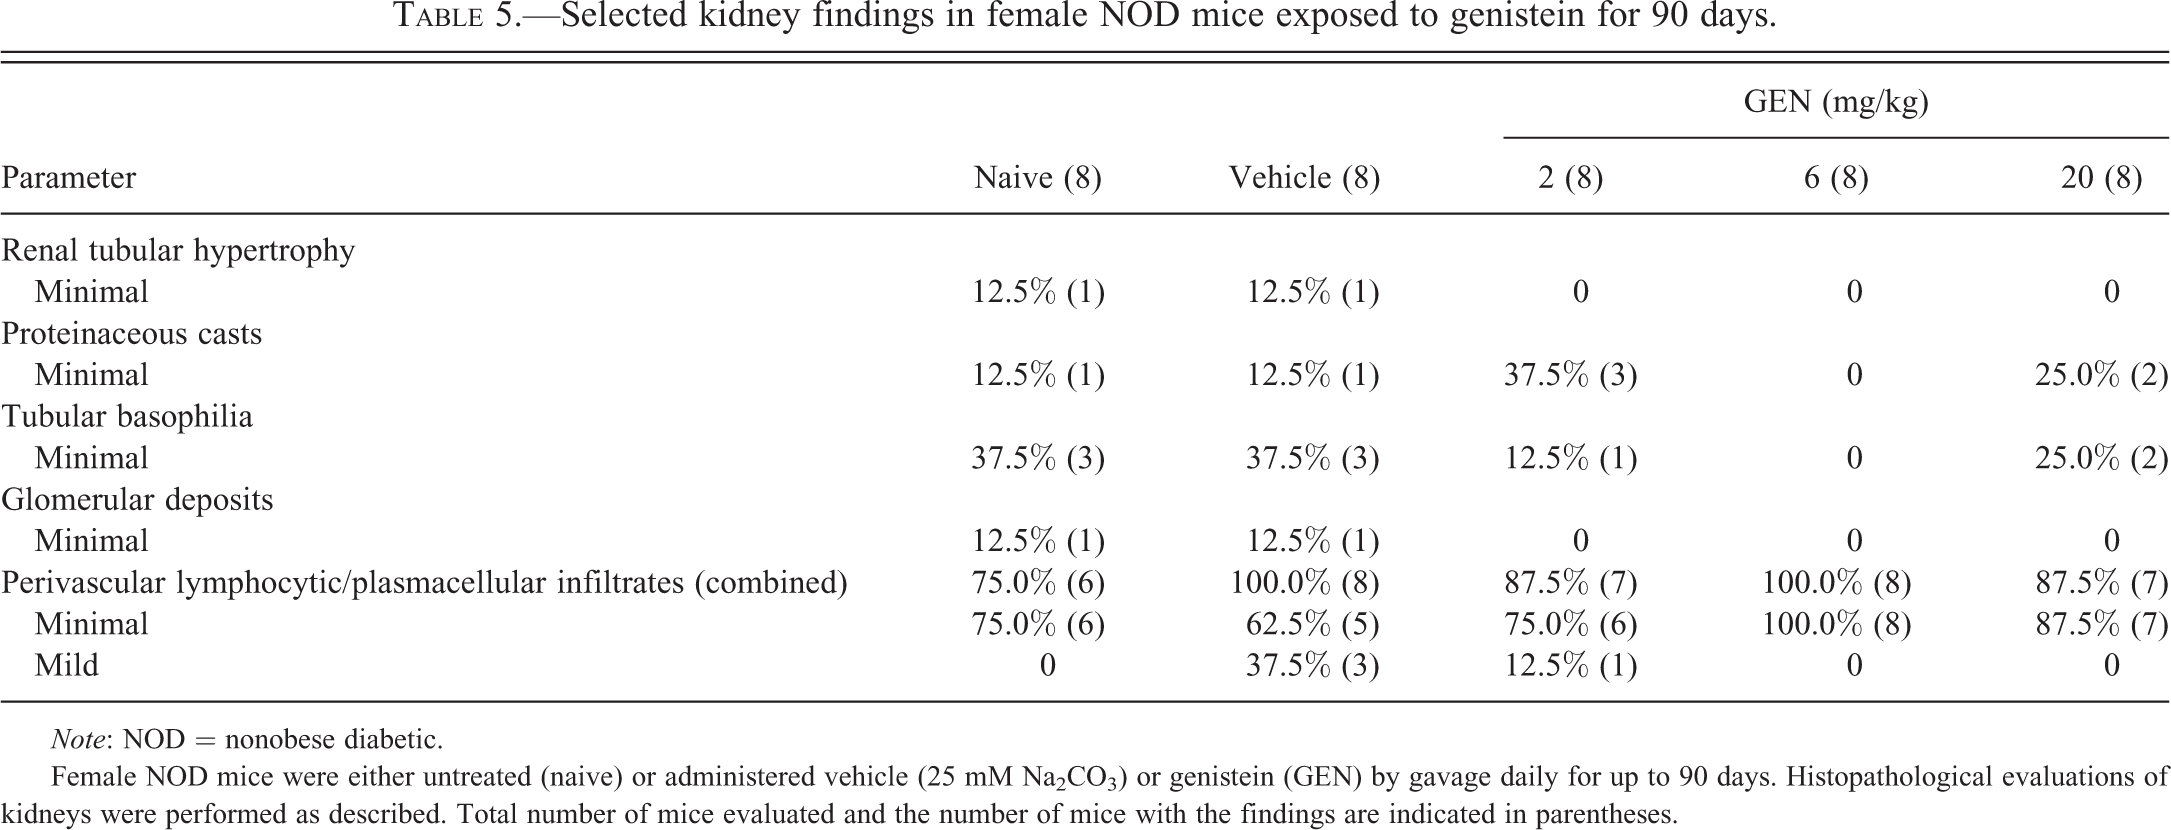
No unequivocal GEN-related findings were noted in the kidney (Table 5). The following findings were considered normal variation in morphology of the NOD mouse kidney: 1 of the 8 animals had minimal tubular hypertrophy in each of the naive and vehicle control groups, and 1 of the 8 animals had minimal glomerular deposits in each of the naive and vehicle control groups. Tubular basophilia and minimal proteinaceous casts were found in most dose groups including naive mice, without a dose-related change in incidence or severity, and perivascular lymphocytic/plasmacytic infiltrates were seen in most animals in all groups.
Selected kidney findings in female NOD mice exposed to genistein for 90 days.
Note: NOD = nonobese diabetic.
Female NOD mice were either untreated (naive) or administered vehicle (25 mM Na2CO3) or genistein (GEN) by gavage daily for up to 90 days. Histopathological evaluations of kidneys were performed as described. Total number of mice evaluated and the number of mice with the findings are indicated in parentheses.
Findings in the Kidney from the 180-day Study
No unequivocal test article–related findings were noted in the kidneys from mice in any dose group (Table 6). A slight increase in renal tubular hypertrophy (5 of the 24 mice affected) in the 2-mg/kg/dose group was noted. However, the incidence in the naive group was similar to that in the 20-mg/kg dose group (1 animal affected in each group), and therefore, the findings are of undetermined significance. Proteinaceous casts and tubular basophilia were noted across most groups although these were lowest in the naive group. However, these lesions were very minimal and, were considered components of chronic progressive nephropathy. Glomerular deposits and perivascular lymphocytic/plasmacellular infiltrates were noted in naive and vehicle control groups in similar incidence and severity to GEN dose groups.
Selected kidney findings in female NOD mice exposed to genistein for up to 180 days.
Note: NOD = nonobese diabetic.
Female NOD mice were either untreated (naive) or administered vehicle (25 mM Na2CO3) or genistein (GEN) by gavage daily for up to 180 days. Histopathological evaluations of kidneys were performed as described. Total number of mice evaluated and the number of mice with the findings are indicated in parentheses.
aUnequal numbers of evaluated left kidney sections were due to premature deaths or autolysis of the sample.
Proportionally fewer mice in the 90-day study had proteinaceous casts and tubular basophilia than in the 180-day study. This finding is consistent with the assumption that the proteinaceous casts and tubular basophilia are due to chronic progressive nephropathy, which increases in incidence/severity with age. Miscellaneous findings in the kidney consisted primarily of small renal cysts formed from dilated renal tubules and lymphoid aggregates in the suburothelial epithelium in the medullary area of the kidney.
Serum levels of ICA in female NOD mice fed a soy- and alfalfa-free diet. To determine whether serum levels of autoantibodies could be an early indicator for onset of T1D in female NOD mice, levels of 4 different autoantibodies in the sera were initially compared in 2 groups of female NOD mice: nondiabetic NOD mice and NOD mice that developed severe diabetes spontaneously. These 4 autoantibodies were ANA, anti-GAD autoantibody, IAA, and ICA. No significant differences were observed in the levels of autoantibodies for GAD, IAA, and ANA. However, higher levels of ICA were detected in NOD mice that developed severe diabetes spontaneously than NOD mice with normal blood glucose levels (Supplemental Figure 1).
To further examine its utility as an early indicator for the onset of T1D in NOD mice, ICA levels in the sera from mice of the 180-day study that had been treated with GEN for 28 days were measured. There were no significant differences in ICA levels between the vehicle and any of GEN treatment groups (Figure 4A). However, a significant decreasing trend was observed among the groups (p ≤ .05). A bivariate fit analysis between ICA levels and the week when the individual animals developed diabetes was performed, and there was no significant correlation (R 2 = .03; Figure 4B). Therefore, measurement of ICA levels in the sera following 28 days of exposure was not predictive of the onset of T1D in NOD mice.
No correlation between serum levels of islet cell autoantibodies (ICA) from female NOD mice exposed to genistein for 28 days and the time of diabetes onset. (A) Mean ICA levels (optical density [OD]) for female NOD mice exposed to genistein for 28 days. Values represent the M ± SE. N = 23 to 24. A significant decreasing trend was observed among the groups. (B) Bivariate fit of ICA level by the time (weeks to onset of diabetes) when blood glucose level was ≥250 mg/dl. Mice were maintained on a soy- and alfalfa-free diet. NA = Naive; VH = Vehicle (25 mM Na2CO3). N = 23 to 24. NOD = nonobese diabetic; SE = standard error.
Exposure to GEN by gavage did not affect the incidence of diabetes in female NOD mice fed the NTP-2000 diet. The effect of GEN on T1D was also determined in female NOD mice fed the NTP-2000 diet (Zeigler Brothers, Inc., Gardners, PA) in which a moderate level of phytoestrogens was present (the total concentrations of phytoestrogens ranged between 95 and 134 mg/kg). Exposure to GEN at 2 to 20 mg/kg daily for up to 27 weeks did not significantly affect the incidence of diabetes (Supplemental Figure 2).
Discussion
Approximately 2 million people in Europe and North America are affected with T1D, accounting for about 10% of all cases of diabetes (Gillespie 2006). Furthermore, T1D is one of the most common chronic diseases with onset in childhood (Stene et al. 2004). In addition to genetic susceptibility, environmental triggers such as drugs, chemicals, and diet are involved in the development of the disease (Gillespie 2006). Although soy products contain several potential active ingredients, the isoflavones are thought to have the most significant biological effects. This study has demonstrated that oral exposure to the soy isoflavone GEN protected female NOD mice from developing T1D (e.g., reduced hyperglycemia) when fed a soy- and alfalfa-free diet. This result manifested as a decreased incidence of both diabetes and severe diabetes as determined by blood glucose levels, and several other end points suggested reduction of disease following GEN treatment (e.g., decreased islet atrophy, decreased periductulitis/perivasculitis, increased serum insulin levels, increased terminal body weights, decreased relative weights of liver and kidney). Several lines of evidence from our study suggested the protective effect of GEN on T1D might be related to direct or indirect actions on the pancreas: (1) serum insulin levels were increased following GEN exposure, suggesting an increased pancreatic β-cell function; (2) increased pancreas weight was observed in the 2-mg/kg (129 ± 7 vs. 110 ± 7 mg; p ≤ .05 by Student’s t-test) and 20-mg/kg (129 ± 3 vs. 110 ± 7 mg; p ≤ .05 by Student’s t-test) GEN groups; and (3) histopathological evaluation revealed GEN-related protective effects, such as a decrease in the destruction of pancreatic islets, following both 90 and 180 days of exposure.
In this study, mice were exposed to GEN at dose levels of 2 to 20 mg/kg by gavage. These doses are physiologically relevant because soy formula can provide a 4-month-old infant with ∼6 to 9 mg/kg of isoflavones (Irvine, Fitzpatrick, and Alexander 1998). The dose of 20-mg/kg GEN in mice is much lower than a clinical human supplement dose (∼100 mg/day; Djuric et al. 2001) in terms of milligrams per square meter of body surface, which often gives more accurate interspecies extrapolation (Hodgson 1997). Additionally, the serum level of GEN (1.4–7.5 μM) in mice that have been fed 1,000 ppm GEN-containing diet (∼80-mg/kg body weight) was equivalent to that in men who received 100-mg GEN/day (Djuric et al. 2001; Yellayi et al. 2002; Bhandari et al. 2003). In our study, a clear dose-related effect on incidences of diabetes was observed toward the end of the 180-day study, with a greater protective effect observed for the 20-mg/kg dose group. Before week 15, however, it appeared that the 2-mg/kg dose group had lower incidences of diabetes and severe diabetes. In future studies, it will be interesting to determine the effect of GEN at lower doses (<2 mg/kg) on the development of T1D.
There are several possible mechanisms that may be responsible for the protective effect of GEN on T1D. Although not statistically significant, there was a decrease in the number of animals with no/rare islets in the 2 highest dose groups in this study. Because islet atrophy or lack of islets indicates the presence or history of severe inflammation, it was likely that the anti-inflammatory effect of GEN contributed to the protective effect in female NOD mice, which was further supported by the results that there was a decrease in incidence and severity of periductulitis and perivasculitis in the 6-mg/kg and 20-mg/kg dose groups in the 90-day study. Other possible mechanisms could also contribute to this protection as approximately 92 to 100% of mice in GEN-treated groups had moderate/marked islet inflammation at the end of the 180-day study. Estrogens and GEN have been shown to directly prevent pancreatic β-cells from apoptosis (Le May et al. 2006; Gilbert and Liu 2013), and thus, the T1D-preventing effects of GEN may relate to its direct and indirect (e.g., decreased destruction of islet cells) effects on pancreas. It should be noted that GEN has been found to be an inhibitor of protein tyrosine kinases (Akiyama et al. 1987), and tyrosine kinase inhibitors can reverse T1D in NOD mice (Louvet et al. 2008). Further study is needed to determine if the protective effect of GEN on T1D is due to either its function as an estrogenic compound or an enzyme inhibitory agent.
In contrast to the anti-inflammatory effect of GEN in female NOD mice reported in this study, our previous studies in adult female B6C3F1 mice have suggested that administration of GEN by gavage significantly increased cell-mediated immunity (Guo et al. 2001, 2007). It has been reported that mean estrogen levels are 21.3 ± 7.2 pg/ml in female NOD mice, which is lower than other strains, for example, female BALB/c mice have 93.8 ± 12.4 pg/ml of estrogen (Yashida, Da Silva Faria, and Caldeira 2011). Female B6C3F1 mice have higher and more sustained level of endogenous estradiol than female C57BL/6 and CD-1 mice (Gervais and Attia 2005). Thus, differing levels of circulating estrogen might explain the differential effects of GEN on the immune responses in female NOD and B6C3F1 mice. GEN may function as an agonist of ERs in a low estrogen environment (e.g., female NOD mice or ovariectomized mice) while as an antagonist in a high estrogen environment (e.g., female B6C3F1 mice), and a similar phenomenon has been observed in our previous studies (Guo et al. 2006).
In these studies, neither histopathological evaluation nor measurement of serum creatinine levels (data not shown) suggested GEN-related effects in the kidney. However, GEN treatment decreased the relative kidney weight when compared to control mice. Increased kidney weights are associated with the development of diabetes in NOD mice (Landau et al. 2001), and there are some reports suggesting that GEN can reduce kidney toxicity (Palanisamy and Venkataraman 2012). Additionally, it has been reported that increased serum creatinine levels are not apparent until 6 weeks after the development of diabetes (Cohen et al. 1996), while the mice in the present studies were humanely sacrificed at approximately 5 weeks following the onset of diabetes. Thus, we could not rule out the possibility that the beneficial effect of GEN might be related to an effect on the kidney. Similarly, some reports have shown that the protective effect of GEN might also be related to its action in the liver (Choi et al. 2008) and liver weights were significantly decreased in the 20-mg/kg group. Further studies are needed to ascertain if kidney and liver-related mechanisms are involved in the GEN-mediated protection from T1D in NOD mice.
Diet plays an important role in the development of diabetes in female NOD mice (Elliott et al. 1988). It is important to note that the protective effect of GEN on T1D development in female NOD mice was absent when the NTP-2000 diet was used. The apparent discrepancies between 2 studies in which mice were maintained on the 5K96 diet and NTP-2000 diet, respectively, might be explained by the isoflavone contents. The concentrations of both GEN and daidzein in the 5K96 diet were determined to be ∼0.5 mg/kg (Doerge, Churchwell, and Delclos 2000). However, the combined levels of phytoestrogens in the NTP-2000 diet ranged between 95- and 134-mg/kg feed (Thigpen et al. 1999; Degen et al. 2002). Therefore, mice on the NTP-2000 diet were constantly exposed to a moderate level of phytoestrogens. A similar dietary effect on the development of hypersensitivity has been observed in our previous studies (Guo, Auttachoat, and Chi 2005). In that study, continuous treatment with GEN from gestation day 14 to postnatal day 84, including both developmental and adult exposures, was required to produce an increase in serum total IgE in female mice. These observations highlight a complicated “window of vulnerability” of GEN exposure. Further determination of the mechanisms underlying these effects will help our understanding of the concerns associated with soy consumption.
In summary, we observed in this study that oral exposure to GEN at physiologically relevant doses protected female NOD mice from developing T1D when fed a soy- and alfalfa-free diet, most likely by preventing autoimmune destruction of pancreatic cells. Although remarkable in presentation and variety, pancreatic islet histopathology did not correlate with blood glucose or insulin levels. Various ER including ERα, ERβ, nonclassical ER and G-protein-coupled receptor 30 have been identified (Filardo et al. 2007; Holladay et al. 2010), and GEN may interact with them with different affinity. Additionally, GEN can affect the activities of various enzymes (Wiegand et al. 2009). Further study on the molecular mechanisms underlying the modulatory effect of GEN on T1D will allow us to understand more about its estrogenic and enzyme inhibitory activities (e.g., tyrosine kinase inhibition) and the safety issues associated with ingestion of this compound.
Footnotes
Acknowledgment
The authors would like to thank Drs. Grace Kissling of the NIEHS and Steven D. Holladay of the University of Georgia for their critical and editorial review, and D. L. Musgrove and R. D. Brown at Virginia Commonwealth University for their technical assistance.
The author(s) declared no potential conflicts of interest with respect to the research, authorship, and/or publication of this article.
The author(s) disclosed receipt of the following financial support for the research, authorship, and/or publication of this article: This study was supported by the NIEHS contract N01-ES-55538.
Abbreviations
References
Supplementary Material
Please find the following supplemental material available below.
For Open Access articles published under a Creative Commons License, all supplemental material carries the same license as the article it is associated with.
For non-Open Access articles published, all supplemental material carries a non-exclusive license, and permission requests for re-use of supplemental material or any part of supplemental material shall be sent directly to the copyright owner as specified in the copyright notice associated with the article.