
Abstract
Most published reviews of preclinical toxicological clinical pathology focus on the fundamental aspects of hematology, clinical chemistry, coagulation, and urinalysis in routine toxicology animal species, for example, rats, mice, dogs, and nonhuman primates. The objective of this continuing education course was to present and discuss contemporary examples of nonroutine applications of clinical pathology endpoints used in the drug development setting. Area experts discussed bone turnover markers of laboratory animal species, clinical pathology of pregnant and growing laboratory animals, clinical pathology of nonroutine laboratory animal species, and unique applications of the Siemens Advia® hematology analyzer. This article is a summary based on a presentation given at the 31st Annual Symposium of the Society of Toxicologic Pathology, during the Continuing Education Course titled “Nontraditional Applications of Clinical Pathology in Drug Discovery and Preclinical Toxicology.”
Keywords
Introduction
Most published reviews of preclinical toxicological clinical pathology focus on the fundamental aspects of hematology, clinical chemistry, coagulation, and urinalysis in routine toxicology animal species, for example, rats, mice, dogs, and nonhuman primates. The objective of this continuing education course was to present and discuss contemporary examples of nonroutine applications of clinical pathology endpoints used in the drug development setting. Area experts discussed bone turnover markers of laboratory animal species (Thomas C. Register, Wake Forest School of Medicine), clinical pathology of juvenile laboratory animals (Anne Provencher Bolliger, Charles River Laboratories), clinical pathology of nonroutine laboratory animal species (Niraj Tripathi, Covance Laboratories), and unique applications of the Siemens Advia® hematology analyzer (Nancy Everds, Amgen; Denise Bounous, Bristol-Myers Squibb Co.; and Florence Poitout, Charles River Laboratories). This article is a summary based on a presentation given at the 31st Annual Symposium of the Society of Toxicologic Pathology, during the Continuing Education Course titled “Nontraditional Applications of Clinical Pathology in Drug Discovery and Preclinical Toxicology.”
Biomarkers of Bone Metabolism in Preclinical Studies
Thomas C. Register
Introduction
The need to assess bone metabolism originated, in large part, from research on therapeutic interventions for skeletal disorders, particularly osteoporosis. Osteoporosis is a crippling disease characterized by compromised bone strength predisposing to an increased risk of fracture, a significant cause of morbidity and mortality in postmenopausal women and some elderly men (National Institutes of Health [NIH] Consensus Statement 2000). The risk of osteoporosis is increased with age, menstrual dysfunction, menopause, poor nutrition (e.g., vitamin D deficiency, calcium imbalance, low protein), insufficient exercise, low body weight, and certain medications such as glucocorticoids. Most patients are affected by primary senile or postmenopausal (involutional) osteoporosis; elderly white women are most commonly affected. Secondary osteoporosis is associated with other medical conditions, such as hypercorticism, glucocorticoid administration, heparin therapy, chronic liver disease, immobilization, alcoholism, diabetes, hypogonadism, and many other causes (Avioli and Krane 1998).
Bone composition and compartments
Bone is composed of an inorganic component, primarily calcium phosphate hydroxyapatite, and an organic component consisting of primarily type I collagen (> 90% of matrix), noncollagenous proteins, and proteoglycans. Cortical (compact) bone makes up 80% of the skeletal mass and 20% of the skeletal surface area. Trabecular (cancellous) bone makes up 20% of skeletal mass and 80% of the skeletal surface area. The skeleton is constantly remodeled in response to changes in loading patterns, and to maintain structural integrity, with replacement of approximately 10% of the skeleton annually.
Bone metabolism and remodeling
Bone turnover and remodeling is dependent upon the coordinated action of osteoclasts and osteoblasts.
Bone resorption
In the resorptive phase, osteoclast precursors derived from hematopoietic progenitors are recruited to skeletal sites in need of remodeling in response to altered stress patterns or local micro-fractures. Once functional, the mature osteoclasts create sealed micro-compartments in contact with the bone surface into which they secrete acidic and proteolytic factors that actively dissolve the mineral constituents and degrade the extracellular matrix. Osteoclast development is regulated by factors such as receptor activator of nuclear factor κ B ligand, colony stimulating factors, 1,25 (OH)2 vitamin D, prostaglandins, interleukins, tumor necrosis factor, osteoprotegerin, and others. Osteoclasts have a finite (although modifiable) life span and undergo apoptosis at the end of the resorption phase.
Bone formation
In the bone formation phase, osteoblasts derived from mesenchymal stem cells synthesize bone matrix (type I collagen, osteocalcin [OC], osteonectin, and other components) and promote mineralization. Following this active phase, osteoblast fates include apoptosis, formation of a cellular lining on the surface of the bone, or entrapment within the bone matrix as osteocytes, important bone sensing cells. The end result of the bone remodeling process is replacement of a packet of old bone with an area of new and structurally improved bone. The mineral portion continues to mature and increase in density with time. When bone turnover is in balance, the net change in mineral density is zero.
Biomarkers of bone remodeling
During the remodeling process, osteoblasts and osteoclasts produce specific biomolecular products that can be monitored in serum, and in some cases urine, to provide information on the status of bone turnover (Eastell and Hannon 2008; Szulc and Delmas 2000; Watts 1999). Osteoclasts produce enzymes such as tartrate-resistant acid phosphatase 5b (TRAP5b) and proteases which degrade bone matrix, liberating peptide fragments of type I collagen, including N-telopeptide (NTx), C-telopeptide (CTx), and the small trivalent collagen linking molecules, pyridinoline (Pyd) and deoxypyridinoline (Dpd). Collagen-degradation products are useful for assessment of bone resorption, though they are also derived from other tissues and may lack specificity as markers of bone turnover. Biomarkers of bone formation produced by osteoblasts include OC, bone-specific alkaline phosphatase (BALP), and C- and N-terminal propeptides of collagen type I (PICP and PINP, respectively).
Biomarker assays in animal models
Assays for many of these biomarkers have been used to assess bone metabolism in humans as well as rodents, dogs, pigs, nonhuman primates, and other animals, though there are important species differences in bone biology, as well as differences attributable to gender and developmental age (Reinwald and Burr 2008; Turner 2001). Bone turnover markers used in rats and mice include CTx, TRAP5b, PyD, and Dpd for resorption and PINP, BALP, and OC for formation. Common markers in dogs include serum/urine CTx, NTx, and Dpd (resorption), and BALP and OC (formation). Available markers in pigs include Dpd and CTx (resorption) and BALP and OC (formation). Markers in primates include acid phosphatase, TRAP5b, DpD, Pyd, CTx, NTx (resorption), and BALP and OC (formation; Jerome et al. 1994; Register, Jayo, and Anthony 2003). Similar to humans, nonhuman primates show bone loss in response to ovariectomy and this model is widely used to study osteoporosis. Rats and mice differ from larger animals and humans in that they lack Haversian remodeling of their cortical bone which limits their use in translational studies of cortical bone remodeling. Dogs are refractory to ovariectomy-induced bone loss, while pigs show variable effects. Biomarkers of bone turnover are elevated during development, stable once peak bone mass is attained, increase with estrogen deficiency, and decrease with effective antiresorptive therapies. These parallel changes in resorption and formation markers are due to the coupled nature of the bone remodeling process that is driven by alterations in osteoclast activity and removal of bone packets, which then lead to osteoblast recruitment and activity to attempt to fill in the resorbed site.
Biomarkers complement other assessments
In studies where bone is a target organ, bone metabolism can be evaluated by biopsy, biomarkers, and/or imaging modalities. Biomarkers reflect remodeling of the entire skeleton and cannot be used alone to diagnose diseases such as osteoporosis; bone mineral density measurement is more helpful. Indeed, for many applications, longitudinal imaging of the skeleton with dual energy absorptiometry or computed tomography is essential to follow changes in bone, and biomarker responses are complementary. This is particularly true in juvenile toxicology studies where influences on the skeleton are unknown. Appropriate age-matched controls are required in this situation due to general elevations in biomarkers during the bone modeling and remodeling processes occurring during skeletal development.
Biomarker responses
Evaluation of biomarkers typically includes endpoints of both bone formation and resorption. For example, effective osteoporosis therapies should demonstrate reductions in serum BALP and OC of at least 15% and reductions in serum or urine collagen cross-links (NTx, Dpd, or Pyd) of at least 25%. Because bone resorption occurs prior to bone formation, most current therapies target bone resorption. Therefore, resorption markers currently offer some advantages in monitoring therapeutic responses when compared to markers of bone formation. Resorption markers respond more rapidly (within 2–12 weeks) in contrast to formation markers which may change within 3 to 6 months or imaging endpoints which may require 1 to 2 years.
Clinical Pathology of Nonroutine Species
Niraj Tripathi
Introduction
While the majority of preclinical regulatory toxicology studies are conducted in rats, mice, and dogs, species such as rabbits, minipigs, hamsters, guinea pigs, and transgenic rodents play an essential role in biomedical and pharmaceutical research. These species may provide unique disease models or demonstrate advantageous characteristics especially for nonstandard clinical administration such as topical and dermal applications. For example, evaluation of dermatologic agents can be optimized by using albino rabbits. Rabbits are usually preferred for study of ocular diseases as well due to their large eye size (in relation to their body size), which facilitates efficient intraocular dosing and eye examination. In addition, the rabbit’s sensitivity to high dietary cholesterol makes this species valuable for investigations of cardiovascular disease, dyslipemia, and atherosclerosis. Minipigs have been utilized as test models for cardiovascular, skin, and digestive tract disease interventions because of their physiologic and anatomic similarities to humans. Similar to other commonly used laboratory animal species, concurrent controls are the best comparator for the data interpretation of clinical pathology endpoints of these nonroutine species. Reference ranges, if used, should be tailored to the specific collection site, strain, gender, age, and feeding status as well as to the analyzer and reagents used.
Rabbits
New Zealand white (albino) and Dutch Belted are two of the most common rabbit breeds used in drug research. Dutch Belted rabbits have a pigmented retina that is helpful for evaluating interventions that selectively affect pigmented cells. Though generally tractable, rabbits can be excitable and require careful handling to prevent back injury. They are prone to enteropathy (idiopathic) and are susceptible to pinworm (Passalurus ambiguous) infestation. Rabbits are coprophagic, and fasting may be ineffective resulting in variable serum glucose and triglycerides.
Because they are prone to stress, baseline blood collections after transport should be timed to allow sufficient acclimation. Blood may be obtained from the jugular vein (large blood volume), marginal ear vein, or medial auricular artery (small volumes). Cardiac puncture may be performed under anesthesia prior to termination.
Lymphocytes are the predominant circulating leukocyte (∼60–80%) while heterophils (or neutrophils) comprise 10 to 30% of total leukocytes. Heterophils have pink-staining cytoplasm due to fine eosinophilic granules and are functionally and biochemically similar to neutrophils in other species. Relative to other species, rabbits have a high proportion of basophils, typically 5 to 10%, and even up to 30% (Thrall 2004). Rabbits exhibit a stress leukogram due to shipping or similar stressors. During inflammation, they have a reversal of the lymphocyte:heterophil ratio, but not marked neutrophilia. Reticulocyte concentrations are variable. During the first 2 months of life reticulocyte concentrations are high (range 1–7%), then sharply decline during 3rd month. Platelet concentrations (PLT) are also variable (200–500 × 103/µL).
For assessment of activated partial thromboplastin time (APTT), ellagic acid may be used as the activator for rabbit plasma due to a poor response to silica (anecdotal). Falsely high albumin (up to 50%) can occur if rabbit-specific reagent is not used for calibration (Hall 1992). Serum calcium is higher in rabbits than in other species (13–15 mg/dl; Thrall 2004). Rabbits are extremely sensitive to glucocorticoids (Rosenthal 2004) and have high endogenous levels of cortisol and corticosterone. Unlike rats, rabbits have very little amylase activity in salivary glands and they will not have elevated serum amylase with sialoadenitis (Loeb 2000). Sensitive acute phase proteins in rabbits include fibrinogen and C-reactive protein.
Cholesterol fractions in rabbits are approximately 45 to 60% high-density lipoprotein, 30 to 40% low-density lipoprotein (LDL), and 10–15% very low-density lipoprotein (VLDL). Rabbits on a high cholesterol diet develop marked increases in serum cholesterol, primarily due to VLDL (Prasad 2008). Increases in VLDL may be as high as 20- to 40-fold with up to 4- to 5-fold increases in LDL (Thrall 2004). Not surprisingly, rabbits have been studied as models of hyperlipidemia. Watanabe Heritable Hyperlipidemic rabbits develop hyperlipidemia even when fed low fat diets free of cholesterol (Fox and Laird 1999).
Rabbit urine usually has a thick consistency due to the presence of mucus, sex gland secretions, and calcium carbonate crystals making voided samples often unsuitable for analysis. If necessary, urine may be collected via cystocentesis. Rabbits absorb large amounts of calcium from the gastrointestinal tract and excrete it via the kidney; thus, urine calcium concentrations are high with fractional excretion of approximately 45%, compared with <2% in other species (Thrall 2004).
Rabbits, especially young animals, are susceptible to enteropathy of unknown etiology. Stress, diet (low fiber, high carbohydrates), and pathogens (i.e., Clostridium perfringens, E. coli, and others) may play a role. Animals have varied signs, including mucoid diarrhea, abdominal distension, and anorexia. Clinical pathology profiles show very high fibrinogen and C-reactive protein and very low electrolytes. Sick rabbits tend to get very high triglycerides and may have elevated urea nitrogen and creatinine. High fiber diet, restricted feeding, antibiotics, and fluid supplementation may ameliorate the disorder.
Minipigs
Due to anatomic, histologic, and physiologic similarities with humans, minipigs have been utilized historically for cardiovascular and dermatologic studies (Swindle et al. 2012). Growing concern about use of dogs and nonhuman primates in biomedical research have fueled increasing interest in using the minipig on a more routine basis in drug development (Forster et al. 2010). There are several strains of minipigs; the Göttingen minipig is among the most studied.
Minipigs may require specialized housing, handling, and training, especially for longer duration studies. They grow very rapidly, and restricted feeding may be necessary to avoid obesity. The cranial vena cava is the preferred venipuncture site for blood sampling, though tissue contamination can cause variable sample quality. Catheterization may be helpful for repeated collections, if patency can be maintained. It is not recommended to collect blood from a port that is accessed for other purposes, such as drug delivery.
Lymphocytes are the predominant circulating leukocyte, followed by neutrophils. Relative to other species, minipigs have higher serum creatinine and variable aspartate aminotransferase (AST) activity that may be associated with muscle contamination and/or large muscle mass. They also have lower serum urea nitrogen, a feature of their rapid growth. Unlike that in other laboratory animals, serum alanine aminotransferase activity (ALT) has poor specificity for liver injury in this species due to relatively low ALT activity in liver tissue. Serum sorbitol dehydrogenase (SDH) or glutamate dehydrogenase activities (GLDH) are more useful hepatic markers. Serum gamma glutamyl transferase activity (GGT) is high in minipigs.
Golden Syrian hamsters
Hamsters have been used as alternate rodent species in special circumstances in toxicology research (Buetow, Treuting, and Van Hoosier 1999). They provide a unique model for immunological investigations. The hamster cheek pouch is an “immunologically privileged site” that lacks lymphatic drainage and has few Langerhans cells (de Arruda and Montenegro 1995). It has been studied for engraftment, implantation, and mucosal irritation testing. Because food is retained in these pouches, however, fasting may not be effective in this species and can influence clinical pathology results, such as, glucose and triglycerides. Blood samples can be collected from the jugular vein, retro-orbital venous plexus (small volume, potential tissue contamination), or via cardiac puncture for larger volumes.
Guinea pigs
With a body weight ranging from 700 g to 1,200 g, guinea pigs (or cavies; Cavia porcellus) are the largest laboratory rodents. They are unable to synthesize ascorbic acid and require vitamin C from dietary sources (Clifford and White 1999). They have been used to study atherosclerosis and the preventive role of vitamin C. Like rabbits, guinea pigs are coprophagic, eating specially produced soft fecal pellets (cecal pellets) to recycle vitamin B, fiber, and gut flora. Lymphocytes are the predominant circulating leukocyte with neutrophils (or heterophils) being the next most common leukocyte. This species has a unique leukocyte called the Kurloff cell, which is thought to be a natural killer lymphocyte (Quillec and Izarrd 1999; Hawkey and Dennett 1989). They are more common in mature/pregnant females. APTT is long in guinea pigs, relative to other species (30–40 sec). Similar to pigs and minipigs, guinea pigs have low ALT in liver; serum SDH or GLDH are more sensitive markers of liver damage. Serum GGT activity is higher than in other rodents and dogs.
Transgenic rodents
The clinical pathology of transgenic mice and rats may vary based on their genetic modifications, and it cannot be assumed that they have values similar to their parental strains. Transgenic mouse models, such as the rasH2-Tg model have received considerable attention in efforts to identify alternatives to the current long-term (2y) rodent carcinogenicity studies (Young et al. 2011). The rasH2-Tg mice have no obvious differences in clinical pathology relative to their parental strain.
Clinical Pathology of Pregnant and Growing Laboratory Animals
Anne Provencher Bolliger
Pregnancy/Gestation
Normal pregnancy in healthy animals leads to many changes in maternal physiology, including alterations in hematological, coagulation, and biochemical parameters. It is important to not confuse these changes with pathological or disease stages. The recognition of such changes in the research setting is critical to avoid association of alterations in clinical pathology data with an experimental procedure and/or administration of experimental compound and to avoid misinterpretation of results.
The most common hematological, coagulation, and clinical chemistry changes associated with pregnancy are summarized in Tables 1 and 2.
Common hematological changes associated with pregnancy in laboratory animals relative to nonpregnant animals.
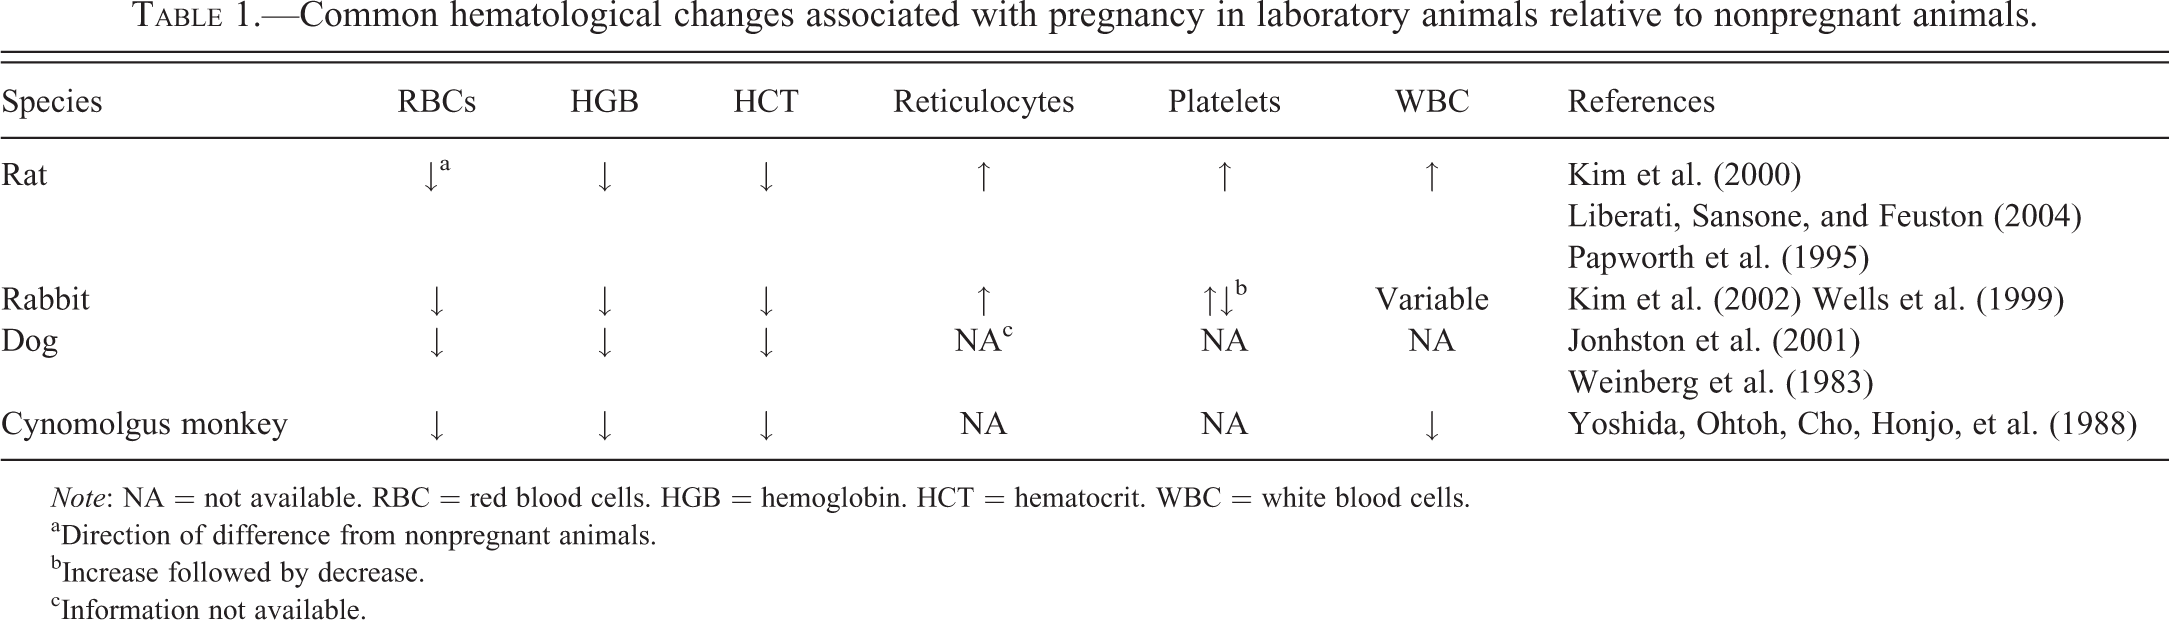
Note: NA = not available. RBC = red blood cells. HGB = hemoglobin. HCT = hematocrit. WBC = white blood cells.
aDirection of difference from nonpregnant animals.
bIncrease followed by decrease.
cInformation not available.
Common clinical chemistry changes associated with pregnancy in laboratory animals relative to nonpregnant animals.
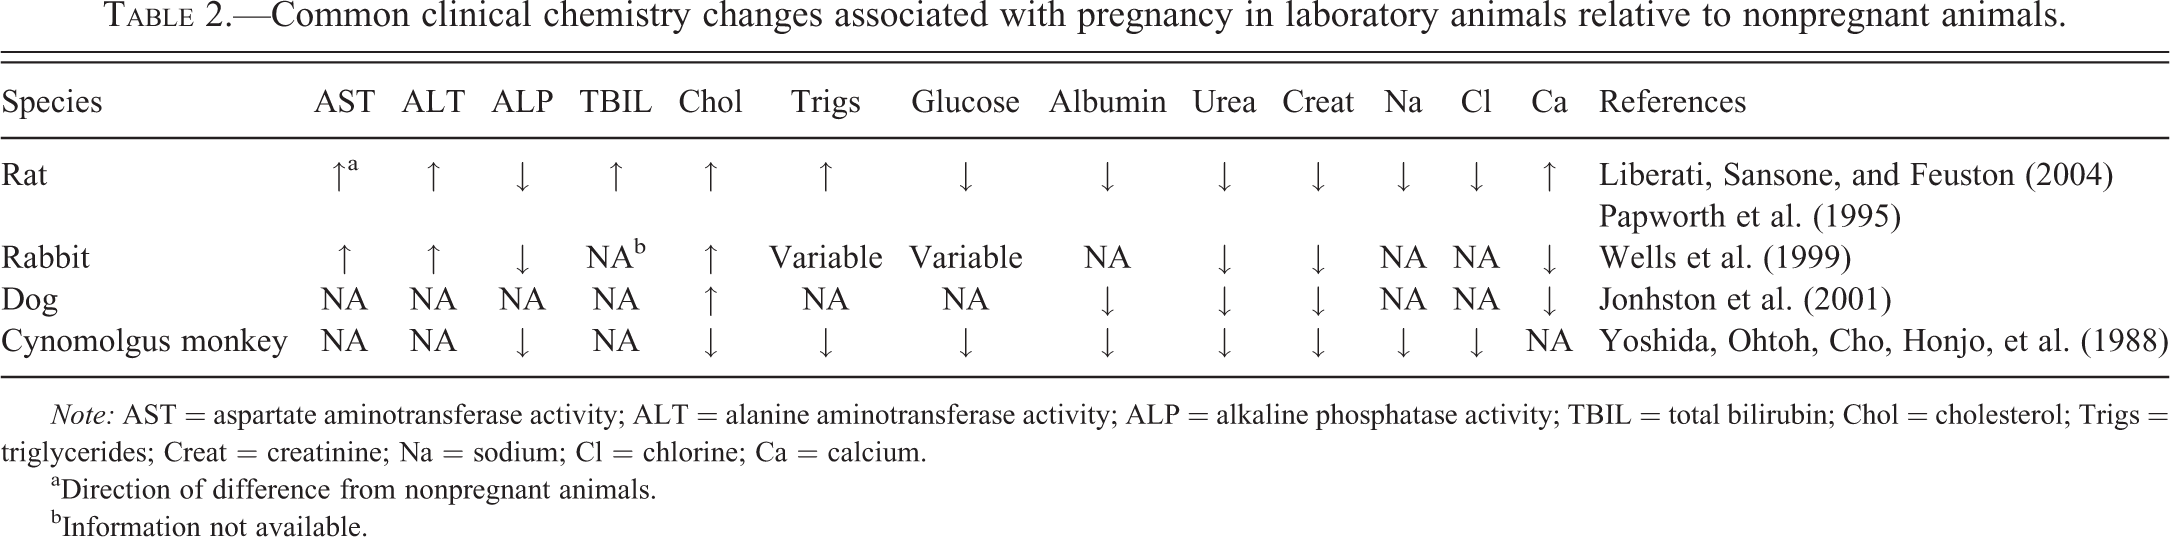
Note: AST = aspartate aminotransferase activity; ALT = alanine aminotransferase activity; ALP = alkaline phosphatase activity; TBIL = total bilirubin; Chol = cholesterol; Trigs = triglycerides; Creat = creatinine; Na = sodium; Cl = chlorine; Ca = calcium.
aDirection of difference from nonpregnant animals.
bInformation not available.
Hematology (Table 1)
Expansion of maternal blood and plasma volume is probably the most important change associated with pregnancy in humans and animals. Blood volume expansion in the expecting mother increases an average of 40 to 50% above the prepregnancy levels. As plasma volume increases, erythropoietin (EPO) levels also increase, reaching approximately 2.5 times prepregnancy levels in women, leading to increases in red blood cell (RBC) mass of up to 20 to 30% in pregnant women (Mims and Prchal 2010). Changes in RBC survival also appear during pregnancy, including reduced erythrocyte life span due to an “emergency hematopoiesis” response to elevated EPO levels (Lurie and Mamet 2000). The nonproportional increase of plasma volume versus RBC mass creates the characteristic “relative physiological anemia of pregnancy” observed in women and laboratory animals (Johnston, Kustritz, and Olson 2001; Kim et al. 2000; Kim et al. 2002; Liberati, Sansone, and Feuston 2004; Mims and Prchal 2010; Papworth and Clubb 1995; Weinberg et al. 1983; Wells et al. 1999; Yoshida, Ohtoh, Cho, Honjo, et al. 1988).
Reticulocyte concentrations in women increase in early pregnancy secondary to the increased erythropoietic activity during the first 28 weeks of gestation and decrease in late pregnancy (Howells et al. 1986). Increased reticulocyte concentrations have been observed in Sprague-Dawley (Papworth and Clubb 1995) and Wistar Hannover rats (Liberati, Sansone, and Feuston 2004). Similar observations have been reported in New Zealand white rabbits (Wells et al. 1999). Comparable trends are believed to occur in dogs and cynomolgus monkeys, though published data are limited. Studies of hematopoiesis in pregnant dogs showed increased erythroid activity in the bone marrow in comparison to nonpregnant females; no data on reticulocyte concentrations were provided (Weinberg et al. 1983).
PLT can be affected by normal pregnancy. In women, some studies describe decreased PLT in comparison to prepregnancy levels due to the physiological hemodilution secondary to increased plasma volume and/or due to increased platelet turnover, while other studies describe no significant changes (Kadir and McLintock 2011; Mims and Prchal 2010). Platelet reactivity may be increased in normal pregnant women, even if platelet number is decreased (Vincelot et al. 2001). PLT are increased in pregnant rats (Liberati, Sansone, and Feuston 2004; Kim et al. 2000) and at the beginning of gestation in New Zealand white rabbits, followed by a decrease at the end of the gestation period (Kim et al. 2002; Wells et al. 1999).
Total white blood cell (WBC) concentrations are elevated, compared to prepregnancy levels in rats, rabbits, and dogs, as well as in women (Kim et al. 2000; Kim et al. 2002; Liberati, Sansone, and Feuston 2004; Mims and Prchal 2010; Weinberg et al. 1983; Wells et al. 1999). No significant changes in WBC concentrations have been clearly described in cynomolgus monkeys. In pregnant rats, increased WBC are due to increases in neutrophil and lymphocyte concentrations (Kim et al. 2000; Liberati, Sansone, and Feuston 2004). In rabbits, published studies report an increase in lymphocyte concentrations early in gestation, followed by a decrease in lymphocyte and neutrophil concentrations with or without statistically significant changes in total WBC concentrations (Kim et al. 2002; Wells et al. 1999). Weinberg et al. (1983) reported that pregnant dogs have an increase in total WBC count during pregnancy, but did not specify the leukocyte types. A decrease in the overall granulopoietic activity of the bone marrow in dogs was observed with an increase in lymphocytic and plasmacytic activity.
Coagulation
Pregnancy is considered a hypercoagulable state, increasing the risk of thromboembolism up to 5 times in women, with increased plasma concentrations of fibrinogen, von Willebrand factor, Factors VII, VIII, and X and decreased concentrations of Factors XI and XIII (Ashwood 1994; Mims and Prchal 2010). Prothrombin time (PT) and APTT are slightly prolonged in comparison to prepregnancy values in women. Increased PT and APTT have been described in pregnant Sprague-Dawley rats (Papworth and Clubb 1995). Increased plasma levels of Factor VII, VIII, IX, and XI are reported in pregnant female dogs (Johnston, Kustritz, and Olson 2001).
Clinical Chemistry (Table 2)
Pregnancy causes changes in clinical chemistry parameters associated with renal and hepatic function and with lipid, carbohydrate, protein, and calcium metabolism.
Due to expanding plasma volume and increased renal flow and glomerular filtration rate (GFR) decreases occur in serum urea and creatinine concentrations in pregnant women (Ashwood 1994), dogs (Johnston et al. 2001), rabbits (Wells et al. 1999), and cynomolgus monkey (Yoshida, Ohtoh, Cho, Honjo, et al. 1988). Similar changes have been described in Wistar Hannover rats (Liberati, Sansone, and Feuston 2004). Sodium and water balance remain usually unchanged, but slight decreases in sodium and chloride serum concentrations have been seen in Wistar Hannover rats (Liberati et al. 2004) and in cynomolgus monkeys (Yoshida, Ohtoh, Cho, Honjo, et al. 1988). Also secondary to the increased plasma volume and hemodilution, serum albumin and/or serum total protein concentrations are decreased in pregnancy in women, Wistar Hannover rats, dogs, and cynomolgus monkeys (Ashwood 1994; Johnston, Kustritz, and Olson 2001; Liberati, Sansone, and Feuston 2004; Moore and Nelson-Piercy 2011; Yoshida, Ohtoh, Cho, and Goto 1988).
Gestation-related physiological changes affect hepatic function, altering liver enzyme activities, and carbohydrate, fat and protein metabolism. Serum ALT and AST decrease in pregnant women, which can make the diagnosis of liver abnormalities challenging as pathological increases in transaminase activities may not exceed reference intervals in pregnant women with liver disease (Ashwood 1994; Moore and Nelson-Piercy 2011). In women, serum alkaline phosphatase activity (ALP) is significantly increased, up to twice prepregnancy levels, mainly due to placental origin ALP (Ashwood 1994). In Wistar Hannover rats, increased serum AST, ALT, and total bilirubin, with decreased ALP are observed (Liberati, Sansone, and Feuston 2004). In rabbits, increased serum AST and ALT with decreased ALP are also seen (Wells et al. 1999). Decreased serum ALP activity is also observed in pregnant cynomolgus monkeys (unpublished observation).
Pregnancy leads to increased lipid mobilization from maternal adipose tissue during organogenesis. Thus, there may be variation in triglycerides and cholesterol concentrations between early pregnancy when organogenesis predominates and late stages (Ghio et al. 2011). In general, pregnant women have increased concentrations of serum triglycerides, cholesterol, and free fatty acids in comparison to prepregnancy levels (Ashwood 1994). Rats typically show increased serum cholesterol and triglyceride concentrations during gestation, with triglyceride levels up to 4 times those observed in nonpregnant rats (Liberati, Sansone, and Feuston 2004). Cholesterol is also increased in pregnant rabbits, but triglyceride concentrations are variable throughout the pregnancy, with higher levels during early stages (Wells et al. 1999). Pregnant Beagle dogs can have serum cholesterol concentrations up to 75 to 94% greater than nonpregnant dogs (Johnston, Kustritz, and Olson 2001). In contrast, cynomolgus monkeys have lower cholesterol and triglyceride concentrations (Yoshida, Ohtoh, Cho, Honjo, et al. 1988). Similar to lipids, glucose needs during pregnancy vary between early and later stages of pregnancy. Insulin resistance occurs during gestation and mild glucosuria can be observed due to decreased renal glucose threshold and increased GFR without changes in serum glucose. In rats and cynomolgus monkeys, pregnant females show decreased serum glucose levels (Liberati, Sansone, and Feuston 2004; Yoshida, Ohtoh, Cho, Honjo, et al. 1988), while rabbits have variable levels (Wells et al. 1999). Insulin resistance during pregnancy has also been observed in dogs (Johnston, Kustritz, and Olson 2001).
Although fetal needs for bone mineralization are massive, maternal bone mass is fairly well maintained during pregnancy with increased levels of parathyroid hormone and vitamin D, and increased intestinal absorption of calcium (Lees et al. 1998). Due to low albumin concentrations, total serum calcium (bound) is often low, while ionized (unbound) calcium concentrations remained unchanged. Lower total calcium concentrations have been reported in dogs and rabbits (Johnston, Kustritz, and Olson 2001; Wells et al. 1999) while slightly increased total calcium and phosphorus are reported in Wistar Hannover rats (Liberati, Sansone, and Feuston 1994).
Growth
Juvenile animals are used in drug development and toxicity studies to assess potential effects of therapeutic interventions on pediatric patients. Understanding differences between adults and young animals, as well as changes occurring during growth is essential to enable accurate interpretation of clinicopathological changes in these populations. As with pregnancy, growth causes physiological changes affecting clinical pathology parameters that should not be confused with pathology. Different changes at different growth stages/age will occur in growing animals, as the maturation of organs and systems varies with age and species. The most common clinical chemistry changes associated with growth are summarized in Table 3.
Common clinical chemistry changes associated with growth in laboratory animals.
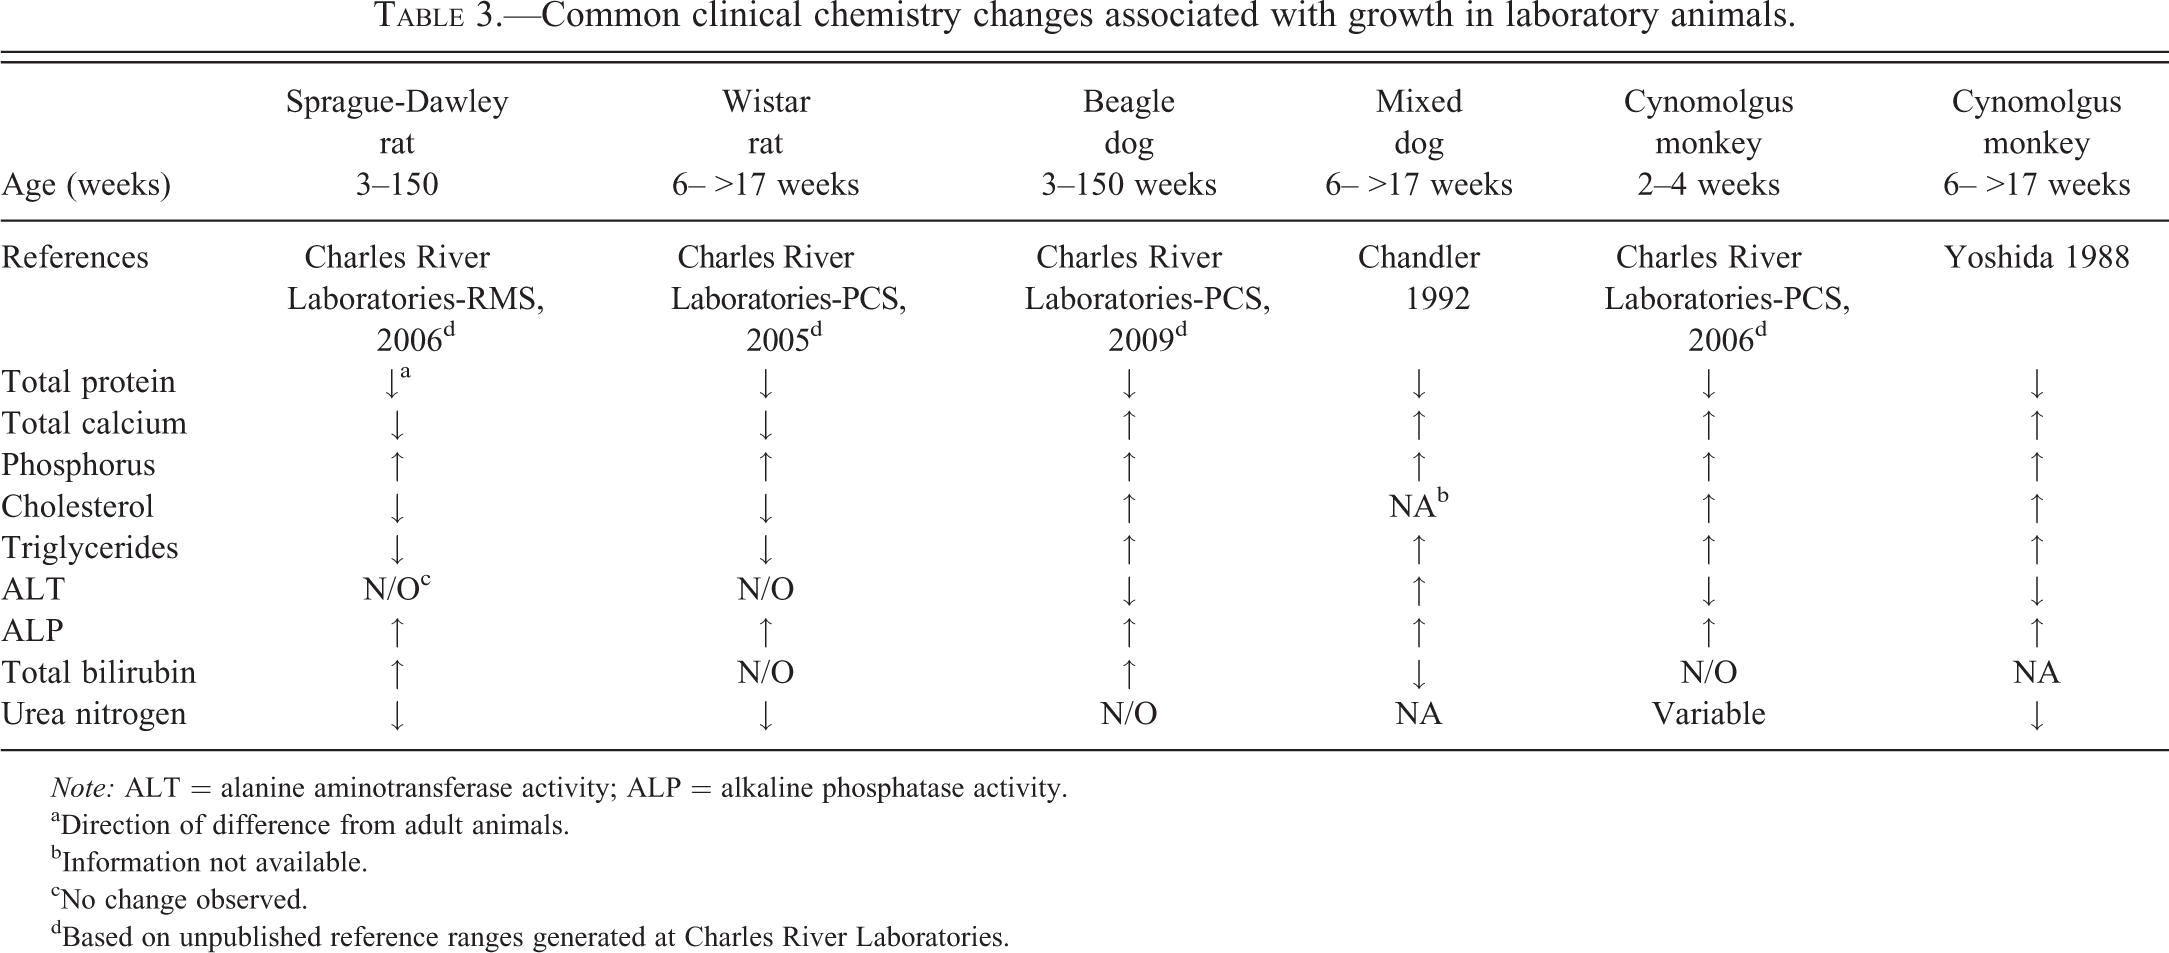
Note: ALT = alanine aminotransferase activity; ALP = alkaline phosphatase activity.
aDirection of difference from adult animals.
bInformation not available.
cNo change observed.
dBased on unpublished reference ranges generated at Charles River Laboratories.
Hematology
Relative to adults, newborn humans usually have similar or slightly higher RBC count, hemoglobin (HGB), and hematocrit (HCT) values with macrocytic, normocytic RBCs, polychromasia, few nucleated RBCs, and some fragmented RBCs (Palis and Segel 2010). In neonatal dogs, EPO levels are low and RBC life span is decreased. RBC production also decreases 5 to 8 weeks after birth, leading to the physiological anemia of the newborn/young. Erythrocyte values usually reach adult values around sexual maturity in animals (Chandler 1992). In Borzoi and Beagle puppies, HCT declines immediately after birth until week 6, then increases to adult levels by week 8 (Rosset et al. 2012).
In humans, WBC concentrations are higher in newborns than in adults, due mainly to higher neutrophil concentrations. With age, the proportion of neutrophils decreases and an increase in lymphocyte concentrations is observed (Palis and Segel 2010). Growing rats show higher lymphocyte and neutrophil concentrations early in life in comparison to adult animals; the proportion of neutrophils decreases until maturity (Provencher Bolliger and Everds 2010). Young dogs also have higher total WBC concentrations relative to adults, particularly during the first 8 weeks of age (Harper et al. 2003).
PLT have been reported to be similar in newborn and adults (Palis and Segel 2010). There are no published reports about significant differences in PLT in growing and adult animals.
Coagulation
After birth, many organs/systems are not fully mature, including the liver. In young animals, immature liver function can lead to partial coagulation factor deficiencies and associated prolongation in coagulation times (Johnston, Kustritz, and Olson 2010), but this phenomenon is rarely encountered in laboratory animal species. There are no published reports describing specific variations in coagulation tests in young animals.
Clinical Chemistry
Changes in clinical chemistry parameters are variable and depend on the growth/developmental stages of organs/systems as well as with the species, nutritional status, housing, and environmental conditions. The most common systems with developmental differences in clinical chemistry parameters are hepatic, renal, and skeletal.
Humans and animals are born with an immature hepatic microsomal enzyme system. Hepatic maturity is reached quite early in life, that is, 5 to 8 weeks in dogs, but young animals typically have lower serum albumin concentrations and lower glycogen stores that make them susceptible to hypoglycemia (Johnston, Kustritz, and Olson 2010; Rosset et al. 2012). The development of the renal system may be associated with lower GFR in young animals in comparison to adults. In neonatal dogs, higher urea levels at birth and 1 week of age can result from dehydration because nephrogenesis is incomplete until 3 weeks of age. Lower serum creatinine concentrations in young puppies may be attributed to their lower muscle mass (Rosset et al. 2012). Serum concentrations of calcium (total and unbound), phosphorus, magnesium, and ALP are affected by skeletal system development. Increased ALP activity can be due to bone growth as well as colostrum ingestion in dogs (Rosset et al. 2012). Table 3 illustrates comparison of reference ranges and published data for young and adult laboratory animals.
Regulatory aspects
The use of pregnant and juvenile animals in drug development is regulated by health authorities’ guidance documents. It is beyond the scope of this article to review such guidance, but these animal populations are used in the development of pharmaceuticals intended for both human and veterinary applications. Juvenile animal studies are usually required when previous animal and/or adult human safety data are insufficient to support pediatric clinical trials. In veterinary drug development, the use of juvenile animals is needed if the product tested is intended for use in young/immature animals.
Summary
Physiological changes can lead to variations in clinical pathology parameters during pregnancy and growth of animals. These changes should not be confused with pathological or disease states. When evaluating clinical pathology data, the reproductive/growth status of the animals should be taken into consideration to avoid misinterpretation of results. Reference ranges for specific stages should be used and if not available, variation in clinical pathology parameters associated with reproductive/growth stages must be acknowledged and considered. Differences between animal species and humans need to be considered when extrapolation to pediatric or juvenile populations is important as reproduction and systems maturation are not always identical.
Case Studies in Toxicologic Hematology: Advia® Hematology Analyzer
Case Study 1: Thrombocytopenia, Anemia, and RBC/PLT Gating
Nancy Everds and David Zelmanovic
Introduction
The Siemens Advia® hematology analyzer enumerates and sizes platelets and RBCs in a single flow chamber. It discriminates between platelets and RBCs by size and refractive index; the latter is linearly related to the concentration of nonaqueous components of platelets and red cells. Unique compound effects on blood cells in a nonclinical cynomolgus monkey safety study lead to inaccurate platelet and RBC gating by the Advia® hematology analyzer. Indications of incorrect gating were gleaned from various cytograms and histograms (displays) available on the instrument display and/or printout, and from inconsistencies among related parameters (instrument-generated and microscopic). The instrument’s raw data (*.rd) files were examined to confirm whether or not incorrect gating occurred. Re-gating was used to successfully enumerate and classify RBCs and platelets.
Discrimination between platelets and RBCs
Discrimination by the Advia® between platelets and RBCs can present difficulties under extreme conditions, since both cells are small and anucleate. Under such conditions, very large platelets overlap in size with very small RBCs or RBC fragments, and the refractive index of hypochromic RBCs can overlap with the upper end of the refractive index range assigned to platelets. These areas of overlap between RBC and platelet characteristics can result in erroneous gating. Microcytic hypochromic RBCs may be classified as platelets due to this overlap in size and refractive index. These RBCs fall in the high end of the refractive index and volume ranges for platelets, and erroneously increase platelet count and mean platelet volume (MPV). The presence of fragments of RBCs (cells less than about 30 fl, but with normal hemoglobin content) triggers an algorithm in the instrument software that determines if RBC fragments are causing interference with the PLT. If the ratio of RBC fragments to PLT is >0.25, then the algorithm assumes that cells falling in the area of large platelets are actually RBCs and these are excluded from the PLT.
Study conditions causing erroneous results
A nonclinical safety study was conducted in male and female cynomolgus monkeys at doses of 10, 50, and 300 mg/kg subcutaneously and 300 mg/kg intravenously (Everds et al. 2013). Animals dosed at ≥50 mg/kg had unexpected acute profound thrombocytopenia (nadir ∼3.0 × 10³ platelets/µl), sometimes with mild to marked decreases in red cell mass. Additionally, large platelets and spherocytes were identified on blood smears. Although Advia®-determined RBC fragment concentrations were low in this study, the ratio of RBC fragments to PLT was sometimes >0.25 in samples with markedly decreased PLT. Under these conditions, large platelets with signals that normally appear in the RBC cytogram were incorrectly excluded from the determination of PLT, MPV, and related parameters.
Hematology results from blood samples evaluated on this study were analyzed for potential inaccurate gating by the analyzer. Data, including raw data files, were evaluated for the presence of interfering microcytic hypochromic RBCs and/or RBC fragments. Modifications to the hematology analyzer software made by the author (D.Z.) were used to modify gates to more accurately quantify cell populations and characteristics. All raw data files were rerun on this Advia® software using the modified gating for refractive index discussed subsequently and with the RBC fragments correction turned off. Numeric data, scatter plots, and histograms for the original results were compared to those generated by the reanalysis (see Supplemental data: Figures 1–2 for representative screen shots).
Microcytic hypochromic RBCs
The influence of microcytic hypochromic RBCs was evaluated by analyzing scatter plots and histograms for platelets and RBCs (Supplemental data: Figure 1). A sharp truncation on the left-hand side of the V/HC (tic-tac-toe) scatter plot, corresponding gating in the RBC scatter plot, and bimodal distribution of the platelet histogram indicated that microcytic hypochromic RBCs were being excluded from the RBC count, and were incorrectly counted as platelets. This caused artifactual increases in PLT and MPV in some animals. The default refractive index upper limit used by the instrument for cynomolgus monkeys is higher than is necessary to include all platelets. Therefore, in samples containing microcytic hypochromic RBCs, cells can be re-gated using a lower refractive index upper limit to more accurately enumerate platelets. To exclude these RBCs from PLT, the gating of the refractive index range assigned to large platelets was shifted from 1.35–1.40 to 1.33–1.375. This gating was chosen based on RBC and platelet scatter plots. Review of the resulting V/HC plots, RBC scatter plots, and PLT histograms indicated that this correction eliminated interference of PLT count and MPV by microcytic hypochromic RBCs.
RBC fragments
The possible influence of RBC fragments was evaluated by determining values with and without inclusion of the correction factor for RBC fragments (Supplemental data: Figure 2). Because of the low number of RBC fragments, exclusion of these cells did not influence PLT. However, the RBC fragment correction resulted in exclusion of large (∼ < 20 fl) platelets from the MPV determination (erroneously lowering the MPV). Examination of the RBC scattergram indicated that the signals in the RBC fragment region did not overlap those in the large PLT region, so that the large PLT signals were erroneously excluded. Because the RBC fragment correction did not change PLT but erroneously interfered with MPV determination, the data were reanalyzed by suppressing the RBC fragment correction.
Results and conclusion
Of the hematologic parameters measured on this study, relevant changes after re-gating occurred only for PLT, MPV, and mean platelet component (MPC; Supplemental Data: Figure 3). Platelet parameters were considered different from controls if they were ±10% (PLT and MPC) or ±12% (MPV) from the original values; cutoffs were based on visual examination. Platelet parameters were erroneous for high-dose animals primarily. The application of the RBC fragment correction excluded large platelets but did not have a significant effect on PLT. Therefore, disabling the RBC fragment correction resulted in more accurate determination of MPV without impacting other parameters.
Because blood contains RBCs in large excess of platelets, the reclassification of some red cells as platelets and some platelets as red cells did not affect red cell values to a degree that would affect interpretation. Changing the large platelet refractive index range reduces reported PLT and MPV values in cases where hypochromic microcytic RBCs would otherwise falsely elevate both parameters. The large negative percentage changes seen in Supplemental Data Figure 3A and B correspond to this affect. Disabling the RBC fragment correction algorithm for the samples in this study resulted in the inclusion of large platelets, which would otherwise be falsely excluded. The large positive percentage changes in Supplemental Data Figure 3A and B correspond to the disabling of this correction factor.
Case Study 2: Atypical Wistar Rat RBC Channel Cytograms from the Advia® Hematology System
Florence Poitout and David Zelmanovic
Introduction
Whole blood from Wistar rats obtained from the jugular vein or the abdominal aorta, collected in potassium ethylene diaminetetraacetate (EDTA) anticoagulant, and analyzed on the Siemens Advia® 120 Hematology System using multispecies software, inconsistently generates distinctive atypical RBC channel cytograms (Supplemental Figure 4). In the absence of any reticulocytosis, the red cell volume distribution width (RDW) may be abnormally elevated above reference ranges, while the mean corpuscular volume (MCV) may also be slightly elevated (Poitout, Lourdel, and Zelmanovic 2009).
Results
On further interrogation, there was no difference in treatment, diet, sex, or sampling conditions between individuals with atypical cytograms and those with normal cytograms. Furthermore, atypical cytograms were reproducible on different Advia® hematology analyzers, and persisted over several months in the same individual. All rats studied were of 2 different strains (Wistar Hannover and Imamichi) and 2 different sources. Atypical features were unlikely due to the presence of cold agglutinins, as they persisted after incubation of blood samples in a 37°C water bath. Anticoagulant-dependent agglutination was also ruled out, as atypical features persisted when sampling blood in heparin (Schaefer et al. 2009). There was no evidence of RBC agglutination or macrocytosis on blood smears. Crossmatching plasma and washed red cells from 1 Wistar rat presenting atypical features and 1 Wistar rat presenting normal red cell cytogram did not modify the distribution of red cells of either rat. Therefore, changes observed were unlikely due to the presence of circulating antibodies.
When comparing RDW through the instrument’s reticulocyte channel with RDW through the RBC channel, the RDW was significantly lower in the reticulocyte channel. A similar difference, but of lower magnitude was noted between MCV (RTC MCV) and MCV, and between RBC (RTC RBC) and RBC, although these differences were often negligible. Finally, dilution of washed RBCs from a Wistar rat presenting atypical features showed no agglutination with saline or reticulocyte reagent; however, agglutination was observed when washed RBCs were diluted with the instrument’s red cell reagent.
Conclusion
It was concluded that the glutaraldehyde present in the ADVIA® RBC reagent but absent in the reticulocyte reagent may modify the red cell membrane in some Wistar rats and facilitate agglutination of their RBCs. These atypical cytogram patterns indicate RBC multiplets in the counting medium and, in these situations, gated RDW, MCV, and/or RBC values measured by the reticulocyte channel should be reported instead to provide accurate measurements.
Case Study 3: Atypical Mouse Peroxidase Channel Cytograms of the Advia® Hematology System
Denise Bounous and Debra Wescott
Introduction
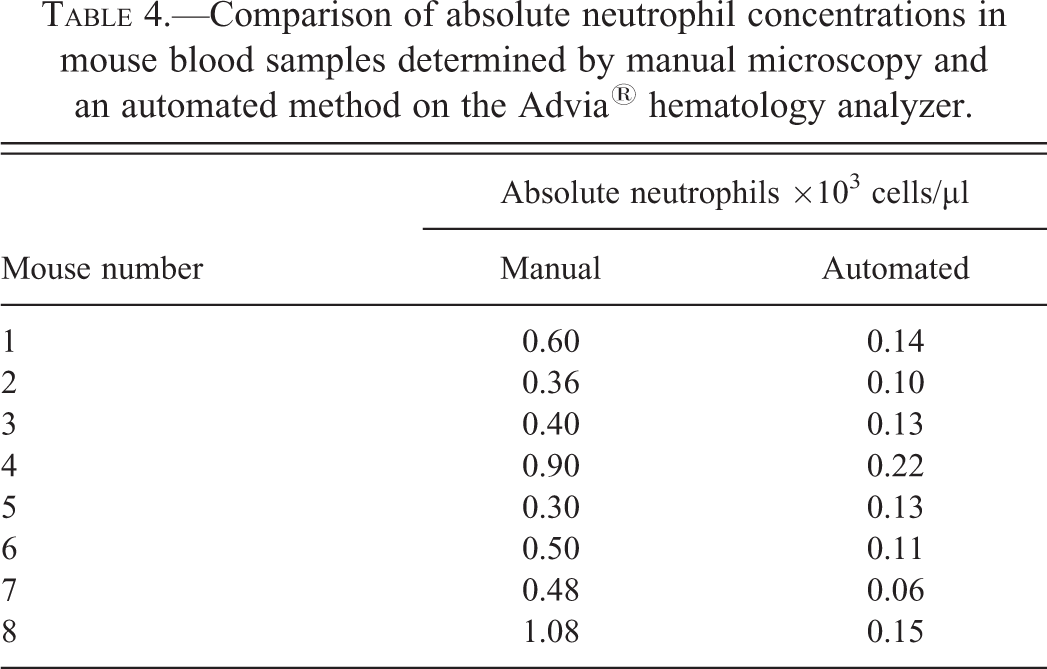
To assess the neutrophil count in a new transgenic mouse disease model, whole blood from the vena cava was collected from a set of mice into potassium EDTA (Capijects®, 500 µl) and analyzed on the Advia® 2120i automated hematology analyzer. Platelet clumping was identified in the first submitted samples, resulting in an inaccurate differential count because the platelet clumps were counted in the eosinophil region of the automated differential histogram (Supplemental Data Figure 5). Therefore, manual microscopic smear differential concentrations were reported. The mean absolute neutrophil count from this first manually evaluated submission for these mice was 2.6 × 10³ cells/µl, which is within typical reference intervals for mice.
To prevent platelet clumping in future submissions, the collection and submission process was optimized by adding an additional 10 µl of EDTA, more vigorous mixing, and avoiding direct contact with ice. A second cohort of mice was bled and samples were analyzed on the instrument. Under these optimized conditions, no platelet clumping occurred and there were no data or instrument flags reported by the instrument, thus automated differential results were reported. The mean absolute neutrophil count from this second submission was 0.13 × 10³ cells/µl, indicating a severe neutropenia with a moderate (mean) lymphocytosis of 9.33 × 10³ (Supplemental Data Figure 6).
Results
Upon further discussion with the investigator, it was revealed that these transgenic mice were myeloperoxidase knockout mice (MPO-KO; Jackson Laboratory, B6.129X1-Mpotm1Lus /J). The methodology for automated differentials on the Advia® 2120i requires peroxidase staining, resulting in various degrees of “scatter” necessary for accurate cell categorization. The size of the cell is also measured. By evaluating size and scatter of individual cells, concentrations of leukocyte subsets can be determined and graphically displayed as regions of a histogram. Because MPO-KO mice have no peroxidase granules, all cells were counted as low scatter and medium cell size and erroneously classified as lymphocytes (Supplemental Data Figure 7).
The second submission was reevaluated microscopically and compared to the respective automated result. Manual leukocyte differential results showed higher numbers of neutrophils compared to the automated results and were in accordance with expected values for mice (Table 4).
Comparison of absolute neutrophil concentrations in mouse blood samples determined by manual microscopy and an automated method on the Advia® hematology analyzer.
Conclusion
Submission of hematology samples from this particular transgenic mouse model presented with two issues: one was a collection artifact and the other was an inherent unique characteristic of the mouse model. The collection artifact of clumped platelets is commonly seen in submissions of blood from mice in our experience. However, because the samples were submitted without a sufficient description of the study or the mice model, the laboratory was obligated to resolve the hematology issue by examination and diagnosis of the abnormalities in the histograms. This case highlights the importance of sharing detailed information with the laboratory about the samples that are analyzed and the value of manual microscopy in comprehensive hematology evaluation.
Supplemental Material
sj-tif-1-tpx-10.1177_0192623314522109 – Supplemental material for Nontraditional Applications in Clinical Pathology
Supplemental material, sj-tif-1-tpx-10.1177_0192623314522109 for Nontraditional Applications in Clinical Pathology by Holly L. Jordan, Thomas C. Register, Niraj K. Tripathi, Anne Provencher Bolliger, Nancy Everds, David Zelmanovic, Florence Poitout, Denise I. Bounous, Debra Wescott and Shashi K. Ramaiah in Toxicologic Pathology
Supplemental Material
sj-tif-2-tpx-10.1177_0192623314522109 – Supplemental material for Nontraditional Applications in Clinical Pathology
Supplemental material, sj-tif-2-tpx-10.1177_0192623314522109 for Nontraditional Applications in Clinical Pathology by Holly L. Jordan, Thomas C. Register, Niraj K. Tripathi, Anne Provencher Bolliger, Nancy Everds, David Zelmanovic, Florence Poitout, Denise I. Bounous, Debra Wescott and Shashi K. Ramaiah in Toxicologic Pathology
Supplemental Material
sj-eps-3-tpx-10.1177_0192623314522109 – Supplemental material for Nontraditional Applications in Clinical Pathology
Supplemental material, sj-eps-3-tpx-10.1177_0192623314522109 for Nontraditional Applications in Clinical Pathology by Holly L. Jordan, Thomas C. Register, Niraj K. Tripathi, Anne Provencher Bolliger, Nancy Everds, David Zelmanovic, Florence Poitout, Denise I. Bounous, Debra Wescott and Shashi K. Ramaiah in Toxicologic Pathology
Supplemental Material
sj-tif-4-tpx-10.1177_0192623314522109 – Supplemental material for Nontraditional Applications in Clinical Pathology
Supplemental material, sj-tif-4-tpx-10.1177_0192623314522109 for Nontraditional Applications in Clinical Pathology by Holly L. Jordan, Thomas C. Register, Niraj K. Tripathi, Anne Provencher Bolliger, Nancy Everds, David Zelmanovic, Florence Poitout, Denise I. Bounous, Debra Wescott and Shashi K. Ramaiah in Toxicologic Pathology
Supplemental Material
sj-tif-5-tpx-10.1177_0192623314522109 – Supplemental material for Nontraditional Applications in Clinical Pathology
Supplemental material, sj-tif-5-tpx-10.1177_0192623314522109 for Nontraditional Applications in Clinical Pathology by Holly L. Jordan, Thomas C. Register, Niraj K. Tripathi, Anne Provencher Bolliger, Nancy Everds, David Zelmanovic, Florence Poitout, Denise I. Bounous, Debra Wescott and Shashi K. Ramaiah in Toxicologic Pathology
Supplemental Material
sj-tif-6-tpx-10.1177_0192623314522109 – Supplemental material for Nontraditional Applications in Clinical Pathology
Supplemental material, sj-tif-6-tpx-10.1177_0192623314522109 for Nontraditional Applications in Clinical Pathology by Holly L. Jordan, Thomas C. Register, Niraj K. Tripathi, Anne Provencher Bolliger, Nancy Everds, David Zelmanovic, Florence Poitout, Denise I. Bounous, Debra Wescott and Shashi K. Ramaiah in Toxicologic Pathology
Supplemental Material
sj-tif-7-tpx-10.1177_0192623314522109 – Supplemental material for Nontraditional Applications in Clinical Pathology
Supplemental material, sj-tif-7-tpx-10.1177_0192623314522109 for Nontraditional Applications in Clinical Pathology by Holly L. Jordan, Thomas C. Register, Niraj K. Tripathi, Anne Provencher Bolliger, Nancy Everds, David Zelmanovic, Florence Poitout, Denise I. Bounous, Debra Wescott and Shashi K. Ramaiah in Toxicologic Pathology
Supplemental Material
sj-tif-8-tpx-10.1177_0192623314522109 – Supplemental material for Nontraditional Applications in Clinical Pathology
Supplemental material, sj-tif-8-tpx-10.1177_0192623314522109 for Nontraditional Applications in Clinical Pathology by Holly L. Jordan, Thomas C. Register, Niraj K. Tripathi, Anne Provencher Bolliger, Nancy Everds, David Zelmanovic, Florence Poitout, Denise I. Bounous, Debra Wescott and Shashi K. Ramaiah in Toxicologic Pathology
Supplemental Material
sj-pdf-9-tpx-10.1177_0192623314522109 – Supplemental material for Nontraditional Applications in Clinical Pathology
Supplemental material, sj-pdf-9-tpx-10.1177_0192623314522109 for Nontraditional Applications in Clinical Pathology by Holly L. Jordan, Thomas C. Register, Niraj K. Tripathi, Anne Provencher Bolliger, Nancy Everds, David Zelmanovic, Florence Poitout, Denise I. Bounous, Debra Wescott and Shashi K. Ramaiah in Toxicologic Pathology
Footnotes
Authors’ Note
Dr. Poitout’s contribution was presented in 2009 at the AVCP 44th Annual Meeting, Monterey, CA and in the associated abstract published in Vet Clin Pathol, 38 Suppl, s1 E10.
The author(s) declared no potential conflicts of interest with respect to the research, authorship, and/or publication of this article.
The author(s) received no financial support for the research, authorship, and/or publication of this article.
Abbreviations
References
Supplementary Material
Please find the following supplemental material available below.
For Open Access articles published under a Creative Commons License, all supplemental material carries the same license as the article it is associated with.
For non-Open Access articles published, all supplemental material carries a non-exclusive license, and permission requests for re-use of supplemental material or any part of supplemental material shall be sent directly to the copyright owner as specified in the copyright notice associated with the article.