
Abstract
Thionamides such as propylthiouracil (PTU) and methimazole (MMI) have been used for more than 50 years to treat the more common causes of thyrotoxicosis/hyperthyroidism such as Graves’ disease. Serious adverse effects associated with thionamides in humans include idiosyncratic liver damage, agranulocytosis, aplastic anemia, and vasculitis. Both prospective and retrospective clinical studies with these drugs have failed to identify predictive biomarker for these adverse effects. To assess whether rat is a good model for predicting drug-related adverse events in the liver and in the bone marrow, we conducted a comprehensive study in male rats with multiple doses of PTU and MMI. As expected, euthyroid animals became hypothyroid along with several secondary changes associated with hypothyroidism. There were slight reductions in red blood cell parameters along with some marginal effects on the bone marrow elements. However, there was no evidence of significant neutropenia and liver injury in both PTU-treated and MMI-treated cohorts. MMI-related effects were noted in the seminiferous tubules of the testes. Overall, 1-month daily treatment of euthyroid rats with PTU or MMI resulted in hypothyroidism, minor bone marrow effects, and several secondary effects associated with hypothyroidism, but without any evidence of adverse effects reported in humans including liver injury and agranulocytosis.
Keywords
Introduction
Treatment options for thyrotoxicosis (hyperthyroidism) include antithyroid drugs, radioiodine therapy, or thyroidectomy. Thionamides such as propylthiouracil (PTU) and methimazole (MMI) have been used in children and adults for more than 50 years to treat Graves’ disease, a common cause of thyrotoxicosis/hyperthyroidism (Astwood 1984). These drugs inhibit thyroid hormone synthesis by interfering with the thyroid peroxidase (TPO)-mediated iodination of tyrosine residues in thyroglobulin (Alexander 1959). PTU and MMI were approved by Food and Drug Administration (FDA) in 1947 and 1950, respectively, after the observation that treatment of euthyroid rats with thionamide compounds resulted in hypothyroidism/goiter (Rivkees and Mattison 2009; Rivkees, Stephenson, and Dinauer 2010). PTU and MMI have been extensively used throughout the world with preferential usage of MMI over PTU. In the last 17 years in the United States, MMI prescription has seen an 800% increase while PTU market share has been on the decline (Emiliano et al. 2010). MMI is 10-fold more potent than PTU with a longer half-life and MMI’s dose recommendation is a tenth of that of PTU’s dosage (Cooper 1986; Rivkees 2006). Moreover, MMI has comparatively better drug safety profile than PTU (Rivkees and Mattison 2009).
Serious adverse effects associated with thionamides include idiosyncratic liver damage, agranulocytosis, aplastic anemia, and vasculitis (Bandyopadhyay, Biswas, and Banerjee 2002). Besides their inhibitory effect against TPO, thionamides are known to inhibit, to varying extents, other peroxidases such as myeloperoxidase, lactoperoxidase, and gastric peroxidase resulting in associated adverse effects in a certain subpopulation of patients (Bandyopadhyay, Biswas, and Banerjee 2002). Although FDA had categorized both PTU and MMI as class D drugs (with risk to fetus), a recent joint workshop has recommended the use of PTU as a second line of therapy to MMI in patients with allergic responses to MMI except for patients in their first trimester of pregnancy (Cooper 2005).
Both prospective and retrospective clinical studies with these drugs have failed to identify predictive biomarker(s) for the adverse effects noted in a subset of patients. A recent meeting jointly sponsored by FDA and American Thyroid Association called for further studies to clearly define risks associated with PTU and MMI (Bahn et al. 2009). Moreover, rigorous toxicology data in preclinical species are also limited for these compounds as both PTU and MMI were approved in the 1950s. There are several acute and subacute studies in rodents with PTU and MMI that have looked at specific effects on thyroid glands and the thyroid axis. Administration of MMI to pregnant rats and their offspring resulted in a decreased red blood cell (RBC) count, hemoglobin concentration, and hematocrit along with a few other altered serum biochemical parameters in both the dams and their pups (Amara et al. 2011). Another recent report in rats that were administered PTU and MMI for a month described alterations in select hematologic/serum biochemical parameters including neutropenia, increased alanine aminotransferase (ALT), and aspartate aminotransferase (AST; Abou-Auda and Abou-Shaaban 2006). However, comprehensive organ toxicity data including histopathology are not available in the current literature for the thionamide drugs. Here, we report a comprehensive 1-month toxicology study in male rats with multiple doses of PTU and MMI. The objectives were to identify the off-target effects and identify any potential test article–related effects that may help predict adverse outcomes in human patients.
Materials and Methods
Study Design
Male Wistar Han IGS (Crl:WI [Han]) rats (8 rats/dose group), 6 to 8 weeks old at initiation of dosing were administered PTU or MMI at 1, 20, and 200 mg/kg/day. The high dose for MMI (200 mg/kg/day) was reduced to 100 mg/kg/day/day on day 9 following a 1-day dose holiday due to severe weight loss observed in this group. The rats were housed individually in polycarbonate cages and fed ad libitum with a certified rodent diet. Doses were administered via oral gavage once daily for 1 month. The dose volume for all animals was 10 ml/kg based on the most recent individual body weight. A similar group of 8 rats received 0.5% methylcellulose and served as a control. All animals were weighed prior to dosing on days 1, 4, 7, 10, 14, 17, 21, 24, and 28 and fasted overnight prior to necropsy. Individual food consumption for all animals was recorded on days 1, 4, 7, 10, 14, 17, 21, 24, and 28. Plasma PTU and MMI concentrations for toxicokinetic (TK) analyses were measured from a satellite group of 4 rats/dose group on day 1 and day 28 at 1-, 4-, 7-, and 24-hr postdose. This study was conducted at Pfizer Global Research and Development, Groton, Connecticut, in accordance with the current guidelines for animal welfare (ILAR Guide for the Care and Use of Laboratory Animals, 1996). The procedures used in this study were approved by Institutional Animal Care and Use Committee.
Gross and Microscopic Examination
Rats were fasted overnight and euthanized on day 29/30 by CO2 anesthesia followed by exsanguination. After complete gross observation, the following tissues were collected for microscopic examination: thyroid glands, bone marrow, brain, stomach, duodenum, jejunum, heart, lung, liver, kidney, mesentery, spleen, eye, testis, and epididymis. Terminal body weights along with absolute liver, brain, spleen, and thyroid weights were obtained, and organ-to-body weight ratio calculated. Representative samples of collected organs were fixed in 10% formalin except for eye and optic nerve (3% glutaraldehyde) and testis/epididymis (modified Davidson’s). All tissues were paraffin-embedded and stained with hematoxylin and eosin and evaluated by a board certified veterinary pathologist (P.R.N.).
Clinical Pathology
Approximately 0.5 ml of whole blood (ethylenediaminetetraacetic acid [EDTA]) was collected for hematology and 1.1 ml of blood in serum separator tubes for clinical chemistry and serum biomarkers at necropsy on days 29 (for PTU) and 30 (for MMI).
Complete blood counts were performed on an Advia 120 analyzer (Siemens Healthcare Diagnostics, Deerfield, Illinois). Clinical chemistry parameter assessments were done on an Advia 2400 Chemistry System (Siemens Healthcare Diagnostics) using standard reagents and techniques. Thyroxine (T4) and thyroid-stimulating hormone (TSH) were measured on the Immulite analyzer (Siemens Healthcare Diagnostics) using reagents that were developed to assess human T4 and TSH but have been shown to cross react in the rat. The triiodothyronine (T3) was measured using a radiometric competitive binding technique where the specimen antibody–antigen complex is separated from the unbound reaction components and quantitated against a standard curve using a Wizard 1470 gamma counter (Perkin Elmer, Waltham, Massachusetts).
TK Analysis
Approximately 0.35 ml of whole blood in dipotassium EDTA was collected for TK analysis. Blood samples were stored on wet ice until centrifuged to obtain plasma, and the plasma was then stored at −20°C until analysis. Plasma samples were evaluated at 1-, 4-, 7-, and 24-hr postdose on days 1 and 28 for determination of maximum plasma concentration (Cmax), time to Cmax, and area under the plasma concentration time curve (AUC).
Plasma samples were analyzed via liquid chromatography/mass spectrometry using AB Sciex Analyst (AB Sciex, Foster City, California), and a plasma concentration versus time profile was generated for each animal. Lower limit of quantification for PTU and MMI was 25 ng/ml. Plasma concentrations below the limit of quantitation were assumed to be zero for mean calculations. The AUC from time zero to the last sampling time point (tlast), AUC0−tlast, was calculated using the linear trapezoid rule within Thermo Scientific Watson v7.2 (Thermo Fisher Scientific, Waltham, Massachusetts). The Cmax and the time at which it was observed (Tmax) following oral dosing were determined directly from the plasma concentration time profile.
Quantitative Bone Marrow Evaluation
The femurs were collected at necropsy immediately after euthanasia and after cutting the proximal and distal ends, the bone marrow was flushed out of the femoral shaft using fetal bovine serum. After washing with phosphate-buffered saline, the cells were dispersed into a single cell suspension with a pipette and counted on an Advia 120 hematology analyzer (Siemens Healthcare Diagnostics). A dichlorofluorescein/antibody staining technique was performed, and then the specimens were analyzed on a Coulter FC 500 flow cytometer (Beckman Coulter, Brea, California) to differentiate the major cells population (Criswell et al. 1998). Cytospins were also prepared from the bone marrow cell suspensions.
Statistical Analysis
The statistical analyses for all comparisons made in this study were performed using either parametric or nonparametric methods. Additionally, testing for each parameter at posttreatment time points was either one-sided for increases, one-sided for decreases, or two-sided. These choices were prespecified for each parameter. At posttreatment time points, except for a few instances, the “parametric” parameters were analyzed via the E-bar Square trend test, and the “nonparametric” parameters were analyzed via the Chi-bar Square trend test after transforming to ranks. Only statistically significant changes are reported in the results as fold changes in comparison with controls.
Results
Clinical Signs and Mortality
A few nonspecific clinical signs were observed in PTU- and MMI-treated rats at various time points of the treatment. These included decreased skin turgor, hunched posture, rough hair coat, and/or decreased activity at doses ≥20 mg/kg/day (for PTU) and at 200/100 mg/kg/day (for MMI).
An individual rat given MMI at 200/100 mg/kg/day was euthanized early (day 24) due to morbidity associated with findings of distended urinary bladder, hemorrhagic cystitis, and gastric erosions/hemorrhages (obstructive urolithiasis with secondary changes such as renal tubular dilatation and degeneration).
Body Weight and Food Consumption
PTU and MMI treatment was associated with dose-related decreases in body weight and food consumption (Table 1). For the PTU-treated cohorts, reduced body weight (0.76–0.81× control mean) noted at ≥20 mg/kg/day was associated with decreased food consumption (0.58–0.8× control mean). Similar decreases in body weight (0.64–0.75× control mean) and food consumption (0.45–0.69× control mean) were also noted at ≥20 mg/kg/day in the MMI-treated cohorts.
Body weight and food consumption in SD rats during the treatment propylthiouracil and methimazole.
Note: SD = Sprague-Dawley. Values expressed as means and standard deviation.
Statistical difference from control mean expressed as p values: *p < .05. ***p < .005, ****p < .001.
Clinical Pathology
Several alterations in select serum chemistry parameters were noted in both PTU-treated and MMI-treated groups. These changes were primarily in the thyroid hormones along with several alterations in blood urea nitrogen (BUN), creatinine, liver enzymes, serum proteins, and select serum electrolytes.
Thyroid Hormones
Treatment with PTU at doses ≥1 mg/kg/day resulted in moderate to marked decreases in T4 and T3 hormones (0.10–0.45× control mean at day 29) with concomitant increases in TSH (1.56–1.69× from control mean at day 29; Figure 1). MMI treatment was associated with similar changes including minimal to marked decreases in T4 (0.11–0.86× control mean at day 30) at doses ≥1 mg/kg/day with concomitant increases in TSH (1.57–117.8× control means at day 30; Figure 2). Decreases in T3 (0.27–0.79× control mean) were noted in the MMI-treated group only at doses ≥20 mg/kg/day (Figure 2). The dose–response relationship of these findings to free drug exposure (AUC) is highlighted in Figure 3.
Scatter plots of individual animal serum levels of T4, T3, TSH, ALT, AST, and total bilirubin, respectively, in vehicle and PTU treatment groups (1, 20, and 200/100 mg/kg/day) on day 29 following oral administration in Wistar rats. Each circle reflects the value from an individual animal in a cohort. Mean and standard deviation are depicted as horizontal lines. ALT = alanine aminotransferase; AST = aspartate aminotransferase; PTU = propylthiouracil; T3 = triiodothyronine; T4 = thyroxine; TSH = thyroid-stimulating hormone.
Scatter plots of individual animal serum levels of T4, T3, TSH, ALT, AST, and total bilirubin, respectively, in vehicle and MMI treatment groups (1, 20, and 200/100 mg/kg/day) on day 30 following oral administration in Wistar rats. Mean and standard deviation are depicted as horizontal lines. ALT = alanine aminotransferase; AST = aspartate aminotransferase; MMI = methimazole; T3 = triiodothyronine; T4 = thyroxine; TSH = thyroid-stimulating hormone.
Summary of changes in the serum levels of T4, T3, TSH, and thyroid weight in relation to the dose-dependent increase in the free drug AUC concentrations of PTU and methimazole. AUC = area under the plasma concentration time curve; PTU = propylthiouracil; T3 = triiodothyronine; T4 = thyroxine; TSH = thyroid-stimulating hormone.
Liver Enzymes
In the PTU-treated animals, there were slight increases in serum ALT activity (1.43–1.72× control mean), increases in serum alkaline phosphatase (1.19× control mean), and total bilirubin (1.5× control mean) at 200/100 mg/kg/day (Figure 1 and Table 2). In contrast, MMI-treated animals had decreased serum ALT activity (0.6× control mean), serum AST activity (0.18–0.26× control mean), and serum alkaline phosphatase (0.49–0.65× control mean) at doses ≥1 mg/kg/day (Figure 2 and Table 2); along with slight transient increases in total bilirubin (1.4× control means) on days 8 and 22 at 200/100 mg/kg/day (data not shown).
Hematology, serum chemistry, and bone marrow parameters in SD rats treated with propylthiouracil and methimazole.
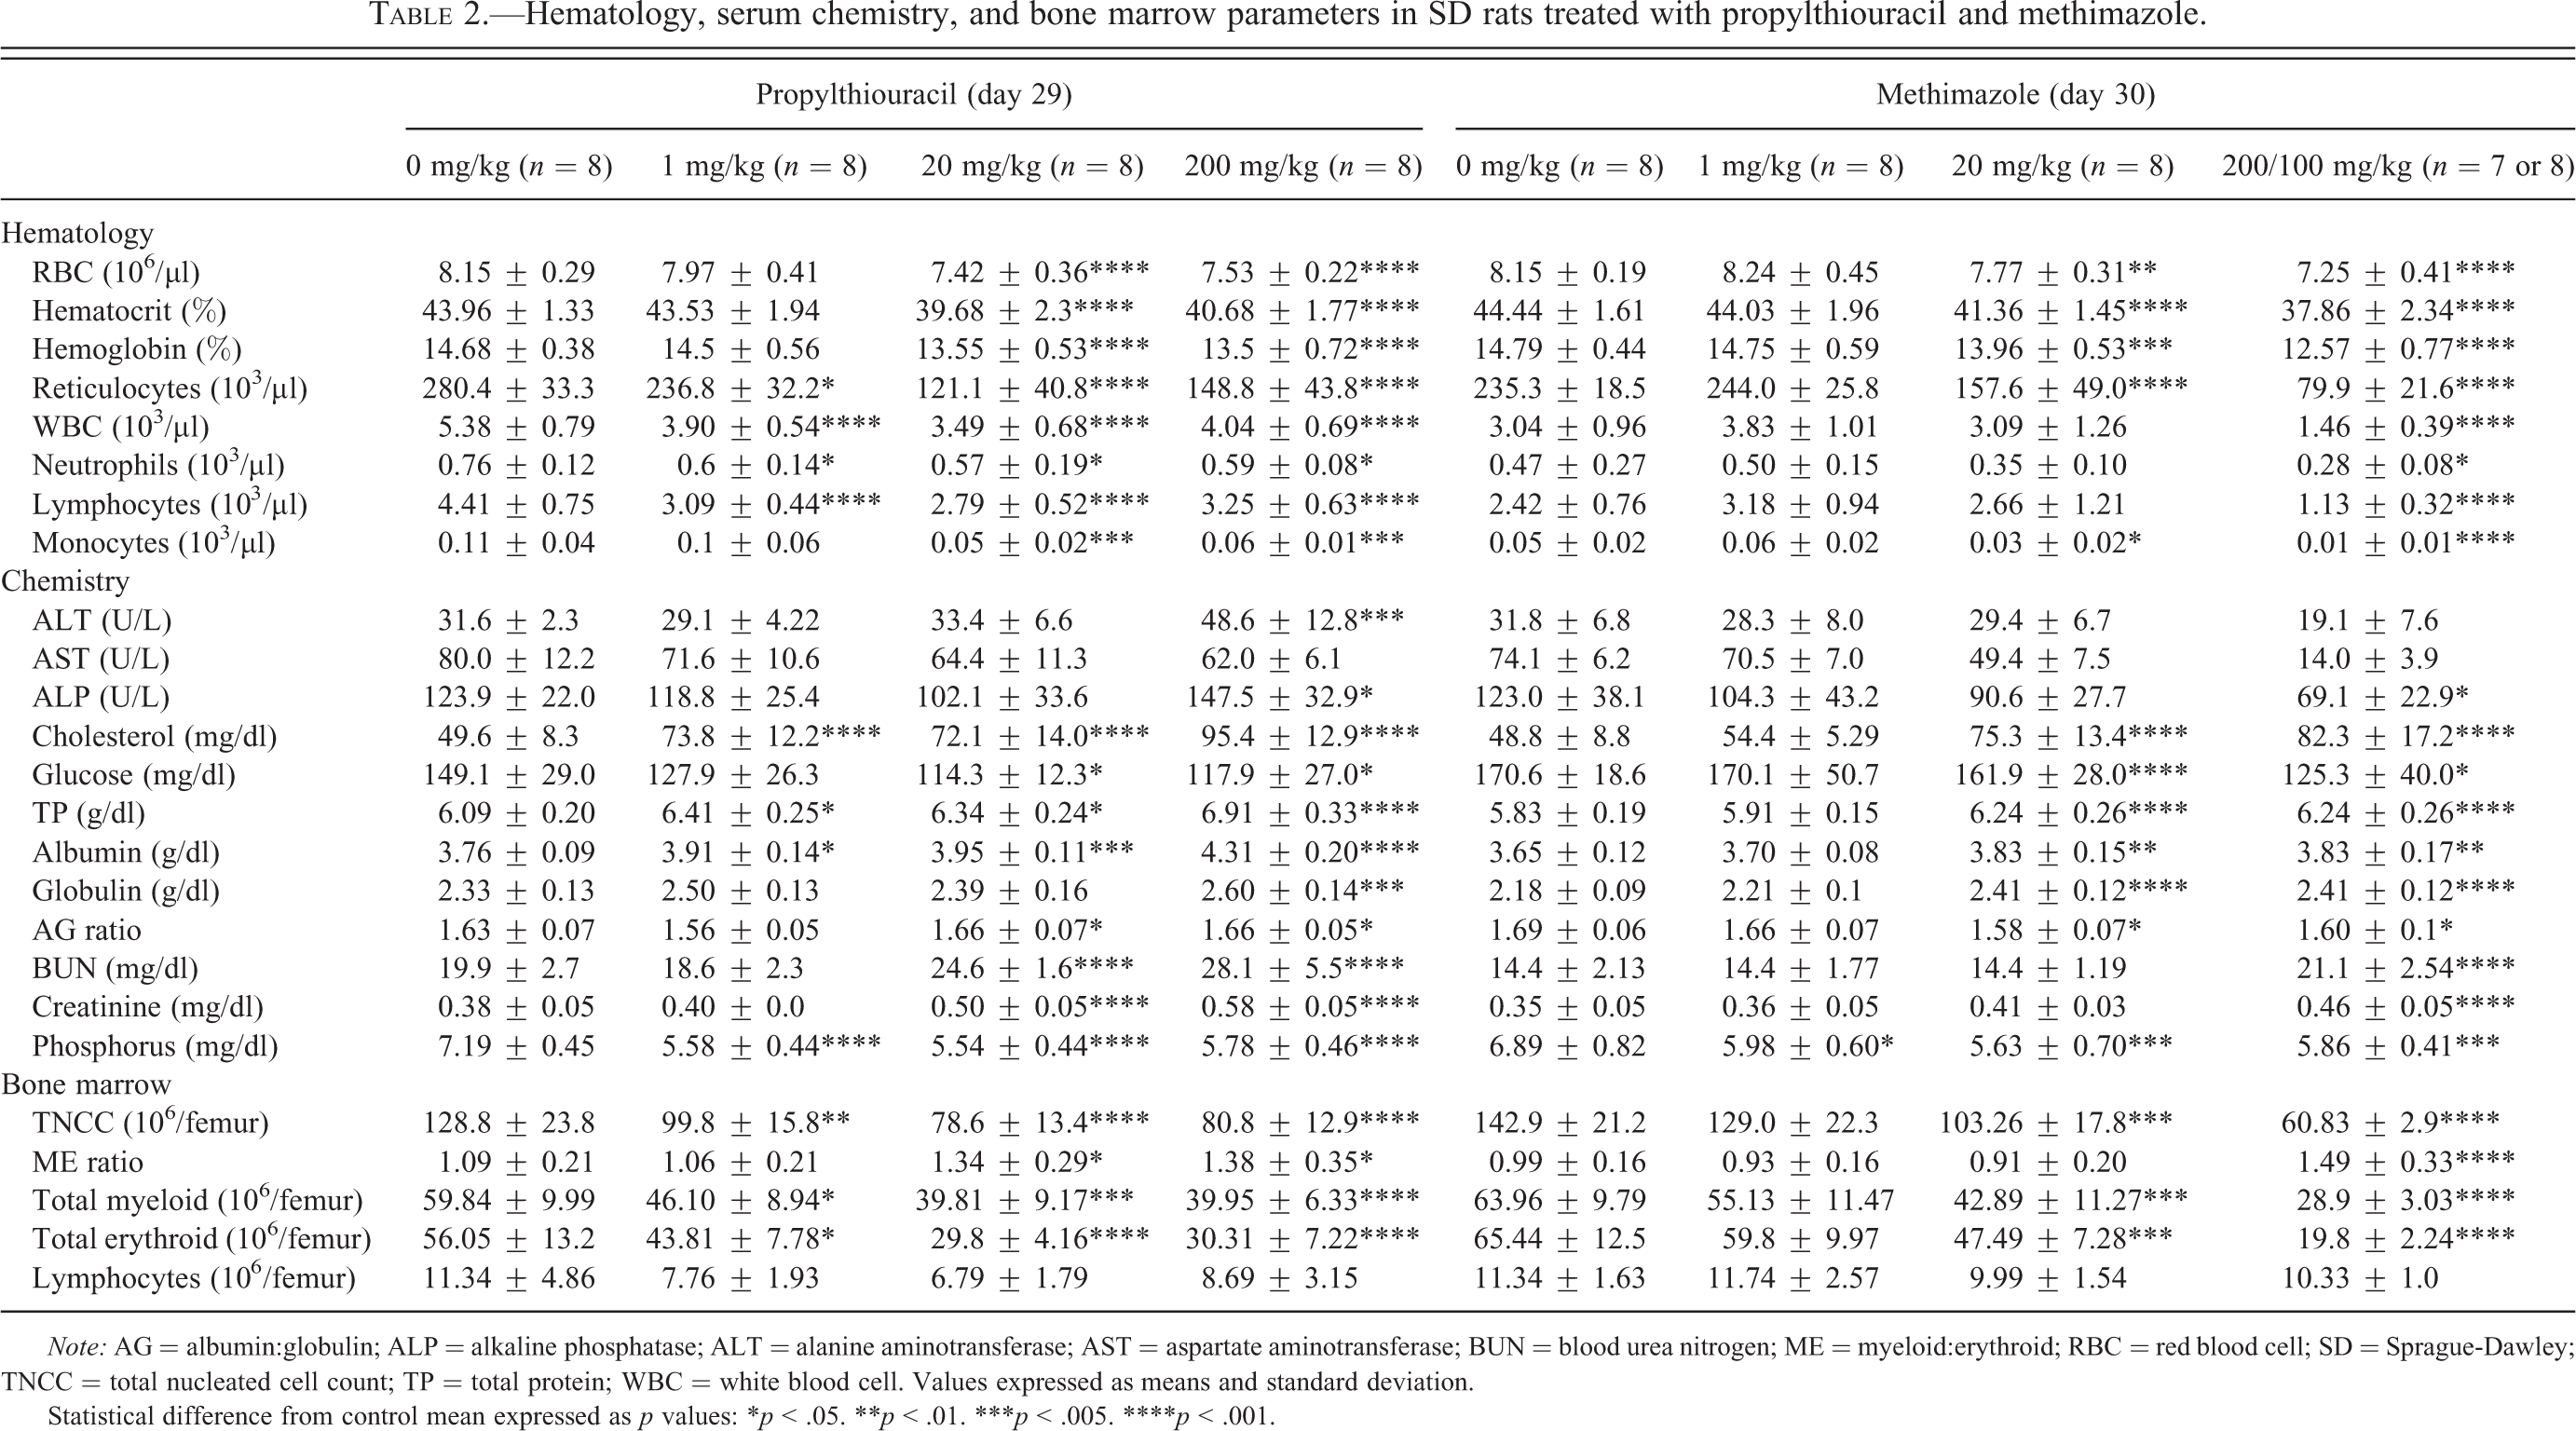
Note: AG = albumin:globulin; ALP = alkaline phosphatase; ALT = alanine aminotransferase; AST = aspartate aminotransferase; BUN = blood urea nitrogen; ME = myeloid:erythroid; RBC = red blood cell; SD = Sprague-Dawley; TNCC = total nucleated cell count; TP = total protein; WBC = white blood cell. Values expressed as means and standard deviation.
Statistical difference from control mean expressed as p values: *p < .05. **p < .01. ***p < .005. ****p < .001.
Several other clinical chemistry parameter changes were noted and some were considered secondary to the decreased food intake and likely decreased water intake that occurred in the PTU- and MMI-treated dose groups. These included dose-dependent increases in BUN (1.24–1.47× control mean) and serum creatinine (1.17–1.53× control mean), slight increases in total protein, albumin, and globulin (1.04–1.15× control mean), and serum chloride (1.02–1.07× control mean) with both PTU treatment and MMI treatment (Table 2). Moderate elevation in cholesterol levels were present in all dose groups among PTU-treated animals (1.45–1.92×) and in the dose groups >1 mg/kg among MMI-treated animals (1.54–1.69×). In addition, increases in sodium (1.03× control mean) and decreases in potassium (0.90× control mean) were noted in rats given MMI at 200/100 mg/kg/day.
There were decreases in serum inorganic phosphorus (0.77–0.87× control mean) and blood glucose (0.74–0.79× control mean) at ≥1 mg/kg/day (for PTU) or at doses ≥20 mg/kg/day (for MMI).
Hematology Parameters
There were PTU- and MMI-related changes in select RBC and white blood cell (WBC) parameters. For PTU and MMI, there was dose-dependent decrease in RBC, hematocrit, hemoglobin concentration, and reticulocytes at doses ≥20 mg/kg/day (Table 2). Reduction in reticulocytes was also noted in the low-dose group (1 mg/kg/day) of PTU-treated animals (Table 2). There were slight decreases in WBC at doses ≥1 mg/kg/day (PTU) and at 200/100 mg/kg/day (MMI) due to decreases in neutrophils, lymphocytes, and/or monocytes (Table 2). Most of the decreases in the total WBCs were attributed to the changes in lymphocytes. Slight reduction in platelets was also noted in the MMI-treated animals at 200/100 mg/kg/day.
Postmortem Findings
Gross and Organ Weight Changes
Both PTU- and MMI-treated animals had grossly enlarged thyroid glands at doses ≥20 mg/kg/day. This macroscopic finding was associated with moderate increases in absolute, relative-to-body, and relative-to-brain thyroid weights (2.48–4.56× control mean) at doses ≥1 mg/kg/day for PTU-treated animals and at doses ≥20 mg/kg/day for MMI-treated animals (Table 3). These increases in thyroid weights correlated with the microscopic finding of thyroid follicular hypertrophy/hyperplasia.
Terminal weights (body, thyroid, and liver) in SD rats treated with propylthiouracil and methimazole.
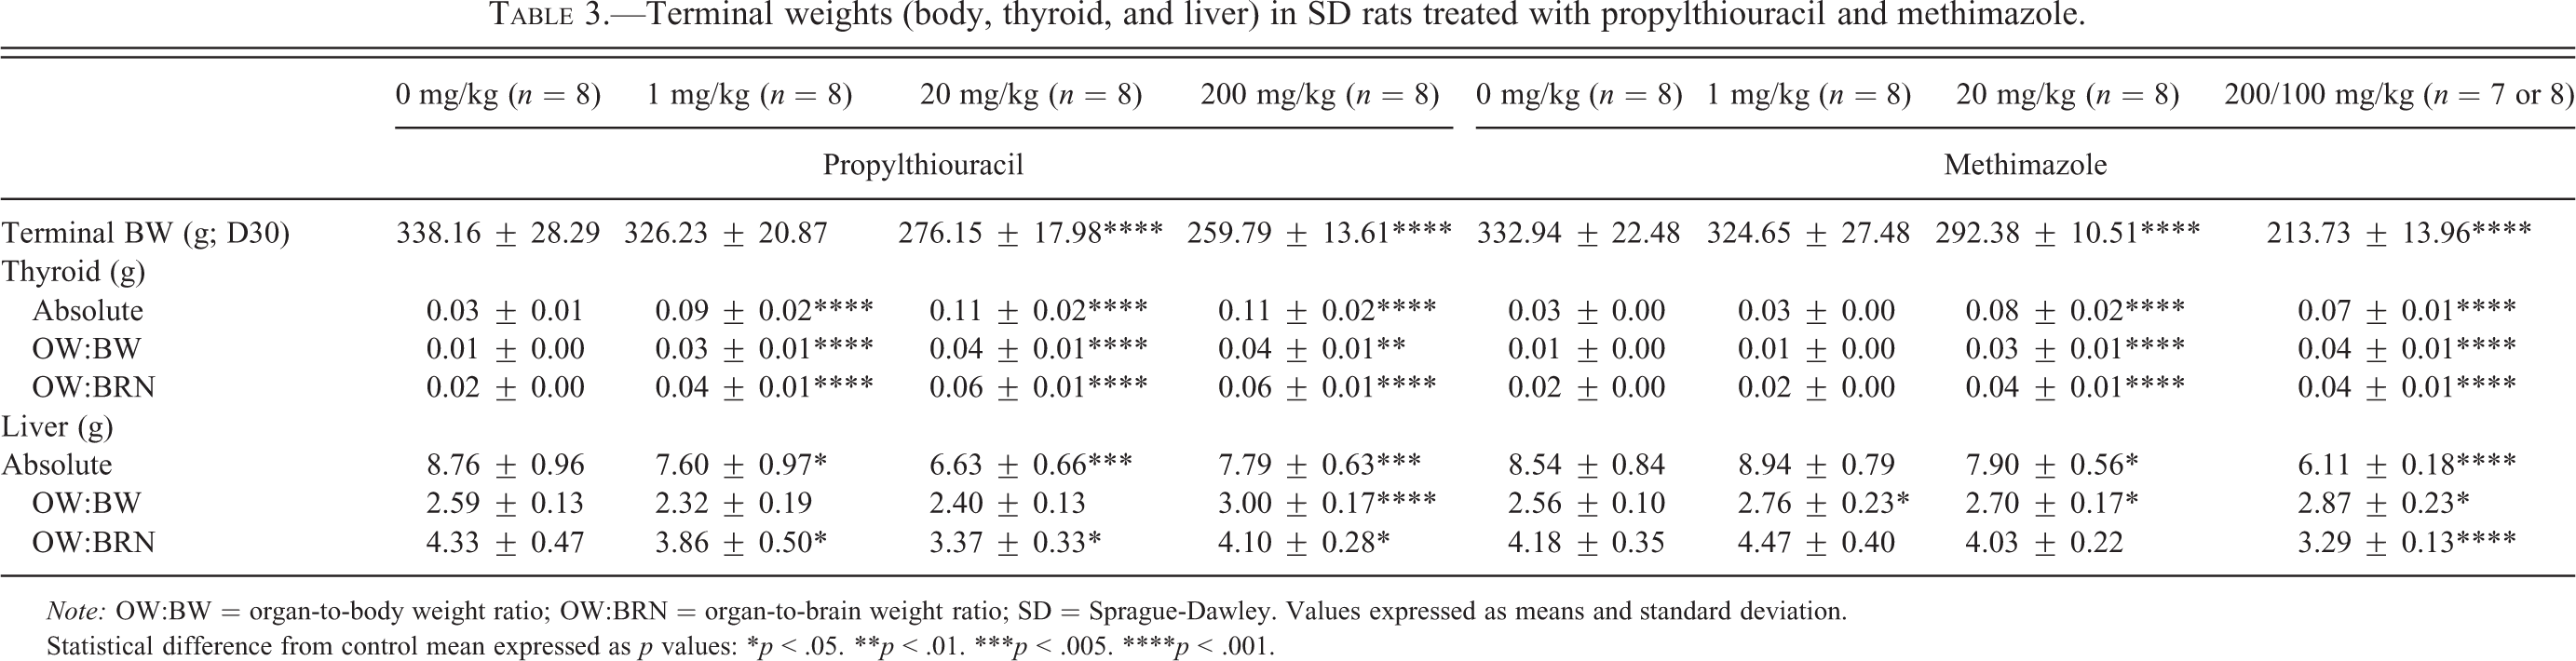
Note: OW:BW = organ-to-body weight ratio; OW:BRN = organ-to-brain weight ratio; SD = Sprague-Dawley. Values expressed as means and standard deviation.
Statistical difference from control mean expressed as p values: *p < .05. **p < .01. ***p < .005. ****p < .001.
Slight decrease in absolute, but similar increase in relative-to-body liver weights in both PTU- and MMI-treated groups were noted at doses ≥1 mg/kg/day (Table 3).
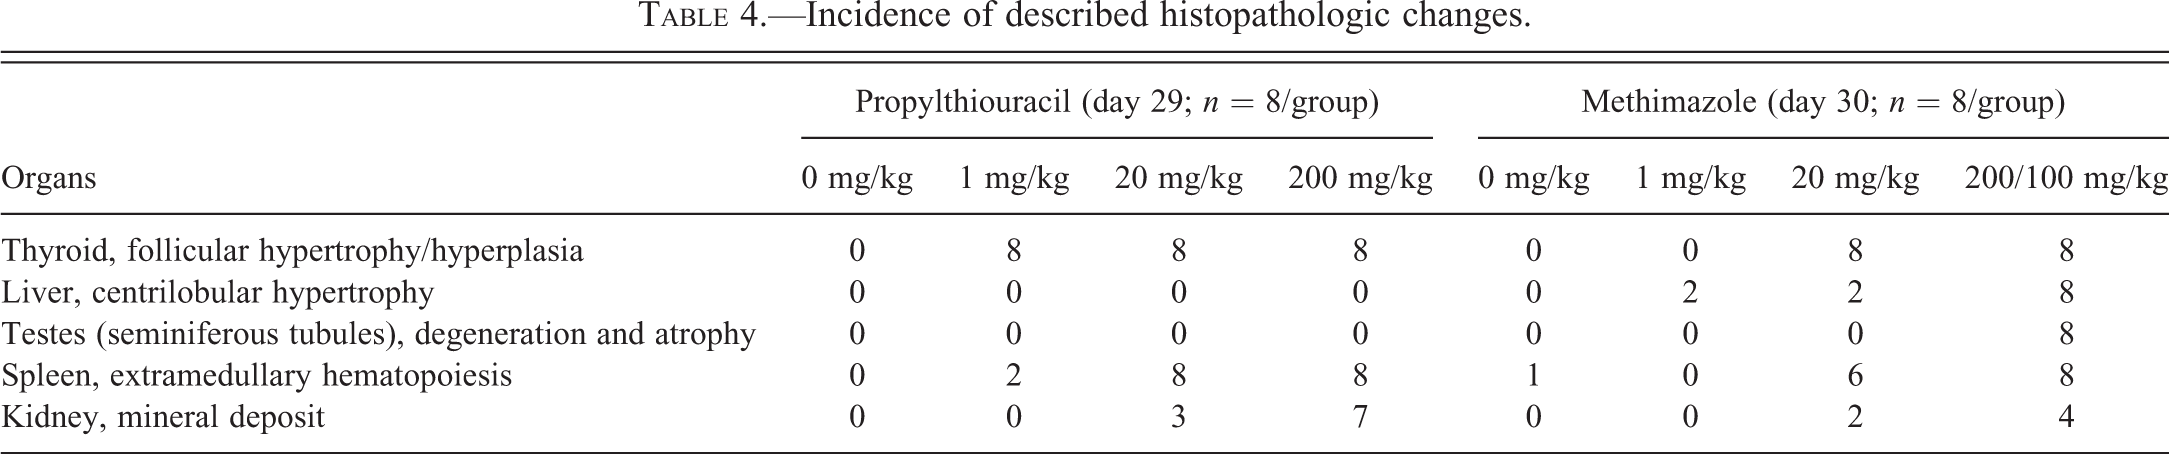
Microscopic Findings
Treatment-related microscopic findings common to PTU and MMI were noted in the thyroid glands, kidney, liver, and spleen. In addition, there were findings in the testes of MMI-treated rats alone (Table 4).
Incidence of described histopathologic changes.
Free drug Cmax and AUC values on day 28 of the treatment in SD rats treated with propylthiouracil and methimazole.
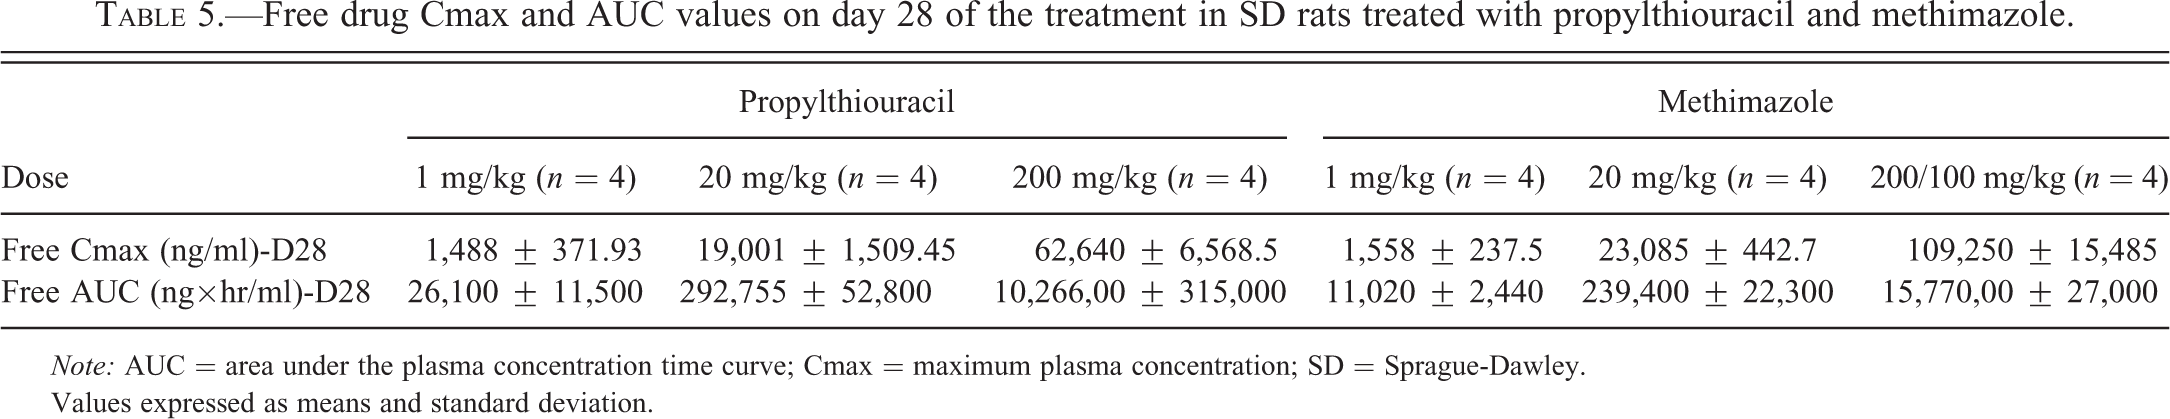
Note: AUC = area under the plasma concentration time curve; Cmax = maximum plasma concentration; SD = Sprague-Dawley.
Values expressed as means and standard deviation.
In the thyroid glands, there was mild to moderate follicular hypertrophy and hyperplasia at doses ≥1 mg/kg/day and at doses ≥20 mg/kg/day for PTU and MMI, respectively (Figure 4; Table 4).
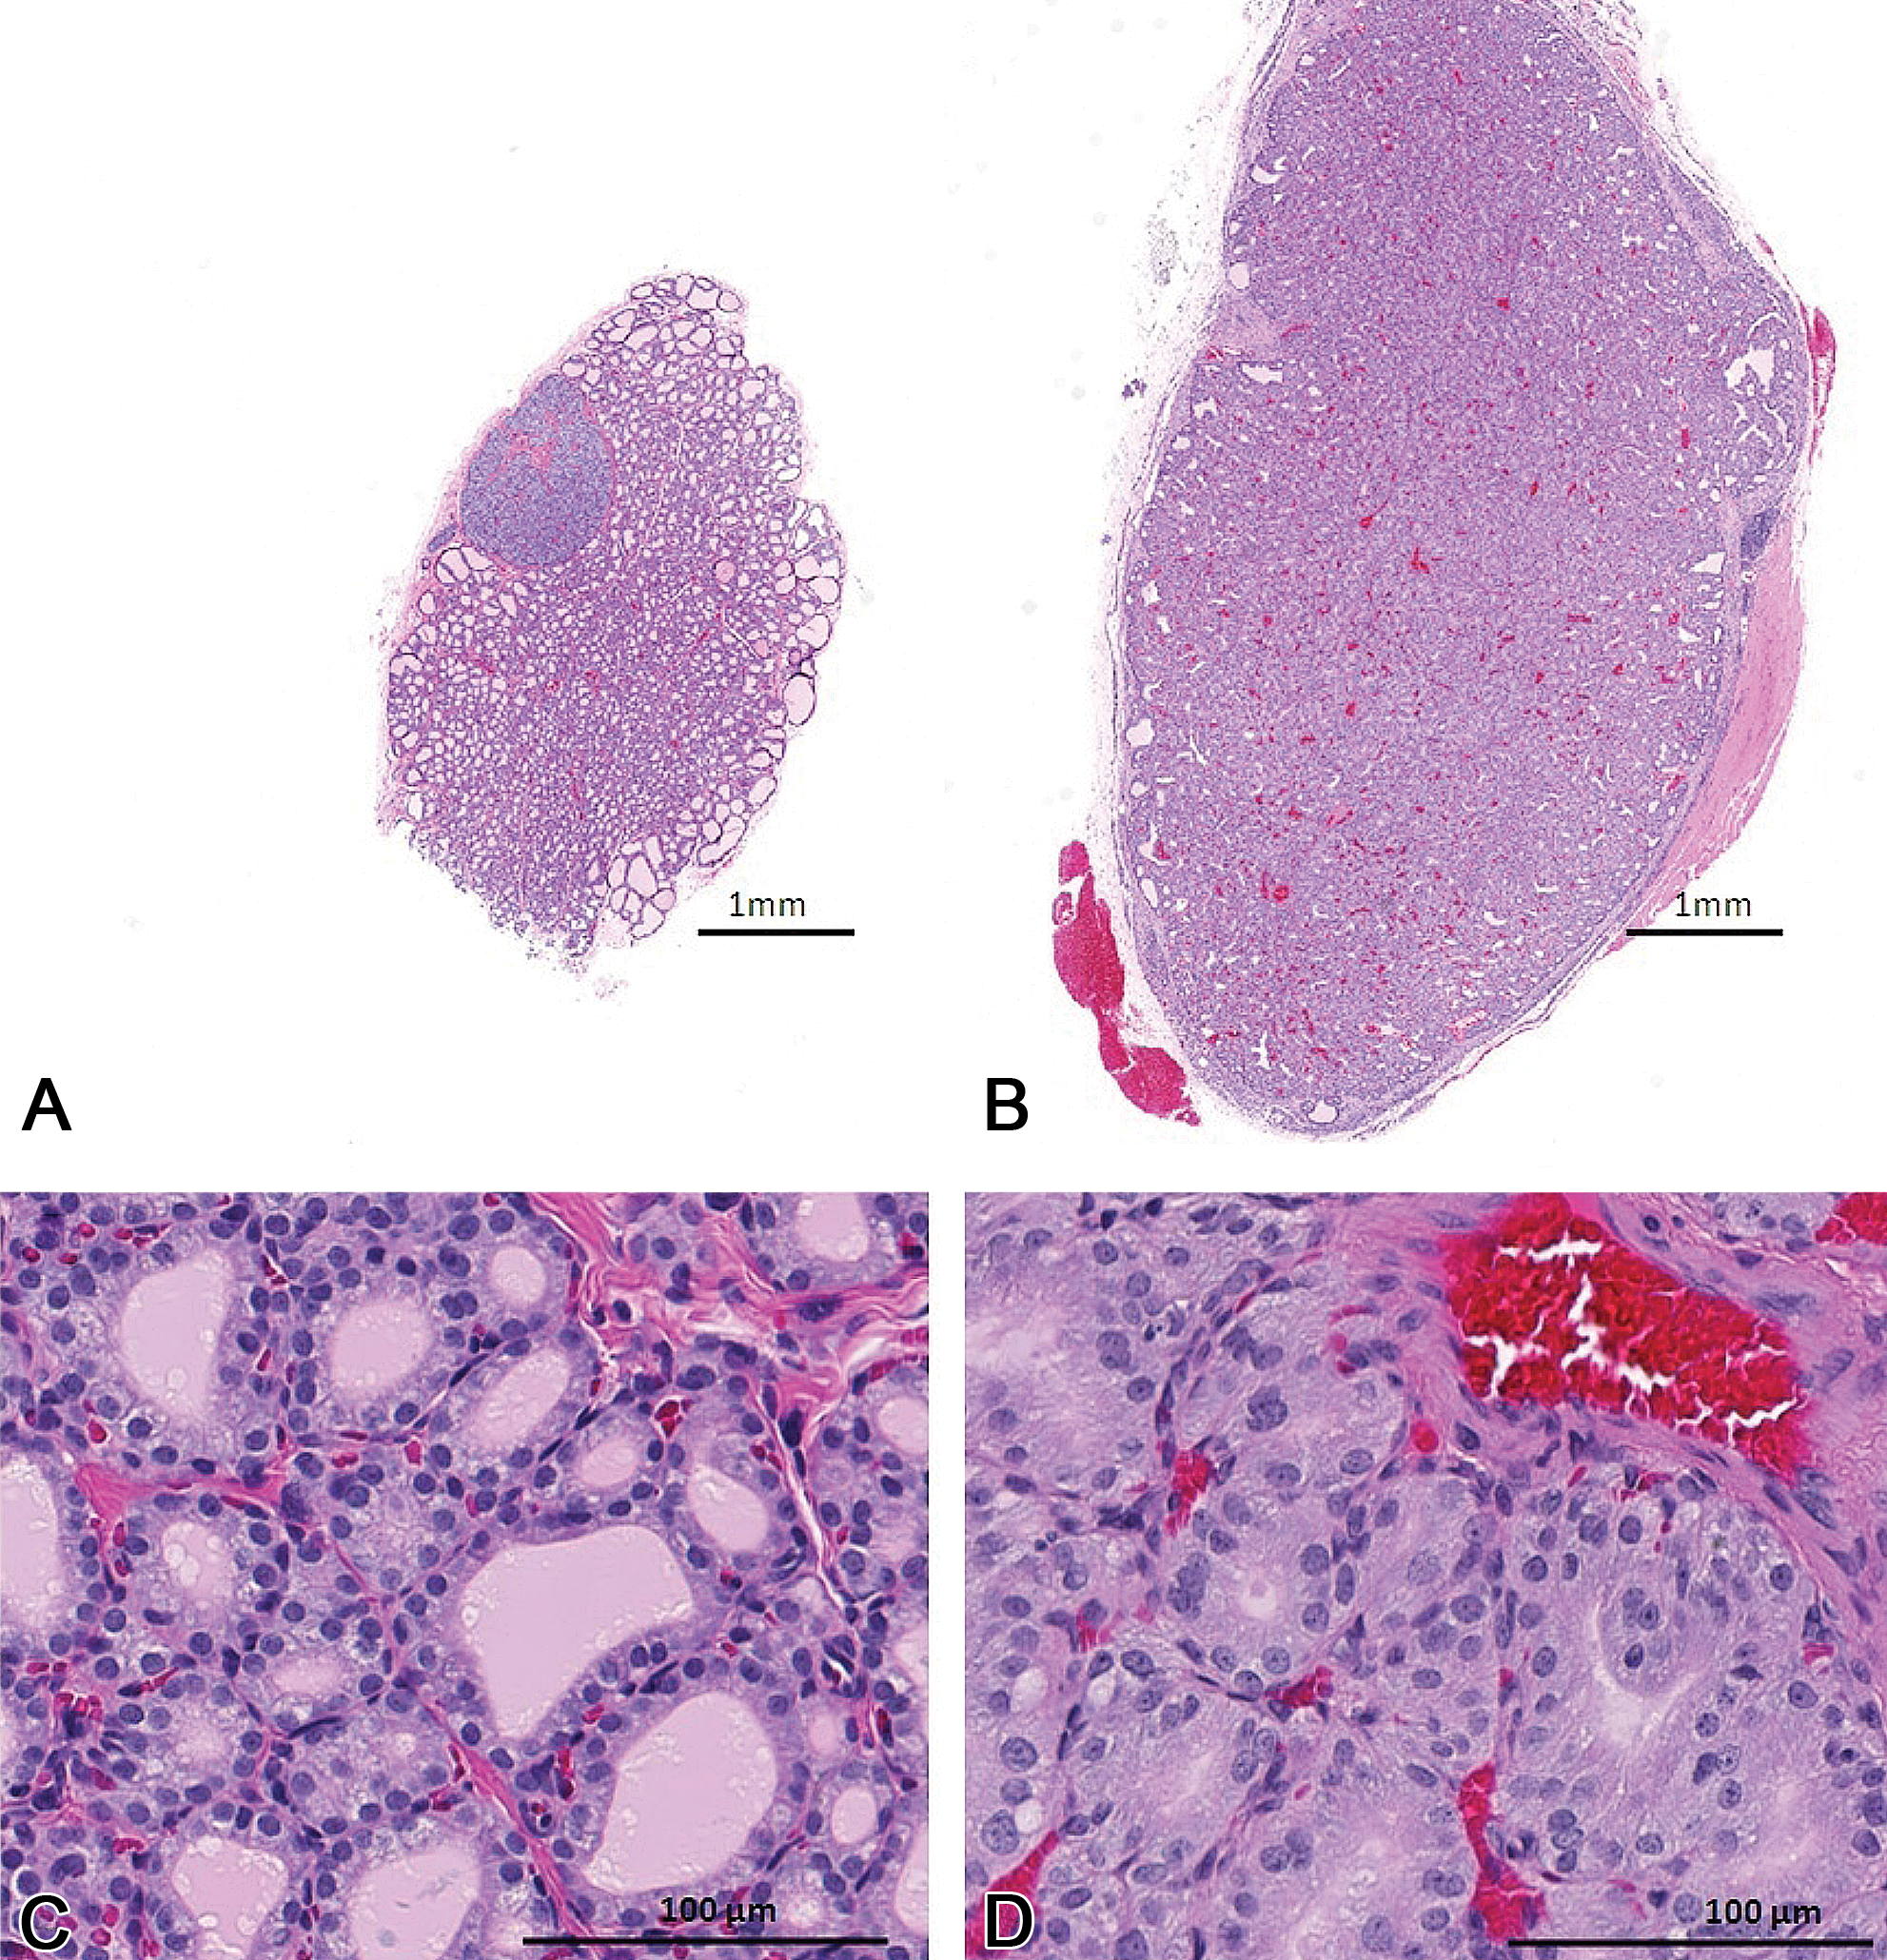
Representative histology of thyroid gland in vehicle (A and C) and PTU-treated (B and D) rats at day 29 of the treatment. Treatment-related enlargement of the thyroid gland in both PTU-treated and MMI-treated animals were associated with increases in absolute and relative thyroid gland weight and microscopic finding of follicular hypertrophy/hyperplasia in the treated animals (D). MMI = methimazole; PTU = propylthiouracil.
In the kidneys, mineral deposits were noted in the pelvic cavity along the urothelium of PTU- and MMI-treated animals at doses ≥20 mg/kg/day with or without secondary pelvic transitional cell hyperplasia (Table 4). Peripelvic infiltration of eosinophils, noted in individual animals given PTU at doses ≥20 mg/kg/day, was in close proximity to the mineral deposits and was considered secondary to the physical trauma caused by the mineral deposits.
In the liver, there was minimal centrilobular hypertrophy at 200 mg/kg/day in MMI-treated animals and in individual animals at 1 and 20 mg/kg/day of the MMI-treated cohort (Table 4).
In the testis of the MMI-treated rats, there was degeneration/atrophy of multiple seminiferous tubules at 200/100 mg/kg/day (Figure 5; Table 4). This finding was characterized by some or all of the following features: (a) degeneration/depletion of round spermatids within tubules in the maturation/release phase (stages I–VIII), (b) degeneration/depletion of elongate spermatids within tubules in the elongation phase (stages IX–XIV tubules) and often lined by only Sertoli cells and few pachytene spermatocytes, (c) retained spermatids sometime up to stage XIV tubule, and (d) apoptosis of pachytene spermatocytes within stage VII tubules. These changes were frequently associated with increased cell debris in the epididymis at 200/100 mg/kg/day.
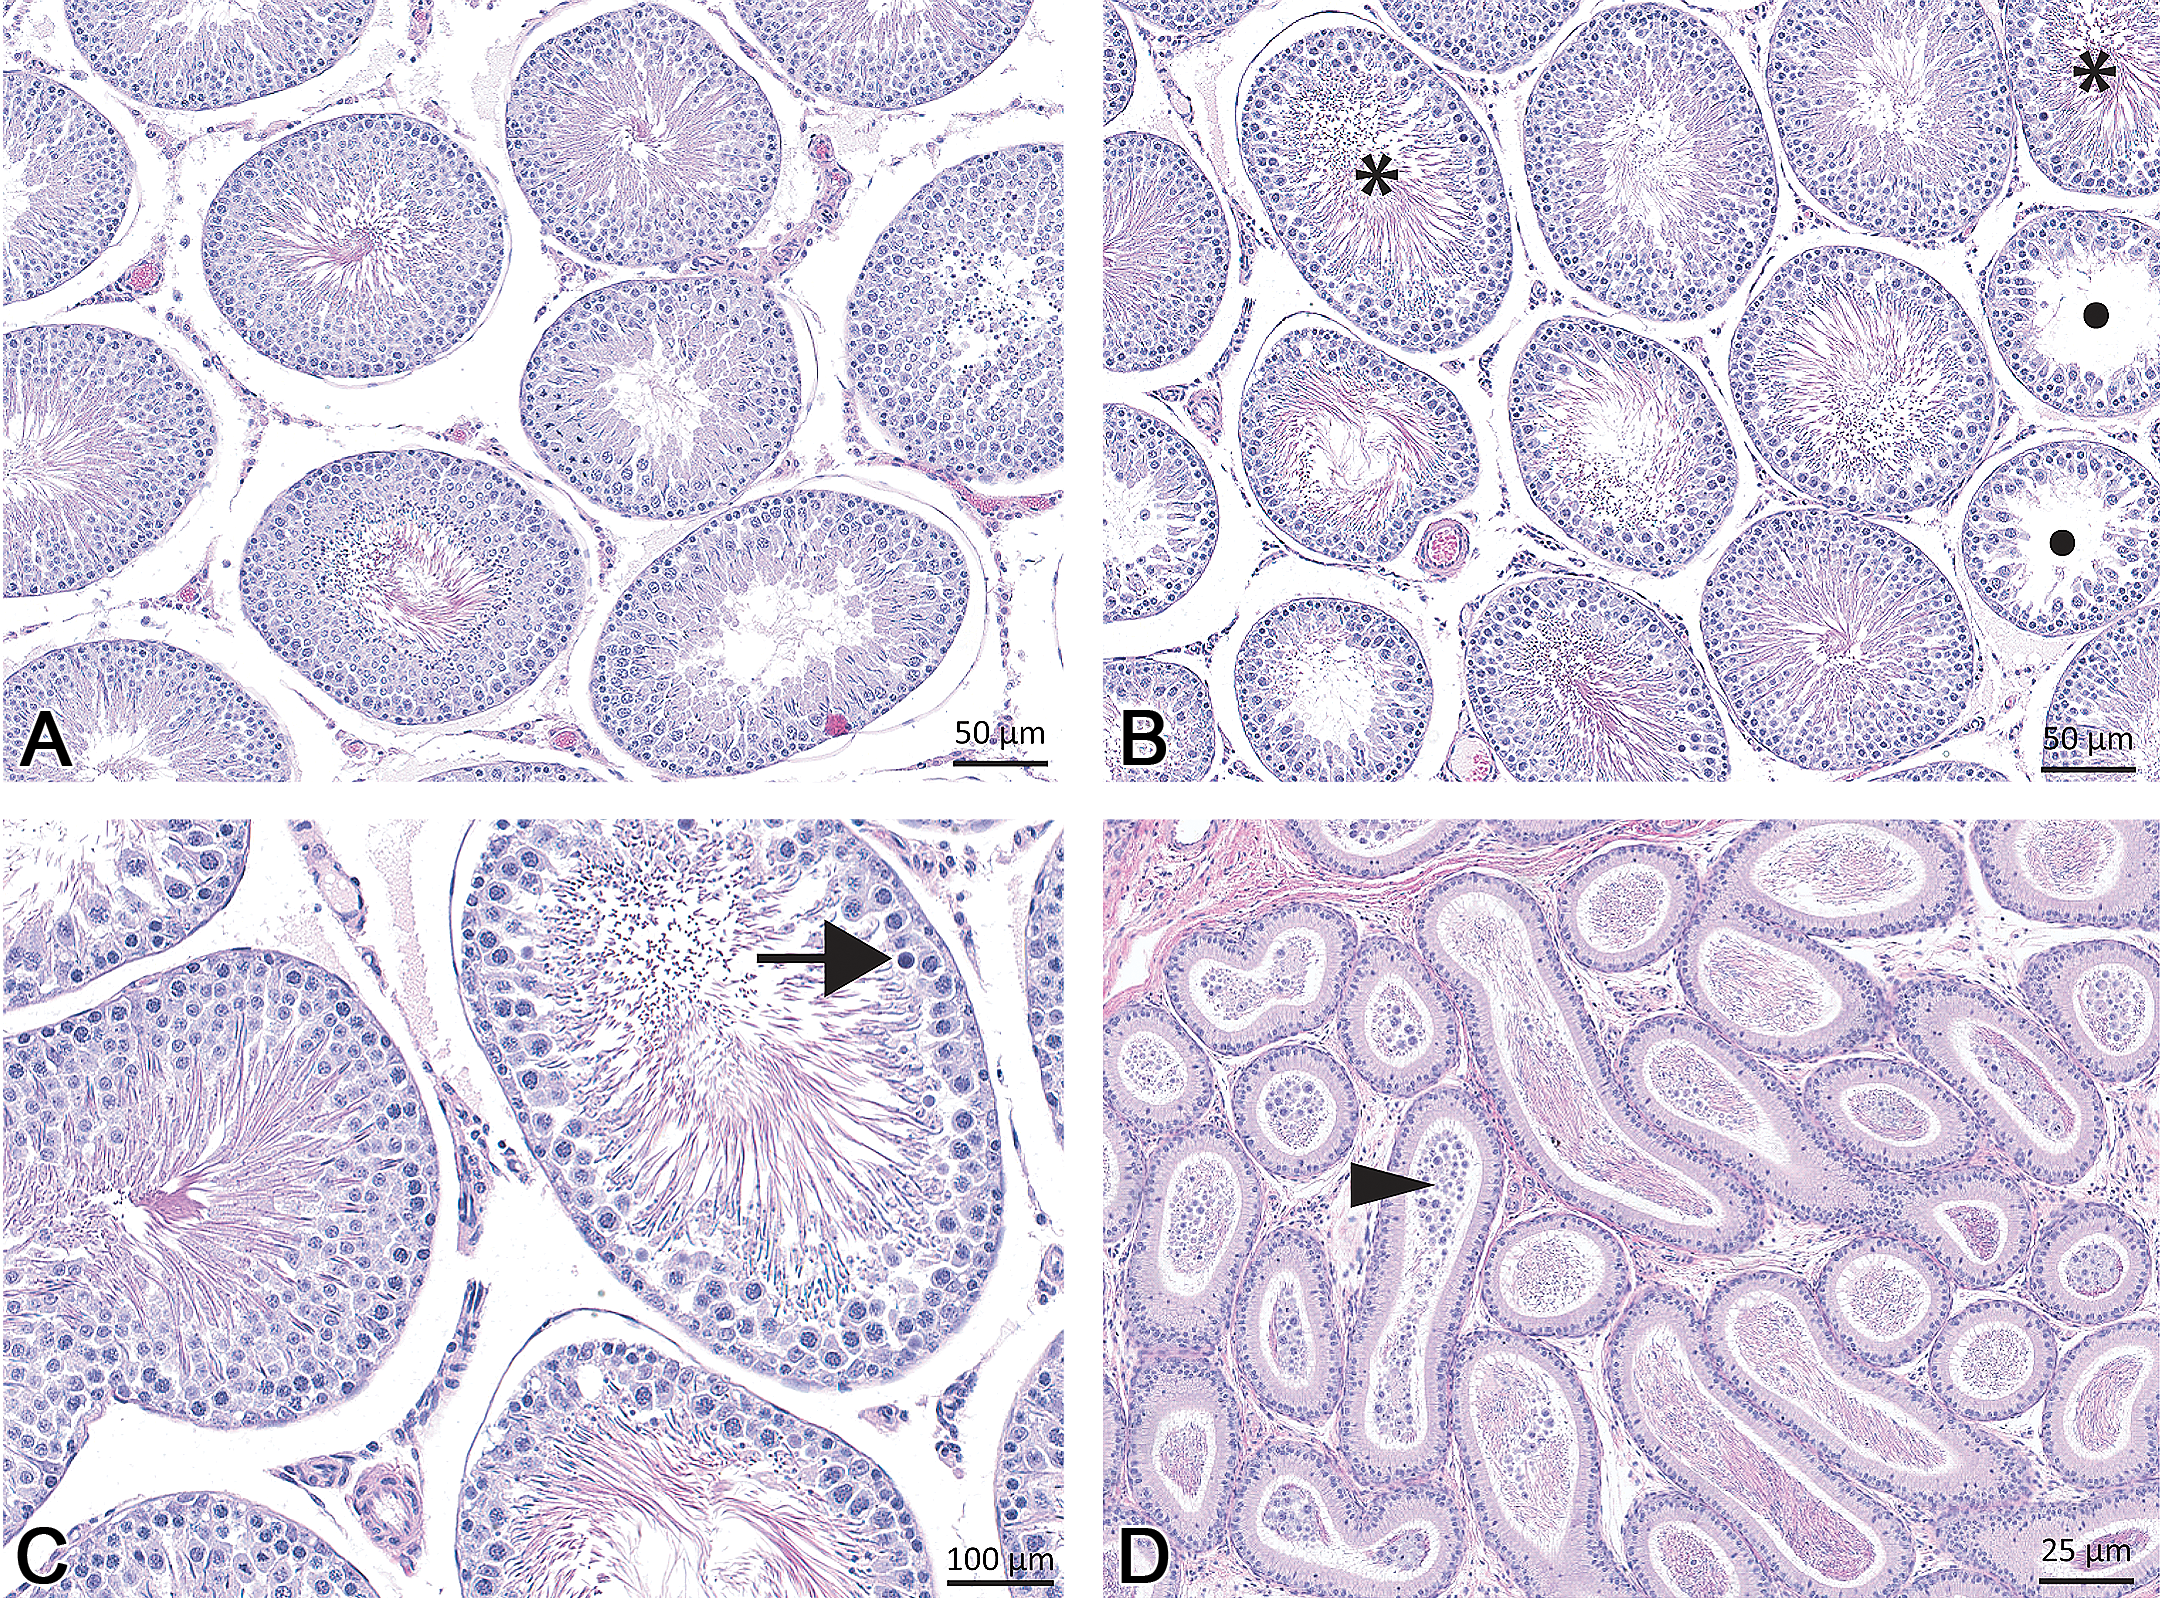
Representative histology of the testis demonstrating testicular degeneration and atrophy noted in the high-dose MMI–treated rats. Features include depletion of round spermatids within tubules in the maturation/release phase (stages I–VIII; 5B, asterisk), degeneration/depletion of elongate spermatids within tubules in the elongation phase (stages IX–XIV tubules, retained spermatids sometime up to stage XIV tubule; solid circle in panel B), and apoptosis of pachytene spermatocytes within stage VII tubules (5C, black arrow), and atrophy of occasional tubules. These changes were frequently associated with increased cell debris in the epididymis (D, arrowhead). Normal seminiferous tubules from a control animal are shown in A. MMI = methimazole.
In the spleen, there was minimal to mild reduction in extramedullary hematopoiesis at doses ≥1 mg/kg/day (PTU) and at doses ≥20 mg/kg/day (MMI; Table 4). The observed reduction in spleen weights (0.5–0.9× control mean; data not shown) noted at the same dosages for PTU and MMI was unlikely to be a consequence of the reduced EMH.
Quantitative Bone Marrow Analysis
In PTU-treated animals, there were decreases (0.63–0.77× control mean) in the total nucleated cell counts at doses ≥1 mg/kg/day on day 29 due to decreases in total myeloid (0.67–0.77× control mean) and erythroid (0.53–0.78× control mean) cells (Table 2). This change was mainly due to decreases in the absolute numbers of the maturing myeloid and erythroid cells. There was an increase in myeloid:erythroid ratio (1.34–1.38 vs. 1.09 for the control group) at doses ≥20 mg/kg/day. In MMI-treated animals, decreases (0.43–0.72× control mean) in the total nucleated cell counts were present at doses ≥20 mg/kg/day on day 30 due to decreases in both total myeloid (0.45–0.67× control mean) and erythroid (0.30–0.73× control mean) populations and were mainly associated with decreases in the absolute number of maturing myeloid and erythroid cells. There was an increase in myeloid:erythroid ratio (1.49 vs. 0.99 for the control group) at 200/100 mg/kg/day on day 30 and a decrease (0.57× control mean) in absolute numbers of megakaryocytes (Table 2).
Toxicokinetics of PTU and MMI
TK data from the 28-day toxicology study obtained in the rat were evaluated for time-dependent changes in systemic exposure to PTU and MMI in plasma and dose exposure relationship (Figure 3 and Table 5). Mean plasma AUC values for PTU and MMI following 28 days of oral administration to rats were similar to those on day 1. Ratios of mean AUC on day 28 to day 1 ranged from 1.1 to 1.6 for PTU and 0.6 to 1.4 for MMI. This lack of time-dependent changes in systemic exposure indicates that there was little to no accumulation of PTU or MMI in plasma over the duration of the treatment.
Plasma exposure of PTU and MMI as described by AUC and Cmax at 20 mg/kg in this study (Figure 3) was similar to those reported in an older study (Sitar and Thornhill 1972, 1973). The significant difference in protein binding between PTU (fU = 0.435) and MMI (fU = 0.95; Sitar and Thornhill 1972, 1973) resulted in lower exposure of unbound PTU compared to unbound MMI at the administered low- and mid-dosage groups. For the parameters such as thyroid hormones, TSH, and thyroid weight, PTU was consistently left shifted compared to MMI (Figure 3). No striking differences in absorption and metabolism of PTU and MMI have been reported in rats (IARC monographs on PTU and MMI 2001). Taken together, PTU may be more potent in inhibiting the thyroid axis compared to MMI.
Discussion
Thionamides (PTU and MMI) that inhibit thyroid hormone synthesis are used extensively for the treatment of hyperthyroidism. MMI has gained prominence in the recent past over PTU as a drug of choice for antithyroid use for reasons primarily related to safety (Rivkees and Mattison 2009). However, serious adverse effects associated with thionamides include idiosyncratic liver damage, aplastic anemia, agranulocytosis, and vasculitis. Both PTU and MMI, the thionamide compounds, have a thiourea and sulfhydryl group (Cooper 2005). Oxidation of the thiourea moiety to a reactive metabolite is considered the cause of the immune-mediated dyscrasias resulting in agranulocytosis. The immune-mediated development of the anti-neutrophil cytoplasmic antibody is associated with the development of vasculitis in certain number of patients administered with thionamides (Bonaci-Nikolic et al. 2005). In people, the adverse effects of MMI appear to be dose related but that of PTU are not clearly so (Cooper 2005).
Treatment of rats for 1 month with PTU and MMI, as expected, resulted in primary hypothyroidism with features such as reduced thyroid hormones, elevated TSH, increased thyroid gland weights, macroscopic enlargement of the thyroid glands, and microscopic evidence of follicular hypertrophy/hyperplasia. The thyroid follicular hypertrophy/hyperplasia was a compensatory response to the marked reduction in serum thyroid hormones (T4 and T3) and subsequent stimulatory effect of TSH on the thyroid glands (Zachary and McGavin 2012). The chronic stress that is likely occuring in these rats associated with poor food consumption and decreased weight gain may be contributing to the T3 and T4 decreases. However, the magnitude of changes in the thyroid hormes and increases in TSH as noted in this study are not typically noted with euthyroid sick syndrome (Everds et al. 2013).
In rodents, persistent thyroid follicular hypertrophy/hyperplasia is associated with thyroid neoplasia. Consistent with this continuum, oral treatment of Harlan rats with MMI for 2 years caused thyroid follicular tumors at 2.5 and 9 mg/kg/day or 30 and 180 ppm in diet (Owen, Worth, and Kiplinger 1973). Similarly, chronic PTU treatment has been associated with thyroid tumors in multiple species including rats. In contrast, although comprehensive epidemiologic studies with PTU and MMI in humans are lacking, specific case-control studies of cancer found no significant association with either PTU or MMI treatment (Hallquist et al. 1994; Ron et al. 1987).
Idiosyncratic liver toxicity in humans has been noted with low prevalence with thionamides. In fact, PTU has been the third largest cause of drug-related liver transplant in the United States (1992–2002) second to acetaminophen and isoniazid (Russo et al. 2004). Although, liver enzyme elevations are not very predictive of idiosyncratic liver toxicity, mild increases in liver transaminases have been reported in 33% of patients taking PTU. In the present study, there were marginal increases in ALT in the PTU-treated cohort. Increases in liver enzyme activity of this magnitude without any histologic correlates are often encountered in toxicology studies and are not considered adverse. It is interesting to note that the increases in liver enzymes were noted only in the PTU-treated group which has an increased risk of liver injury in humans when compared to MMI. In contrast, the liver enzymes were reduced in the MMI-treated cohort.
The other changes in clinical chemistry parameters (BUN and creatinine increases along with increases in serum proteins and alterations in serum electrolytes) were attributed to dehydration (reduced food and water consumption) and hypothyroidism associated renal changes such as the loss of concentrating function and reduced glomerular filtration rate (Bradley et al. 1974). Similarly, decreases in serum inorganic phosphorus and blood glucose levels, and increases in cholesterol noted in PTU- and MMI-treated cohorts have been reported in hypothyroid animals (Aranda, Montoya, and Herrera 1972; Dixon, Reid, and Mooney 1999; Duncan and Prasse 1986; Johnson 2008). The decreases in blood glucose may be related to lower food consumption but have also been described with hypothyroidism (Duncan and Prasse 1986). The elevation of cholesterol with PTU- and MMI-treated animals was considered secondary to hypothyroidism. In fact, hypothyroidism is the most common secondary cause of hypercholesterolemia in people (Mason, Hunt, and Hurxthal 1930).
Thionamide drugs have been known to have adverse suppressive effects on bone marrow resulting in aplastic anemia and agranulocytosis in certain subset of patients. There were mild decreases in several RBC parameters (RBC count, hemoglobin, hematocrit, and reticulocytes) and select WBC parameters (neutrophils and monocytes) in both PTU- and MMI-treated cohorts. These were marginal and not consistent with aplastic anemia or agranulocytosis that is sometimes reported in humans.
The interpretation of the altered RBC and WBC parameters in the thionamide-treated rats is challenging. Although hypothyroidism can directly affect erythropoiesis and cause agranulocytosis, generalized bone marrow suppression can also occur with reduced food consumption/reduced body weight (Levin, Semler, and Ruben 1993; Ogawa et al. 1985). Rats with stress due to decreased food intake often have decreases in the RBC mass parameters, reticulocytes, WBC including decreases in lymphocytes and neutrophils, platelets and decreased bone marrow cellularity (Everds et al. 2013). Most of these changes were present in these animals mainly at the higher dosages where decreased food consumption and decreased body weight gain occurred, but some of these changes also were present in 1 mg/kg/day PTU-treated animals where decreased body weight was not present. It is likely that a combination of stress and hypothyroidism may have contributed to the RBC and WBC changes.
There were decreases in RBC counts and neutrophil counts reported in rats given PTU and MMI at 20 mg/kg/day that were attributed as primary effects (Abou-Auda and Abou-Shaaban 2006). Food consumption, body weight data, and bone marrow indices were not reported by these authors, and it is unclear whether the reported effects were indeed primary or secondary thionamide effects.
Renal intrapelvic mineralization, noted only in the PTU-treated animals, may have been secondary to dehydration, although renal mineralization (nephrocalcinosis) has been described in hypothyroid humans and animals (Mantan and Mishra 2010). Possible explanations for this include urinary loss of electrolytes, altered urinary pH, and loss of calcium gradient maintenance in renal mitochondria (Bradley et al. 1974; Mantan and Mishra 2010).
MMI treatment is contraindicated in pregnancy and PTU is preferred in hyperthyroid patients who are in their first trimester of pregnancy (Rivkees, Stephenson, and Dinauer 2010). Although female animals were not assessed in this study, interesting MMI-related effects were noted in the testes of males from the high-dose group. Although hypothyroidism can disrupt the hypothalamo-pituitary-testicular axis and alter patterns of circulating gonadotropins and testosterone in developing testis (in utero and in early postnatal development), similar findings were absent as anticipated in the adult PTU-treated cohort with fully developed testes (Chiao et al. 2000; Kimura and Furudate 1996; Maran 2003; Maran et al. 2001; Mendis-Handagama and Siril Ariyaratne 2005). Thus, the testicular changes noted among MMI cohorts were considered a primary drug-related adverse effect. It is unclear whether the testicular findings would translate to man. The observed testicular findings were qualitatively distinct from those associated with food restriction studies in rats which were reported as degenerative changes largely restricted to pachytene spermatocytes in stage VII and round spermatids in stage VII (Rehm et al. 2008). Furthermore, PTU-treated cohort, even with similar degree of reduced body weight gain and reduced food consumption, did not develop any abnormal testicular findings, further suggesting that this could be directly related to MMI treatment.
In summary, oral treatment of rats for 1 month with PTU and MMI resulted in hypothyroidism (reduced T4, T3 hormones with increased TSH, increased absolute and relative thyroid gland weights, thyroid follicular hypertrophy/hyperplasia) at doses ≥1 mg/kg/day (PTU) and at doses ≥20 mg/kg/day (MMI). Several secondary changes attributed to hypothyroidism or reduced body weight and food consumption were noted. There was no evidence of agranulocytosis and hepatotoxicity in the present study. The relevance of the MMI-related testicular degeneration in rats is unclear.
The lack of overt agranulocytosis and hepatotoxicity render the rat a poor species to evaluate preclinical toxicity of thionamide drugs for biomarker development. Evaluation of another thiourea-containing drug levamisole revealed dose-related hematotoxicity in dogs, including hemolytic anemia, leucopenia, and thrombocytopenia suggesting that dogs may be another model to study thionamide-induced hematotoxicity (Roberts 1994; Wolford et al. 2012).
Footnotes
The author(s) declared no potential conflicts of interest with respect to the research, authorship, and/or publication of this article.
The author(s) received no financial support for the research, authorship, and/or publication of this article.