
Abstract
Fish have been used as laboratory models to study hepatic development and carcinogenesis but not for pathogenesis of hepatic fibrosis. In this study, a dimethylnitrosamine-induced fish model of hepatic injury was developed in Japanese medaka (Oryzias latipes) and gene expression was anchored with the development of hepatic fibrosis and neoplasia. Exposed livers exhibited mild hepatocellular degenerative changes 2 weeks’ postexposure. Within 6 weeks, hepatic fibrosis/cirrhosis was evident with development of neoplasia by 10 weeks. Stellate cell activation and development of fibrosis was associated with upregulation of transforming growth factor beta 1 (tgfb1), tgfb receptor 2, mothers against decapentaplegic homolog 3 (smad3a), smad3b, beta-catenin (ctnnb1), myc, matrix metalloproteinase (mmp2), mmp14a, mmp14b, tissue inhibitors of metalloproteinase (timp) 2a, timp2b, timp3, collagen type I alpha 1a (col1a1a), and col1a1b and a less pronounced increase in mmp13 and col4a1 expression. Tgfb receptor I expression was unchanged. Immunohistochemistry suggested that biliary epithelial cells and stellate cells were the main producers of TGF-β1. This study identified a group of candidate genes likely to be involved in the development of hepatic fibrosis and demonstrated that the TGF-β pathway likely plays a major role in the pathogenesis. These results support the medaka as a viable fish model of hepatic fibrosis.
Introduction
Small fish models such as the zebrafish (Danio rerio) and the medaka (Oryzias latipes) have been used increasingly in the last four decades to study genetic regulation of development, carcinogenesis, high-throughput screening of chemicals, and environmental monitoring (Hinton et al. 2009). In order to accurately extrapolate findings obtained from aquatic models to humans, it is critical to understand the differences and similarities in organ structure, response to injury, and molecular mechanisms between these phylogenetically distant species. Given its fundamental function in metabolizing chemicals, the liver is an important target organ of toxicity and has received considerable attention. However, the information available regarding the hepatic cellular response to injury in small fish models and the relevant molecular mechanism/mechanisms remain limited (Wolf and Wolfe 2005).
In mammals, irrespective of the cause, chronic liver injury results in hepatic fibrosis, the end stage of which is called cirrhosis, and is associated with chronic liver functional impairment. In the United States, chronic liver disease was the 12th leading cause of death in 2006 (Heron et al. 2009). Abusive alcohol consumption, hepatotoxins (e.g., aflatoxin B1), autoimmunity, nonalcoholic fatty liver disease, and infections with hepatitis B and C viruses are the main cause of chronic hepatitis (Sherman 2010). Liver cancer can be the ultimate consequence of chronic liver injury (Wallace, Burt, and Wright 2008). Hepatocellular carcinoma (HCC) alone is the fifth most common cancer and the third cause of cancer-related death worldwide (Parkin et al. 2001; Wallace, Burt, and Wright 2008). Given the very limited therapeutic options, understanding the intricate cellular interactions implicated in liver fibrogenesis and subsequent progression to neoplasia is crucial.
Major events in the development of hepatic fibrosis in mammals involve activation of the transforming growth factor beta (TGF-β) pathway and hepatic stellate cells (HSCs) that result in an increased production of collagen, altered balance between matrix metalloproteinases (MMPs) and tissue inhibitors of metalloproteinases (TIMPs), and, as an end result, excessive deposition of collagenous extracellular matrix in the hepatic parenchyma (Hernandez-Gea and Friedman 2010).
Dimethynitrosamine (DMN) is a potent carcinogenic hepatotoxin previously used in rodents to model human hepatic fibrosis, cirrhosis, and HCC (Ala-Kokko et al. 1987; Jezequel et al. 1987; George et al. 2001; Tada et al. 2001; Hyon et al. 2011). In a comparative model, Hobbie et al. (2011) reported that Japanese medaka fish (Oryzias latipes) exposed to DMN developed morphological hepatic changes similar to those observed in human fibrotic livers and the well-established DMN-induced rat model of hepatic fibrosis (Ala-Kokko et al. 1987; Jezequel et al. 1987; Ohara et al. 2007; Hobbie et al. 2011; Hyon et al. 2011). Currently, knowledge of the mechanisms of hepatic fibrosis and progression to neoplasia in fish is limited. Using immunohistochemical approaches, Hobbie et al. (2011) demonstrated increased muscle-specific actin (MSA), TGF-β1, and mothers against decapentaplegic homolog 3 (SMAD 3)-labeled cells in livers of DMN exposed medaka. These results suggested that myofibroblastic transdifferentiation of HSCs and upregulation of the TGF- β pathways occur in medaka liver fibrosis similar to that observed in rodent models and humans (Hobbie et al. 2011).
In this study, we refined the DMN-exposure parameters to reliably induce severe hepatic fibrosis/cirrhosis and hypothesized that activation of HSCs and upregulation of the canonical TGF-β pathways, MMPs, and TIMPs genes are critical steps in the development of hepatic fibrosis after DMN-induced hepatic injury in Japanese medaka. The expression of key genes involved in the pathogenesis of fibrosis in mammals was anchored to the activation of medaka HSCs and deposition of collagenous matrix. Our overarching aim using the medaka fish model was to enhance our knowledge of the comparative vertebrate pathogenesis of hepatic fibrosis.
Materials and Methods
Chemicals
Dimethylnitrosamine (DMN, C2H6N2O; 99.9%, CAS 62-75-9, molecular weight [MW] 74.08 g/mol) was obtained from Sigma-Aldrich (St. Louis, MO). The air-tight brown bottle of DMN was stored within a metal container at 4°C. All chemicals and reagents used in this study were of the highest purity available from commercial resources.
Medaka and DMN Exposures
Male and female orange-red Japanese medaka were obtained initially as 3-month-old fish from an in-house stock population maintained under recirculating freshwater aquaculture conditions at the Department of Molecular and Environmental Toxicology, North Carolina State University (NCSU), Raleigh. NC Fish were acclimated in 10 gallon aquarium tanks filled with reconstituted (0.5 g/L Instant Ocean® salts, Aquarium System Inc., Mentor, OH) reverse osmosis–purified (RO) water within a recirculating, freshwater culture system. The system was maintained under an artificial light photoperiod (16 hours light/8 hours dark) with water temperature of 26°C ± 0.5°C, pH of ∼6.5 and conductivity of 600 to 800 µS. Dry food (Otohime B1, Reed Mariculture, Campbell, CA) was fed four times per day through automated feeders. Animal care and use were in conformity with protocols approved by the NCSU Institutional Animal Care and Use Committee in accordance with the National Academy of Sciences Guide for the Care and Use of Laboratory Animals.
When the fish were 6 to 8 months old, 170 medaka (male and female) were exposed to 100 µg/L (ppm) DMN for 2 weeks in the ambient water. Ninety medaka (male and female) were used as unexposed controls. Fish were exposed in 4-L glass beakers containing 3-L of reconstituted RO water as described above. For all exposures, medaka were randomly distributed among the 4-L glass beakers, 10 to 12 fish per beaker. The beakers were placed within a recirculating, heated water bath to maintain a temperature of 26°C ± 0.5°C throughout the exposures. DMN dilutions were made from the DMN stock solution (in H2O) and prepared new prior to each exposure. DMN spiked water (95% water change) was replaced every 3 days to compensate for photodegradation of the compound and maintain water quality (Hobbie et al. 2011). Ammonia levels remained under 0.25 mg/L throughout the entire study. During the exposure, fish were fed once daily with dry fish food (Otohime B1) and observed twice daily for behavioral responses and/or signs of overt toxicity. Following exposure, fish were removed from the exposure beakers, gently rinsed in RO water, and replaced in 10 gallon aquarium tanks for up to 12 weeks at a density of 40 fish per tank.
Sampling Method and Tissue Processing
Twenty-four exposed and 14 control fish were euthanatized with an overdose of tricaine methanesulfonate (300 mg/L; MS-222, Argent Laboratories, Redmond, WA) at 2, 4, 6, or 10 weeks’ postexposure. The gender of the fish was determined by examining external sex characteristics and gonadal phenotype. The liver of 20 exposed and 10 control fish were examined grossly, harvested, and cut into two approximately equal-sized pieces. One was snap frozen in liquid nitrogen for RNA isolation and quantitative PCR (qPCR) analysis. The other piece was fixed in freshly made 4% paraformaldehyde solution (pH 7.2) for 24 hours and transferred to 70% ethanol for histopathology. A few small samples (1 × 1 mm) of four exposed and control livers were fixed in 4% formaldehyde and 1% glutaraldehyde buffered in monobasic sodium phosphate, pH 7.2 to 7.4 (4F:1G) for transmission electron microscopy (McDowell and Trump 1976). To detect infectious diseases or background lesions in organs other than the liver that could have influenced the study results, a subset of fish was examined whole by histology. The celomic cavities of four control and four exposed fish were incised along the ventral midline to enhance fixative penetration and fish were fixed as above for 24 hours, demineralized in 10% formic acid for 24 hours, and transferred to 70% ethanol for histopathology.
Histology
Paraformaldehyde-fixed livers were processed and embedded in paraffin according to routine histologic techniques. Sections, 5-µm thick, were stained with hematoxylin and eosin (H&E) and examined by light microscopy. Sections of liver were also stained with Masson’s trichrome stain according to standard methods. Medaka liver lesions were identified based on criteria set by a consensus of the U.S. National Toxicology Program pathology working group and the International Harmonization of Nomenclature and Diagnostic Criteria for Lesions in Rats and Mice (INHAND) project (Boorman et al. 1997; Thoolen et al. 2010).
Immunohistochemistry
Immunohistochemical studies were performed using single and double staining techniques. Five-micrometer-thick paraffin sections from all livers were used for MSA and pancytokeratin (CK) immunohistochemistry. The MSA primary antibody used was a mouse monoclonal antibody that recognizes a 42-kD protein specific for actin in skeletal, cardiac, and smooth muscle (BioGenex Laboratories, San Ramon, CA; Catalogue # MU090-UC). The CK AE1/AE3 antibody used was a cocktail of 2 mouse monoclonal antibodies that recognize several acidic (10, 14 to 16, 19), and all basic (1–8) human cytokeratins (BioGenex Laboratories, Catalogue # AM0751-5M). The TGF-β1 antibody was a rabbit polyclonal antibody that recognizes the human TGF-β1 C-terminus (Santa Cruz Biotechnology Inc., Santa Cruz, CA; Catalogue # sc 146). Tissue sections were deparaffinized in xylene, rehydrated in a graded series of ethanol, and rinsed in distilled water. Antigen retrieval was performed only for CK staining by heating the slides at 99°C in a 10 mM sodium citrate solution at pH 6 for 10 min in a vegetable steamer (Oster 5712 food steamer, Maitland, FL). Following antigen retrieval, a cool down period of 10 min in the warm sodium citrate buffer preceded rinsing of the slides in 1× phosphate-buffered saline (PBS). Slides were treated with 3% hydrogen peroxide for 10 min to block the activity of endogenous peroxidases. Goat serum was applied for 20 min to prevent nonspecific binding of the secondary ntibody (BioGenex Laboratories).
For single staining, avidin and biotin blocks were applied successively for 15 min each (BioGenex Laboratories). Tissues were incubated with the MSA antibody (1/100 dilution) or CK antibody (sold prediluted) for 30 min at room temperature or with the TGF-β1 antibody (1/500) overnight at 4°C. For double staining, tissues were incubated with a primary antibody cocktail of MSA and TGF-β1 or CK and TGF-β1 antibodies overnight at 4°C. The slides were rinsed in 1× PBS. For single staining, the slides were incubated with the secondary antibody for 20 min (BioGenex Laboratories). After a wash in 1× PBS, tissue sections were then treated for 20 min with streptavidin peroxidase (BioGenex Laboratories). For double staining, the slides were incubated with a polymer cocktail detection system for 30 min at room temperature (anti-mouse/horseradish peroxidase [HRP] + anti-rabbit/alkaline phosphatase [AP], MultiVisionPolymer Detection System, Thermo Fisher Scientific, Lab Vision Corporation, Fremont, CA). Following a final wash in 1× PBS, development was achieved by treatment of tissue with liquid 3,3-diaminobenzidine (DAB) chromogen for 15 sec to 1 min (Vector Lab, Burlingame, CA). For double staining, the development was achieved using first LVBlue (Thermo Fisher Scientific, Lab Vision Corporation) for AP activity followed by DAB for HRP activity. After a wash in tap water, the slides with single staining were counterstained with Mayer’s hematoxylin for 20 to 40 s and cover slipped. The slides with double staining were counterstained lightly with methyl green and cover slipped. For each immunohistochemical reaction, appropriate controls were run. The primary antibody was omitted and replaced by nonimmune serum of the same animal source in the negative control. Sections of normal intestine and liver were included on each slide to serve as positive controls.
Morphometry
The number of activated stellate cells was determined by measuring the percentage area occupied by MSA immunoreactivity. For each liver histologic section, 15 randomly selected sites were photographed at 600× using an Olympus DP 25 digital microscope camera with the CellSens® digital imaging software mounted on an Olympus BH 51 microscope (Olympus Corporation, Tokyo, Japan). The images were manually thresholded to highlight the MSA immunoreactive cells and the background was subtracted using Adobe Photoshop CS4 (PhotoshopCS4; Adobe Systems, Park Avenue, San Jose, CA). The same setting was used for all images in a given data set. The best setting for background subtraction was determined empirically by testing images with the lowest and highest amount of MSA immunopositivity. Finally, the area fraction covered with the MSA-positive cells, expressed as a percentage of the picture surface area, was measured using an automatic image analysis system (ImageJ, NIH, Bethesda, MD).
The extent of liver fibrosis was determined semiquantitatively and assigned a 0 to 3 score using Masson’s trichrome stained slides. The scale used was as follows: 0: no fibrosis; 1, mild fibrosis (small amount of fibrous tissue dissecting between the hepatocyte tubules); 2, moderate fibrosis (moderate amount of fibrous tissue dissecting between hepatocyte tubules with occasional presence of hepatocellular nodules); and 3, severe fibrosis/cirrhosis (frequent large fibrous tissue septa dissecting and isolating variably sized aggregates of hepatocytes, and frequent hepatocellular nodules).
Electron Microscopy
For transmission electron microscopy (TEM), liver samples fixed in 4F:1G were dehydrated in a graded series of ethanol and embedded in Spurr resin (Dykstra 1993). To determine whether the structures of interest were in planar sections of the block face, semithin sections, 0.5 µm thick, stained with 1% toluidine blue in 1% sodium borate, were examined under a light microscope. Ultrathin sections, 90 nm thick, of appropriate blocks were stained with uranyl acetate and lead citrate and examined with an FEI/Philips EM 208S transmission electron microscope (Laboratory for Advanced Electron and Light Optical Methods, NCSU).
Reverse Transcription and Real-Time PCR
Liver samples were homogenized using the Bullet Blender (Next Advance, Averill Park, NY) with 0.5 mm zirconium oxide beads (setting 6 for 3 min) and total RNA was extracted using RNA Bee (Tel-Test Inc., Friendswood, TX) according to the manufacturer's instructions. RNA purity (260/280 ratio) and quantity were determined using a NanoDrop ND-1000 spectrophotometer (NanoDrop Technologies, Wilmington, DE). RNA quality was determined using RNA Nano chips with an Agilent Bioanalyzer 2100 (Agilent Technologies, Palo Alto, CA). Only RNA samples with RNA integrity number (RIN) >7 and a 260/280 ration between 1.75 and 2.05 were used for qPCR analysis and these were stored at −80°C to minimize degradation.
RNA was reverse transcribed into complementary DNA (cDNA) using 1 µg total RNA and the high-capacity cDNA master kit from Applied Biosystems (Foster City, CA) as per the manufacturer's instructions with random hexamer as primer and processed using real-time qPCR.
Selected genes were identified in the medaka genome (http://www.ensembl.org/Oryzias_latipes/Info/Index) and assigned gene names consistent with the zebrafish nomenclature guidelines (https://wiki.zfin.org/display/general/ZFIN+Zebrafish+Nomenclature+Guidelines). All duplicated genes were described as “a” and “b” based on the orthology with zebrafish genes. Specific primers were designed for tgfb1, tgfbr1, tgfbr2, smad3a, smad3b, beta-catenin (ctnnb1), myc, mmp2, mmp13, mmp14a, mmp14b, timp2a, timp2b, timp3, col1a1a, col1a1b, and col4a1 (Table 1). The efficiency of each primer fell between 90% and 110%.
Sequences for primers used in quantitative, real-time PCR.
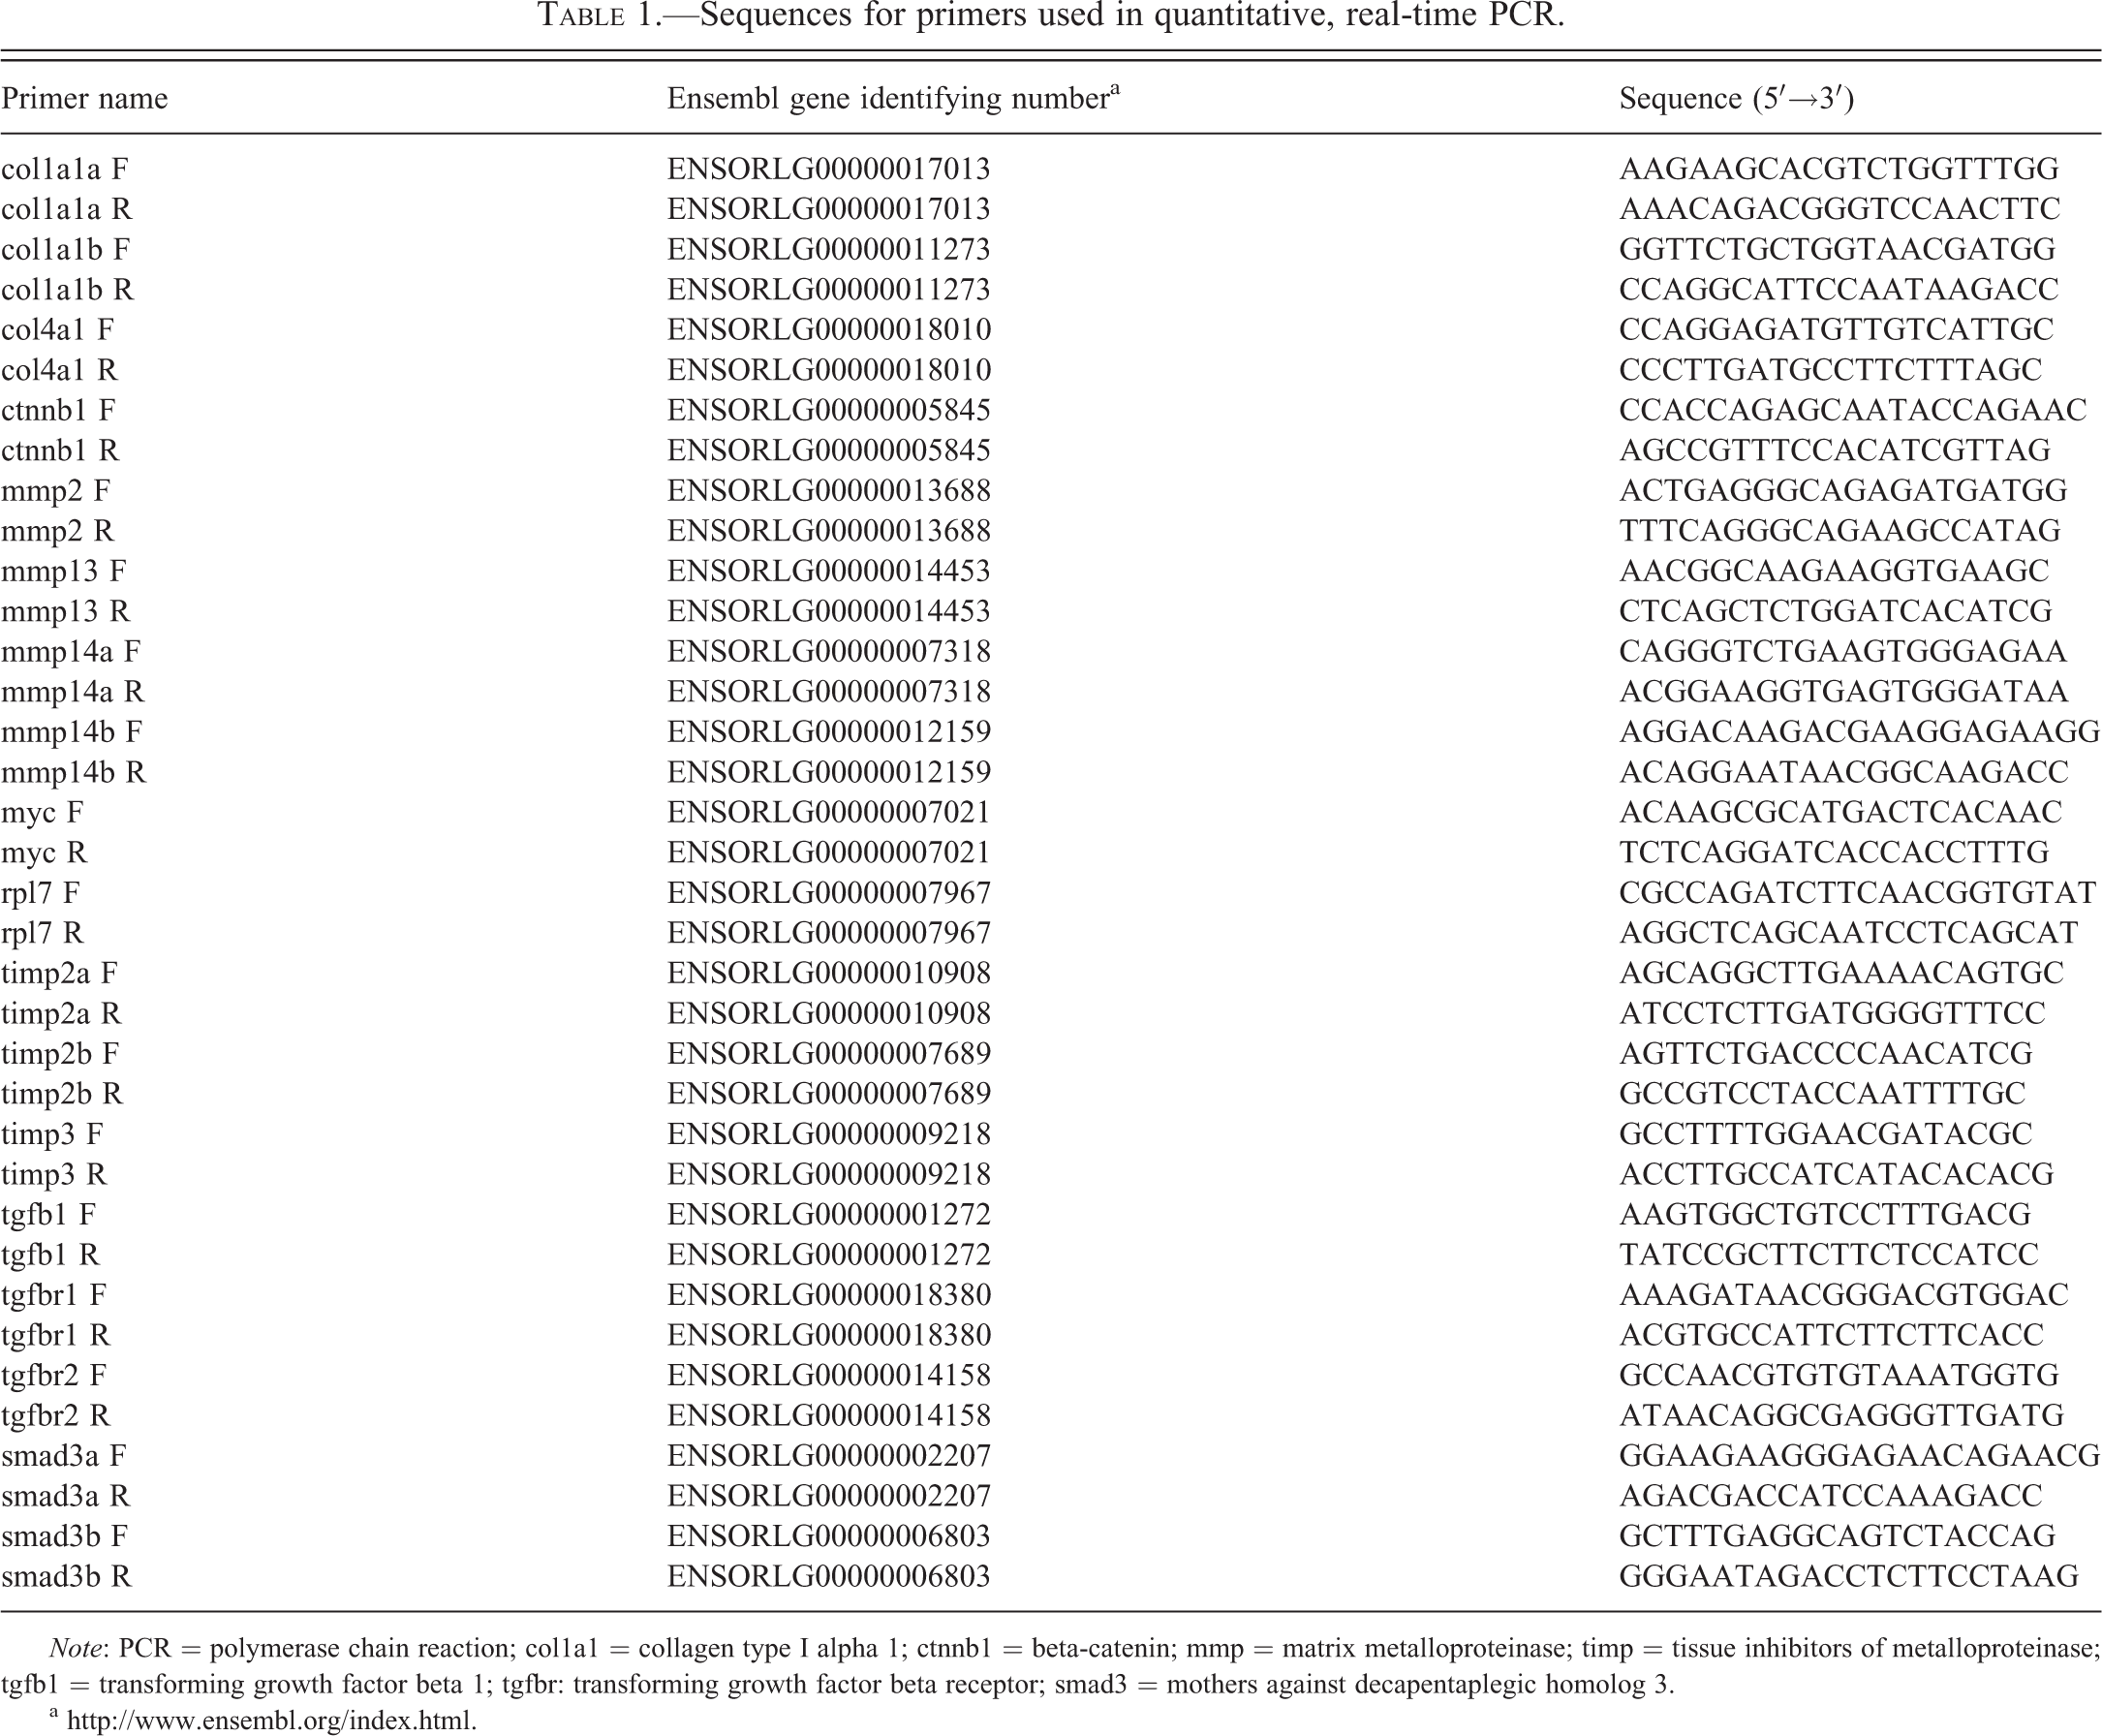
Note: PCR = polymerase chain reaction; col1a1 = collagen type I alpha 1; ctnnb1 = beta-catenin; mmp = matrix metalloproteinase; timp = tissue inhibitors of metalloproteinase; tgfb1 = transforming growth factor beta 1; tgfbr: transforming growth factor beta receptor; smad3 = mothers against decapentaplegic homolog 3.
cDNAs were PCR amplified separately in triplicate using a 96-well PCR plate and an ABI PRISM 7000 Sequence Detection System (Applied Biosystems). Relative levels of the gene transcripts of interest listed above were measured using qPCR and normalized to ribosomal protein L7 (RPL-7; Zhang and Hu 2007). Each 25 µl real-time PCR reaction consisted of 2.5 µl (1 ng/µl) first-strand cDNA, 8 µl RNase-free water, 1 µl of 10 µM forward primer, 1 µl of 10 µM reverse primer, and 12.5 µl of SYBR® Green PCR Master Mix (AB Applied Biosystems). Real-time PCR conditions were 50°C for 2 min, 95°C for 10 min followed by 41 cycles of 95°C for 15 s, 60°C for 1 min, and a last cycle at 95°C for 15 s and 60°C for 15 s. Relative quantitation of gene expression within each reaction was calculated following the method of Livak and Schittgen (2001).
Data Analysis and Statistics
Liver phenotypes, MSA area data, and fibrosis score were compiled in spreadsheets and organized by fish case number using Microsoft Excel software (Microsoft, Redmond, WA). The fish were grouped by phenotypes and the MSA percentage area and fibrosis score were calculated for each phenotype and expressed as mean ± standard error of the mean (SEM). All qPCR data were expressed as the mean mRNA level ± SEM. The difference in gene expression levels or MSA positive areas between the phenotypes was determined using the Mann–Whitney U test. The difference in fibrosis scores between phenotypes was determined using Fisher’s exact test. A P value less than .05 was considered significant. Correlation between MSA percentage area and fibrosis score or gene expression and fibrosis score was determined using the Spearman rank correlation test. The Fisher’s exact test was performed using SAS Version 9.1.3 for Windows (SAS institute, Cary, NC). The Mann–Whitney U tests and Spearman rank correlation tests were performed using Sigma Stat 3.0 (SPSS Inc., Chicago, IL, USA).
Results
Among the 170 fish exposed to DMN, 22 (12.9%) died or were euthanized for humane reasons during the growing period. Given that autolysis occurs rapidly in tank water maintained at 26°C, 14 fish were moderately to severely autolysed at the time; they were found and were discarded. The remaining 8 fish were evaluated by histology and had severe hepatic fibrosis/cirrhosis. None of the control fish died or were euthanized on ethical grounds during the duration of the study. For quality control, four additional unexposed and four exposed fish at each time point were processed for whole animal histology and evaluated for undetected infectious disease or background lesion in organs other than the liver that could influence the study results. Based on the analysis of whole body parasagittal sections, no evidence of extrahepatic disease or remarkable morphological change was observed in any of the animals examined. Rather, significant morphological changes were limited to livers of exposed fish.
Gross Findings
Among the exposed fish, no macroscopic lesions were noted in the fish with hepatocellular degeneration or bile preductular epithelial cell (BPDEC) hyperplasia, although some of the livers were subjectively paler than the majority of the control livers. Livers of fish with hepatic fibrosis had a mildly to markedly bosselated surface and their overall size was subjectively within normal limits or rarely was reduced (Figure 1A). Among the 32 livers diagnosed with hepatic neoplasia on histology, 15 livers had a grossly visible discrete hepatic tumor. The overall liver size was markedly increased and filled most of the celomic cavity in 2 fish.
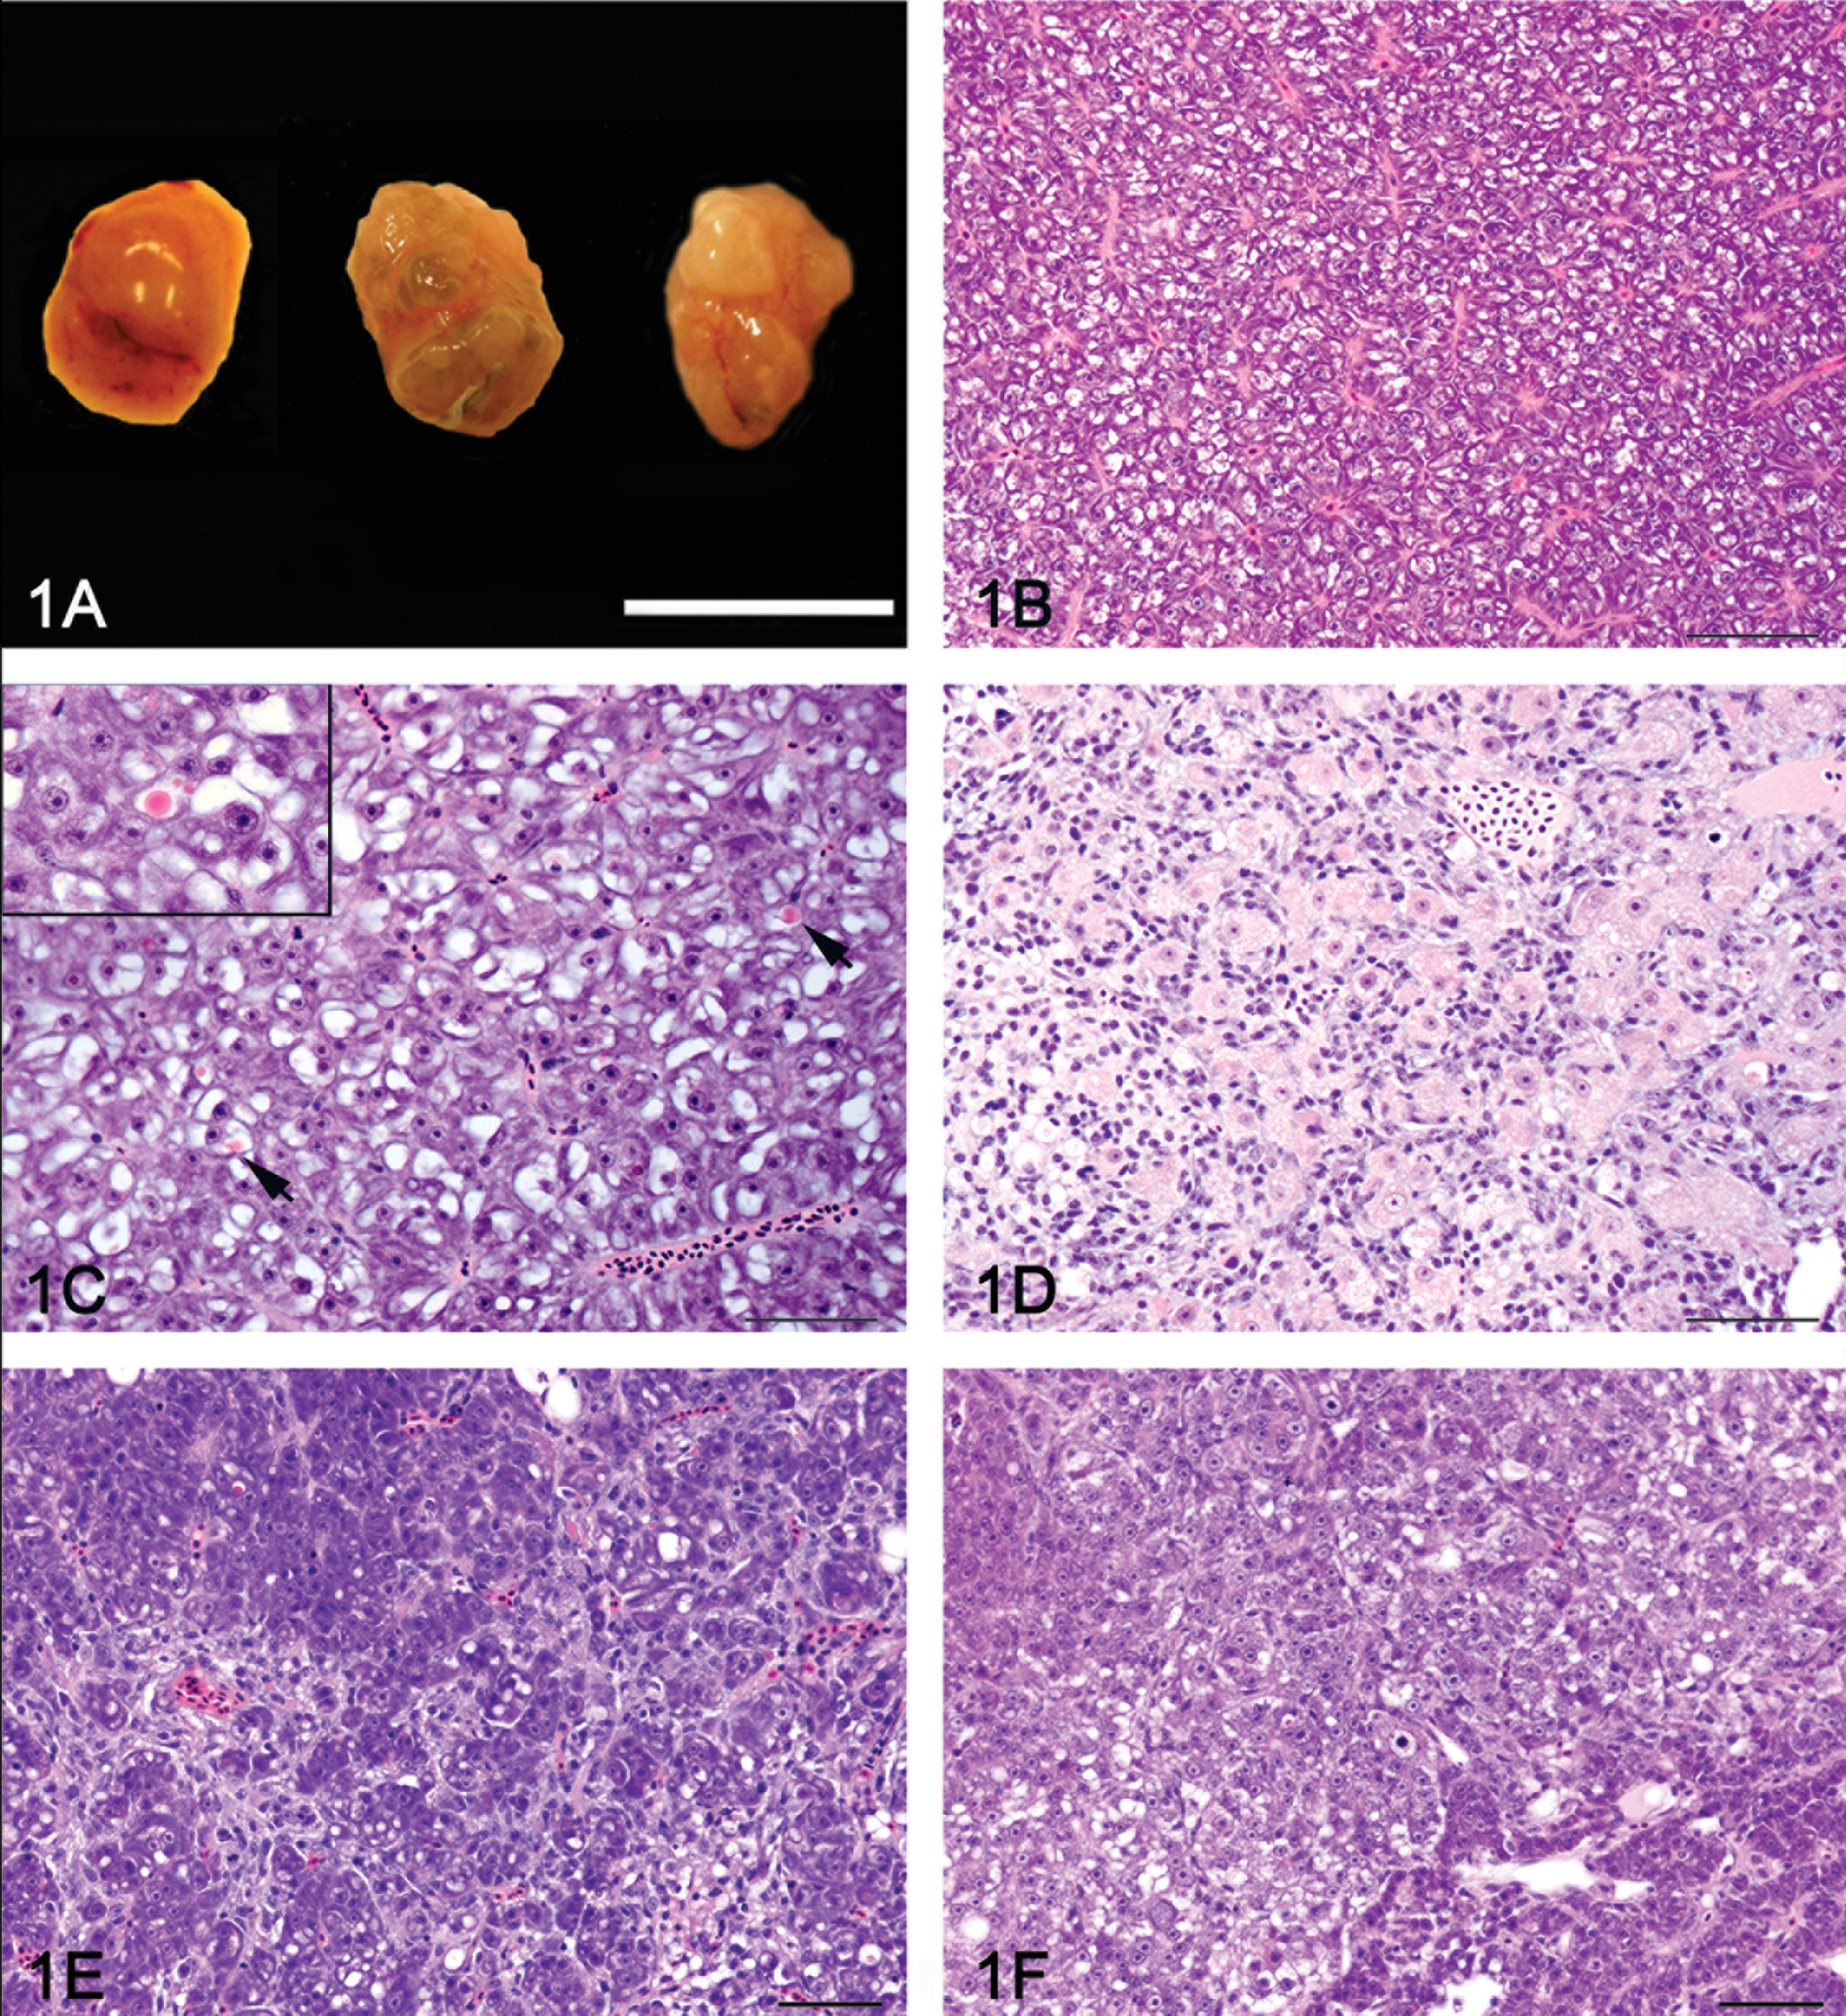
Gross appearance and histology of control and dimethylnitrosamine (DMN) exposed liver. (A), Gross appearance of a normal medaka liver (left) and two livers with severe hepatic fibrosis (center and right). The liver on the right has a grossly visible neoplasm diagnosed as a hepatocellular carcinoma by histology. (B), Histology of a normal female medaka liver (phenotype 0). (C), Hepatocellular degeneration (phenotype 1) characterized by increased hepatocellular vacuolization, presence of globular eosinophilic intracytoplasmic inclusions (arrow), and scattered apoptotic hepatocytes. Inset: Close-up of an eosinophilic intracytoplasmic inclusion (100×). (D), Biliary preductular epithelial cell hyperplasia (phenotype 2) characterized by proliferation of small cells with hyperchromatic elongated nuclei that separated the hepatocytes and sometimes surrounded by individual hepatocytes. (E), Hepatic fibrosis (phenotype 3) characterized by increased connective tissue separating and individualizing single or small group of hepatocytes. (F), The hepatic fibrosis and neoplasia phenotype (phenotype 4) was defined as hepatic fibrosis with the presence of a hepatic neoplasm (hepatocellular carcinoma or cholangiocellular carcinoma). Hematoxylin and eosin 40×.
Histology
Ninety-five half-livers from the exposed fish and 56 half-livers of control fish were evaluated by histology. Morphological changes and categorization of the livers were performed using H&E and Masson’s trichrome-stained liver sections. The control fish showed normal hepatic architecture with the exception of two fish collected at 10 weeks’ postexposure, which had multifocal aggregates of macrophages within the hepatic parenchyma. A Ziehl-Neelsen stain did not reveal any acid-fast bacteria. The cause of the macrophage aggregates in these two fish was not determined. They were treated as outliers for the remainder of the study.
Histologic lesions observed in the liver of exposed fish included hepatocellular vacuolar degeneration, Mallory body-like inclusion, hepatocyte hypertrophy, karyomegaly, altered foci, necrosis, collapse of the hepatic architecture, histiocytic inflammation, BPDEC hyperplasia (presumed fish liver bipotential progenitor cell), HSCs hyperplasia, biliary hyperplasia, fibrosis, hepatocellular regeneration, and multinodular reorganization of the liver architecture. Neoplasms included cholangiocarcinoma (CC), HCC, combined hepatocellular–cholangiocarcinoma (CHC), and a single spindle cell neoplasm, the so-called hemangiopericytoma of fish. A summary of the histologic lesions is presented in Table 2.
Degenerative and proliferative hepatic lesions in medaka exposed to 100 ppm dimethylnitrosamine for 2 weeks.
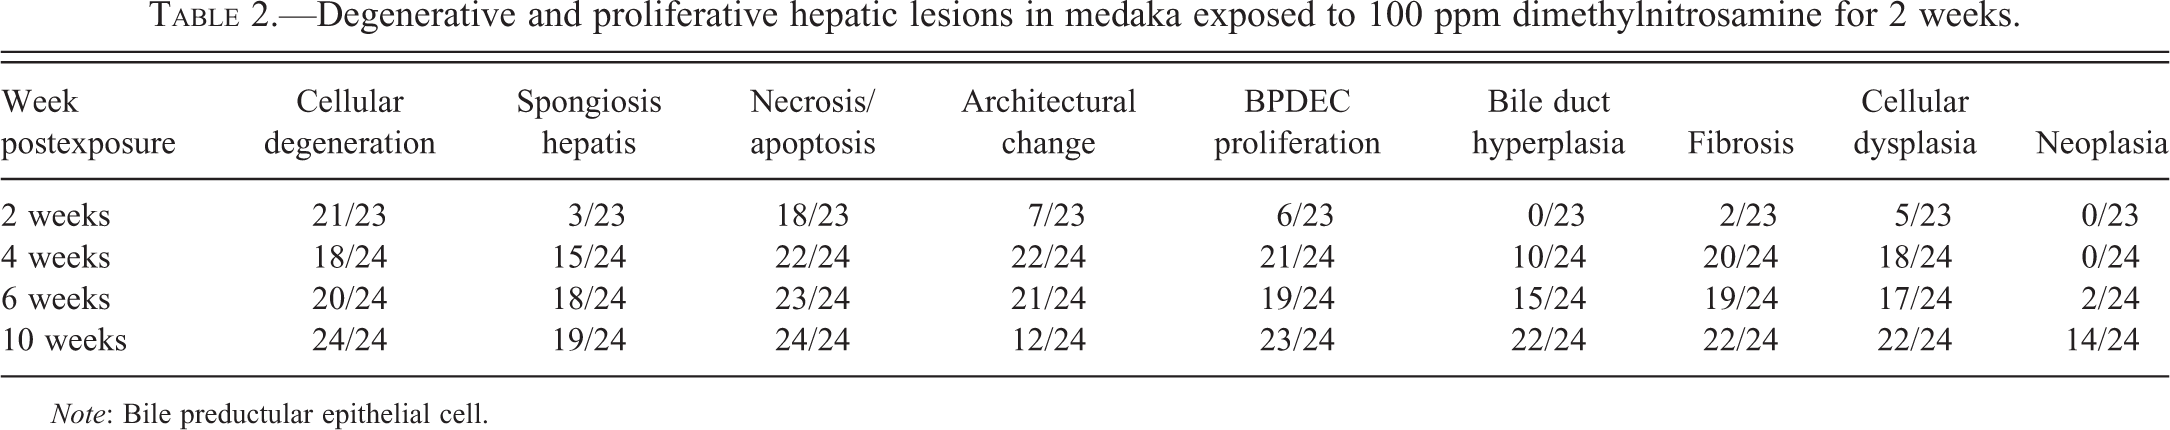
Note: Bile preductular epithelial cell
The morphological changes in the liver were classified into five different phenotypes: (0) normal liver, (1) hepatocellular degeneration, (2) BPDEC hyperplasia, (3) hepatic fibrosis, and (4) hepatic fibrosis and neoplasia. A normal liver phenotype was defined as a liver with a normal architecture and an absence to moderate amount of hepatocellular vacuolization (Figure 1B; Hardman et al. 2007). The hepatocellular degeneration phenotype was characterized by an increase in hepatocellular vacuolization, presence of globular eosinophilic intracytoplasmic inclusions, and scattered apoptotic hepatocytes (Figure 1C). The BPDEC hyperplasia phenotype was characterized by proliferation of small elongated cells with hyperchromatic round to elongated nuclei that separated the hepatocyte tubules and sometimes surrounded individual hepatocytes (Figure 1D). The BPDEC hyperplasia phenotype closely resembled the oval cell hyperplasia that is observed in rodents (Thoolen et al. 2010). The hepatocytes were often variably sized, hypereosinophilic, and with reduced amounts of glycogen. The hepatic fibrosis phenotype was characterized by increased fibrous connective tissue separating hepatocyte tubules. In advanced fibrosis stages, the collagenous stroma separated and individualized single or small groups of hepatocytes and hepatocyte tubules (Figure 1E). The hepatic fibrosis with neoplasia phenotype was defined as a fibrotic liver with the presence of a hepatic neoplasm (HCC or cholangiocellular carcinoma; Figure 1F).
Within exposed groups, there were 41 (43%) males, 54 (56%) females, and 1 (1%) medaka of undetermined gender. In the control group, we identified 31 (55%) males and 25 (45%) females. Four fish (4%) in the exposed group had no hepatic lesions (phenotype 0); 22 (23%) had evidence of degenerative hepatocellular changes (phenotype 1); 19 (20%) had marked BPDEC hyperplasia (phenotype 2); 34 (36%) had hepatic fibrosis (phenotype 3); and 16 (17%) developed liver neoplasia (phenotype 4). Among the livers with hepatic neoplasms, 10 fish (63%) were identified with HCC (2 males and 8 females), 3 (19%) with CC (1 males and 2 females), 2 (12%) fish with HCC and a CC (females), and 1 (6%) fish with hemangiopericytoma (unknown sex). The liver of 1 fish (1%) collected at 2 weeks’ postexposure was lost during processing for histology. The rate of occurrence of the five histologic phenotypes observed at 2, 4, 6, and 10 weeks postexposure is presented in Figure 2. At 2 weeks’ postexposure, 3 (13%) male fish had no hepatic lesions, 3 (13%) males and 13 (57%) females had hepatocellular degenerative changes, and 4 (17%) males had BPDEC hyperplasia. At 4 weeks’ postexposure, 1 (4%) male fish had a normal liver, 2 (8%) females had evidence of hepatocellular degeneration, 7 (29%) males and 1 (4%) female had BPDEC hyperplasia, and 13 (54%) females had hepatic fibrosis. At 6 weeks’ postexposure, 4 (17%) females had hepatocellular degenerative changes, 4 (17%) males had BPDEC hyperplasia, 2 (8%) males and 12 (50%) females had hepatic fibrosis, and 2 (8%) females had hepatic neoplasms on a background of hepatic fibrosis. At 10 weeks’ postexposure, 3 (12%) males had BPDEC hyperplasia, 4 (17%) males and 3 (12%) females had hepatic fibrosis, and 5 (21%) males and 9 (38%) females had hepatic neoplasms.
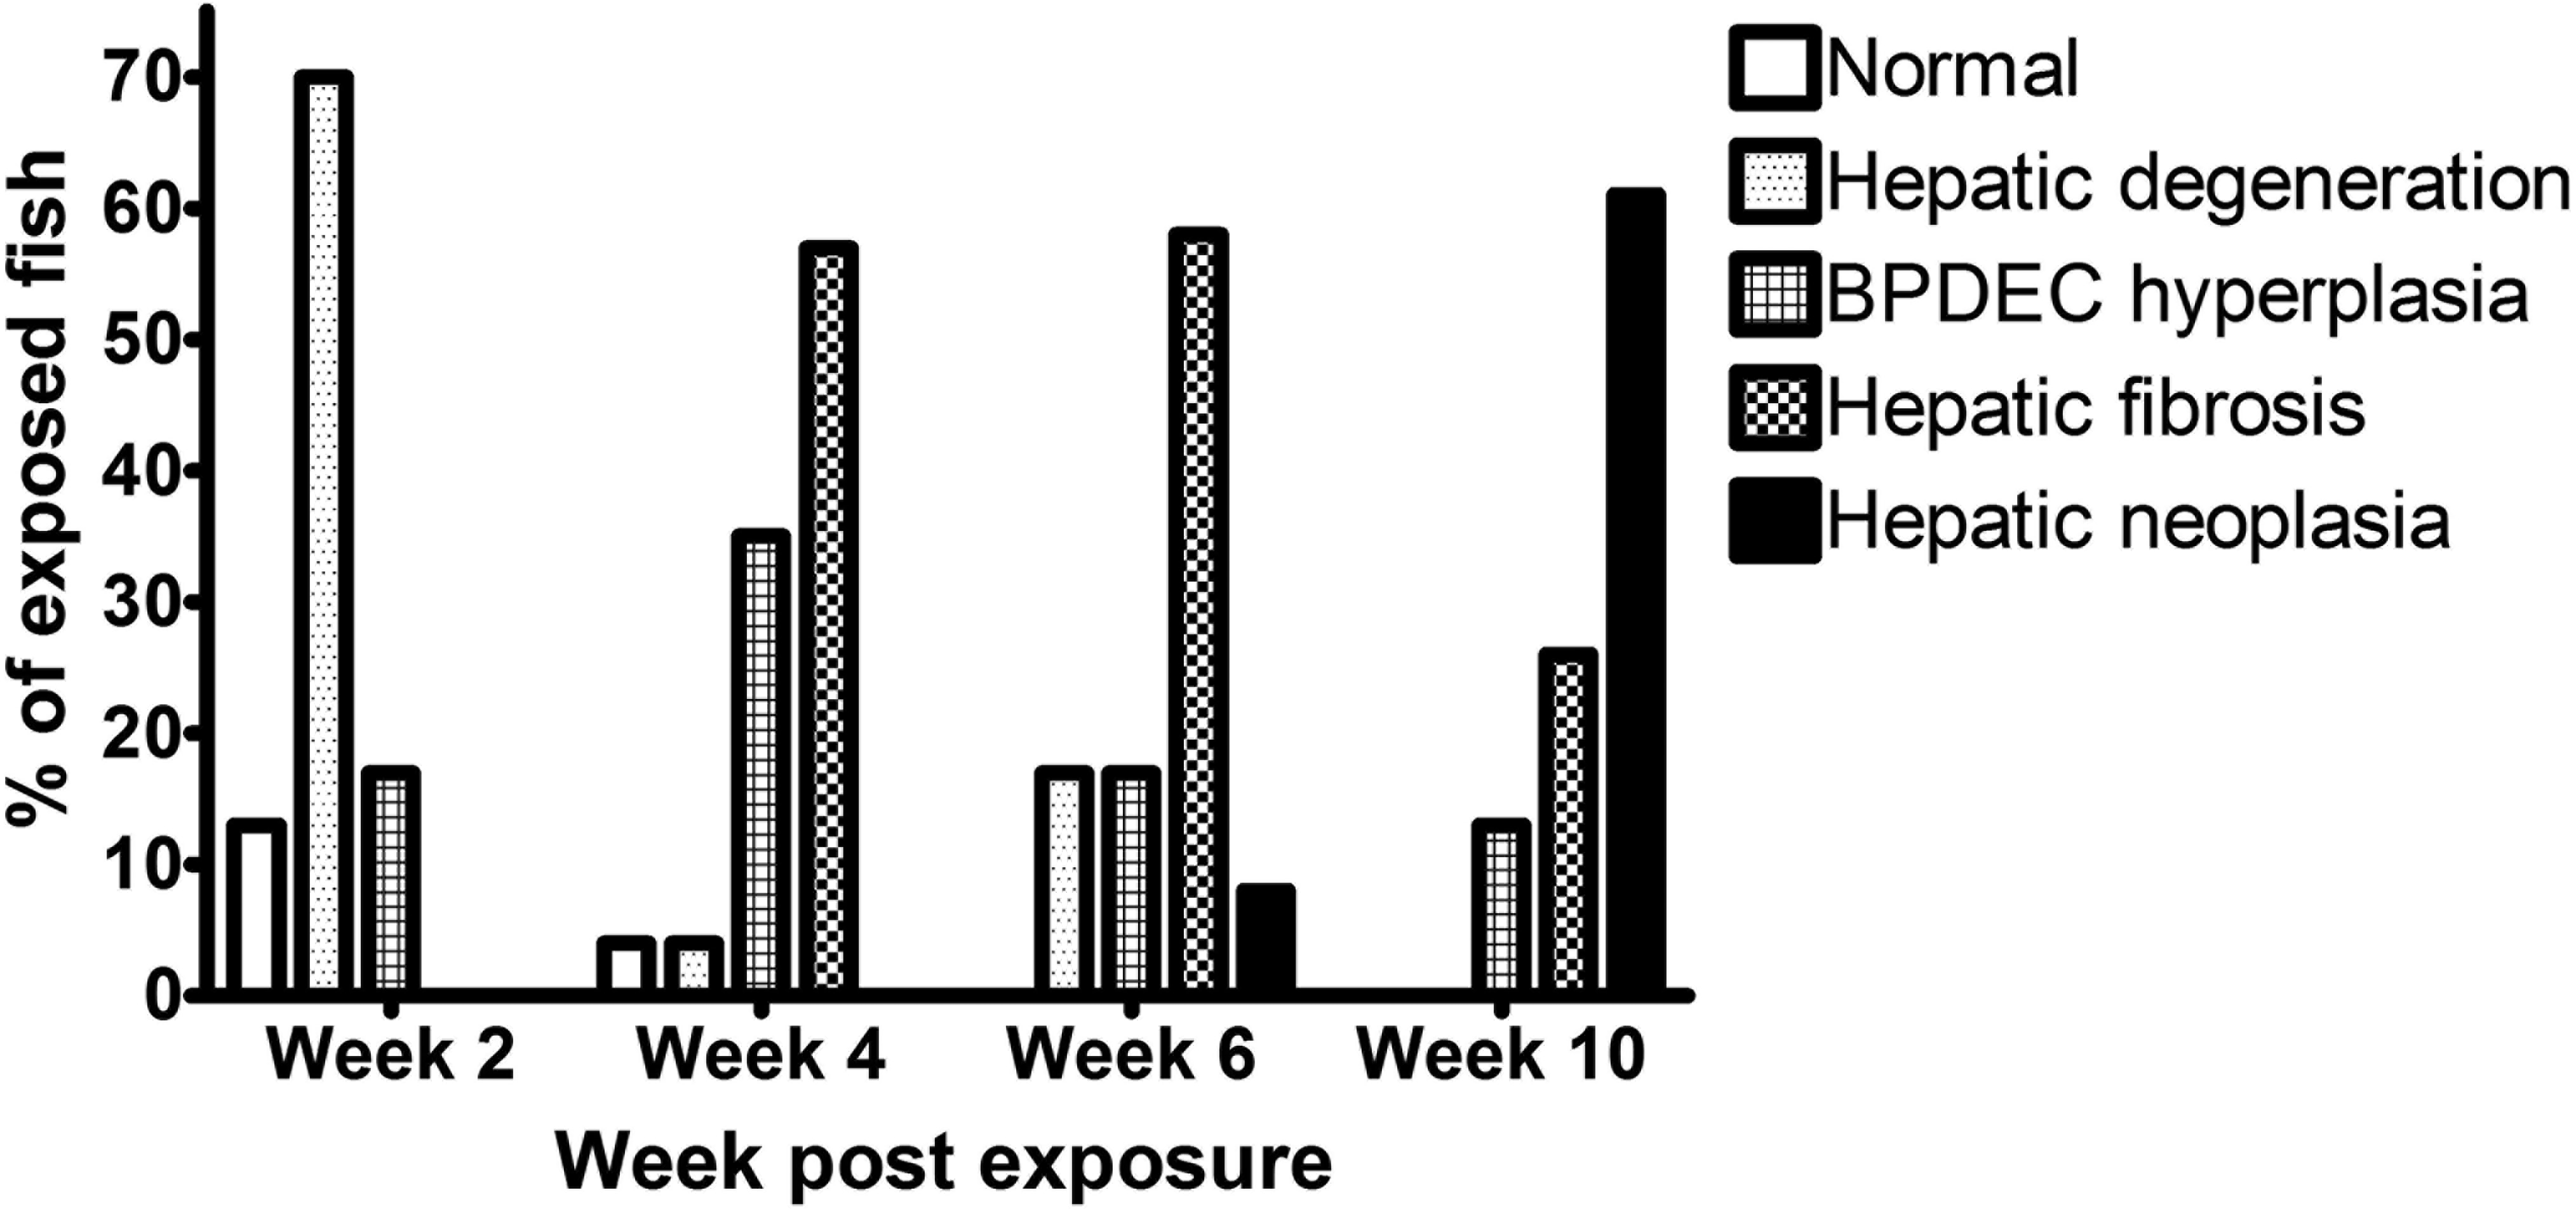
Rate of occurrence of the five histologic liver phenotypes observed at the 2, 4, 6, and 10 weeks after dimethylnitrosamine (DMN) exposure.
Following DMN exposure, there was a defined temporal progression toward fibrosis and neoplasia. First hepatocellular degeneration was observed, followed by BPDEC hyperplasia, hepatic fibrosis, and ultimately hepatic fibrosis with neoplasia. Females progressed faster to hepatic fibrosis and neoplasia than did males (i.e., males lagged by approximately 2 weeks, data not shown) as reported previously for neoplasia following diethylnitrosamine exposure (Teh and Hinton 1998).
Transmission Electron Microscopy
To confirm that the HSC acquired fibroblast-like characteristics and that collagen was the extracellular matrix (ECM) deposited, control and fibrotic livers were examined by TEM. In control livers, cells with HSC morphologic characteristics were extremely rare and no cells demonstrated fibroblast-like features. However, in fibrotic livers, HSCs were more frequent. Those with HSC morphologic characteristics were located adjacent to collagen fibrils, and these cells had acquired myofibroblast characteristics such as cytoplasmic intermediate filament bundles, loss of lipid vacuoles, and occasional presumptive collagen secretion granules (Figure 3). Collagen fibrils in the space of Disse were very rare in control livers but frequently observed in fibrotic livers.
Transmission electron microscopy of an activated hepatic stellate cell (HSC). Collagen fibrils (C) and a macrophage (M) are also present in the space of Disse. This HSC has lost its lipid vacuole/vacuoles and a bundle of intermediate filaments (arrow head) is present in the cytoplasm. E = endothelial cell; RBC = red blood cell. 8,900×.
Morphometry
MSA
Morphometric quantitation of MSA immunolabeling was used as a measure of stellate cell myofibroblastic transdifferentiation (Figure 4). Liver sections from 22 controls, 12 of phenotype 1, 8 of phenotype 2, 16 of phenotype 3, and 12 of phenotype 4 had adequate MSA immunohistochemical labeling for morphometric analysis. The relationship between phenotype and the percentage area occupied by the MSA immunoreactive cells is presented in Figure 5. The percentage area of MSA staining was significantly different between phenotypes except between control and phenotype 1 (hepatic degeneration; p < .05). All MSA-positive cells were included for the morphometric analysis although a significant number were likely myofibroblasts. Cells located in the hepatic parenchyma and immunoreactive for MSA were interpreted as activated stellate cells. Cells closely surrounding bile ducts were interpreted as myofibroblasts. In control liver, MSA-positive cells were only observed closely surrounding bile ducts.
Immunolabeling for muscle-specific actin (MSA) as a measure of stellate cell myofibroblastic transdifferentiation. Representative picture of a control liver (A) and liver with hepatic fibrosis (B). MSA immunohistochemistry, hematoxylin counterstain. 40×.
Morphometric quantitation of muscle-specific actin (MSA) immunolabeling as a measure of stellate cell myofibroblastictrans differentiation. Relationship between phenotype and the area percentage occupied by the MSA immunostained cells.
Masson’s trichrome staining
Morphometric quantitation of Masson’s trichrome staining was performed as a measure of collagen deposition and fibrosis (Figure 6). Liver sections from 22 controls, 12 of phenotype 1, 9 of phenotype 2, 17 of phenotype 3, and 12 of phenotype 4 samples had adequate Masson’s trichrome staining for morphometric analysis. The relationship between phenotype and the fibrosis score is presented in Figure 7. The fibrosis scores were significantly different between all phenotypes. The MSA percentage area was significantly correlated with the fibrosis score (p < .05, r = .903)
Masson’s trichrome staining as a semiquantitative measure of collagen deposition. (A) Representative picture of control liver; (B) grade 2, moderate fibrosis; (C) Grade 3, severe fibrosis/cirrhosis. 40×. (D) Relationship between phenotype and the fibrosis grade. Semiquantitative scoring of Masson’s trichrome stained slides as a measure of collagen deposition.
Relationship between the liver phenotypes observed following dimethylnitrosamine (DMN) exposure and the expression of mammalian fibrosis-related genes. Mean ± standard error of the mean (SEM). *Statistical difference (p < .05) in gene expression level between phenotypes.
Gene Expression
Gene expression levels were determined only in liver samples that exceeded the quality control (RIN) value for messenger RNA (mRNA) and had sufficient amounts of tissue for morphometric analysis: 25 controls, 12 of phenotype 1, 9 of phenotype 2, 18 of phenotype 3, and 12 of phenotype 4 samples were evaluated. The mRNA expression levels of multiple fibrosis–related genes were evaluated in relation to the liver phenotypes (Figure 8). Change in expression of the following genes significantly correlated with the fibrosis score in phenotypes 1 and 2: tgfb1, tgfbr2, mmp2, mmp14a, mmp14b, timp2a, timp3, col1a1a, and col1a1b (p < .05, r > .99). At later time points, when fibrosis was established and continued to progress (phenotypes 3 and 4), the expression levels of the genes listed above remained elevated but were lower than observed in phenotype 2, and therefore, correlation between gene expression level and fibrosis score was lost. No correlation was observed between gene expression of tgfbr1, smad3a, smad3b, col4a1, mmp13, timp2b, myc, ctnnb1 and fibrosis score in phenotype 1 and 2 livers.
Hepatic fibrosis. Double immunolabeling for muscle-specific actin (MSA) (brown) and transforming growth factor beta (TGF-β)-1 (blue), methyl green counterstain. Representative picture of a control liver (A). No immunoreactivity for MSA is observed in the hepatic parenchyma. TGF-β1 immunoreactivity is observed in bile preductular epithelial cell (BPDEC). Representative picture of a liver with hepatic fibrosis (B). BPDEC are increased in number, hypertrophied, and strongly positive for TGF-β1. Myofibroblasts (asterisk) and hepatic stellate cells (HSCs; arrow head) are immunoreactive for MSA. Some HSCs are immunoreactive for MSA and TGF-β1 (arrow). 100×.
TGF-β1 Localization
Immunohistochemistry was used to localize cells producing TGF-β1. In control and exposed livers with phenotype 1, TGF-β1-immunolabelling was present diffusely in the cytoplasm of cholangiocytes-forming bile ducts, the BPDECs that were scattered along the biliary canaliculi and few scattered macrophages (Figures 7 and 9). In exposed livers displaying phenotype 2 to 4, the number of cells immunolabeled with TGF-β1 was markedly increased due mainly to hypertrophy and hyperplasia of BPDECs lining biliary canaliculi and bile duct hyperplasia. Cholangiocytes and BPDECs were strongly immunoreactive. Weak to moderate positivity was present in a small number of macrophages. Occasional intermediate hepatocytes were weakly positive. No immunoreactivity for TGF-β1 was detected in the population of small elongated cells resembling rodent oval cells in the BPDEC hyperplasia phenotype (phenotype 2). TGF-β1 immunoreactivity was detected in all neoplasms. Most neoplastic hepatocytes had weak-to-moderate cytoplasmic immunoreactivity, while neoplastic cholangiocytes were consistently strongly positive (Figures 10 and 11). In order to confirm the identity of the nonhepatocyte cells expressing TGF-β1 in the hepatic parenchyma, labeling of consecutive tissue sections as well as double immunolabeling for CK, MSA, and TGF-β1 were performed. Most cells immunolabeled with TGF-β1 and located in between hepatocytes were positive for CK but negative for MSA, thus supporting the notion that they are BPDECs. A smaller number of MSA-positive cells, often located along sinusoids, and interpreted as activated HSCs, were also positive for TGF-β1 (Figures 7 and 9).
Hepatic fibrosis. Double immunolabelling for muscle-specific actin (MSA; red) and transforming growth factor beta (TGF-β)-1 (brown), hematoxylin counterstain. Bile preductular epithelial cell (BPDEC) are increased in number, hypertrophied, and strongly positive for TGF-β1. Hepatic stellate cells (HSCs; arrow head) are immunoreactive for MSA. Some HSCs are immunoreactive for MSA and TGF-β1 (arrow). ×100.
Hepatocellular carcinoma. Immunolabelling transforming growth factor beta (TGF-β)-1 (brown), hematoxylin counterstain. Most neoplastic hepatocytes display moderate cytoplasmic immunoreactivity for TGF-β1. The BPDECs in the adjacent compressed hepatic parenchyma are strongly positive for TGF-β1 as in control liver. 40×.
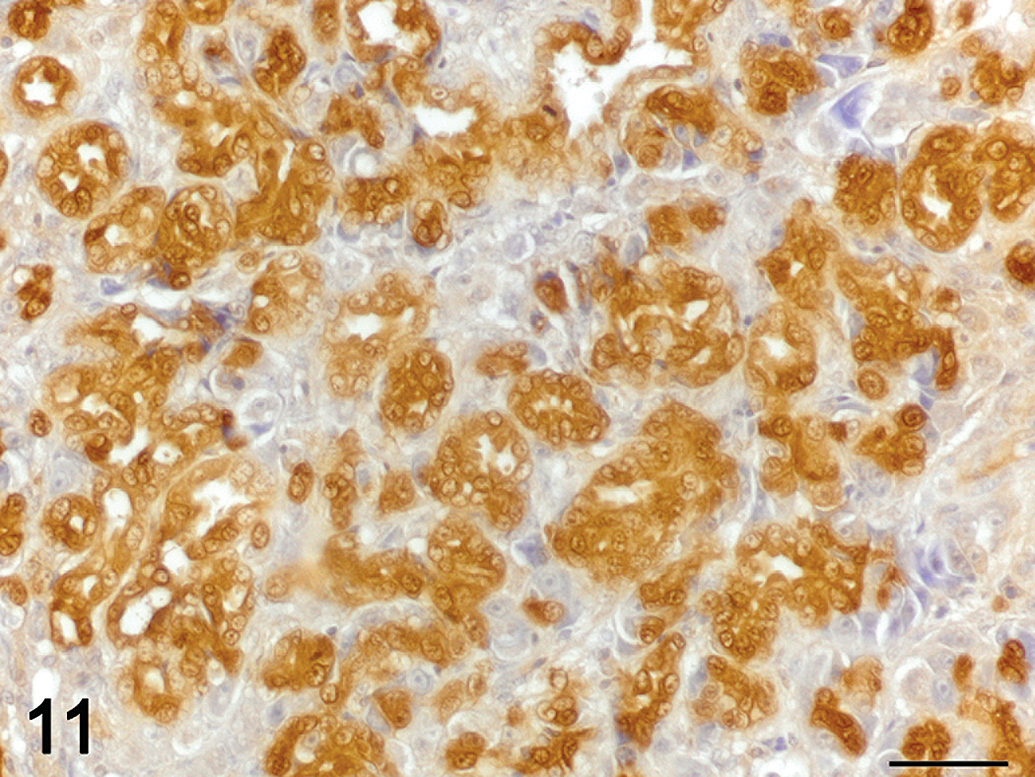
Cholangiocarcinoma. Immunolabelling for transforming growth factor beta (TGF-β)-1 (brown), hematoxylin counterstain. Neoplastic cholangiocytes display strong cytoplasmic immunoreactivity for TGF-β1. 60×.
Discussion
The use of small fish models in biomedical and environmental research continues to expand. In order to utilize these models to their full potential, it is imperative to understand the similarities and differences in disease mechanisms among human, mammalian, and fish models. The anatomical and histological differences between mammalian and piscine liver have been thoroughly studied in several species and especially the Japanese medaka (Hardman et al. 2007; Hardman, Kullman, and Hinton 2008). Medaka have a single-lobed liver with microvasculature resembling a single mammalian hepatocytic lobule, making it an ideal model to study the effects of hepatotoxicant (Hardman et al. 2007). Yet our understanding of the piscine response to injury at the molecular level remains limited.
Hepatic fibrosis is a common wound-healing response to chronic liver injuries in mammals but is less often observed in fish (Wolf and Wolfe 2005). Liver fibrosis, however, has been described in medaka exposed to DMN and methylazoxymethanol acetate (MAM-Ac; Hatanaka et al. 1982; Hobbie et al. 2011). In this study, the expressions of key genes in the pathogenesis of hepatic fibrosis were associated with morphological changes that occurred during development of hepatic fibrosis/cirrhosis in DMN-exposed medaka. The DMN exposure protocol used in this study reliably produced morphological liver changes similar to those reported in medaka or observed in rodent models of hepatic fibrosis such as the DMN-induced rat model (Wallace, Burt, and Wright 2008; Hobbie et al. 2011). Progression to neoplasia was much faster in medaka than in rodents with neoplasia present in 8% and 67% of the fish collected at 6 and 10 weeks’ postexposure, respectively (Peto et al. 1991).
Females progressed faster to hepatic fibrosis and neoplasia than did males by approximately 2 weeks. This faster progression of hepatic lesions has been reported previously for neoplasia in several fish species, including medaka, and is considered a response to the promoter effect of endogenous steroids (Teh and Hinton 1998; Cooke and Hinton 1999). Estrogen has been demonstrated to have a significant effect on hepatocyte metabolism and to stimulate hepatic cell proliferation (Cooke and Hinton 1999). Fibrogenesis in the liver is known to be subject to gonadal steroid influence; however, the faster progression to fibrosis in medaka is opposite to the effect of estrogen in rodent and human where estrogen was associated with decreased fibrogenesis (Yasuda et al. 1999). The cause for this difference is uncertain. Given the anatomical and functional differences between medaka and mammalian livers, some lesion patterns expected in mammals were absent, such as centrilobular necrosis and bridging fibrosis (Hinton et al. 2008). Zonal necrosis patterns are not observed in fish as they lack hepatocellular metabolic zonation. Because the entire medaka liver is approximately the anatomical equivalent of one mammalian hepatic lobule, the biliary-venous tracts (portal tract equivalent) of fish are located mainly near the hilus and rarely in the parenchyma. Consequently, the type of bridging fibrosis observed in mammalian liver would be unexpected for fish (Hardman et al. 2007). The pattern of fibrosis that best characterizes the fibrotic changes observed in medaka is pericellular (perisinusoidal) fibrosis. In pericellular fibrosis, the collagenous matrix extends along the sinusoids and surrounds single or small groups of hepatocytes resulting in a chicken wire or latticework appearance.
In mammals, liver injury is associated with an increase in HSC numbers and the acquisition by the quiescent HSCs of a myofibroblast-like phenotype. The activated HSCs express smooth muscle α-actin (α-SMA) and acquire contractile properties. In human and rodent livers, immunohistochemistry for α-SMA is considered the gold standard to identify and localize activated HSC and myofibroblasts and used as a marker of active fibrogenesis (Hautekeete and Geerts 1997; Kweon et al. 2001). In medaka, perisinusoidal cells have been shown by Immunohistochemistry (IHC) to express actin in fibrotic liver induced by DMN and HCC induced by DMN, Diethylnitrosamine (DEN), or MAM-Ac. The lack of immunoreactivity with mammalian α-SMA antibodies necessitated our use of an antibody for MSA (Bunton 1995; Hobbie et al. 2011).
In this study, evaluation of control and fibrotic liver by TEM confirmed that HSCs were more numerous in fibrotic livers and had acquired fibroblast-like characteristics, thus supporting the MSA-staining results. Additionally, an increased amount of collagen fibrils, observed in the perisinusoidal spaces of fibrotic livers, supported the observations of H&E and Masson’s trichrome–stained liver sections. We quantified the amount of actin-positive cells following DMN injury and demonstrated a significant increase in actin-positive cell numbers that correlated with the development and progression of fibrosis determined on H&E and Masson’s trichrome slides. These results indicate that the medaka liver response is similar to that observed in mammals where HSCs acquire a fibroblast-like phenotype and proliferate in fibrotic livers. We did not attempt to separate actin-positive cells (activated HSCs and myofibroblasts/smooth muscle cells) for morphometric analysis. The surface of all MSA-positive cells was used for the analysis. Therefore, it was not determined whether the increased number of actin-positive cells resulted from an increase in activated HSCs alone or in combination with an increase in myofibroblasts. We regard an increase in both activated HSCs and myofibroblasts as most likely.
We next examined the expression of a number of genes associated with TGFβ signaling and deposition of ECM. Teleost fish often have two or more copies of single-copy mammalian genes (Postlethwait 2007). The reason is presently unresolved, but the whole genome duplication theory appears to be the most concrete explanation for teleostean gene duplication (Postlethwait 2007). In this study, we evaluated the expression levels of both gene copies when present including col1a1a and col1a1b; smad3a and smad3b; and mmp14a and mmp14b.
Overall, expression of target genes exhibited a moderate increase in transcription during the early stage of hepatic degeneration (phenotype 1) and was followed by a marked increase in expression peaking when BPDEC hyperplasia (phenotype 2) occurred. Subsequently, gene expression decreased but remained significantly elevated when fibrosis (phenotype 3) was established and neoplasm/neoplasms (phenotype 4) were developing.
In mammals, the TGF-β pathway is central in mediating fibrotic responses by regulating ECM production and resorption and cellular proliferation. TGF-β1 is a potent antiproliferative cytokine that suppresses the proliferation of epithelial cells, including hepatocytes, and regulates the function of HSCs (Gressner et al. 2002). TGF-β signaling stimulates the synthesis of ECM components, such as type I, type III, and type IV collagen, and reduces ECM degradation by upregulating the expression of antiproteases such as TIMP-1 (Gressner et al. 2002).
Our data showed that activation of the TGF-β pathway occurs in medaka liver after hepatic injury. Increased tgfb1 expression correlated with activation of HSCs and abnormal connective tissue deposition during onset and progression of fibrosis. A significant increase in expression of tgfb1 and tgfbr2 was accompanied by a delayed and lesser increase in smad3a and smad3b expression. Expression of tgfbr1 remained unchanged. Since the type II receptor is critical in receptor activation by binding the TGF-β ligand and activating TGFbRI, the increase in tgfbr2 would presumably amplify the activation of the TGF-β pathway. Similarly, tgfbr2 is upregulated in other fibrotic diseases such as in glomerulosclerosis and tubulointerstitial fibrosis of diabetic nephropathy, wound healing disorders, and keloid formation (Chin et al. 2001; Hong et al. 2001; Schultze-Mosgau et al. 2003). In patients with chronic liver disease, Calabrese et al. (2003) found an increase in expression of TGFBR2 with colocalization of TGF-β1 and SMAD on hepatocytes that correlated with an increased fibrosis score. Additionally, impairing the TGF-β pathway in rats exposed to DMN using an adenoviral vector expressing a truncated TGFR2 resulted in a marked reduction in hepatic fibrosis (Qi et al. 1999). However, Roulot et al. (1999) found that fibrotic livers in humans and rats exhibited a decrease in Tgfbr2 expression and an increase in Tgfbr1 expression in correlation with proliferation of HSCs and increased fibrosis. These data suggest that there remains an inconsistent expression profile with TGF-β signaling and correlation to fibrosis in mammals.
We also observed a significant increase in Smad3a and smad3b levels within BPDEC hyperplasia and fibrotic livers; however, the fold induction was much lower than that observed with tgfb1 or tgfbr2. We chose to examine Smad3 expression due to previous studies in mammals that demonstrated profibrotic activities of TGF-β were mediated by SMAD3 in several organs including liver (Flanders 2004; Roberts et al. 2006). The significant but lower change in Smad3 expression is likely due to the fact that TGF-β1 stimulation of Smad3 is mediated mostly through an increase in SMAD3 phosphorylation rather than a modification in smad3 mRNA expression.
The TGF-β pathway is implicated in a number of cancers, including hepatic neoplasms. In the early stage of carcinogenesis, the TGF-β pathway acts as a tumor suppressor, but later it acts as a tumor promoter (Wakefield and Roberts 2002; Musch et al. 2005; Mamiya et al. 2010). The results of this study suggest that upregulation of the TGF-β canonical pathway occurs in the fish liver neoplasms as is observed in spontaneous mouse and human HCC. In medaka, immunoreactivity for TGF-β1 was present in the neoplastic cells and the expression of tgfb1, tgfbr2, and smad3a remained upregulated in the fibrotic livers with neoplasms. We did not separate neoplastic tissue from fibrotic liver tissue during mRNA isolation. Therefore, the expression level measured herein is not representative of the neoplasms alone and a definitive conclusion regarding the upregulation of the TGF-β pathway in these liver carcinomas cannot be made.
Expression and localization of tgfbr2 is also known to be altered in cancer. However, its role remains unclear and expression has been shown to be increased, unchanged, or decreased in HCC in humans or in rodent models (Kiss et al. 1997; Abou-Shady et al. 1999; Mamiya et al. 2010; Hoenerhoff et al. 2011). In the present study, tgfbr2 remained upregulated when neoplasms developed in the fibrotic liver.
The trend in expression levels of tgfb1 and tgfbr2 paralleled those of col1a1a, col1a1b, and to a lesser extent of col4a1. Upregulation of tgfb1, tgfbr2, col1a1a, and col1a1b correlated with the activation of HSCs and deposition of ECM. Our findings are in accordance with those in humans and mammalian models in which increased collagen gene expression and deposition of collagen in hepatic fibrosis accompanies increased TGF-β1 production (Gressner et al. 2002).
Localization of TGF-β1 in fibrotic livers demonstrated protein expression in all BPDECs, cholangiocytes, some macrophages, and HSCs, and rarely in intermediate hepatocytes. These results are consistent with those of previously reported studies in medaka and in rats after hepatic injury (Jakowlew et al. 1991; Milani et al. 1991; Tao et al. 2000; Hobbie et al. 2011). They suggests that in fish, like in mammals, resident and recruited inflammatory cells (macrophages and Kupffer cells) and proliferating biliary epithelial cells promote fibrogenesis through increased production of TGF-β1 (Roth, Gong, and Gressner 1998; Chantal 2000; Matsuzaki 2009). Although the antibody used in this study is sold as an anti-TGF-β1 antibody, the manufacturer states that it cross-reacts with TGF-β2. Given that its specificity in fish species is unknown, it is possible that the immunoreactivity observed in the cholangiocytes and BPDECs is due to TGF-β2 and not TGF-β1. Expression of Tgfb2 mRNA is known to occur in cholangiocytes of proliferating bile ducts in rat and human fibrotic liver (Milani et al. 1991). It is interesting to note that Kupffer cells, an important source of TGF-β1 after hepatic injury in mammals, are absent in medaka and in most teleosts (Hardman et al. 2007; Hinton et al. 2008). However, fish livers often have interhepatocytic, perisinusoidal macrophages (IPMs) that increase in number and phagocytize cellular debris following hepatic injury (Boorman et al. 1997; Okihiro and Hinton 1999, 2000). Given that the immunoreactivity for TGF-β1 of some IPM was observed in this study, it is possible that IPMs play a role similar to Kupffer cells in the pathogenesis of hepatic fibrogenesis.
A significant increase in expression of mmp2, mmp14a, mmp14b, timp2a, timp2b, and timp3 was observed during development of hepatic fibrosis and neoplasia. A much smaller but significant increase in mmp13 was also present. Trends in expression levels of the MMP and TIMP genes evaluated were paralleled by the upregulation of other genes typically expressed in fibrosis like tgfb1 and col1a1. These results are similar to those reported in human and rodent studies where Mmp2 and Mmp14 expression levels gradually increase with disease progression, while the increase in Mmp13 expression is transient, taking place mainly during the early phase of fibrosis and during recovery from fibrosis (Watanabe et al. 2000; Lichtinghagen et al. 2003; Hemmann et al. 2007). Expression of Timp1, -2, and -3 also increased following liver injury in humans and rodents and persisted as fibrosis progressed (Iredale et al. 1996; Herbst et al. 1997; Kossakowska et al. 1998; Yoshiji et al. 2000). TIMP-1 is the collagenase inhibitor most often evaluated in human and rodent studies and is considered an essential player in the development of hepatic fibrosis. Unfortunately, we were not able to identify an orthologous gene in the medaka genome.
The results suggest that this part of the pathogenesis in the medaka model is likely similar to the one in mammals where activation of the TGF-β pathways and HSCs results in alteration in the balance between production and resorption of ECM components. The net accumulation of collagen results predominantly from increased transcription of collagen genes, mainly type I collagen, and impaired degradation due to changes in the balance between MMPs and TIMPs (Kossakowska et al. 1998; Hemmann et al. 2007). Studies of fibrosis in various organs including the liver indicate that an increase in the TIMP/MMP ratio promotes fibrosis (Iredale et al. 1996; Yoshiji et al. 2000; Madtes et al. 2001; Nicholson, Waller, and Bicknell 2002).
The Wnt-signaling pathway has been implicated in organ fibrosis, including liver fibrosis, and neoplasia (Shackel et al. 2001; Kim, Sills, and Houle 2005; Myung et al. 2007). There is evidence that the profibrogenic role of Wnt signaling occurs through HSC activation and promotion of survival (Myung et al. 2007; Cheng et al. 2008). However, the role of the Wnt pathway in hepatic fibrosis is still poorly understood compared to its role in hepatic neoplasia (Thompson and Monga 2007). β-catenin is the chief downstream effector of the canonical Wnt-signaling pathway. In this study, we observed upregulation of ctnnb1, suggesting upregulation of the Wnt canonical pathway during development and progression of hepatic fibrosis as it has been shown in mammals (Shackel et al. 2001; Myung et al. 2007; Cheng et al. 2008). However, we did not evaluate whether nuclear translocation of β-catenin occurred to provide direct evidence and confirm activation of the canonical Wnt pathways in this fish model. Additionally, ctnnb1 upregulation was observed in fibrotic medaka liver with neoplasia suggesting that dysregulation of the Wnt pathway may occur in medaka liver carcinomas. Dysregulation of the Wnt pathway with overexpression of the ctnnb1 protein is an important factor in the development and progression of HCCs in zebrafish, rodents, and humans (Harada et al. 2004; Haramis et al. 2006; Kim et al. 2008). However, HCCs were not separated from the surrounding fibrotic liver and it cannot be determined whether this increase is part of the fibrotic process or HCC development or both.
MYC, a ubiquitous transcription factor, regulates transcription of numerous genes involved in functions that control cell proliferation and differentiation (Oster et al. 2002). Upregulation of Myc follows activation of various mitogenic signaling pathways including the Wnt pathway. In this study, myc was upregulated in all phenotypes evaluated including livers containing neoplasms. This finding suggests possible roles in hepatocyte proliferation and neoplasia in medaka. Temporary upregulation of Myc is known to occur during hepatic regeneration while sustained upregulation is linked to neoplasia in rodents and humans (Santoni-Rugiu et al. 1996; Michalopoulos and DeFrances 1997). Sustained myc expression in hepatocytes of transgenic zebrafish and medaka overexpressing myc resulted in hyperplasia and, in zebrafish only, possible hepatocellular adenoma (Gong et al. 2011; Menescal et al. 2012).
This medaka fish fibrosis model has the potential to be a valuable tool to study development and progression of fibrosis and liver cancer in vivo and help bridge the gap between in vitro and in vivo testing. Small size, economy, ease of use of large numbers of individuals, low background incidence of neoplasia, and rapid induction of fibrosis and neoplasia are some characteristics of this model that make it amendable for high-throughput screening of novel therapeutic drugs and identification of novel regulatory pathways. The availability of the medaka transparent fish strains STII and STIII, one of the only two vertebrate animal models that are transparent in larval and adult stage, opens the possibility to study tissue responses and gene expressions noninvasively in vivo (Hardman, Kullman, and Hinton 2008). Genetic manipulation such as precise genetic gain- and loss-of-function studies or generation of transgenic fish with spatiotemporal cre-lox transgene regulation may also facilitate the study of the molecular pathogenesis of fibrosis. However, we allege that a carcinogen-induced model of hepatic fibrosis and neoplasia will not absolutely recapitulate the pathogenesis of the human disease. In this model, the primary initiating event is a protein and DNA-damaging episode (DMN exposure) that results in fibrosis, cirrhosis, and development of neoplasms within a few weeks rather than a repetitive toxic or viral hepatic injury that progresses slowly over decades as in human. In conclusion, the results of this study demonstrate that the principal cellular and molecular events in the pathogenesis of DMN-induced hepatic fibrosis in mammals and medaka fish are conserved. Hepatocellular injury is followed by activation of HSCs, TGF-β pathway activation, change in the balance between MMPs and TIMPs, and an increase in collagen production with the end result of excessive deposition of collagenous ECM. These data also support the medaka as a useful alternative animal model of hepatic fibrosis and improves the comparative understanding of the liver’s response to chronic injury across taxa.
Footnotes
Acknowledgments
The authors wish to thank Dr. John Cullen for his valuable comments on the interpretation of results. We are also grateful to Sandra Horton, Monica Matmeuller, and the staff of the Histopathology Laboratory as well as Jeanette Shipley-Phillips from the Laboratory for Advanced Electron and Light Optical Methods at the NCSU-CVM for their expertise. We also thank Shashi Gadi for help with the medaka maintenance and Dr. Jason Osborne from the NCSU Department of Statistics. This manuscript is submitted in partial fulfillment of the degree of Doctor of Philosophy to Dr. Arnaud Van Wettere.
The author(s) declared no potential conflicts of interest with respect to the research, authorship, and/or publication of this article.
The author(s) disclosed the following financial support for the research, authorship, and/or publication of this article: This work was supported in part by a pilot research grant from the Center for Comparative Medicine and Translational Research at NCSU. A. J. Van Wettere was supported by the Ruth L. Kirschstein national research service award, T32 RR024394, as part of NCSU's comparative medicine and translational research training program.