
Abstract
When test article–related testicular toxicity or Leydig cell tumors are identified in nonclinical studies, the measurement of circulating hormones such as luteinizing hormone, follicle-stimulating hormone, inhibin, testosterone, or prolactin is often considered in order to aid mechanistic investigations or to identify potential biomarkers in man. Although some hormone levels are relatively constant, others are subject to wide variability owing to pulsatility of secretion, diurnal rhythms, and stress. To avoid being misled, it is important that this variation is factored into any study design that includes hormone measurements. Since all these possibilities start from the pathologist’s reading of the tissue sections, we begin with a review of the morphologic changes that are tied to underlying alterations in hormones. We then provide the reader with basic information and representative hormone data, including coefficients of variation, for the major male reproductive hormones in the three main nonclinical species (rats, dogs, and cynomolgus monkeys). Power and probability tables for rats and dogs allow estimates of the number of animals or samples needed to provide a given likelihood of detecting a hormonal change of a given size. More importantly, we highlight the variability of this process and the real value in readers developing this information at their own site.
Introduction
The interpretation of changes in microscopic tissue structure (i.e., histopathology) is often the first step in an inductive process relating observed morphologic changes to inferences about the potential cause. Particularly in the reproductive system, one possible mechanism is always a hormonal change. Indeed, some hormonal changes can produce profound alterations in tissue structure, as described below. Frequently, there is a desire to repeat the exposure and measure serum hormone concentrations to confirm hypotheses. Unfortunately, many of the hormones discussed here can vary widely in measured concentrations (e.g., resulting from infrequent pulsed releases from the source tissue), and this variation can lead to challenges in defining whether the hormone levels were changed by treatment.
This paper is intended first to help the pathologist recognize the signature lesions induced by too little or too much of the hormones involved in male reproduction, and further, to provide an understanding of the proper experimental design for the follow-up studies, so that one actually obtains useful information when evaluating possible endocrine-mediated effects in experimental animals. It is not possible to provide a full background on reproductive physiology, and readers who want to refresh their understanding of the basic mechanisms of hormonal physiology and the specifics of hormone synthesis are referred to one of the many excellent extant reviews and books on the subject (e.g., Neill 2006). Although it will become evident that the measurement of some of these hormones is relatively straightforward, accurately assessing others is quite difficult. In addition, although this paper provides general guidance on what pattern of effects might be observed based on a particular mode of action, it is important to remember that the hormonal profiles presented in this paper will be affected depending on the potency of the hormonal insult as well as the duration of the alterations.
Testicular Changes Independent of Circulating Hormonal Changes
Before the lesions produced by specific hormonal alterations are described, it is worth describing when one might
Morphologic Changes That Suggest Hormonally Mediated Pathogenesis
The tissue changes reviewed here, and their underlying hormonal alterations, are listed in Table 1. In addition, a detailed review of how the pathologist can recognize endocrine disruption in the male reproductive system and the critical aspects of that evaluation and interpretation can be found in a guidance document published by the Organization for Economic Co-operation and Development (Creasy 2008). Also, there is a series of publications that describe the signature hormonal and morphologic profiles of various endocrine-disrupting substances on the male reproductive system (O’Connor, Cook et al. 1998; O’Connor, Frame et al. 1998; O’Connor et al. 1999; O’Connor et al. 2000a; O’Connor, Davis et al. 2000; 2000c; O’Connor, Frame et al. 2002a, 2002b; O’Connor, Cook et al. 2002).
The relation of hormone changes to specific pathologies in 3 pre-clinical species.
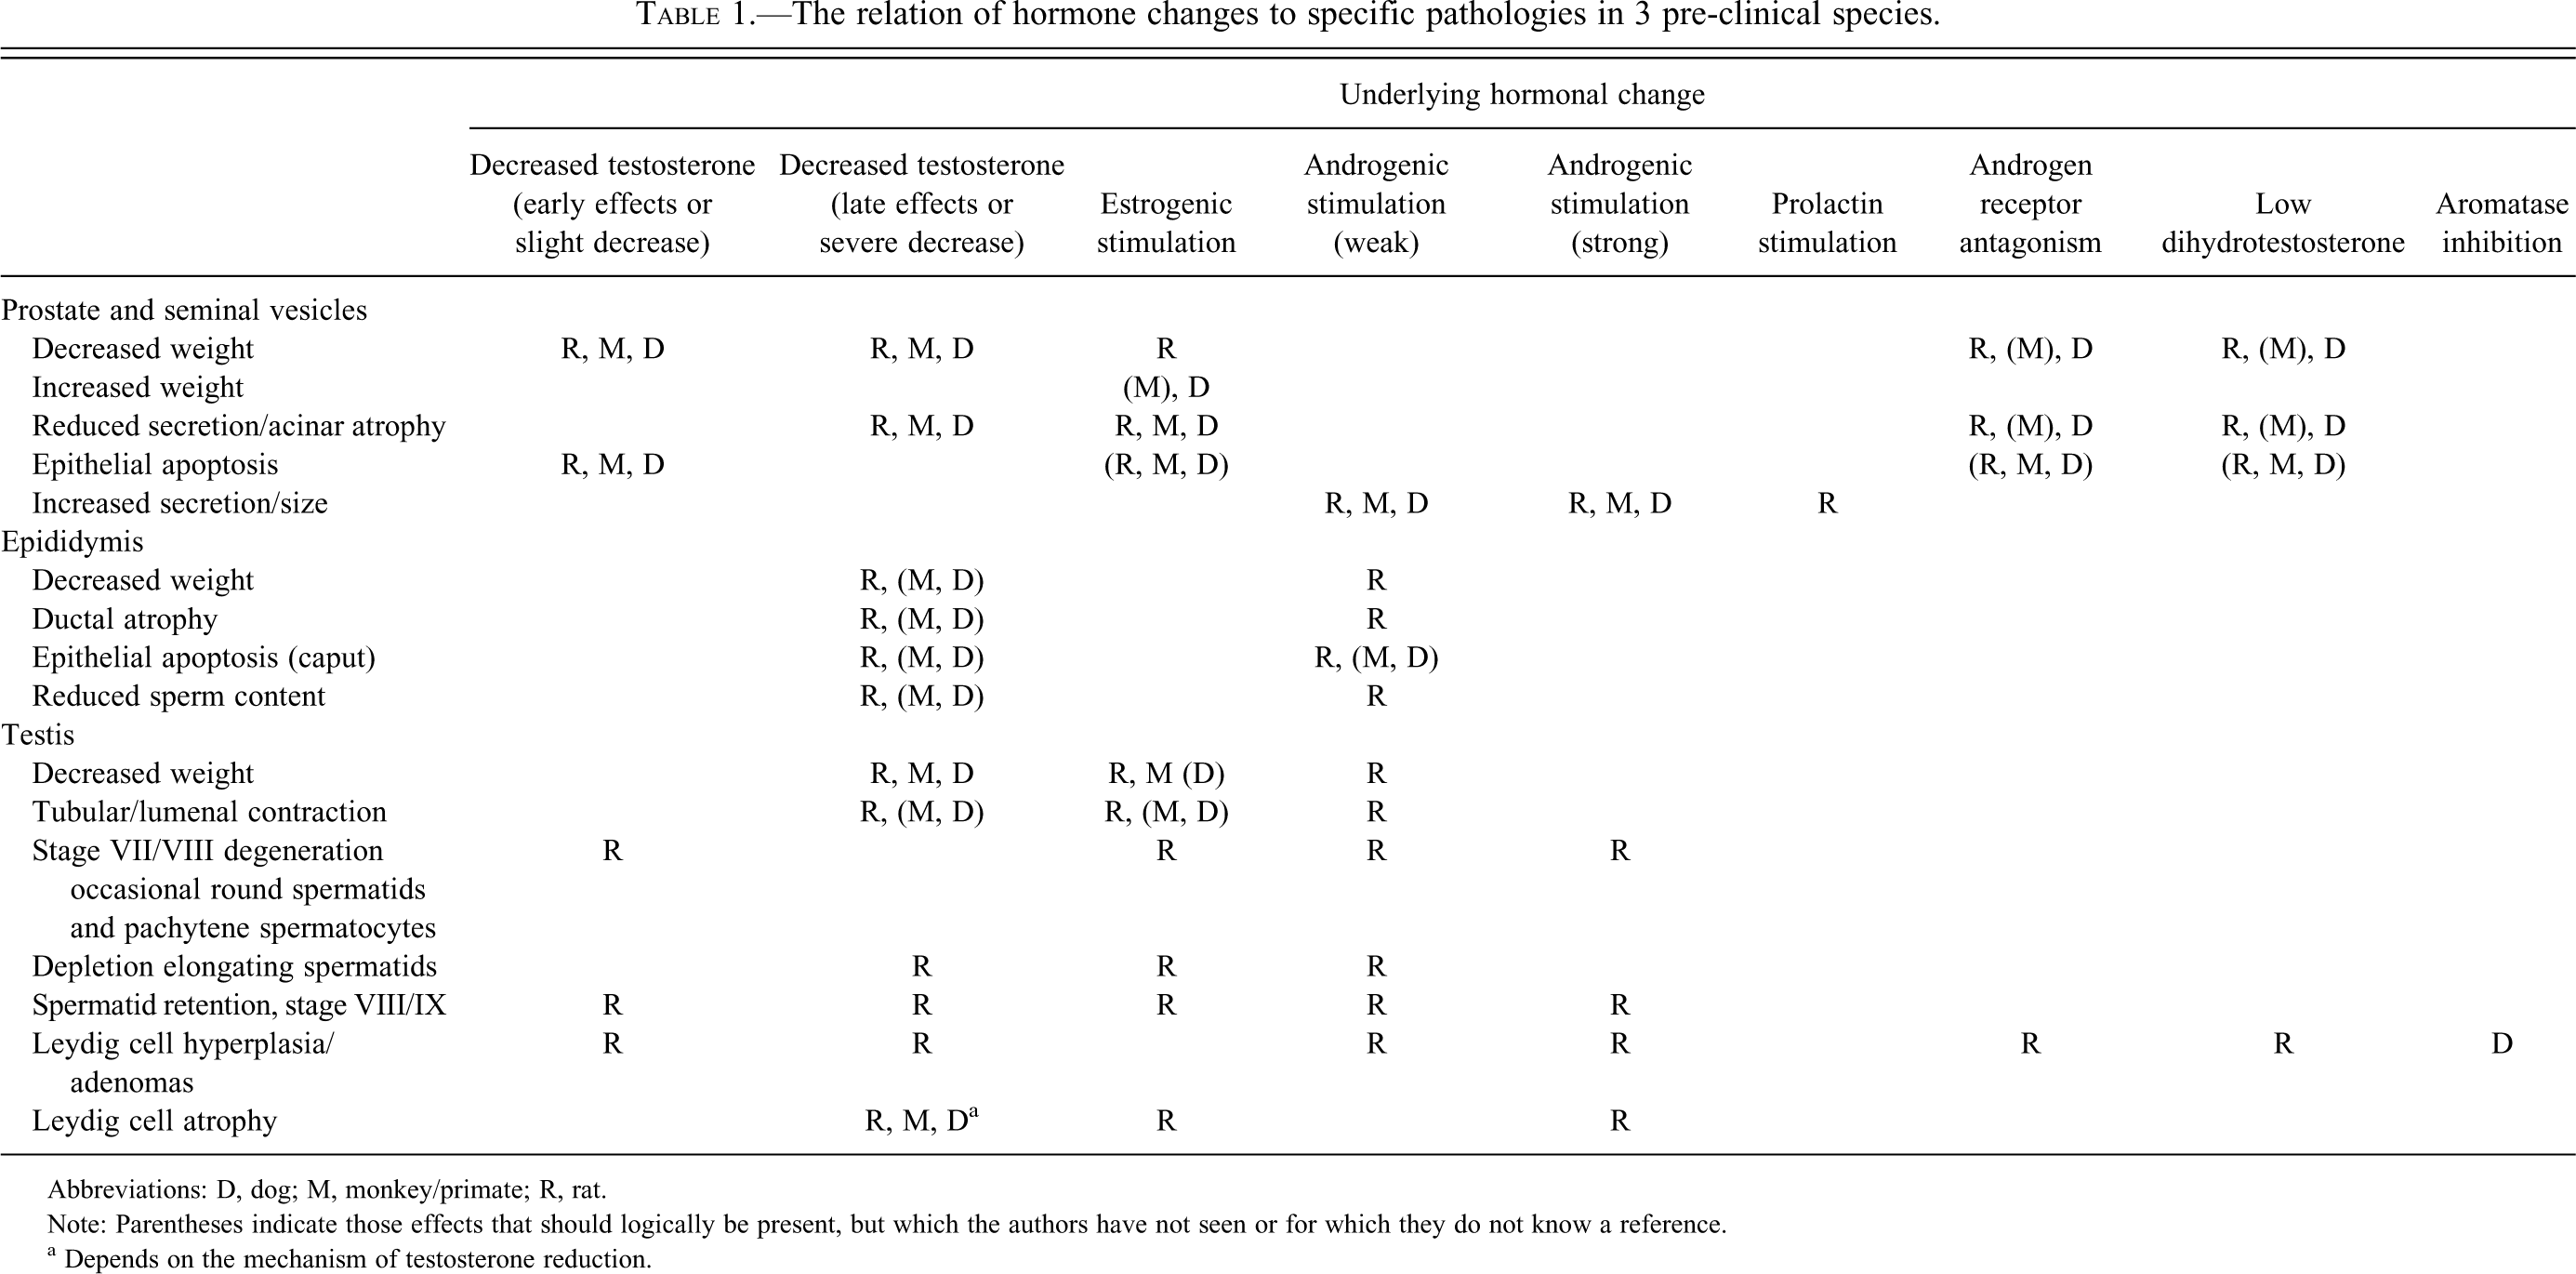
Abbreviations: D, dog; M, monkey/primate; R, rat.
Note: Parentheses indicate those effects that should logically be present, but which the authors have not seen or for which they do not know a reference.
a Depends on the mechanism of testosterone reduction.
Arguably, the most prominent and common alteration in male reproductive hormones that results in morphologic changes is a reduction in androgen “tone,” that is, lowered circulating total or free T and/or dihydrotestosterone (DHT) or reduced activity through the androgen receptor (AR). This reduction can occur either secondary to a central depressive effect on gonadotropin-releasing hormone (GnRH) and/or LH release, through a direct effect on Leydig cell steroidogenesis, or through increased catabolism and excretion of T. The morphologic changes induced by decreased androgenic tone depend very much on the severity and the duration of the decrease as well as the species under consideration. Other less commonly encountered disturbances in hormone profile occur when T levels are normal but AR signaling is inhibited (AR antagonism), when metabolism of T to its most common and more bioactive metabolites (DHT or estradiol [E2]) is disturbed, or when exogenous androgenic steroids are administered. Part of the profile associated with administration of androgenic steroids is that there is an inverse dose relationship for the effects on the testes. Each of these different situations results in a different profile of changes affecting the testis, epididymis, accessory sex organs, and mammary gland (Table 1, and reviewed in detail by Creasy [1999, 2010]). An important fact to bear in mind is that decreased body weight gain and/or decreased food intake may result in decreased T production through decreased GnRH release (Bergendahl et al. 1989), which typically results in reduced T in the male reproductive tissues (Chapin, Gulati, Fail et al. 1993; Chapin, Gulati, Barnes et al. 1993; O’Connor, Frame et al. 2002b; Rehm et al. 2008) but should not be mistaken for a direct effect of the test material on androgen balance.
Species Differences
Most of the detailed investigations dealing with the effects of hormonal disturbance on the male reproductive tissues have been conducted in the rat using ethane dimethane sulfonate (Kerr et al. 1993; Sharpe et al. 1990) or hypophysectomy (Russell et al. 1981) as models. The effects of a 5-α-reductase inhibitor (finasteride), which blocks conversion of T to DHT, have been studied in the mouse (Prahalada et al. 1994), and effects of an AR antagonist (flutamide) have been reported in the rat (Viguier-Martinez et al. 1983). Administration of E2 or other estrogenic compounds in the rat generally has effects similar to those seen with reduced T levels, because E2 inhibits T synthesis in the Leydig cell. In the mouse, estrogen administration results in Leydig cell hyperplasia and tumors, which do not occur in the rat (Clegg et al. 1997; Cook et al. 1999). Also in the mouse, there is evidence that decreased estrogen activity (e.g., from estrogen antagonists) results in the inhibition of fluid resorption and dilation of the efferent ducts, similar to that seen in the estrogen receptor knockout (ERKO) mouse (Hess et al. 2000; Hess et al. 2002). Relatively few studies have been published in the male dog and nonhuman primate, so it is not known whether the detailed changes described below in the rat and mouse necessarily occur in these other species.
Male mammary gland
In the rat, the mammary gland shows sexual dimorphism (Cardy 1991) and provides a sensitive end point for detecting a number of different types of hormone disruption (Cardy 1991; Creasy 2008; Lucas et al. 2007). This is not the case in other laboratory species, in which the male mammary gland is limited to few scattered rudimentary ducts. In the rat, the lobular architecture of the male mammary gland is maintained by the presence of androgens (Sourla et al. 1998) and will show apoptosis with acute androgen withdrawal and atrophy with sustained low androgen levels or with androgen antagonism (Toyoda et al. 2000). Although the term “feminization” (conversion from a lobuloalveolar to a tubuloalveolar organization) has been described with administration of prolactin (PRL) and estrogenic compounds (Andrews et al. 2002; Biegel et al. 1998; Cardy 1991; Wang et al. 2006), the distinction between “atrophy” and “feminization” is at best subtle since it shares most of the characteristics of “atrophy” (Creasy 2008).
Adult male macaques typically have a rudimentary ductal network and scattered small lobular structures extending several millimeters from the nipple (Cline and Wood 2008; Perry et al. 2007). However, proliferation and enlargement of the glands with gynecomastia can be observed in the pubescent male macaque, similar to that observed in human males (Rehm S, personal observation; Lazala and Saenger 2002). These changes are a result of a temporary pubertal imbalance of testosterone and estrogen levels, and the symptoms disappear once adult testosterone levels are achieved. Therefore, if juvenile monkeys show evidence of mammary gland proliferation, the change may be physiological rather than test article related. Hormonal effects on mammary glands of male primates are not well documented, although gynecomastia and galactorrhea have been reported in male cynomolgus macaques with lactotrophic pituitary tumors (Remick et al. 2006) presumably under the influence of PRL. Gynecomastia has also been reported in human males secondary to abuse of anabolic androgens, which are aromatized to estrogens (Calzada et al. 2001).
Accessory sex organs
One end point that appears common to all species is the atrophic effect of decreased androgen tone on the ASOs. Importantly, the sensitivity of detecting these effects varies across species. Organ weights of the prostate and seminal vesicles (including secretions) are relatively sensitive (but time-lagged) indicators of androgen status in rats and mice and are generally more sensitive than the histopathologic identification of epithelial apoptosis when the change is slight. Much of the weight in the rodent ventral prostate, and most of the seminal vesicles (>70%), is a result of the secretory content, which is a direct reflection of the androgenic tone. Prostate weight is not a very useful indicator in the dog or the primate, partly because there is a lot of inter-animal variation in the size of the prostate, but also because there is limited storage of secretion in the prostatic acini of these two species. Severe reductions in prostate weight (and seminal vesicle weight in the primate) will be detectable, but more subtle changes will not likely be detectable. In the mature dog, however, identification of acinar cell apoptosis in the prostate appears more readily detectable in the early stages of T reduction than in rodents, and loss of the apical secretory granules in the acinar epithelium is apparent following prolonged reductions in circulating T. Variation in maturation status, inter-animal variation, and alterations in androgen status resulting from changing social hierarchy status in primates also present significant problems for detecting treatment-induced atrophy of the prostate and seminal vesicles unless the changes are marked. The use of transrectal ultrasonography has been used to monitor prostate size and has been shown to help overcome some of these problems (Kamischke et al. 1997).
Hormonally Mediated Morphologic Changes in the Rat
Testosterone reduction
Whatever the underlying cause, a mild or short-term reduction in T in rats is very difficult to distinguish by qualitative morphology. Single-cell apoptosis in the prostate or seminal vesicles may or may not be detectable (more reliable in the dog, rarely seen in the rodent), and any reductions in acinar epithelium height are generally too small to be reliably detected. However, the amount of ASO secretion will be decreased, and if sufficiently reduced, will be reflected by reduced organ weight. Until new methods of measuring the levels of steroid catabolites in excreta are devised, we consider the weights of these ASOs, (prostate and seminal vesicles) to be the best reporter of integrated (time-averaged) androgen levels in the circulation of rodents.
More marked T reductions (or, alternatively, estrogen agonism) will manifest as more marked effects on organ weights accompanied by decreased height of the acinar epithelium with contraction of the lumen and loss of secretion in the ASOs. The morphologic changes will be more evident than those seen after shorter durations, but organ weight measurements will still be more sensitive than histology. The epididymis is also androgen dependent, and specific changes can often be recognized. Reduced T results in a wave of apoptosis that spreads through the epididymis. The earliest and most prominent changes occur in the initial segment of the epididymis (within eighteen hours of T depletion) followed by the caput, corpus, and finally the cauda. Seven days after orchiectomy, this wave of apoptosis is no longer evident (Ezer and Robaire 2002; O’Connor, Frame et al. 1998). Although not as sensitive as the ventral prostate, the epididymis also loses weight, partly because of the cell loss and reduced cell height, but also because of the decrease in sperm output from the testis, since the sperm and fluid coming from the testis make up approximately 50% of the epididymal weight (Brooks 1979).
In addition, the testes of rats exhibit changes that are uniquely characteristic of low T concentrations. These changes include the death of specific individual germ cells in the seminiferous epithelium (pachytene spermatocytes and round spermatids in Stages VII and VIII). Some step 19 spermatids are also not released normally but are retained by the epithelium and later phagocytosed (spermatid retention, inhibited spermiation; Kerr et al. 1993; Russell et al. 1981; Sharpe et al. 1990). If T depletion is prolonged and severe, the end-stage lesion is a complete depletion/absence of elongating spermatids (steps 9–19); fewer round spermatids (steps 1–8); sporadic degeneration of stage VII/VIII pachytene spermatocytes and round spermatids. Additionally, there may be tubular vacuoles and contracted tubules owing to lack of fluid production and fewer germ cells (Kerr et al. 1993; Sharpe et al. 1990). In addition, the mammary gland epithelium and Leydig cells may appear atrophic. This latter feature is not a very sensitive indicator under qualitative microscopic evaluation. Nevertheless, when this profile of morphologic changes and/or organ weight changes is recognized, it is reasonable to suspect an underlying low-androgen effect. The expected serum hormone profile for a direct-acting Leydig cell toxicant would be decreased T (and DHT) with a compensatory increase in LH (O’Connor, Cook et al. 1998; O’Connor, Frame et al. 2002b). A centrally acting compound that produced this effect would likely reduce both LH and T, and DHT (O’Connor, Cook et al. 1998; O’Connor, Frame et al. 2002b).
Androgen antagonism
When a treatment blocks binding of endogenous T and/or DHT to the AR (i.e., AR antagonism) or otherwise inhibits AR signaling, it effectively results in decreased androgenic signaling, both peripherally and centrally. As a result, atrophic changes are seen in the ASOs, epididymis, and mammary gland (of the rat, at least), similar to those seen with decreased T (above). However, there are no degenerative changes in testicular spermatogenesis, and there is generally Leydig cell hyperplasia rather than atrophy, as the Leydig cells are stimulated via increased LH secretion from the anterior pituitary to increase T production in order to return androgenic homeostasis. The serum hormone profile observed with this mechanism would be increased T, with normal or increased LH (Viguier-Martinez et al. 1983; O’Connor, Cook et al. 1998; O’Connor et al. 1999; O’Connor, Frame et al. 2002a).
Inhibition of DHT synthesis or action
As with androgen antagonism, inhibition of DHT production has no detectable effects on spermatogenesis, since T levels are unaffected within the testis (Rhoden et al. 2002). The main effects are atrophic changes (organ weight and morphology) of the ASOs and the epididymis, which are more dependent on DHT rather than T. In contrast to androgen antagonism, Leydig cells are unchanged in the rat (O’Connor, Cook et al. 1998), although they may show hyperplasia and even tumors in the mouse (Prahalada et al. 1994). This species difference may be related to the differential importance of DHT and T in regulating the negative feedback of androgens on the hypothalamus and/or pituitary. The expected serum hormone profile with this mechanism would be normal (or perhaps increased) T and increased LH concentrations (O’Connor, Cook et al. 1998).
Hyperandrogenism
With hyperandrogenism (e.g., administration of exogenous androgenic agents), the effects will vary depending on dose. At low doses, the administered androgen will act mainly on central ARs to inhibit LH secretion and thereby reduce circulating LH and thus T concentrations in the testis and general circulation. However, these amounts of T will be insufficient to maintain spermatogenesis, which apparently depends on normally high levels. This decrease will produce the low-T effects in the testis: stage-specific (stage VII/VIII and XIV) germ cell death, spermatid retention, and decreased/degenerating elongating spermatids in the testes (O’Connor, Davis et al. 2000; Sun et al. 1989). Accessory sex organs will generally appear normal, since they will be maintained by the exogenous androgen stimulation. Leydig cell atrophy may also be apparent, depending on the potency of the androgenic stimulus and the duration of treatment (O’Connor, Davis et al. 2000b).
As the circulating concentrations of exogenous androgen increase, this androgen will partially or completely replace the endogenous androgen required in the testis for spermatogenesis and will normalize the changes seen at low doses (Sun et al. 1989). Leydig cells should be atrophic, as they are no longer being stimulated to produce T, and the ASOs may actually become larger as a result of the excessive androgen stimulation (O’Connor, Davis et al. 2000b). The serum hormone profile expected here would be low LH and low endogenous T. Note that the investigator should understand whether the administered androgen cross-reacts with the antibody measuring endogenous T; cross-reactivity here will show very high readings.
Hyperestrogenism
If E2 is administered to rats, the profile of changes seen is similar to that resulting from low T. The testes are decreased in weight and show a reduction in elongating spermatids, occasional degenerating round spermatids, and pachytene spermatocytes, along with spermatid retention and Leydig cell atrophy (Biegel et al. 1998; Cook et al. 1998; O’Connor, Frame et al. 1998). The epididymides and the ASOs also have reduced organ weight and show varying degrees of epithelial atrophy and reduced secretion and epithelial apoptosis, particularly in the caput epididymis region (O’Connor, Frame et al. 1998). Atrophy (feminization) of the male mammary gland is also a prominent change with administration of estrogenic compounds (Biegel et al. 1998; Creasy 2008), and chronic hyperestrogenism can lead to male mammary tumors. An unusual and dramatic effect that can be seen in rats administered estrogens is herniation of the intestines into the scrotal sac because of relaxation of the inguinal musculature (Heywood and Wadsworth 1980). In the mouse, but not the rat, administration of estrogen produces Leydig cell hyperplasia and tumors (Clegg et al. 1997; Cook et al. 1999). In both rats and mice, chronic estrogen administration results in decreased ASO secretion and epithelial atrophy of the ASOs along with hyperplasia of the prostatic stroma and squamous metaplasia of the prostate and coagulating gland (Heywood and Wadsworth 1980). For estrogenic compounds in rats, the serum hormone profile would be low LH (as a result of estrogen feedback on the hypothalamus and pituitary), low T, and high PRL (Cook et al. 1998; O’Connor, Frame et al. 1998).
Effects of selective estrogen receptor modulating drugs (SERMs) in male rats will depend on the particular SERM and the duration of dosing. Both tamoxifen and idoxifene cause decreased ASO and epididymal weight. Tamoxifen also caused decreased testis weight at higher doses, whereas idoxifene did not (Treinen et al. 1998). For idoxifene, the decrease in epididymal sperm count was not accompanied by any changes in testicular spermatid head count, suggesting a post-testicular effect on the sperm. Surprisingly, despite the effects on ASOs and epididymal sperm count, male fertility was not affected (Treinen et al. 1998).
Changes in prolactin
Prolactin regulates the number and sensitivity of LH receptors within Leydig cells. Although the evidence is not entirely uniform within a species, increased PRL concentrations have been generally reported to have suppressive effects on GnRH release, T levels, copulatory behavior, and degenerative effects on testicular spermatogenesis in many species, including the rat and man (Aleem et al. 2005; Katovich et al. 1985; Perryman and Thorner 1981). However, the opposite effect has been demonstrated in the mouse, with increased levels of gonadotropins (LH and FSH), increased copulatory behavior, and enlargement of ASOs (Bartke et al. 1987; Wennbo et al. 1997). Hyperprolactinemia also causes atrophy (feminization) of the male mammary gland (Cardy 1991) and is thought to be a mediator of estrogen-induced changes in the male mammary gland in rats (Biegel et al. 1998). Increased PRL concentrations also produce inflammation of the lateral prostate in rats (Tangbanluekal and Robinette 1993). Despite the evidence of testicular effects in animal models of hyperprolactinemia, there are few reports documenting testicular effects caused by dopamine (DA) antagonist drugs, which raise serum PRL levels. In general, these compounds do not appear to disturb spermatogenesis. Dopamine agonists, which act centrally to decrease PRL concentrations, do not directly alter spermatogenesis, but they do produce the following elongated series of events: low PRL reduces LH receptor expression in the Leydig cells, which reduces the drive to produce T. Reduced T from the Leydig cells is sensed centrally, and the pituitary then secretes more and more LH to maintain T secretion. Prolonged LH elevation alters the Leydig cells’ response to that LH from trophic to mitogenic, and eventually (in rats but not in human males) these accumulated cell mitoses produce, first, Leydig cell hyperplasia, and then tumors in the rat (see Cook et al. 1999 for a thorough review).
Hormonally Mediated Morphologic Changes in the Dog
The development and maturation of the male reproductive system in the dog has been examined in several studies (James et al. 1979; Kawakami et al. 1991; Mialot et al. 1988). As with any species, hormone levels will be extremely variable in the period leading up to and including puberty (Inaba et al. 1994; Tsutsui et al. 1990). In the beagle dog, the peripubertal period spans an age range between thirty and forty-one weeks (James et al. 1979). During this period, while the hormones and receptor numbers are still rising, the morphology of the testis shows increased numbers of degenerating cells and very low numbers of maturation-phase spermatids. In addition, the maturing prostate will have varying amounts of secretion in the acinar cells. By forty weeks of age, most beagle dogs should be fertile and producing significant numbers of sperm, but the efficiency of spermatogenesis continues to increase and the numbers of mature sperm that line the lumens of stages IV and V tubules continues to increase until the dogs are at least fifty-two weeks of age. During maturation, the prostate sometimes develops at a different rate than that of spermatogenesis in individual animals. In general, prostatic acini appear mature by forty-three weeks of age, although the level of secretion continues to increase up to eighty-nine weeks of age (Dorso et al. 2008). The age of maturation also varies depending on the source of the dogs (Dorso et al. 2008). If studies investigating endocrine-related end points are planned, then it would be prudent to start with dogs of at least twelve months of age.
Compared with the rat, chronic, severe reductions in T in the dog appear to have much more dramatic effects on spermatogenesis. In the rat, the long-term effect of T reduction is depletion of elongating spermatids; however, in the dog with chronically low T, most spermatogenesis is shut down, leaving only Sertoli and germ cells, demonstrating that in the different species, the same mechanism can have very different presentations. There is no stored secretion within the prostatic acini of the untreated dog. This lack of stored secretion and the fact that prostatic size varies greatly between individual dogs means that organ weight is not a very sensitive marker for decreased androgenic signal in the dog. However, increased apoptosis within the epithelium is seen more readily in dog prostate than in the rat and can provide a sensitive marker of reduced androgen, at least in the early stages of atrophy.
Specific examples of hormonal effects that have been reported in the male dog include long-term exposure (six months) to E2, where the testes were severely reduced in weight; the seminiferous tubules contained only Sertoli cells and spermatogonia; the Leydig cells were atrophied; the epididymal epithelium was atrophic; and prostatic size and weight were increased by hyperplasia of the fibromuscular stroma and squamous metaplasia of the glandular epithelium (Heywood and Wadsworth 1980; Zayed et al. 1998). Dogs administered ketoconazole (a steroid synthesis inhibitor) for four weeks at dose levels that only slightly reduced T levels had few testicular changes other than an increased incidence of minimal focal tubular degeneration (Delongeas et al. 1996).
Estrogen appears to be a more important regulator of the negative feedback hypothalamic–pituitary–gonadal loop in dogs than in rodents. Administration of aromatase inhibitors to male dogs results in increased LH and T and Leydig cell hyperplasia, which is not commonly seen in rodents and thus can be counterintuitive at first glance (Clegg et al. 1997; Juniewicz et al. 1988; Winter et al. 1983).
The hormonal and morphologic effects of androgen antagonists and DHT antagonists appear similar in dogs and rodents (Juniewicz et al. 1993), but the effects of GnRH agonists can vary greatly between species; rats are sensitive, whereas mice and rhesus monkeys are very resistant (Sundaram et al. 1984); Thau et al. 1985).
Hormonally Mediated Morphologic Changes in the Primate
As with dogs, it is important to ascertain that the primates whose endocrinologic end points are measured are mature. The minimum for sexual maturity in male cynomolgus monkeys is four years of age and at least 5 kg body weight, but confirmation of sexual maturity should be made using end points such as the presence of sperm in the semen (Chellman et al. 2009; Meyer et al. 2006). Another important fact to consider when designing studies in nonhuman primates is that the rhesus macaque is a seasonal breeder and T levels vary dramatically depending on the time of year. The breeding season for rhesus macaques is October to December, whereas the nonbreeding season is May and June. Outside of the breeding season, the testes will likely show varying degrees of degenerative changes, with decreased spermatogenesis and reduced organ weight in addition to atrophic changes in the ASOs, reflecting regression and recrudescence of spermatogenesis. For this reason, male rhesus macaques are not a good choice for endocrinologic investigations.
Hormone levels in nonhuman primates are also influenced by social hierarchy status (Czoty et al. 2009; Niehoff et al. 2010). The dominant male in a room will have high T levels, which can suppress T in the subordinate males and result in regression of the reproductive tissues. The result can be dramatic reductions in testis volume (45% of baseline) in low-ranking males within thirteen weeks of beginning social housing (Niehoff et al. 2010).
As a result of detailed interspecies differences in the regulation of spermatogenesis, the histopathologic effects of decreased gonadotropin support of spermatogenesis differ in the primate when compared with the rat. In the primate, withdrawal of gonadotropin support through administration of a GnRH antagonist specifically reduces the number of B spermatogonia and thereby reduces the later stages by maturation depletion (Weinbauer et al. 1998; Zhengwei et al. 1998). In the rat, the major effects of GnRH antagonists are seen on the spermatid population, with the earliest changes occurring in the androgen-dependent stage (VII and VIII) of the cycle (Sinha-Hikim and Swerdloff 1993). The differential effect is likely a result of the different roles that FSH plays in regulation of spermatogenesis in primates and rodents (Sharpe 1994). Administration of a GnRH agonist to male rhesus macaques also resulted in diffuse atrophy of the testes and azoospermia within twenty-one weeks. These changes were associated with an initial rise in serum LH and T followed by a decline to below pretreatment levels and reduced sensitivity to GnRH (Mann et al. 1987).
Male cynomolgus monkeys administered injections of T over a twenty-six-week period have a similar suppression of spermatogenesis to that seen in other species, but the suppression appears to involve and depend upon a T-induced suppression of FSH (Weinbauer et al. 2001). Treatment of male rhesus macaques with DHT lowered circulating LH and T and decreased sperm motility but not sperm count (Ramakrishnan et al. 1989). As with other species, chronic administration of estrogens results in hyperplasia and squamous metaplasia of the prostate (Heywood and Wadsworth 1980). Use of SERMs and other estrogen-ablative agents by human males (e.g., bodybuilders) may lead to increased endogenous androgen production (Basaria 2010), possibly mediated by increased gonadal testosterone production secondary to increased LH concentrations (Leder et al. 2004; Taxel et al. 2001). Treatment of adult male bonnet monkeys (Macaca radiata) with Tamoxifen for ninety days had no effect on the serum T concentrations or total sperm count but resulted in a significant reduction in sperm motility and lack of fertility from day 90 to day 260 (Rao et al. 1998).
Experimental Design
Measuring Hormones in Routine Regulatory Studies versus Custom-Designed Studies
Routine, subchronic regulatory toxicity studies employ relatively small group sizes of animals, and as outlined in the next section, the variation for some of the hormones requires much larger group sizes to obtain a statistically valid or reliable result. What are some alternatives to conducting bespoke hormone studies? Traditional two-year carcinogenicity bioassays start with large group sizes of fifty to sixty rats or mice, which might be considered adequate numbers for measuring hormones, especially in situations in which there is evidence of test article–related Leydig cell tumor induction. However, there are various reasons this approach may not provide useful information: (1) by the end of two years, mortality has generally reduced group sizes to around twenty/sex/group, and many of these animals will have prolactin-secreting pituitary tumors, which will cause variable changes in circulating LH and T values; (2) test article–related increases in LH are generally most readily detectable in the first few months of dosing (one to three months of dosing), after which receptor adaptation often results in normalization of hormone levels; and (3) age-related pathology in two-year-old animals is likely to add to the already significant inter-animal variability in hormone values.
Hormone measurements are best done in carefully designed and adequately powered studies that look at hormone values at serial time points. This approach allows for detection of the “maximal” increase or decrease in any hormonal change before receptor adaptation occurs and can also take into consideration the peak timing for hormone response between doses. The time points for sampling need to be established on a case-by-case basis and will always benefit from a preliminary pilot study to confirm doses and times. Some hormonal changes can be seen after a single dose, and others may require one week or more, but virtually all will best be evaluated within three months of the start of dosing.
Measuring T and LH
With the advent of the radioimmunoassay technique to quantify biological molecules in small quantities of fluid (unlike the preceding activity assays, which required large volumes with less precision), researchers spent the late 1970s and early 1980s slowly unraveling the complexities of male hormone secretion. The conflict and confusion was nicely captured by Poland et al. (1980). It was eventually determined that in the dog and the primate, a pulse of LH is followed closely by a pulse of T (DePalatis et al. 1978), whereas rats appear to integrate the LH pulses and only infrequently release a T pulse (Ellis and Desjardins 1982; Hakola et al. 1998; Mock et al. 1978; Soderstern et al. 1983). Implications of these differences for experimental design are described below.
Rats
Neither LH nor T appears to have diurnal periodicity in rats. For example, there is no reliable peak of secretion in the morning. The fact that one rat can have very different serum levels of T at the same time on different days (Ellis and Desjardins 1982) captures the degree of this sampling challenge.
No one sampling method seems preferred for LH and T. The literature is conflicted about the effects of stress on these hormones; they are certainly less affected by stress or sampling method than is prolactin. Thus, the sampling method can be driven more by local custom, experience, regulations, and skill.
Power calculations are often used to express the relationship between the number of animals used, the size of a difference caused by treatment, and the likelihood of seeing that change. A fictitious example would be that of measuring adrenocorticotropic hormone (ACTH); a large number of control samples might allow a statistician to calculate a requirement of, say, eighteen animals to provide the investigator an 80% chance of seeing a 20% change from control. Tables 2 and 3 present power calculations from two completely different data sets. The O’Connor data set (Table 2) comes from the controls from twenty-eight studies, each of which had an n = 15, much of which was summarized in a comprehensive article (O’Connor, Van Pelt et al. 2002). The data set in Table 3 derives from thirty animals in a single study (Chapin, unpublished data). These tables are intended to allow the reader to estimate the number of animals needed to provide the desired power for a given hormone. Unsurprisingly, there are differences in the calculated power when using one data set or the other. Reassuringly, the differences are not large. To accommodate these differences and allow better estimations by the reader, Table 3 presents power with relatively low and high coefficients of variation (CV). Readers can use preliminary data from their own institution to pick the more appropriate table to use in designing subsequent experiments.
Power calculations for hormones in male rats.
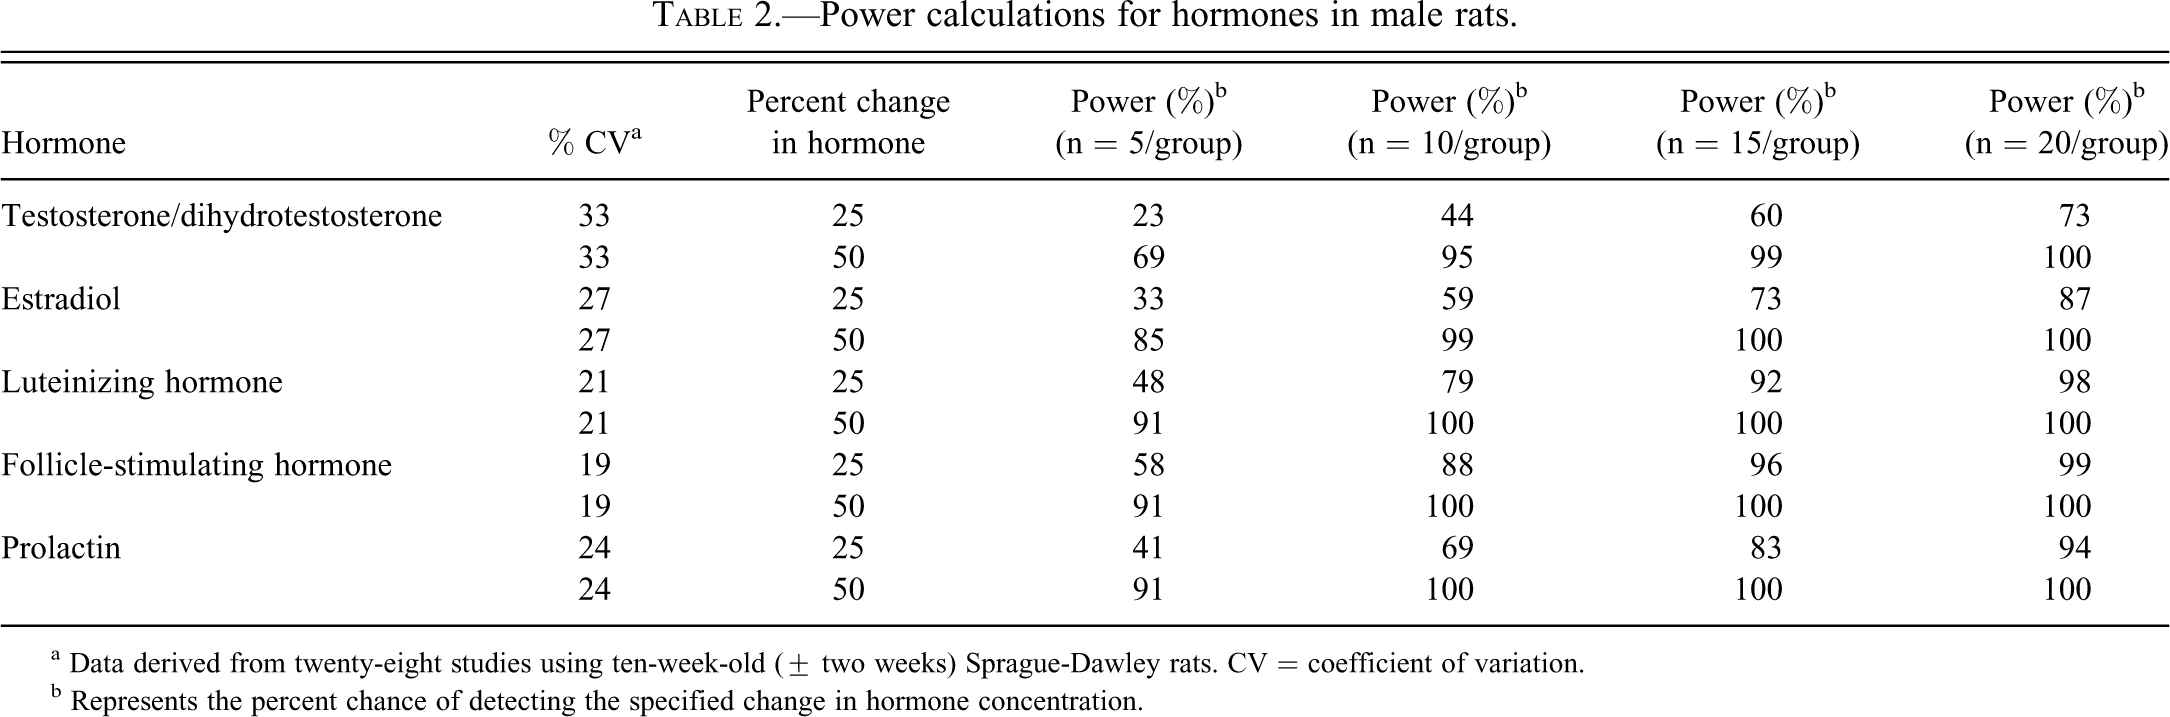
a Data derived from twenty-eight studies using ten-week-old (± two weeks) Sprague-Dawley rats. CV = coefficient of variation.
b Represents the percent chance of detecting the specified change in hormone concentration.
Hormone power data for rats.
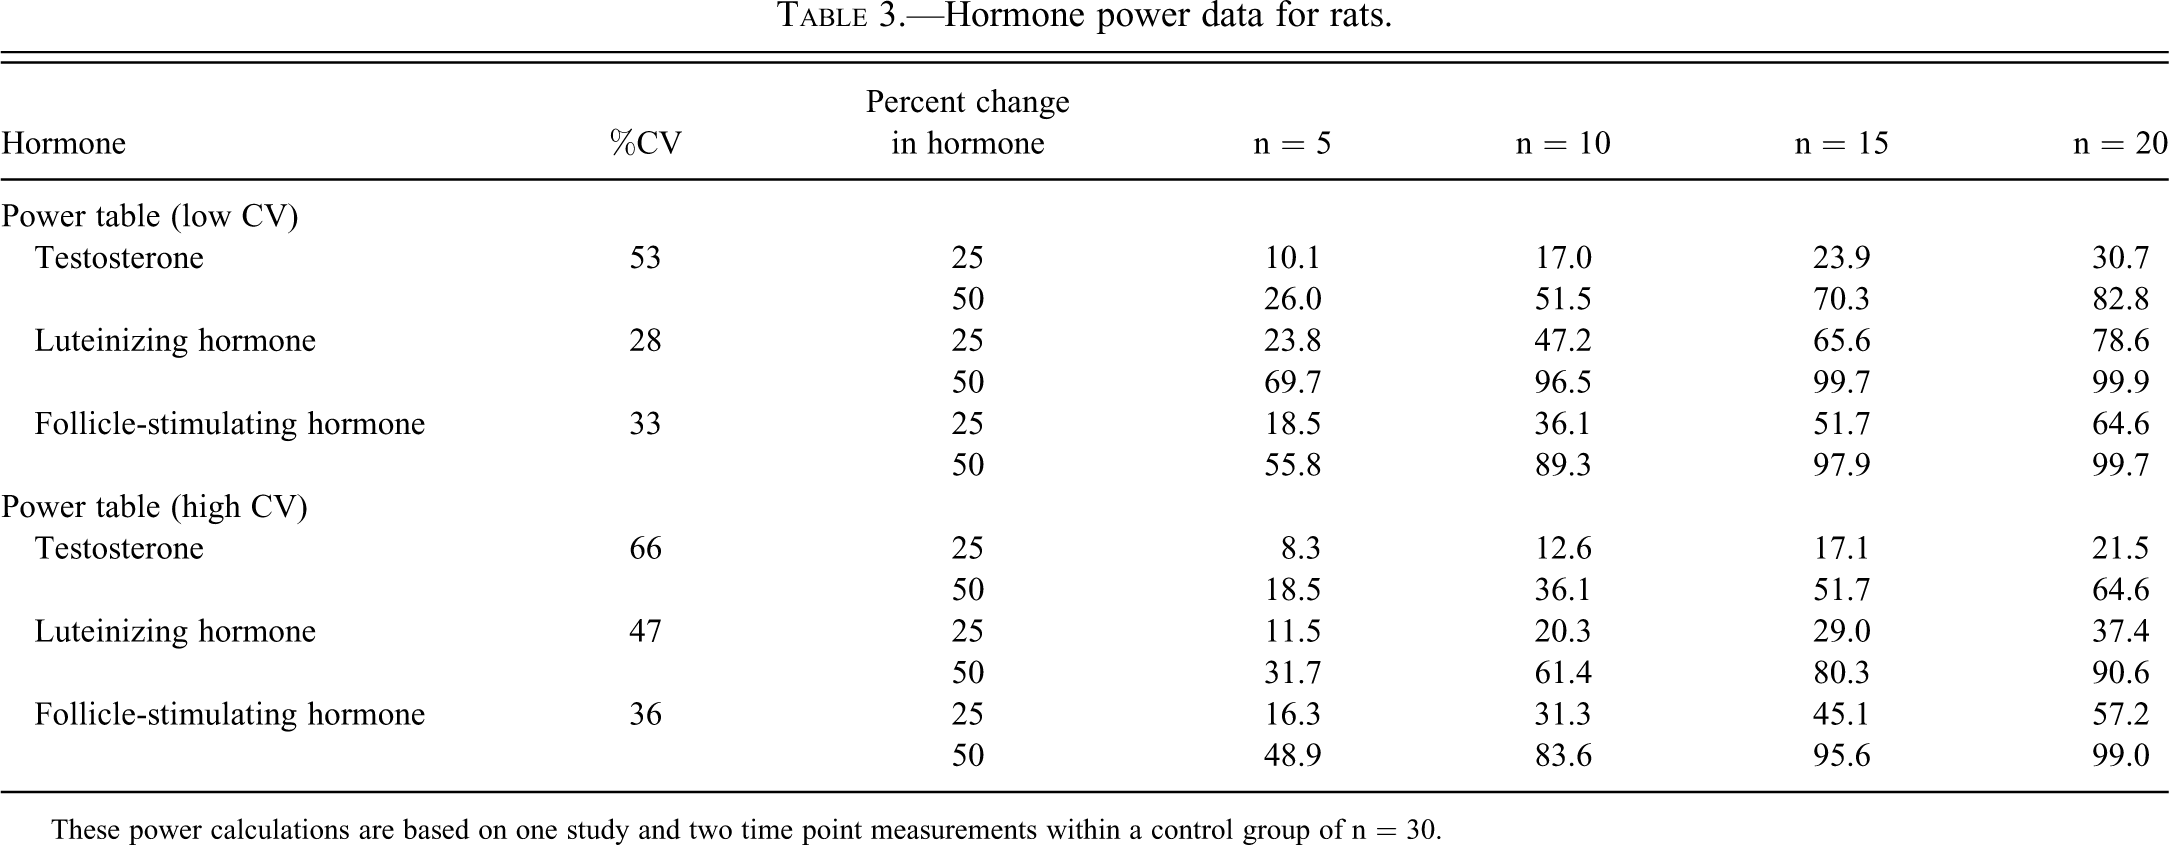
These power calculations are based on one study and two time point measurements within a control group of n = 30.
Inspection of the tables shows several interrelationships. For example, those hormones with the larger % CV (that is, the greater difference between individual rats for a given hormone) have a lower power (a smaller chance of detecting the change) for a given n and percent change of hormone. Both tables indicate that there is much less variation for LH and FSH than there is for T. Thus, for a given n and change in hormone, one stands much less of a chance of seeing that change in T than in LH or FSH.
For LH, using ten rats (Table 2) gives about an 80% chance of seeing a 25% change in hormone concentration, whereas at another institution (Table 3), a similar power requires an n = 20. This difference is important because it means that each organization or lab will likely have different degrees of variability, and they should be well characterized before undertaking critical hormone-measuring studies.
To some degree, these group sizes can be calculated ab initio. This possibility was nicely presented by Terry Nett (1989), who described the way to think about how to design studies to find changes in hormones that are released in occasional and/or infrequent pulses. For collecting single blood samples from groups of animals (for example, at necropsy), the minimum number of animals (n) can be calculated as follows: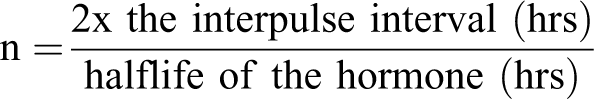
Prior evidence indicates that male rats irregularly and sporadically secrete LH and T (Ellis and Desjardins 1982; Mock et al. 1978; Hakola et al. 1998), so that there is no clear answer to the question, “What is the interpulse interval of LH or T?” Ellis and Desjardins sampled several rats every five minutes over eight hours and over several days. They reported that there was no repeat of any one pattern of T secretion over the eight-hour sampling period. This finding was confirmed by Hakola et al. (1998), who did find an average of about three peaks in any twenty-four-hour period. Therefore, to make the problem more tractable, Nett used the simplifying assumptions for T of an eight-hour interpulse interval and an approximate half-life of thirty minutes. Plugging these numbers into the equation above yields an n = 32 rats per group. Nett’s relatively high-level review does not state what sort of power this method would provide, or what degree of change one might expect to be able to detect. Nevertheless, thirty-two rats per group as a minimum for measuring serum T is a much larger number than is commonly appreciated as necessary.
For LH, Nett’s approximation of a twenty-four-minute half-life is the higher end of the range of reported values, from thirteen to nineteen to twenty-three minutes (de Greef et al. 1983; Weick 1977); in the following example, twenty minutes will be used as a representative number. Ellis and Desjardins (1982) give the range of interpulse intervals for LH as being from thirty-five to 360 minutes, with a mean of ninety-eight minutes. Simplifying to ninety minutes and using twenty minutes for the half-life yields a suggested n = 10 for male rat LH concentrations. This number is gratifyingly close to the values in Table 2, though less than those suggested from a population with larger variance (Table 3).
Thus, for rats, the data suggest that for single-time-point measurements, adequate sample sizes would be n = 10–20 for LH and FSH, depending on the variation, and a minimum n = 30 for T.
Dogs
Male beagles attain sexual maturity over a period of time from about thirty to about forty-one weeks of age (James et al. 1979). Thereafter, the pattern of hormone release in the male dog is very different from that in the rat. Luteinizing hormone pulses appear to occur every hour to hour and a half and are reliably followed about fifty minutes later by a T pulse (DePalatis et al. 1978). This finding suggests that a conscientious androgen assessment is actually feasible using an indwelling venous catheter and serial blood samples every ten minutes for two to two and a half hours. A clever approach to this analysis would be to pool all or part of each sample and to analyze that pooled sample (in duplicate or triplicate, as desired), which would give an integrated “area under the curve” estimation in a single sample. This design could also include a prestudy sample set from each animal to act as an additional control. Some power calculations for T sampling are given in Table 4. Usefully, LH and T appear to be unaffected by stress in the dog (Knol et al. 1992).
Testosterone power calculations for dog with increasing numbers of serial samples.
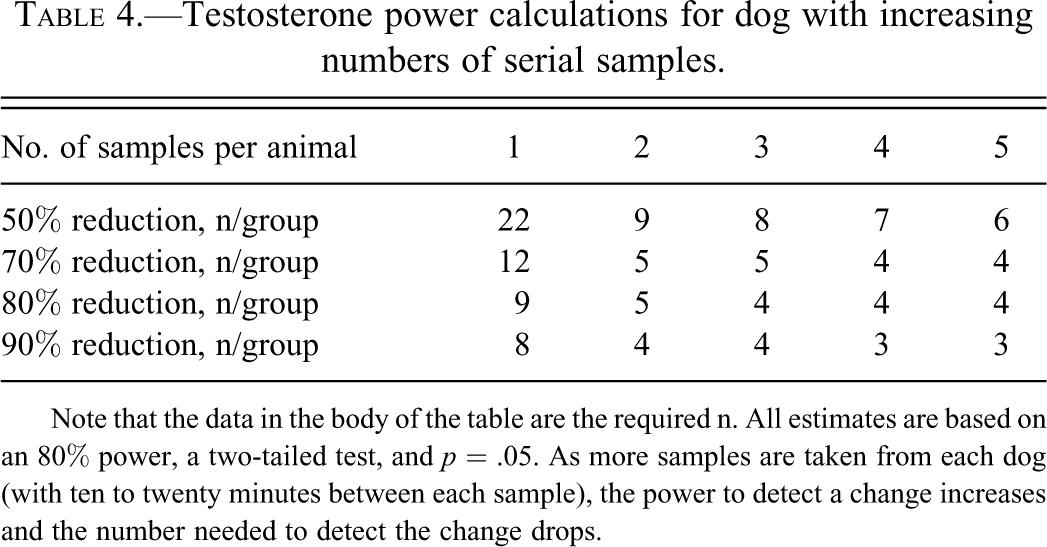
Note that the data in the body of the table are the required n. All estimates are based on an 80% power, a two-tailed test, and p = .05. As more samples are taken from each dog (with ten to twenty minutes between each sample), the power to detect a change increases and the number needed to detect the change drops.
If single-time-point individual samples are required, having some sense of the necessary “n” would be helpful in designing the experiments. Table 5 provides some power calculations for male dog hormones (T, LH, and FSH). These calculations are derived from three studies with multiple samples taken from the control group over the space of weeks, so they effectively represent single samples, not serial samples over the course of a few hours. Note that FSH varies very little, so few animals are needed to obtain a confident measure of FSH. Luteinizing hormone and T, on the other hand, are much more variable across animals, and even using the lower end of the range of CVs, more than twenty animals are required to have any hope of seeing a relevant change, making the serial sampling approach detailed above a more efficient solution. In practice, to verify the site-specific pulsatility of hormones, it would be wise to conduct a pilot study at an investigator’s own institution.
Hormone power calculations for male dogs.
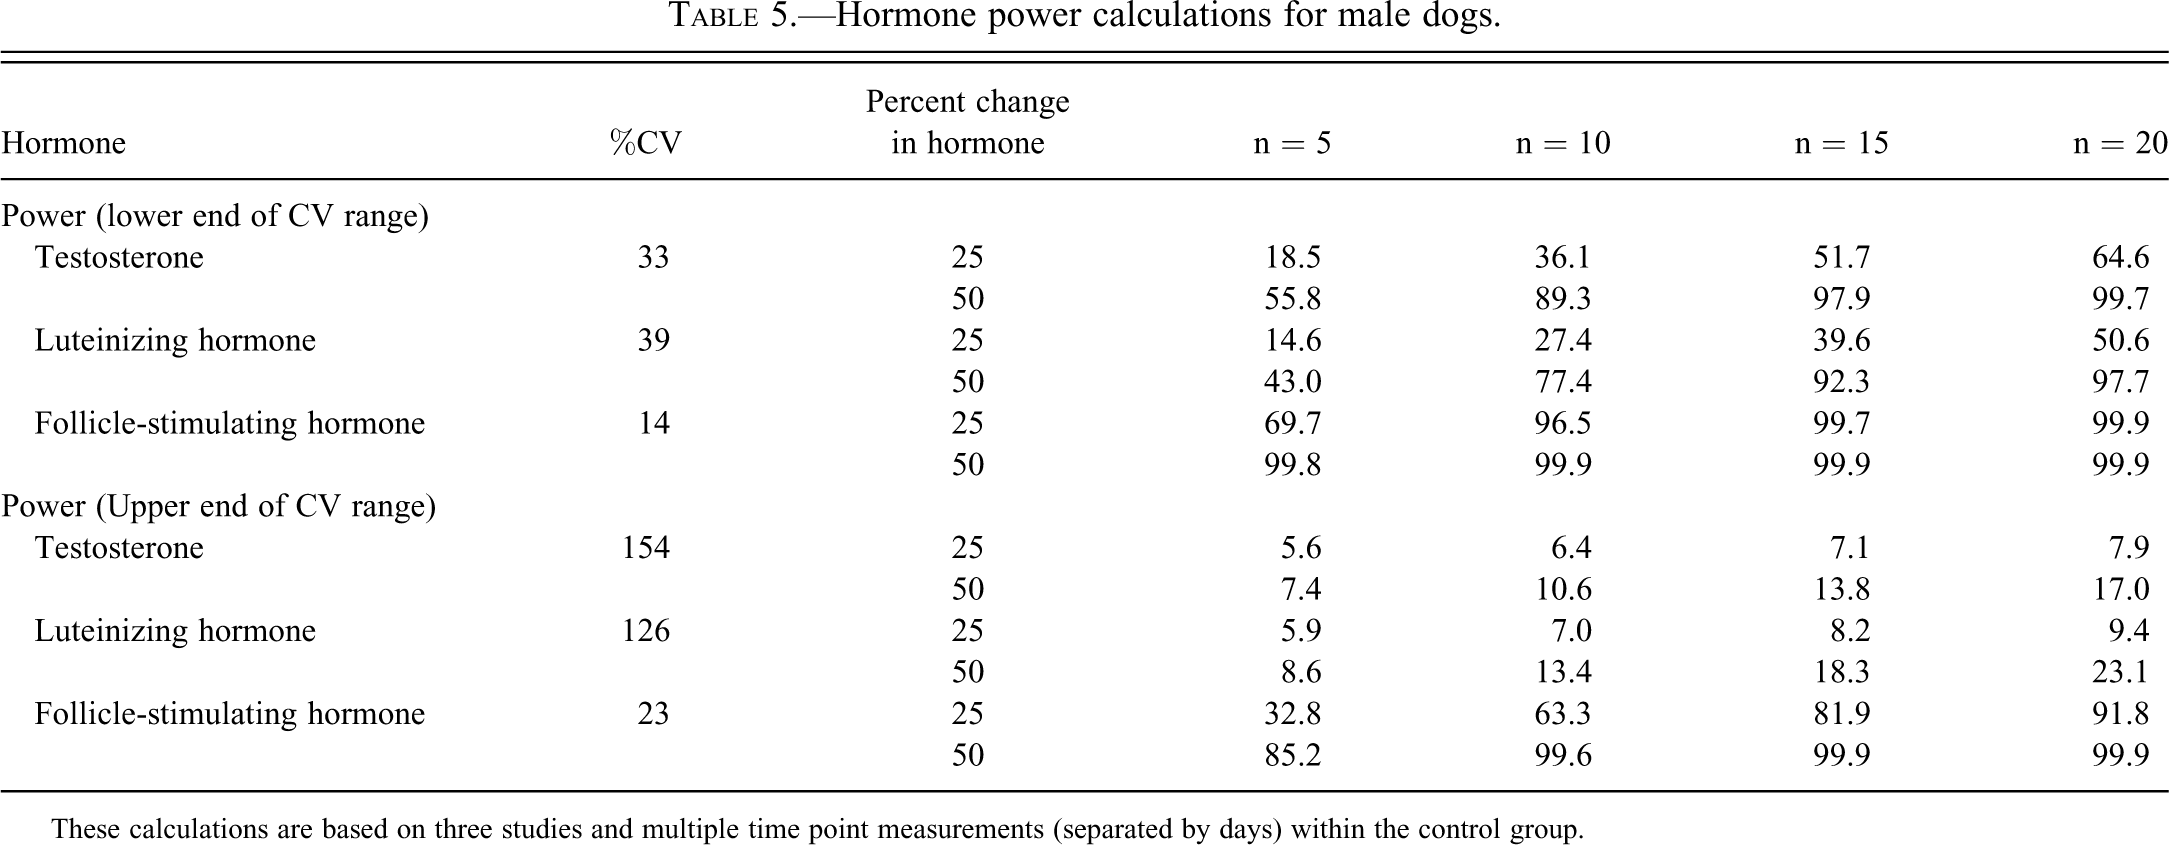
These calculations are based on three studies and multiple time point measurements (separated by days) within the control group.
Primates
Primates, and macaques in particular, are more like dogs than rats in that their LH pulses are followed closely in time by a surge of T, and there are significant circadian differences in LH and T secretion, which are much higher at night than during the light hours (Plant 1981; Puri et al. 1980; Steiner et al. 1980; Steiner and Bremner 1981). Also like dogs, male macaques use E2 for the central feedback of peripheral hormones (Ellinwood et al. 1984; Roselli and Resko 1990). The significant diurnal differences and the value of each experimental primate make it much more likely that blood will be sampled without terminating the animal. And given their size and blood volume, sequential sampling to catch a peak of LH and T is quite possible. The number of animals per treatment group will be driven more by ethical concerns, availability, and cost, rather than ensuring adequate power for hormone sampling. To confirm an effect on a target organ, identifying a potential treatment effect in a small number of treated primates should stimulate the investigator to consider a challenge study if the experimental design allows. That is, if both the LH and T pulses appear smaller or more blunted than the controls, a GnRH-stimulation study would be useful to test the hypothesis that pituitary sensitivity to endogenous GnRH is altered by treatment. Examples of such designs are available in the literature.
FSH and Inhibin B
Rats
FSH and inhibin B are believed to relate to each other in roughly the same way as LH and T. Follicle-stimulating hormone is the pituitary product that affects the testis, and inhibin B is thought to be the testis product that feeds back to inhibit FSH release. Follicle-stimulating hormone seems to play its largest role on Sertoli cells during development, whereas its effects in adult animals are more subtle and relate to sublethal functional effects in Sertoli cells and supporting germ cell survival (Kumar 2005; Ruwanpura et al. 2008; Sairam and Krishnamurthy 2001; Sluka et al. 2006). In addition, it is rare to find changes in the levels of one gonadotropin without a change in the other, so reports of selective changes in FSH are unusual indeed. Most often in toxicology studies, FSH is found to be increased as a compensatory response to damage in the seminiferous tubules. For these reasons, a large reduction in FSH alone has not yet, to our knowledge, been reported as the precipitating cause of testis damage.
Inhibin B, on the other hand, has received intense interest as a circulating biomarker or indicator of the state of spermatogenesis, or the number and activity of the Sertoli cells (Buzzard et al. 2004). In this view, impaired spermatogenesis would result in reduced secretion of inhibin B, which would allow a compensatory rise in FSH. The reader is referred to an excellent review of this field (Stewart and Turner 2005). In the area of clinical infertility, inhibin B appears most useful for placing patients into treatment categories rather than predicting the fecundity of individual men (Bordallo et al. 2004; Mabeck et al. 2005; Meachem et al. 2001; Pierik et al. 1998; Sikaris et al. 2005). Indeed, the link between many other measures of reproductive function in men and circulating inhibin B levels seems more qualitative than quantitative, and it is most commonly viewed as a useful adjunctive rather than primary diagnostic end point (Mabeck et al. 2005; Meachem et al. 2001; Pierik et al. 1998).
For the past several years, the Reproductive and Developmental Toxicity Technical Committee of the Health and Environmental Sciences Institute has been evaluating a new enzyme-linked immunosorbent assay for inhibin B from Beckman Coulter. The first questions concerned the stability of the inhibin in plasma or serum and the technical robustness of the assay. Although the data are still in the process of being analyzed as of this writing, initial indications are that the analyte is relatively stable in the freezer (−20°C) for several months and that the assay is technically acceptable (based on replicability, variance, etc.). Two of the four laboratories performing this work found that the concentrations in control rats were on the very low end of the standard curve, and since a treatment effect would be expected to lower hormone levels, these low concentrations somewhat constrain the use of the assay. The other two labs did not find this low range in control animals to be a problem.
The next questions apply to the relationship between pathology in the testis and changes in circulating levels of inhibin B. Initial data show that this relationship seems to vary by compound: some compounds produce a more robust response (Jane Stewart et al., unpublished data), whereas others produced a reduction in inhibin B in all animals, even though only a minority of animals had a lesion in the testis (Chapin et al., unpublished data). This result does not appear to be time dependent; that is, it did not appear to be a leading indicator, but it appeared to respond in all animals regardless of lesion. This finding could pose challenges for the use of inhibin B in monitoring individual clinical trial subjects. A more widespread and thorough examination of the relationship between lesion and hormone levels in rats will occur in 2012. However, given the relatively poor performance of inhibin B as a marker of “spermatogenic health” in individual humans (Mabeck et al. 2005; Meachem et al. 2001), it might be unrealistic to expect a tighter correlation in animals.
Power calculations for FSH are given in Tables 2 and 3. For inhibin B, two labs have calculated these values and came out with essentially the same values: one would have an 80% chance of observing a 10%, 20%, or 30% decrease using thirty-six, ten, and five rats (Coulson, Chapin, personal communications). To have a 90% chance of seeing those same decreases, the numbers would be forty-nine, thirteen, and seven rats, respectively.
Dogs
The literature on inhibin B in male dogs is very limited: one publication reaches the surprising conclusion that it comes principally from the Leydig cells (Taniyama et al. 2001). This is clearly an area that would benefit from more investigation.
Some internal work at Pfizer with the new Beckman Coulter kit found no meaningful cross-reactivity between the antibody and dog serum (Aubrecht et al., unpublished data). This finding is confirmed by the manufacturer.
Primates
There are useful reviews on FSH and inhibin B in male primates (Plant and Marshall 2001). Internal work at Pfizer suggests that primate inhibin B does indeed cross-react with the antibody in the Beckman Coulter assay, and that levels in mature males are well within the standard curve of the assay (Mirsky et al., unpublished data). To our knowledge, no data have been gathered to date on the relationship between serum inhibin B levels and testis histopathology in primates.
Prolactin
Rats
Prolactin is a peptide hormone cytokine with a wide range of biological activities outside of its well-known role in lactation (Grattan and Kokay 2008). For an excellent and concise high-level summary, see the PRL section in Cooke et al. (2004).
Prolactin is synthesized in a wide variety of tissues, although here our focus will be on PRL levels in the blood, presumably originating mostly from the pituitary in male rodents. Prolactin is secreted from the pituitary in a pulsatile manner in response to numerous physiological triggers including suckling, breast stimulation, stress, as well as numerous endogenous stimulating factors such as estrogen, vasoactive intestinal peptide, thyrotropin releasing hormone, and galanin (Cooke et al. 2004). Conversely, DA released from the hypothalamus is the principal negative regulator of PRL secretion, as it has a direct inhibitory effect on PRL release from the pituitary. Antipsychotics that antagonize DA or lower DA release will thus raise serum PRL concentrations, whereas neuroactive agents that activate DA or stimulate dopaminergic receptors will lower PRL release from the pituitary. Elevated PRL can affect T production both centrally (Grattan et al. 2007) and by direct actions on the Leydig cells (Huang et al. 1999; Huang et al. 2001). Elevated PRL may also directly affect spermatogenesis (Aleem et al. 2005; Katovich et al. 1985), although this effect needs to be replicated and better understood.
It is well understood that PRL release in human males follows a circadian rhythm, characterized by increased secretion during hours of sleep (Cooke et al. 2004). However, this secretion pattern has not been clearly demonstrated in male rats. Although the data are not always consistent, some reports indicate that PRL release in rats is dependent on the time of day (Castrillon et al. 2001; Esquifino et al. 2004; Garcia-Bonacho et al. 2000). In contrast, a study by O’Connor, Van Pelt et al. (2000) that was performed using rats with indwelling catheters for blood collection (and thus presumably decreasing the potential for stress-induced effects on PRL from the blood collection) found no differences in PRL concentrations as a result of the time of blood collection. In addition, a report by Garcia-Bonacho et al. (2000) indicated that the time-of-day dependence of PRL secretion may also be age dependent, in that rats “lose” the circadian secretion of PRL as they age. These conflicting data illustrate the difficulties in measuring serum PRL levels in rodent studies. Although time-of-day of blood collection and the age of the animals may be factors for experimental design, the age of the animals will usually be controlled in experiments, and therefore the age-dependent effects are typically of no concern when designing experiments to look at serum PRL concentrations. However, given the uncertainty, it seems prudent that blood collection should be completed over a short duration (e.g., <two hours), and the collection should be stratified across treatment groups to minimize the potential confounding from possible circadian variations in serum PRL concentrations.
One of the largest challenges to be overcome when designing studies to evaluate serum PRL concentrations is the increase in serum PRL as a result of stress. Since PRL is a stress-responsive hormone (de Greef and van der Schoot 1985; Delitala et al. 1987; van de Kar et al. 1991), and because sampling blood from rats is inherently stressful, extreme care must be taken to avoid inducing an iatrogenic, sampling-related increase in blood PRL that might completely mask any treatment-induced effects (or lack thereof). Several steps can be taken to prevent or minimize the possibility of stress-related increases in serum PRL concentrations. The ideal method of blood collection will completely avoid stress, and therefore an indwelling cannula is the best option when evaluating PRL or other hormones affected by stress. However, in cases in which this method cannot be used, the investigator must take many small steps to minimize stress in the test animals as much as possible. For terminal studies, animals should be transported to the necropsy area at least an hour before the necropsy in order to allow them time to adjust to the transportation as well as their new surroundings. Additional steps include handling animals that are being necropsied only for short periods prior to necropsy and in a different room from where they are being kept. The quickest euthanasia method for blood collection will be decapitation, although if animals can be rapidly anesthetized prior to blood collection (e.g., less than one minute), then the potential stress effect on PRL is reduced. The effect of stress is illustrated in a report by O’Connor, Davis et al (2000a) in which blood collection by tail-venipuncture resulted in serum PRL concentrations that were elevated about four-fold over those by rapid terminal euthanization. In addition, the PRL concentrations in that report were similar to those in control animals previously obtained by indwelling cannula (O’Connor, Van Pelt et al. 2000).
Rats appear to be able to acclimate relatively quickly to consistent nonthreatening changes in their routine or surroundings. In pursuit of low, nonstressed PRL values, one lab group went so far as to acclimate the animals several times to the move to the room outside of necropsy and to being handled in the necropsy area. These methods produced very low PRL values in the controls but may be prohibitive in many studies given the degree of time and technical investment required to obtain these low levels.
Power calculations for PRL measurements in rats, given the methods above, are provided in Table 2. If the methods used in your laboratory generate data with relatively low variation, n = 15 should yield good power to detect a significant change.
Dogs
Compared to the situation in rats, measurement of actual (nonstressed) PRL concentrations is easier in dogs. First, dogs seem less affected by the stress of blood sampling. Knol et al. (1992) compared venipuncture versus indwelling catheter and found no difference in the blood concentrations of cortisol, a stress-responsive hormone. There is no circadian peak or trough of PRL values consistently found across different individual dogs (Corrada et al. 2006). Finally, pulsatility of PRL release in dogs seems to be somewhat less than for other hormones, although there still are infrequent burst releases (Corrada et al. 2006). Nevertheless, the CV for group PRL concentrations, which appears to be 10%–20%, seems much less for PRL than for LH or T, which is closer to 60%–80% (James et al. 1979; Koch et al. 2006; Urhausen et al. 2009). Thus, one should be able to obtain relatively low-variance values for blood PRL from any group of reasonably well-acclimated dogs usually found in a good laboratory animal facility using standard venipuncture techniques.
Primates
Male macaques have a diurnal cycle in PRL concentrations, with higher levels at night than during daylight hours (Puri et al. 1980). Finer (more frequent) sampling shows an approximate doubling of the serum values in the first four hours of dark, with a nadir in the first hour or so after lights-on (Plant 1981). These data were largely replicated by Quabbe et al. (1982), who used a group of eight catheterized male macaques to identify a nadir shortly after lights-on, peaks in serum PRL about midmorning, and a much larger peak shortly after lights-out. Beck and Wuttke (1979) found an annual rhythm in serum PRL levels in wild-caught, laboratory-maintained, seasonally breeding rhesus macaques, which peaked between September and November. Interestingly, Herndon et al. (1984) reported that although growth hormone and cortisol concentrations were increased by the use of venipuncture (versus an indwelling catheter), serum PRL was unaffected by the stress of venipuncture. The numbers of primates available for study is often driven by more important concerns than simply the power to detect a hormonal change, but the papers cited here provide some helpful background to enable collecting the best data with an appropriate commitment of animal and human resources.
The Importance of Design
Experimental design is a critical element of proper assessment of hormonal effects. The experimental design section above provides specific group sizes, but here we wish to momentarily emphasize the implications of those numbers. Practically, it might be unrealistic to recommend using thirty animals to measure T. However, the consequences of using too few animals will be a wrong or misleading answer. Indeed, the mistaken perception that a small sample correctly represents the real distribution of the underlying biology is so widespread and affects so many people that it has been codified by the moniker “the law of small numbers” (Tversky and Kahneman 1971).
It is easy to be “fooled by randomness” (Taleb 2004) and be misled by numbers that appear (mostly) consistent with the histology. Indeed, Taleb makes the point that for humans, it is hard-wired into our thinking to reach conclusions based on what we see, and we are so driven toward those conclusions that we seldom stop to question how we got there, or whether the design supports all the weight we put on it. In addition, Mlodinow (2008) reviewed a vast amount of literature to drive home the point that humans are really quite poor at recognizing randomness, regardless of profession, training, or technical competence. When measuring hormones in nonclinical species, as “n” decreases, the influence of randomness increases sharply. We can choose to either tolerate its large and pernicious influence and make the wrong decisions because we do not recognize it, or take the simple steps to sufficiently power our studies to avoid it.
The first author of this paper, who has performed and published a study that reported a treatment-induced decrease in T in rats with an n=10, has personal experience of this situation. Although the histology data were consistent with this decrease, the accessory organ weight changes were discordantly quite small. Several studies’ worth of effort was later unable to replicate this reduction. Quite aside from being embarrassing and disturbing, this result drove home the point that correctly powering the study the first time avoids a great deal of wasted time and effort (in this case, about three years of wrong conclusions and failed attempts at replication, not to mention seeding the literature with an error).
More broadly, a recent survey of industry practices indicated that most investigative studies of blood hormone concentrations (most often T) used five to eight animals per group (Sasaki et al. 2011). Based on what we have seen above, we can with reasonable certainty conclude that
Summary and Conclusions
Most testicular toxicity can occur with no change in hormone levels. However, testicular or male reproductive toxicity Based on the coefficients of variation of the different hormones, the following group sizes are recommended to obtain a reasonable (80%) chance of detecting a 50% change in hormone level T in rats: n = 30/group FSH and LH in rats: n = 10–20/group (confirm the variation in your own lab) T in dogs and monkeys: sample every 10–20 minutes over a 2- to 2.5-hour period and pool the samples for an integrated value (otherwise, group sizes of n = 20 would be needed if only a single sample is taken) When conducting hormonal measurements in any species, it is important to establish that the animals have attained sexual maturity and, for PRL, to control for factors such as diurnal variation and stress.
Pathologists and toxicologists agree that the morphologic structure of a tissue is a window into the underlying biochemistry. It makes our job easier to find that specific lesions are quite characteristic of specific hormonal imbalances. A holistic approach to understanding the changes will yield better insights and less wasted effort in subsequent experiments or in determining the implications of any given effect. This paper has been aimed at helping the pathologist to identify likely hormone-induced lesions and then to design subsequent experiments that can allow the investigators to build on these observations.
Footnotes
Acknowledgments
The authors are indebted to Dr. Kjell Johnson for his expertise and cheerful support in constructing the power tables and in providing helpful guidance about statistics. The authors are also indebted to Drs. Dinesh Stanislaus and Hakan Andersson for their contribution of dog hormone data; to Dr. Sabine Rehm for her many helpful suggestions and additions; and Drs. Charles Wood, John Vahle, and Rogely Boyce for their critical reading of the manuscript.
The authors declared no potential conflicts of interest with respect to the research, authorship, and/or publication of this article.
The author's declared the following financial support for the research, authorship, and/or publication of this articel: Dr. Chapin received salary support for the composition of this article from Pfizer, Inc.
This review series is a product of the Society of a Toxicologic Pathology (STP) Working Group and has been reviewed and approved by the Scientific and Regulatory Policy Committee and Executive Committee of the Society. The paper does not represent a formal best practice recommendation of the Society, but it provides expert guidance on key principles to consider in designing regulated or exploratory toxicity studies.