
Abstract
Regulatory T-cells (TREG) are diverse populations of lymphocytes that regulate the adaptive immune response in higher vertebrates. TREG delete autoreactive T-cells, induce tolerance, and dampen inflammation. TREG cell deficiency in humans (i.e., IPEX [Immunodysregulation, Polyendocrinopathy and Enteropathy, X-linked syndrome]) and animal models (e.g., “Scurfy” mouse) is associated with multisystemic autoimmune disease. TREG in humans and laboratory animal species are similar in type and regulatory function. A molecular marker of and the cell lineage specification factor for TREG is FOXP3, a forkhead box transcription factor. CD4+ TREG are either natural (nTREG), which are thymus-derived CD4+CD25+FOXP3+ T-cells, or inducible (i.e., Tr1 cells that secrete IL-10, Th3 cells that secrete TGF-β and IL-10, and Foxp3+ Treg). The proinflammatory Th17 subset has been a major focus of research. TH17 CD4+ effector T-cells secrete IL-17, IL-21, and IL-22 in autoimmune and inflammatory disease, and are dynamically balanced with TREG cell development. Other lymphocyte subsets with regulatory function include: inducible CD8+ TREG, CD3+CD4−CD8− TREG (double-negative), CD4+Vα14+ (NKTREG), and γδ T-cells. TREG have four regulatory modes of action: secretion of inhibitory cytokines (e.g., IL-10 and TGF-β), granzyme-perforin-induced apoptosis of effector lymphocytes, depriving effector T-cells of cytokines leading to apoptosis, or inhibition of dendritic cell function. The role of TREG in mucosal sites, inflammation/infection, pregnancy, and cancer as well as a review of TREG as a modulatory target in drug development will be covered.
Introduction to Regulatory T-Cells
This article will review the scientific literature and provide an overview of Regulatory T-cell (TREG) characterization, function, role in the immune response, at mucosal sites, during pregnancy and in the tumor microenvironment, and as a target for modulation in drug development. There has been enhanced focus on the TREG in the field of immunology, which translates into a prominent increase in the number of citations over the past decade (Figure 1).
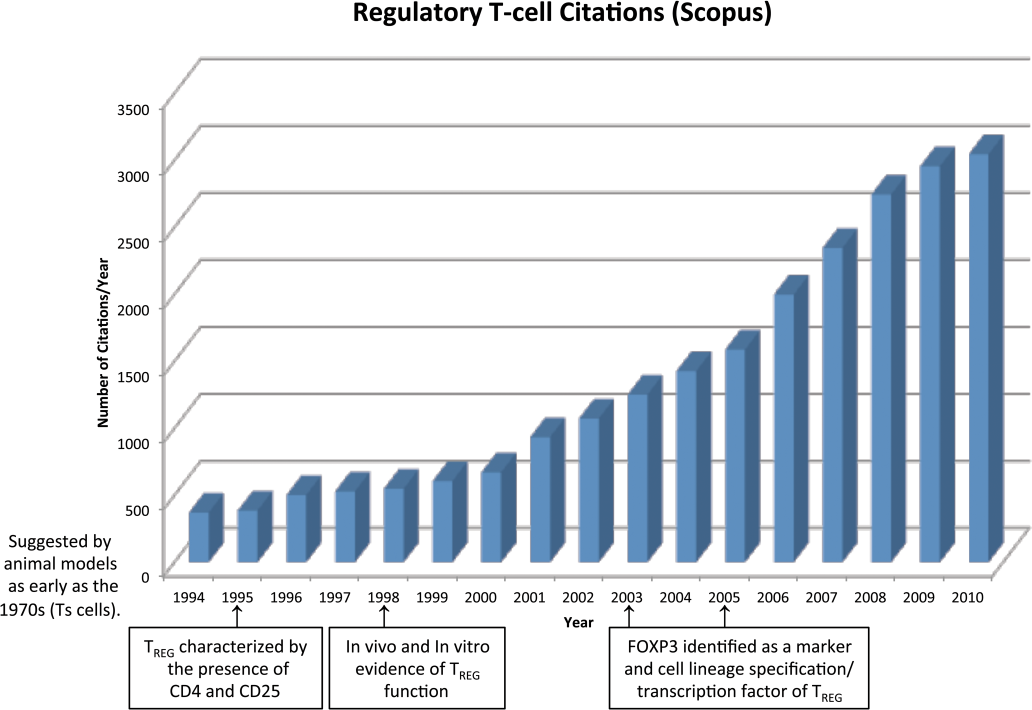
There has been a steady increase in the number of regulatory T-cell (TREG) citations in the scientific literature from the mid-1990s to the present (from Scopus). The key milestones in TREG research are highlighted on the horizontal axis.
TREG are diverse populations of lymphocytes that regulate the adaptive immune response in higher vertebrates. TREG delete autoreactive T-cells, induce tolerance, and dampen inflammation (Akdis 2009; Ozdemir et al. 2009; Dittel 2008; Orihara et al. 2008; Sakaguchi et al. 2008; Simpson 2008; Bluestone and Tang 2005; Coutinho et al. 2005).
Over the past 40 years, the field of immunology has slowly evolved, becoming much more complex than was initially hypothesized in the 1960s. Between 1966 and 1968, several groups identified B-lymphocytes as the source of the antibody response and T-lymphocytes as critical in the delayed-type hypersensitivity (DTH) response (Claman et al. 1966; Mosier 1967; Mitchell et al. 1968). In 1971, Gershon and Kondo identified negative interference on positively acting lymphocytes during inflammation and referred to it as “infectious immunological tolerance” (Gershon and Kondo 1971). This was the first indication that a “suppressive” process was active during inflammation. The “suppressor T-cell” hypothesis was put forth by two groups in the later years of the 1970s (Vadas et al. 1976; Okumura et al. 1977). A series of negative results from experiments conducted by several groups led to a loss of confidence in the “suppressor T-cell” hypothesis, rejection of the hypothesis by the field of immunology, and more recently reacceptance (Kapp and Bucy 2008; Germain 2008; Lehner 2008). The rejection of the “suppressor T-cell” hypothesis did not explain away the presence of a dampening of immune responses commonly seen in the inflammatory milieu. In 1989, Mosmann and Coffman identified the T-helper (TH)-1 and (TH)-2 CD4+ T-cell subsets based upon the profiles of cytokines secreted after activation. TH1 cells primarily secrete IFN-γ, IL-15, and TNF-α, while TH2 cells secrete IL-4, IL-5, IL-6, and IL-13. Powrie et al. showed in severe combined immunodeficient (SCID) mice that subsets of CD4+ T-cells induce and protect from intestinal inflammation (Powrie et al. 1994). This once again defined a population of lymphocytes with immunosuppressive actions, which was identified as a population expressing CD45RBlow while the inducing cells were CD45RBhigh. In 1995, Sakaguchi et al. found that immunologic self-tolerance was maintained by activated CD4+ T-cells expressing CD25 (IL-2R alpha chain). Depletion of this CD4+CD25+ population led to development of autoimmune disease (Sakaguchi et al. 1995). Two groups, Hori et al. and Fontenot et al., identified a CD4+CD25+FOXP3+ cell population that was found to be thymically derived, natural TREG cells (Hori et al. 2003; Fontenot et al. 2003, 2005). FOXP3 has been shown to be critical for regulatory action of most subtypes of TREG.
Types of Regulatory T-Cells (TREG, Natural, and Adaptive/Induced) CD4+CD25+ TREG
Natural TREG are thymus-derived CD4+CD25+FOXP3+ T-cells (Figure 2). They arise in the thymus during early stages of human fetal development (gestational week 14) (Cupedo et al. 2005) and are resistant to thymic deletion (Lim et al. 2006). nTREG differentiate from thymocytes that express TCRs with an increased affinity for self-peptide-MHC complexes (Lim et al. 2006; Maggi et al. 2005; Schwartz 2005). nTREG can suppress the following cell types: CD4+ T-cells, dendritic cells, CD8+ T-cells, NKT cells, NK cells, monocytes/macrophages, B-cells, mast cells, basophils, eosinophils, and osteoblasts (Shevach et al. 2009; Lim et al. 2006). FOXP3+ expression is necessary for thymocytes to commit to the TREG lineage (Lim et al. 2006). Resting nTREG are CD45RA+FOXP3low, while activated nTREG are CD45RO+FOXP3high (Beissert et al. 2006; Lim et al. 2006). Natural TREG also express the following markers: T cell activation/differentiation markers (CD45RO [memory phenotype; activated], CD45RB [resting], CD25 [both]), adhesion molecules (CD62L [both], CD44 [both] and Integrin α4β7 [resting]), cytotoxic T lymphocyte-associated protein-4 (CTLA-4; both), co-stimulatory molecule CD28 (both), chemokine receptors (CCR7 [both], CXCR4 [both], CCR9 [resting]), glucocorticoid-induced TNFR-related protein (GITR, both), OX40 (CD134, both), and folate receptor-4 (FR4 in rodents, both) (Lim et al. 2006). IL-2 is essential for nTREG development, function, and homeostasis (i.e., CD25 is the α-chain of the high affinity IL2R) (Malek et al. 2008). Severe autoimmunity is seen in IL-2-, IL2Rα-, and IL-2Rβ-deficient mice, which also lack a normal number of TREG cells (Malek et al. 2008). The nTREG profile in mammals is highly conserved. Nonhuman primates have the same nTREG protein expression and functional profile as that of humans including two FOXP3 isoforms (Roncarolo and Battaglia 2007; Bloom 2006), while in rodents there are only subtle differences primarily in the type of granzyme expressed (i.e., B versus A) and only a single FOXP3 isoform (Roncarolo and Battaglia 2007).
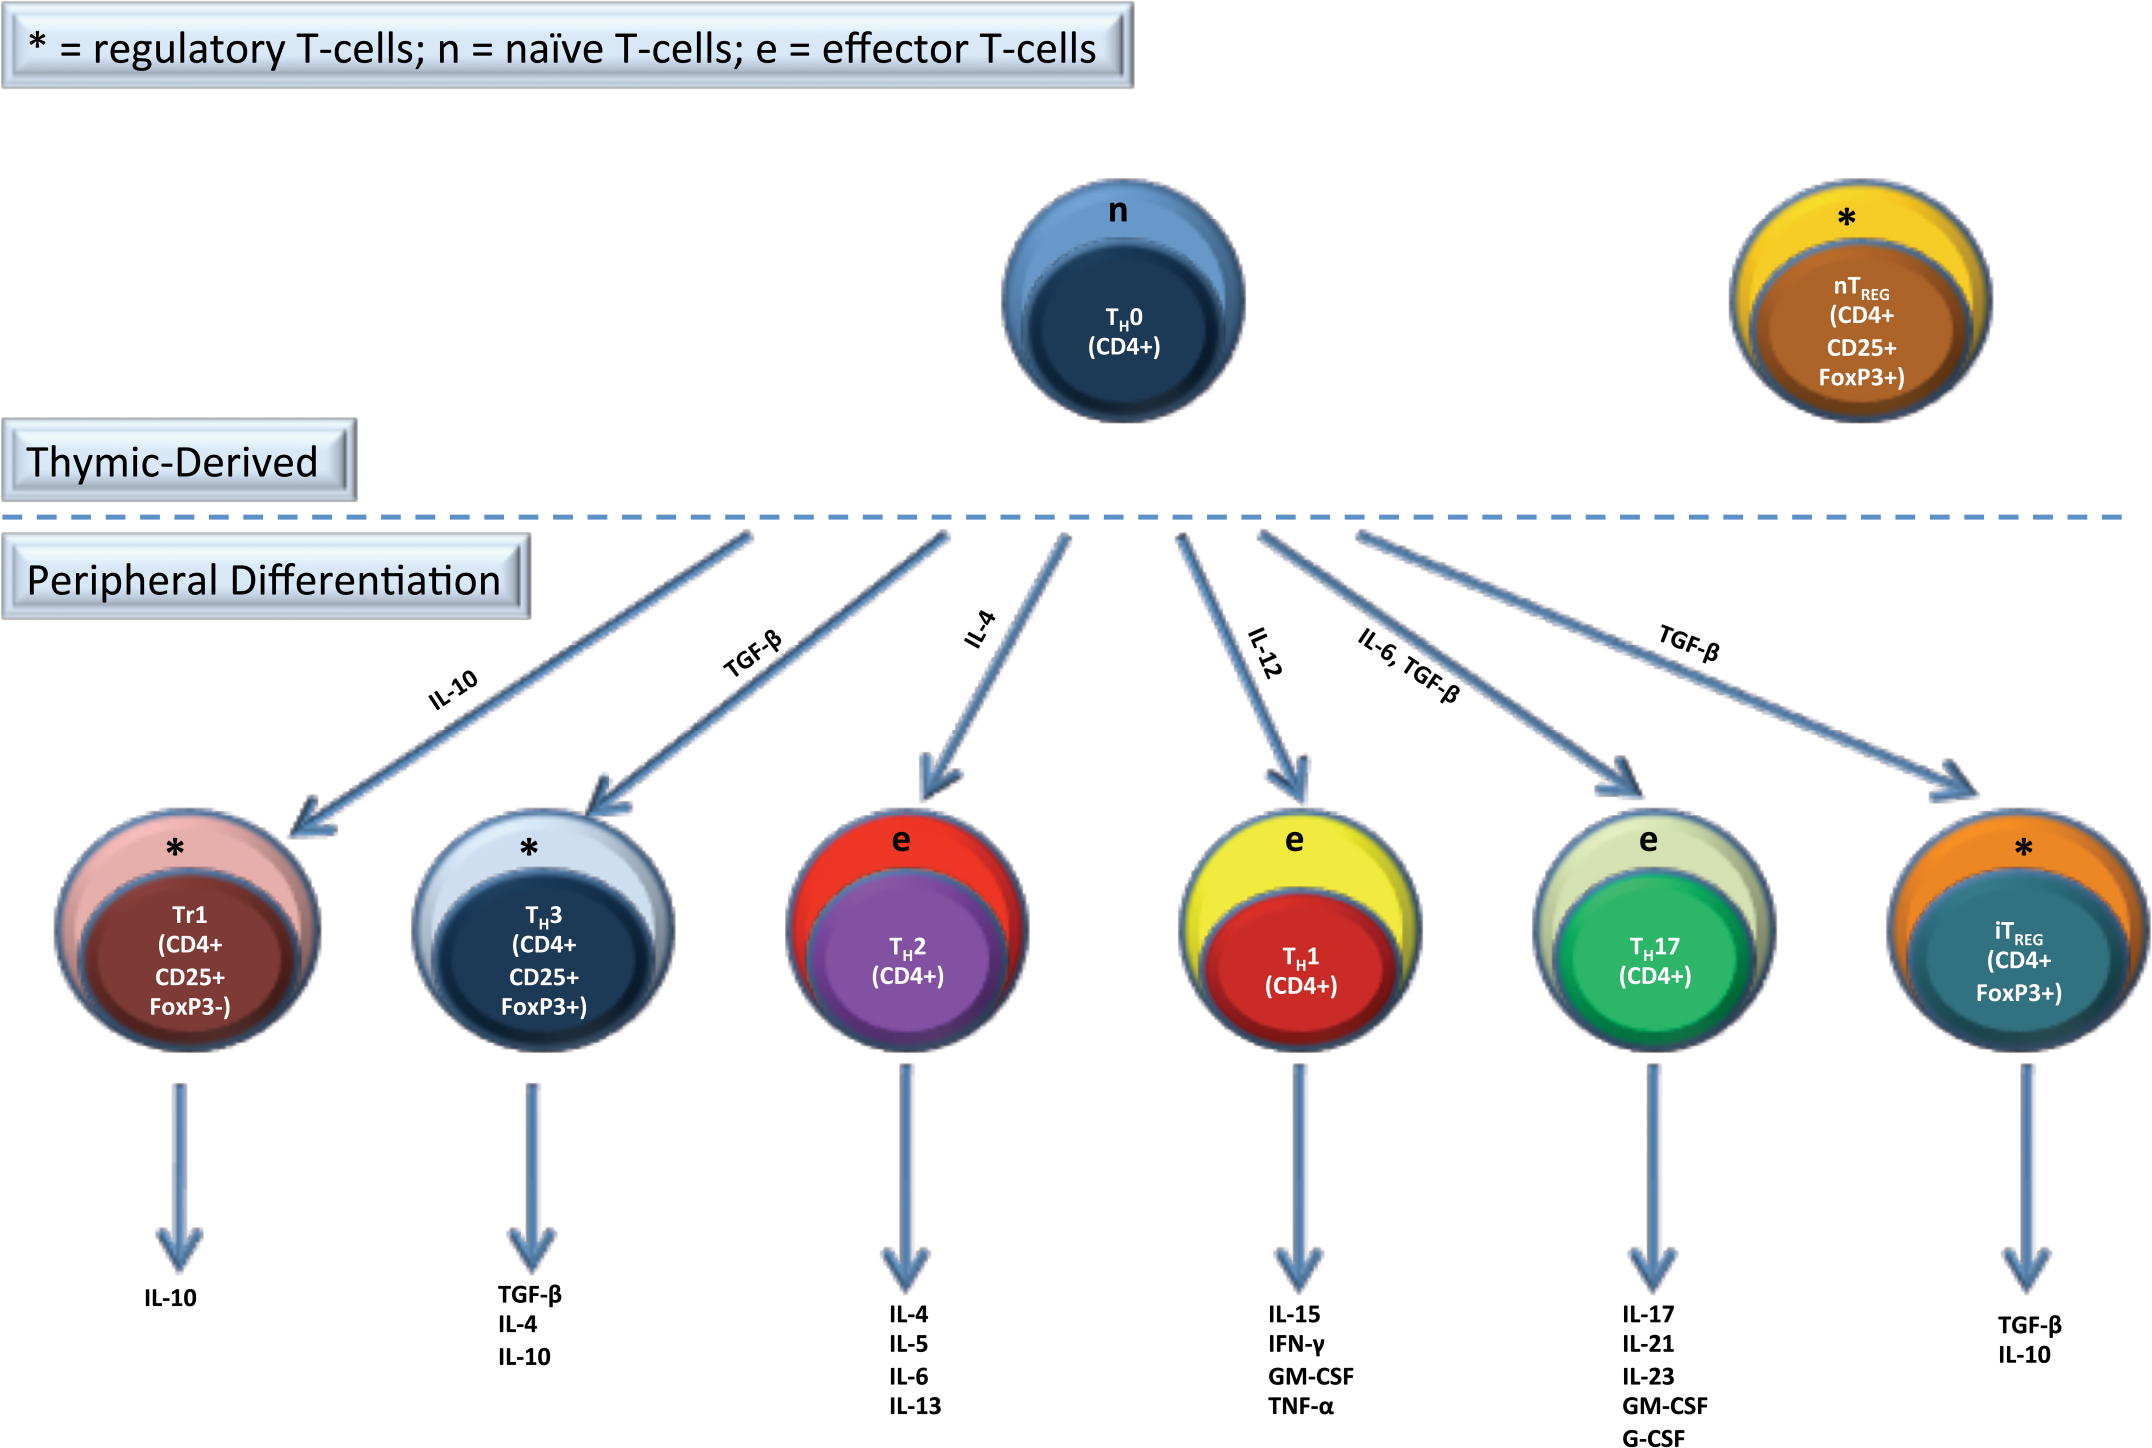
TREG are either formed naturally by thymic differentiation (nTREG) or are induced in the periphery (iTREG) from naïve T-cells (TH0). Types of iTREG include TH3, Tr1, which are CD4+CD25+FOXP3+, and CD4+CD25-FOXP3+ iTREG. The main effector CD4+ subsets are TH1, TH2, and TH17. The cytokines that are important in inducing these cells from TH0 cells and the cytokines that these cells secrete are listed.
Adaptive/Induced TREG
The two most common types of adaptive or induced TREG are the T regulatory type 1 cells (Tr1) and TH3 TREG cells (Figure 2). Tr1 cells secrete IL-10 and also have an IL-10-dependent induction process (Fujio et al. 2010; Beissert et al. 2006; Roncarolo et al. 2006). They are capable of secreting high levels of IL-10 and TGF-β in the human and mouse and also secrete low levels of IL-2, IL-5, and IFN-γ (Fujio et al. 2010; Roncarolo et al. 2006). An important growth factor for Tr1 cells is IL-15, which can support Tr1 cell proliferation even without TCR activation (Fujio et al. 2010; Roncarolo et al. 2006). They are CD4+, anergic, and proliferate poorly upon antigen-specific activation which is likely due to the autocrine production of IL-10 leading to suppression of proliferation (Fujio et al. 2010; Roncarolo et al. 2006). The mechanism of suppressive effects with Tr1 cells is soluble factor-based (i.e., IL-10), and the suppressive effects of Tr1 cells are negated by anti-IL-10 neutralizing antibody in vitro (Fujio et al. 2010; Roncarolo et al. 2006). There is no specific marker for Tr1 cells, although repressor of GATA-3 (ROG) shows potential utility (Fujio et al. 2010; Roncarolo et al. 2006), but it is not specific for this cell population.
TH3 cells secrete TGF-β and IL-10 and express FOXP3 (Beissert et al. 2006). They are induced from naïve CD4+ T-cells by TGF-β and have an important role in oral tolerance to non-self antigens and negating autoimmune reactions (Wan and Flavell 2007). TH3 cells secrete TGF-β, which has immunosuppressive effects acting through a soluble-factor mechanism. TH3 cells have a reciprocal relationship with TH17 cells (Korn et al. 2009; Nistala and Wedderburn 2009). TH17 cells are highly proinflammatory and are thought to be important in autoimmune disease (Abraham and Cho 2009; Crome et al. 2009; Korn et al. 2009; Nistala and Wedderburn 2009; Romagnani et al. 2009); this will be discussed in detail later in the article. There has been no specific surface marker identified for TH3 cells, although expression of FOXP3 is induced in TH3 cells (i.e., cannot differentiate from nTREG) (Korn et al. 2009).
Other T-Cells with Regulatory Function
Other T-cell populations that have been shown to have regulatory function include inducible CD8+ TREG cells, CD8+CD28− TREG cells, and CD3+CD4−CD8− TREG (double-negative [DN]). CD8+ TREG (Kapp and Bucy 2008; Beissert et al. 2006; Nakamura et al. 2003; Ke and Kapp 1996; Jiang et al. 1992) are CD8+ T-cells that have regulatory activity on CD4+ TH1 cells. This TREG population inhibits priming of CD8+ T-cells, CD4+ T-cells, and antibody responses against oral antigens. They are induced by manipulation of co-stimulatory molecule interactions (i.e., CD137 and CD40) primarily, although antigens introduced into immune privileged sites (i.e., anterior chamber of eye leading to anterior chamber-associated autoimmune deviation [ACAID]) elicit CD8+ TREG due to high levels of TGF-β and IL-10 at this site (Biros 2008; Niederkorn 2008). They have also been shown to arise spontaneously in Experimental Allergic Encephalitis (EAE) and murine Ovalbumin-induced oral tolerance models and in tumor-bearing hosts due to IL-10 secretion by APCs in the neoplasm. They are well characterized in rodents, but their importance in humans is uncertain. CD8+CD28- TREG (Cortesini et al. 2001; Chang et al. 2002) are FOXP3− and are induced by inhibitory immunoglobulin-like transcript (ILT)-3 and ILT-4 receptor expression on dendritic cells and down-regulation of CD80 and CD86. They interfere with the CD28/B7 pathway with allogeneic antigens and CD154/CD40 pathway with xenogeneic antigens. CD8+CD28− TREG regulate immune responses by direct cell-to-cell interactions with dendritic cells; therefore they are directly tolerogenic. This cell population has been described in rodents and humans. CD3+CD4−CD8− (DN) TREG are TCRαβ+, CD4−, and CD8− (therefore DN). They promote the development of tolerance and regulate autoimmunity (Strober et al. 1996). This cell population has been defined and characterized in heart xenotransplantation experiments (Chen et al. 2003, 2005; Zhang et al. 2006; Ma et al. 2008). DN TREG are poorly suppressive in naïve mice but are actively suppressive in recipients of heart xenografts co-transferred with donor DN Tregs. They have been shown to prevent heart xenograft rejection (i.e., transplant tolerance). It has been shown that antigen presenting cells (APC) from tolerant mice had down-regulation of MHCII, CD40, and B7 molecules, and likely were in an immature state. The significance of DN TREG in nontransplant scenarios is therefore uncertain and more data is needed.
CD4+Vα14+ (NKTREG)
Natural killer T-cells coexpress NK receptors (i.e., NK1.1 or CD161) as well as a conserved T-cell receptor (TCR) molecule (Beissert et al. 2006), Vα14. Vα14 pairs with Vβ8 in the mouse and Vβ11 in the human and are restricted by CD1d, a conserved MHCI-type molecule that presents glycolipids. NKTREG cells are generated in the thymus and can be CD4+, CD8+, DN, or double positive (DP). In mice, DN NKTREG are the dominant phenotype (Zeng et al. 1999); while in humans, CD4+ NKTREG are most efficient (Jiang et al. 2005). They have been studied primarily in rodent xenogeneic transplantation models (Ikehara et al. 2000). They secrete IL-4, IL-10, TGF-β (paracrine), and induce cytotoxicity by cell-to-cell contact, and the targets of NKTREG cells are T-cells and APCs (Ikehara et al. 2000; Zeng et al. 1999). The significance of NKTREG cells in immune regulation outside of xenotransplantation is uncertain.
γδ T-Cells (Mucosal/Intraepithelial)
Gamma delta (γδ) T-cells, which express TCRγδ and have a mucosal distribution, are primarily suppressive and are associated with mucosal tolerance (Kapp and Ke 1997; Ke et al. 1997; Mowat 1994), but can also function to regulate autoimmunity (Weiner et al. 1994), elicit ACAID in the eye (Biros 2008), and function in tumor immunity (Seo et al. 1999). These cells do not recognize peptides associated with MHC receptors (Kronenberg 1994); alternatively they recognize cellular proteins including heat shock proteins (Munk et al. 1989) and nonclassic MHC molecules like CD1 (Brossay et al. 1998) and Qa-1 (Vidovic et al. 1989). γδ T-cells that infiltrate tumors have cytokine profiles that are similar to Tr1 cells (i.e., IL-10 and TGF-β) and inhibit the immune response against neoplasia (Kapp et al. 2004; Seo and Tokura 1999; Seo et al. 1999; Kapp and Ke 1997; Ke et al. 1997). Therefore, γδ T-cells are a minor population of mucosal and intratumoral T-cells with regulatory activity and major roles in mucosal tolerance and tumor immunity.
A Non-T Lymphocyte Subset with Regulatory Function
Another cell type exhibiting regulatory activity is the regulatory B-cell (BREG) which has been recently reviewed by Li et al. (2011). BREG cells are beyond the scope of this review, but are mentioned here briefly to showcase the diversity of lymphocytes with regulatory function in the immune system and for completeness-sake. BREG cells have been shown in various animal disease models, including collagen-induced arthritis (Trentham et al. 1977), experimental autoimmune encephalitis (EAE) (Wolf et al. 1996), nonobese diabetes mellitus (Tian et al. 2001), inflammatory bowel disease (Mizoguchi et al. 2000), and systemic lupus erythematosus (Lenert et al. 2005), and function primarily to regulate T-cells, B-cells, and NKT cells. BREG cells act by soluble factor-based means by secreting IL-10 (Reigert and Bar-Or 2008), TGF-β (Takenoshita et al. 2002) and producing anti-inflammatory antibodies (Diamond et al. 2003). Cell-cell interactions are an important mode of BREG regulatory function and include CD1d binding (Yanaba et al. 2008) by CD1dhiCD5+ cells and CD40/CD40 L interactions (Quezada et al. 2004). More research into specific roles for BREG is needed to more completely define this cell type.
TREG Basics
TREG cells function at sites of inflammation in close spatial proximity to effector T-cells, thus allowing direct interactions between the two cell types (Askenasy et al. 2008). TREG cells are attracted by inflammatory signals, although they are less chemotactic than effector T-cells (Siegmund et al. 2005). When arriving at the site of inflammation, TREG down-regulate chemotactic receptors and adhesive interactions to arrest further migration (Siegmund et al. 2005). nTREG are mitotically inactive under basal conditions (Kuniyasu et al. 2000). Activated TREG-mediated immune suppression is antigen-nonspecific (i.e., not MHCII-restricted) (Bienvenu et al. 2005), although induction of suppressor function in TREG requires antigen-specific stimulation (i.e., via TCR) leading to tissue-specific suppressive effects (“bystander” suppression) (Shevach 2009; Weiner 1997). TREG have also been associated with regulating lymphopenia-induced lymphocyte proliferation, which is a normal homeostatic event that occurs after lymphopenia of numerous causes including those of a physiologic and pathologic nature. Lymphopenia-induced lymphocyte proliferation does not increase the number of naïve lymphocytes, but instead the number of memory T-cells increase, which might result in potential self-reactive clones and subsequent autoimmunity. TREG have an important role in regulating this process (Datta and Sarvetnick 2009).
Effects of Acute and Chronic Stress on Human TREG
βeta 1-adrenergic and glucocorticoid α receptors are overexpressed in TREG versus effector T-cells (Freier et al. 2010; Atanackovic et al. 2006). These receptors likely mediate TREG responses to stress (Freier et al. 2010; Atanackovic et al. 2006). TREG numbers have been shown to decrease with acute physiologic stress (Freier et al. 2010; Atanackovic et al. 2006; Atanackovic et al. 2002). Based on these findings, chronic stress could exacerbate autoimmune disease and other inflammatory conditions (Freier et al. 2010).
Modes of Action of TREG Regulation
TREG have primary effect on T-cells and/or dendritic cells by three main regulatory modes of action: (1) soluble factors (Figure 3), (2) cell-to-cell contact (Figure 4) and (3) competition for growth factors (local effect) (Figure 5). Soluble factors include IL-10 and TGF-β with direct suppressive effects on effector T-cells (Joetham et al. 2007; Annacker et al. 2003), fibrinogen-like protein-2 (FLG-2) with apoptotic effects on effector T-cells and prevention of maturation of dendritic cells (Shalev et al. 2009), granzyme A/B and perforin apoptotic effects on effector T-cells (Grossman et al. 2004), and production of adenosine by CD39/73 cleavage of ATP, which causes cell cycle arrest in effector T-cells and prevention of maturation and decreased antigen presenting capability in dendritic cells by binding to the A2A receptor on these cell types (Deaglio et al. 2007). Galectin-1 binding to effector T-cells and dendritic cells resulting in cell cycle arrest and/or apoptosis (Garin et al. 2007), CTLA4 and CD80/86 binding to dendritic cells causing decreased costimulation and decreased antigen presentation (Read et al. 2000), lymphocyte activating gene-3 (LAG3 or CD223, a CD4 homolog) binding to MHCII molecules on dendritic cells leading to prevention of maturation and a reduction in antigen presentation capability (Workman and Vignali 2004), and neuropilin-1 binding to dendritic cells resulting in decreased antigen presentation (Sarris et al. 2008) are examples of cell contact-based mediated effects of TREG. TREG can also deny IL-2 to other inflammatory cells by binding the cytokine and acting as a “sink” leading to effector T-cell apoptosis (Pandiyan et al. 2007). Therefore, TREG have a variety of mechanisms that can be used to suppress an immune response and are able to use all or a subset of these mechanisms simultaneously.
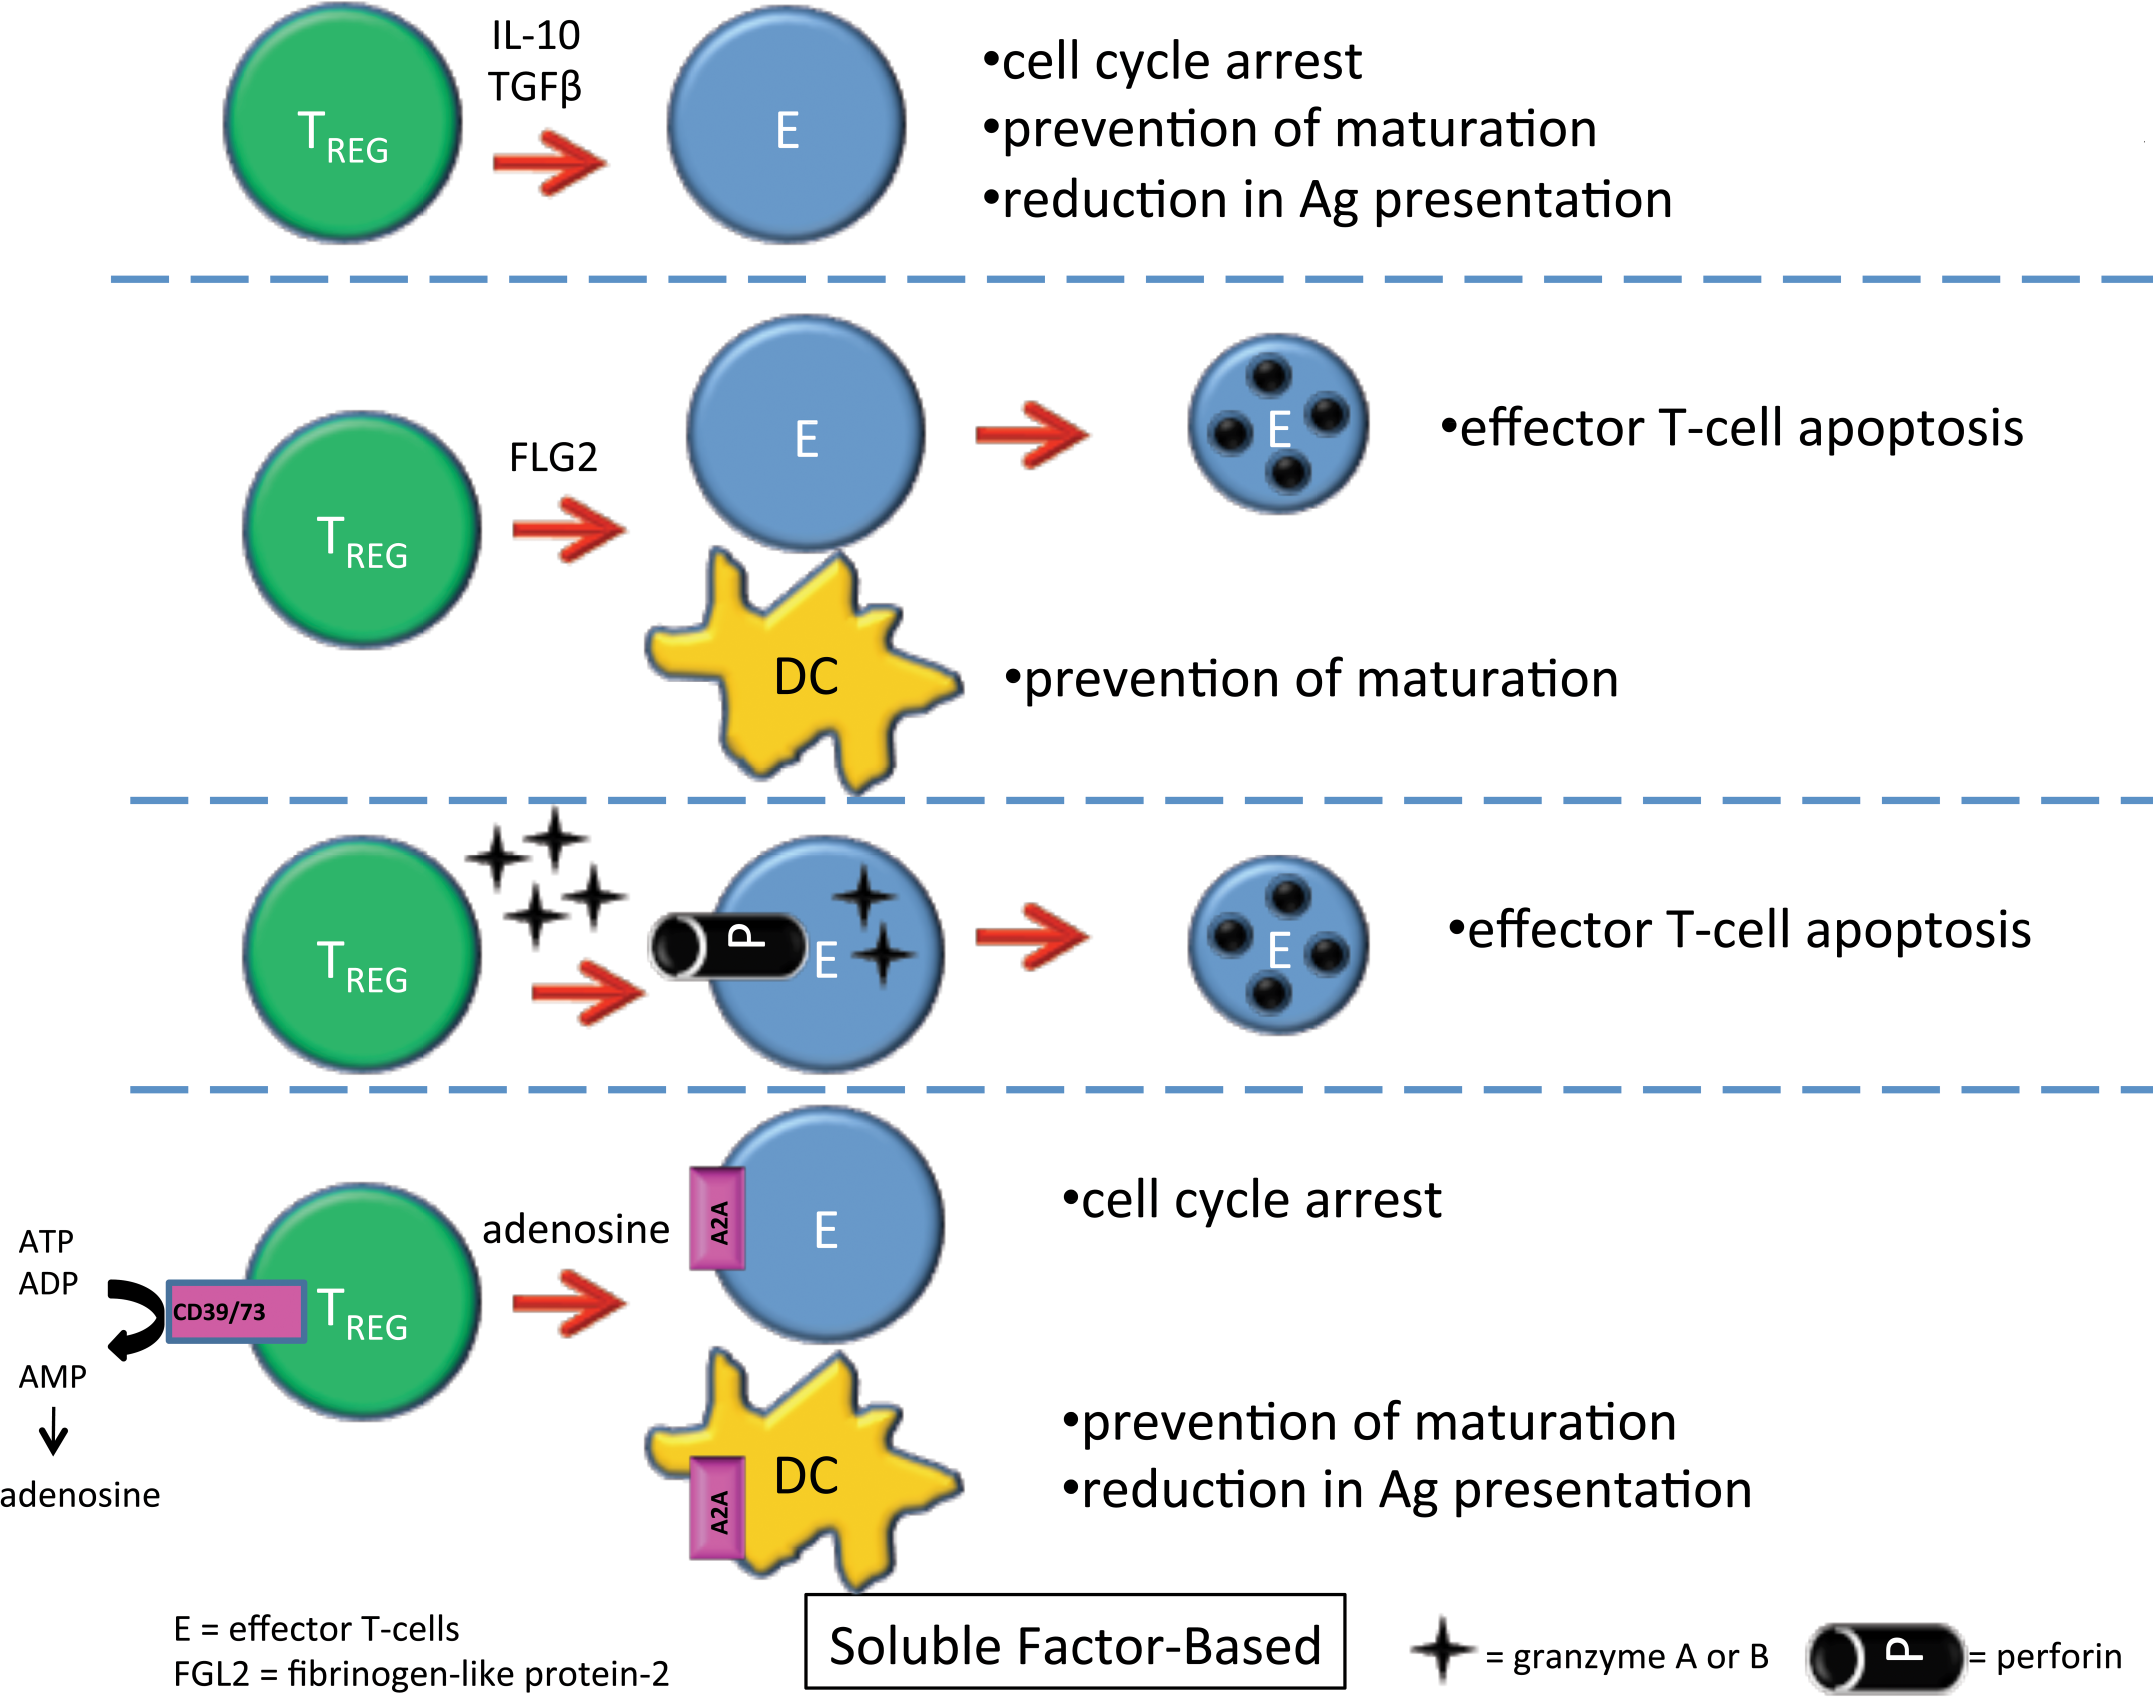
TREG can cause suppression of effector T-cells and dendritic cells through secretion of soluble factors including IL-10, TGF-β, fibrinogen-like protein-2 (FLG-2), granzyme A or B and perforin, and adenosine. The figure shows the signaling pathways and the suppressive effects on effector T-cells and dendritic cells.
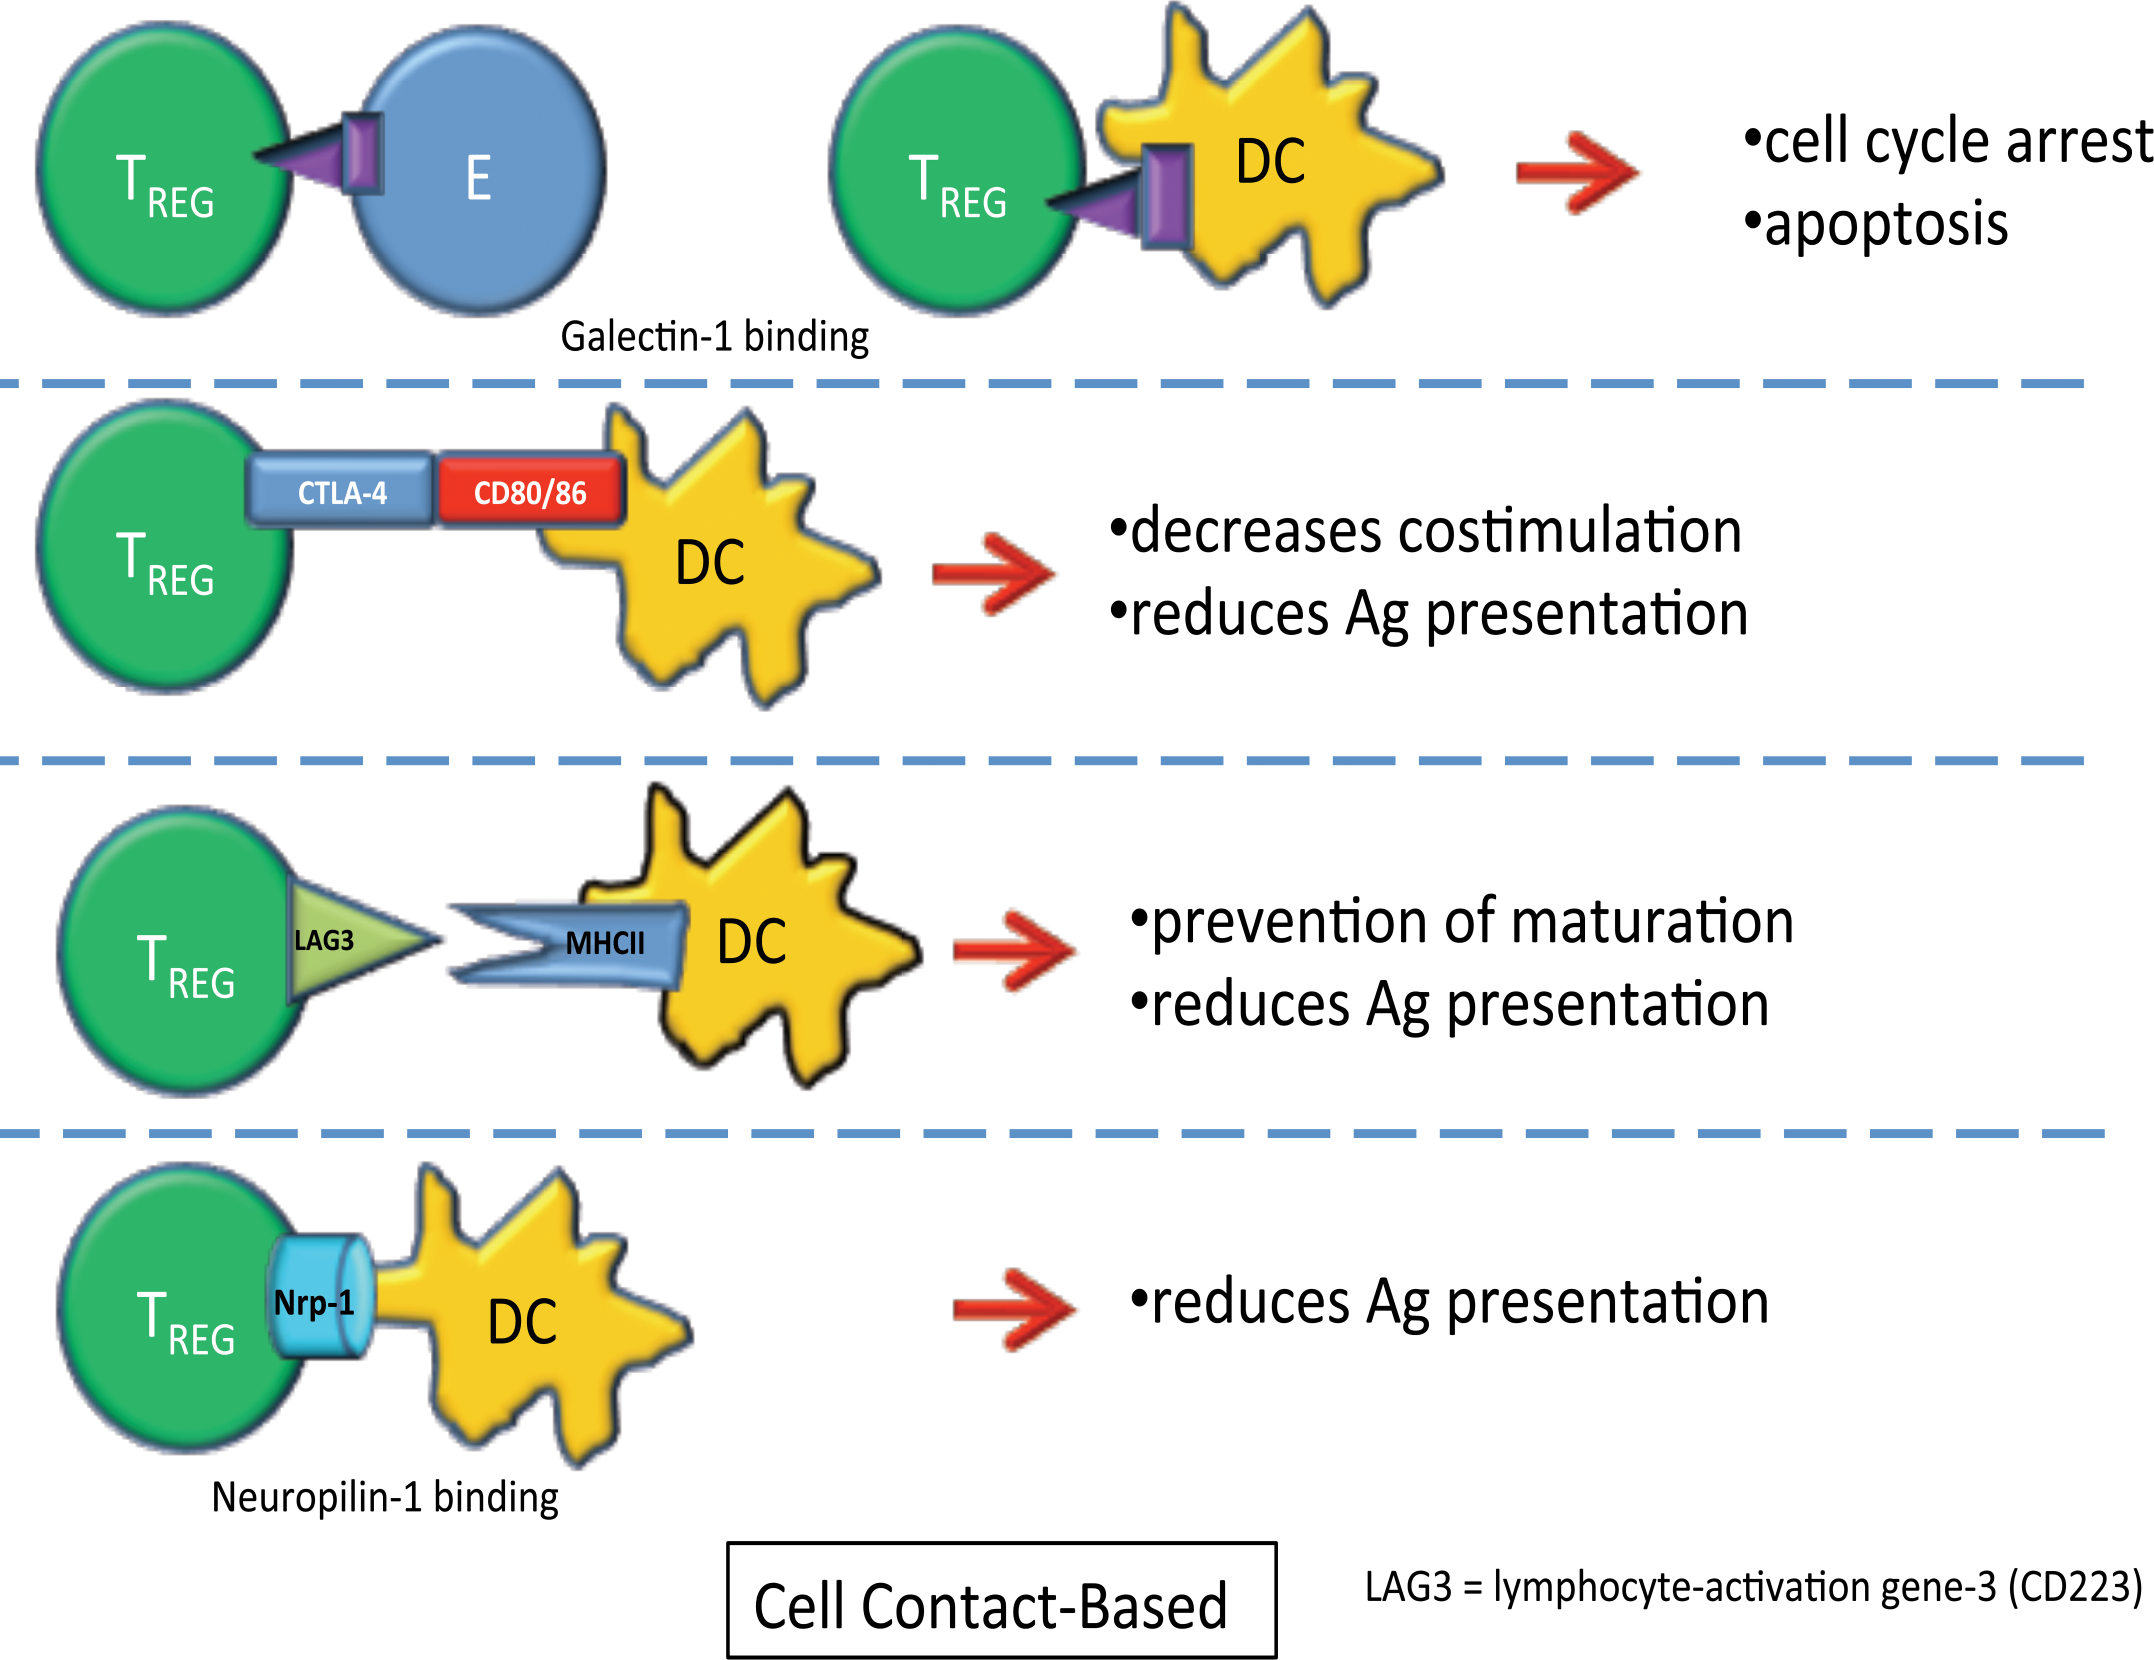
TREG can cause suppression of effector T-cells and dendritic cells through cell contact-based mechanisms, including galectin-1 binding, CTLA-4 binding to CD80/86, lymphocyte activation gene-3 (LAG-3) binding to MHCII molecules, and neuropilin-1 binding. The figure shows the ligands, receptors, and the suppressive effects on effector T-cells and dendritic cells.
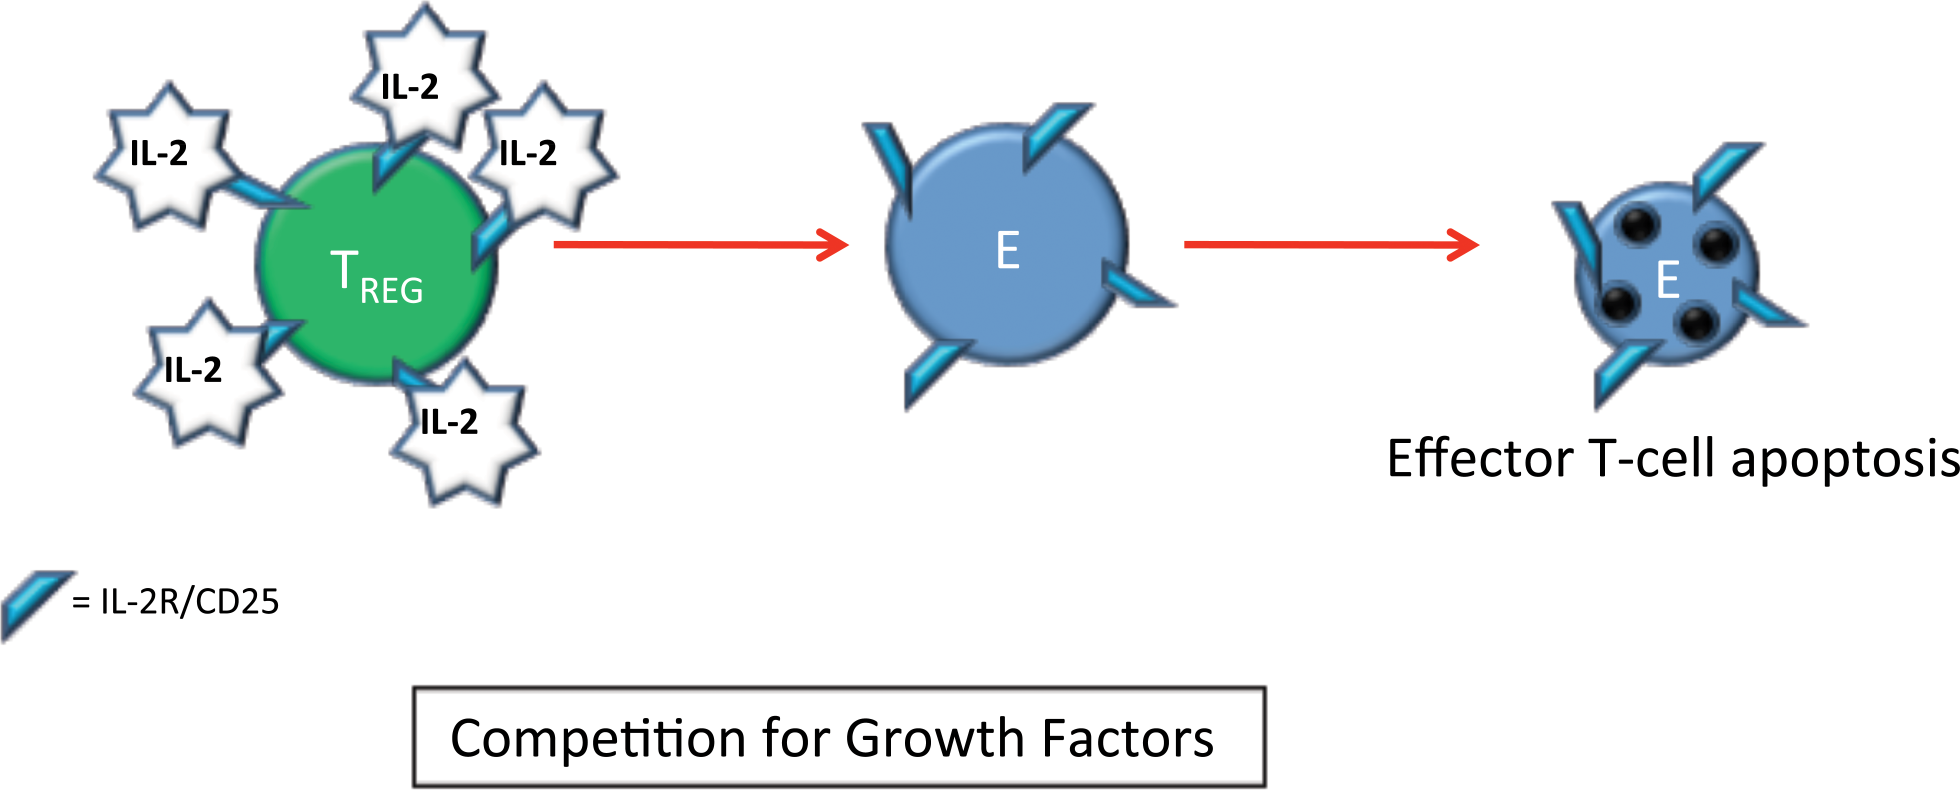
TREG can cause suppression of effector T-cells by providing competition for growth factors (primarily IL-2), which is essential for their survival in the periphery. TREG express multiple copies of IL-2R/CD25, which bind up local IL-2 competing with effector T-cells for IL-2 stimulation. The figure shows the ligands, receptors, and the suppressive effects on effector T-cells.
TREG Markers (Immunohistochemistry, Flow Cytometry, Intravital Microscopy, and miRNA Analysis)
Immunofluorescent and chromogenic IHC and flow cytometry (de Boer et al. 2007; Roncador et al. 2005) for the following markers has been shown to be useful in characterizing TREG in tissue sections and isolated cells: FOXP3 (Figures 6, 7, 8, and 9), CD25 (alpha chain of IL2R) (Figures 7, 8, and 9), and CD62L (L-Selectin) (Figures 6 and 7). Intercellular interactions of TREG cells and effector T-cells have been visualized in rodent models using intravital microscopy (Tang and Krummel 2006). Differences in micro-RNA (miRNA) in human TREG versus effector T-cells have been shown (Hezova et al. 2010). There was a significant increase in miR-146a and decreases in miR-20b, 31, 99a, 100, 125b, 151, 335, and 365 in TREG when compared with effector T-cells. The pattern of increased expression of miR-146a in combination with decreases in the other miRNAs is a possible marker of TREG.
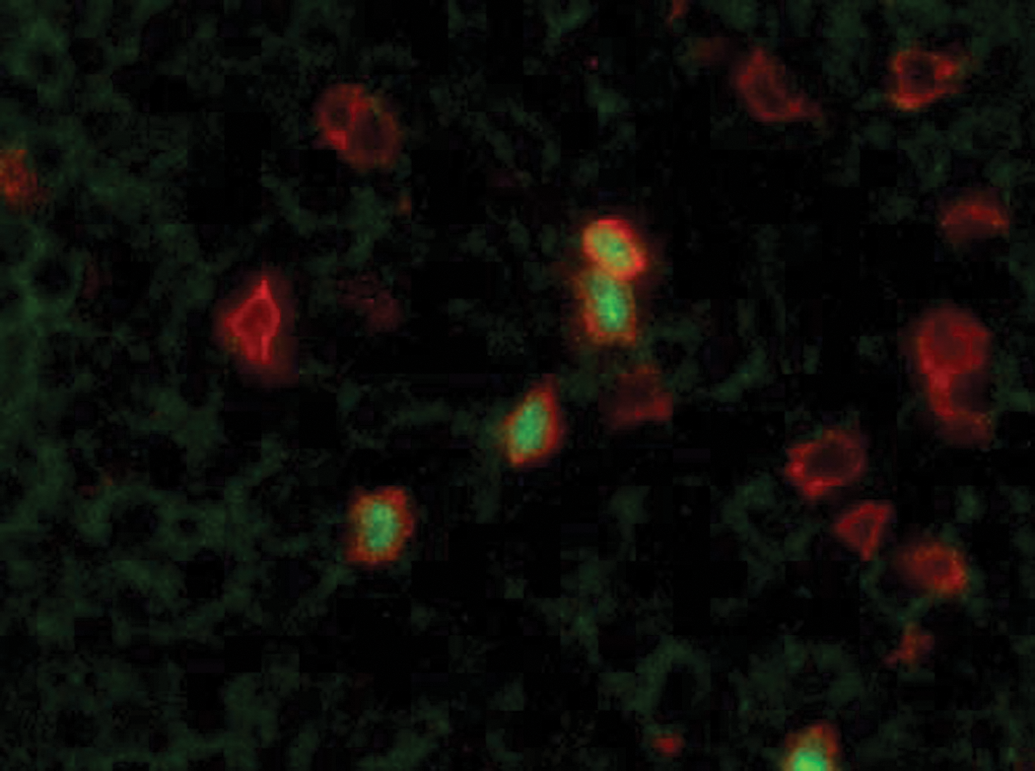
FOXP3 and CD3 dual immunofluorescence on tissue from an area of inflammation. Note the green nuclear labeling (FOXP3+) and the red cytoplasmic labelling (CD3+). The image shows a group of T-cells with several FOXP3+ TREG cells in the field. 400× magnification.
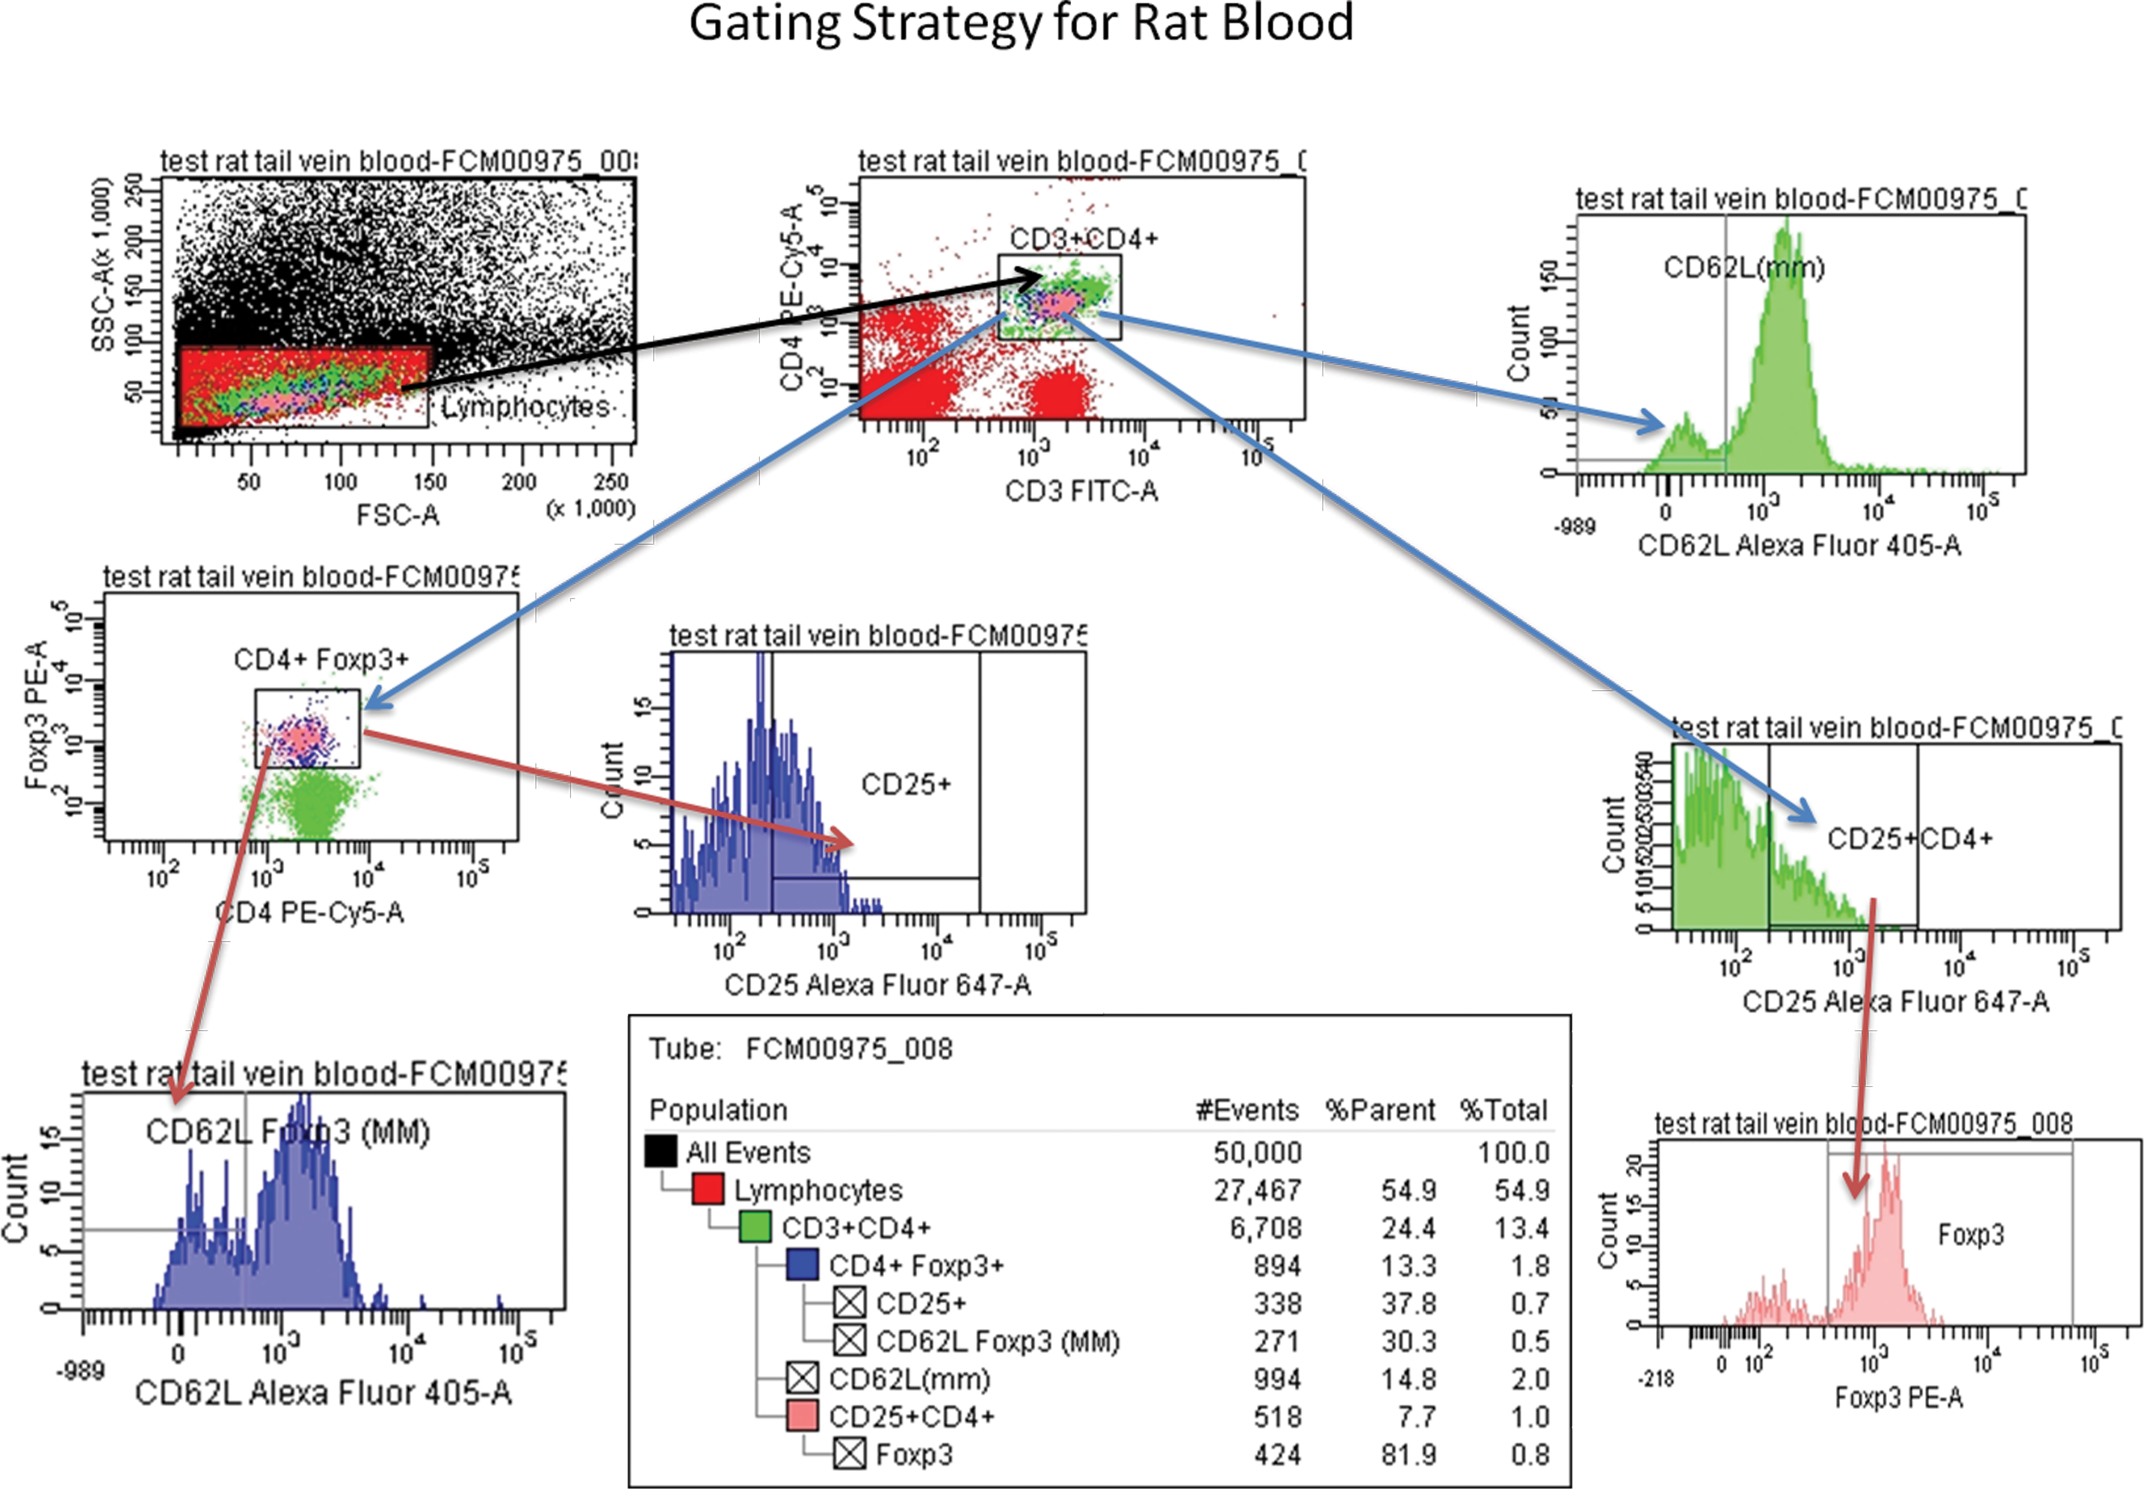
Flow cytometry was performed on blood from male and female CD-IGS rats to evaluate the percentage of CD4+CD25+CD62L+FOXP3+ (nTREG and iTREG) cells. The image highlights the gating strategy and steps used in this evaluation.
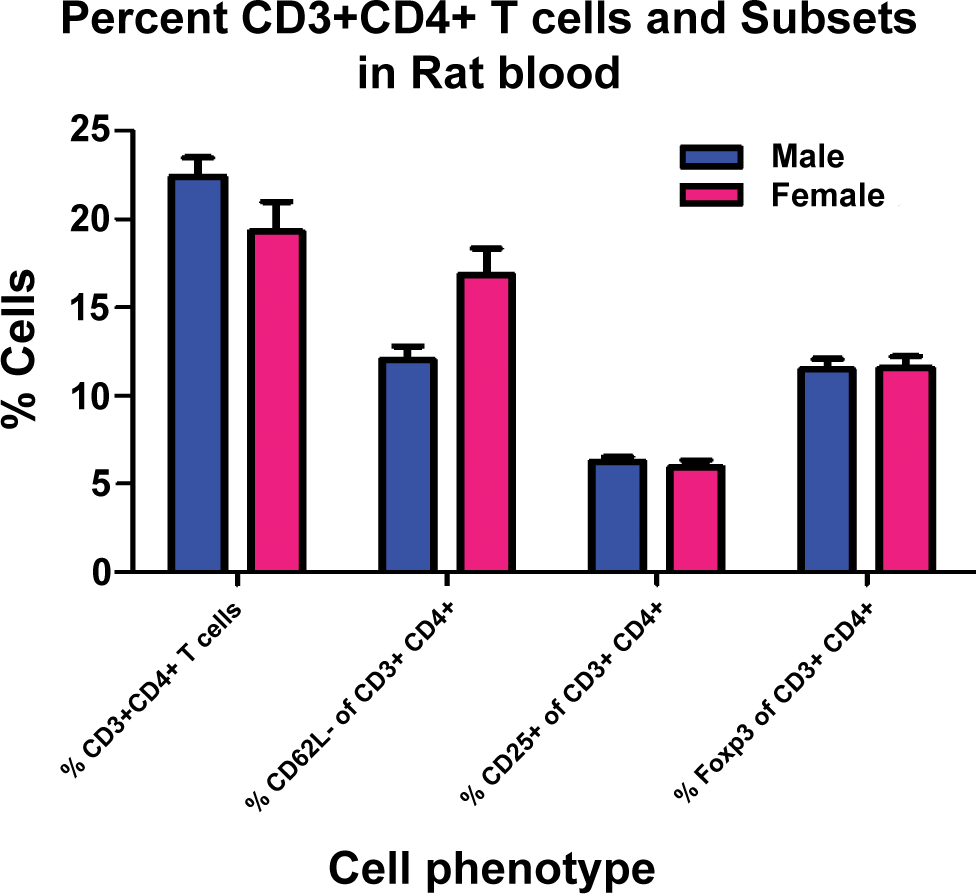
The graphs of flow cytometry data using markers useful in characterizing TREG show the percentage of CD3+CD4+ cells, CD62L+ cells in the CD3+CD4+population, CD25+cells in the CD3+CD4+ population, and FOXP3+ cells in the CD3+CD4+ population cell subsets in male and female rats. There was no definitive difference in cell percentages between males and females in this evaluation.
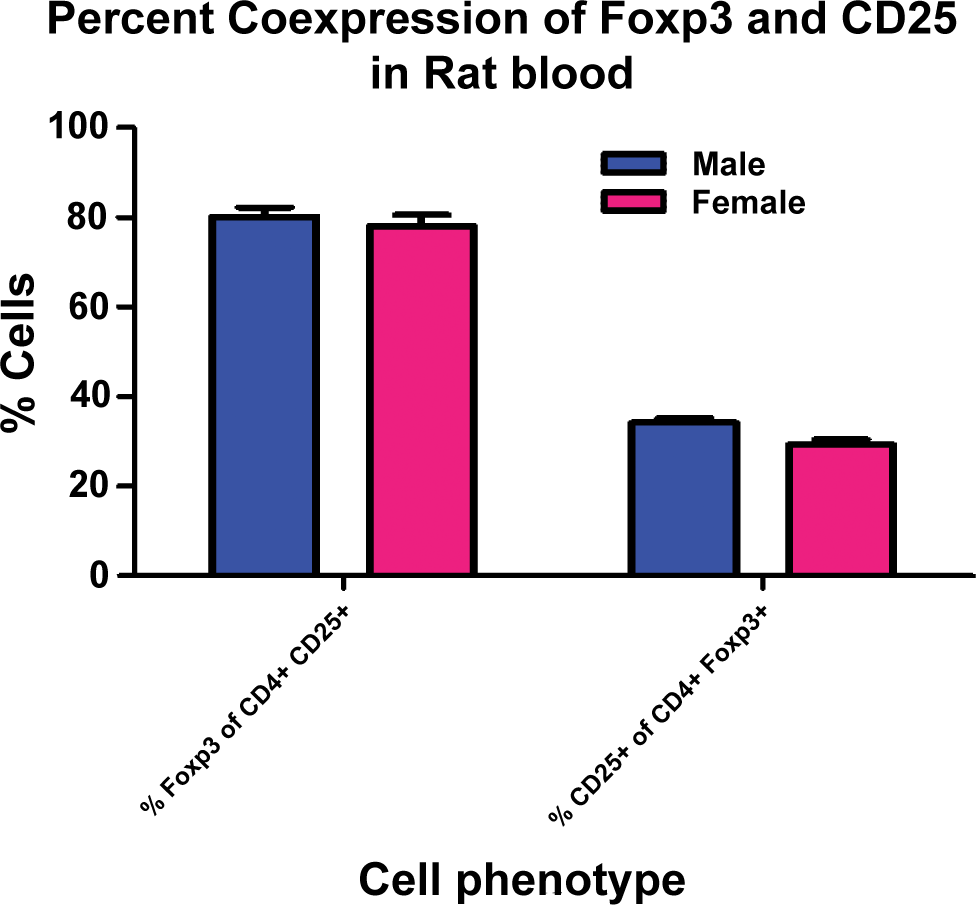
The graphs of flow cytometry data show the percentages of FOXP3+ cells in the CD4+CD25+ population and CD25+ cells in the CD4+FOXP3+ population. The majority (approximately 80%) of CD4+CD25+ cells are also FOXP3+, which would include nTREG and TH3 cells. Only a minority (approximately 30%) of CD4+FOXP3+ cells are also CD25+, which means approximately 70% of the CD4+FOXP3+ population likely represents an iTREG cell population.
FOXP3: Function and Biology
FOXP3, a forkhead box transcription factor, is a molecular marker and cell lineage specification factor for TREG (Fontenot et al. 2003; Hori et al. 2003). FOXP3 is critical for the thymic differentiation of αβ TCR+ thymocytes into nTREG (Sakaguchi et al. 2008; Fontenot et al. 2003; Hori et al. 2003). The FOXP3 gene product is referred to as scurfin and functions by regulating a set of genes required for (1) the suppressor activity of TREG, proliferative, and metabolic fitness of TREG and (2) repressing alternative T cell differentiation pathways (Brunkow et al. 2001). It has been shown that a higher level of expression of FOXP3 is sufficient for suppressive activity of non-TREG T-cells in rodents (Sakaguchi et al. 2008; Lourenco and La Cava 2011). Several pathways are important in the induction of FOXP3 expression including TGF-β, IL-2, retinoic acid, 17-β-estradiol, and signaling through the sphingosine-1-phosphate receptor 1 (S1PR1) (Figure 10). TGF-β is essential for induction of FOXP3 expression in naïve T-cells (i.e., iTREG including TH3 cells), but in the human it does not necessarily confer regulatory function (Lourenco and La Cava 2011).
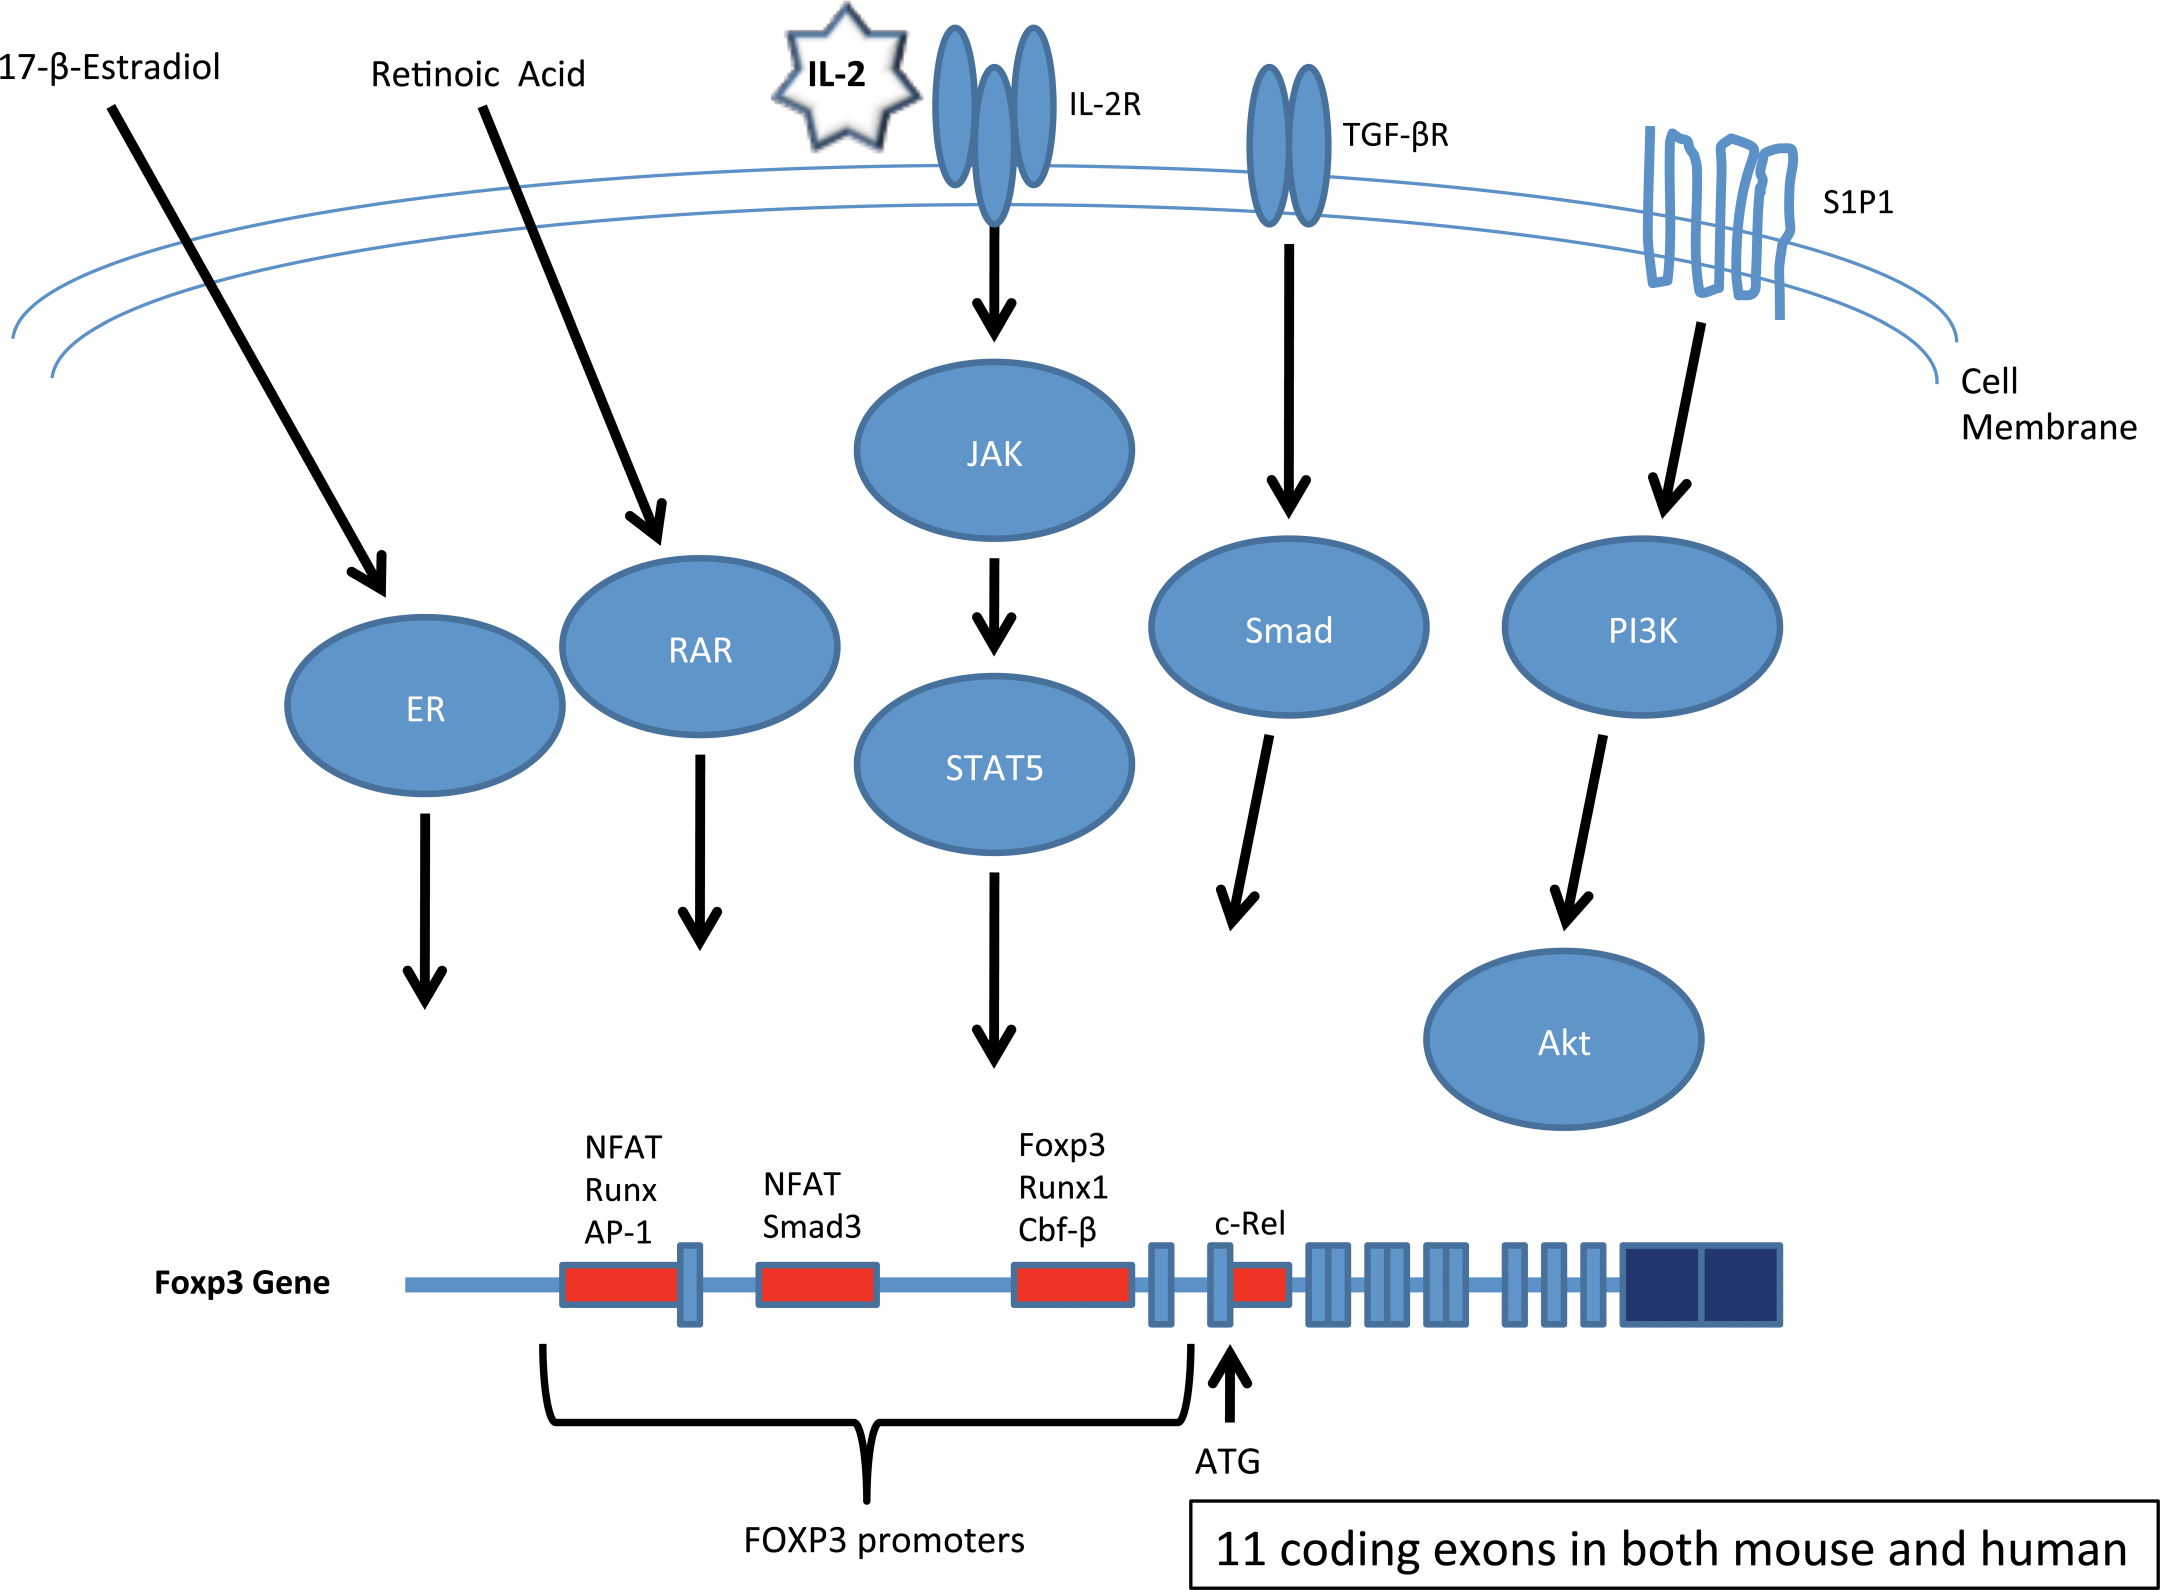
The figure highlights several pathways of induction of FOXP3 expression including the ligands, receptors, and/or intermediary steps in induction of gene expression. A schematic of the FOXP3 gene shows the promoters and important transcription factors that bind to the promoters. There are 11 coding exons in both the mouse and human FOXP3 genes.
FOXP3 Deficiency
The “Scurfy” Mouse
In mice (B.Cg-Foxp3sf ), a frameshift mutation in the FOXP3 gene results in a truncated protein lacking the forkhead domain and is responsible for the “Scurfy” phenotype (Clark et al. 1999; Ochs et al. 2002; Patel 2001). Scurfy is an X-linked recessive mutation in the mouse that is lethal in hemizygous males 16 to 25 days after birth (Ochs et al. 2002; Godfrey et al. 1991). Scurfy mice have an overproliferation of CD4+ T-lymphocytes and other cell types due to uncontrolled cytokine secretion with extensive multiorgan infiltration due to lack of functional TREG (Ochs et al. 2002; Godfrey et al. 1991). Lymphadenopathy, parenchymal organ infiltration, and subcutaneous inflammatory cell infiltrates (e.g., ear pinnae) are prominent (Figures 11 and 12) (Godfrey et al. 1991). The phenotype of Scurfy mice is similar to mouse models that lack CTLA-4 or TGF-β, and in humans with immunodysregulation, polyendocrinopathy and enteropathy, X-linked syndrome (IPEX) (Clark et al. 1999; Ochs et al. 2002; Patel 2001).
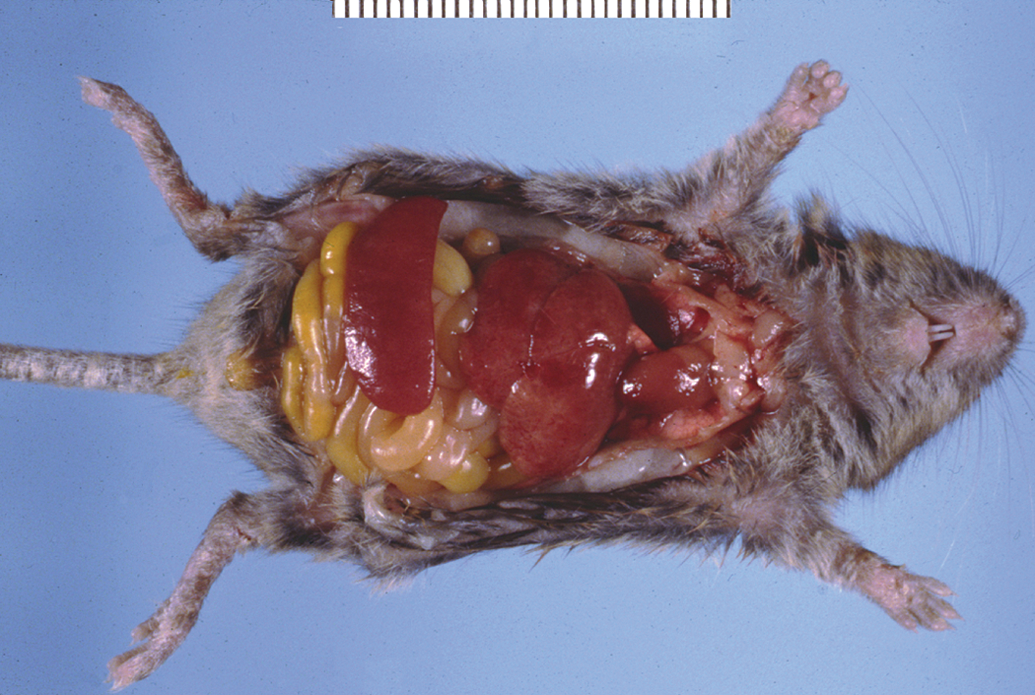
The “Scurfy” mouse has a frameshift mutation in the forkhead box transcription factor, FOXP3. This results in early lethality due to unregulated inflammation (parenchymal organs, subcutis, and lymphoid organs are the main sites of inflammatory cell accumulation) due to the lack of functional TREG cells. Note the gross pathology image of a Scurfy mouse with marked hepato- and splenomegaly and evidence of subcutaneous lesions at the tail base.
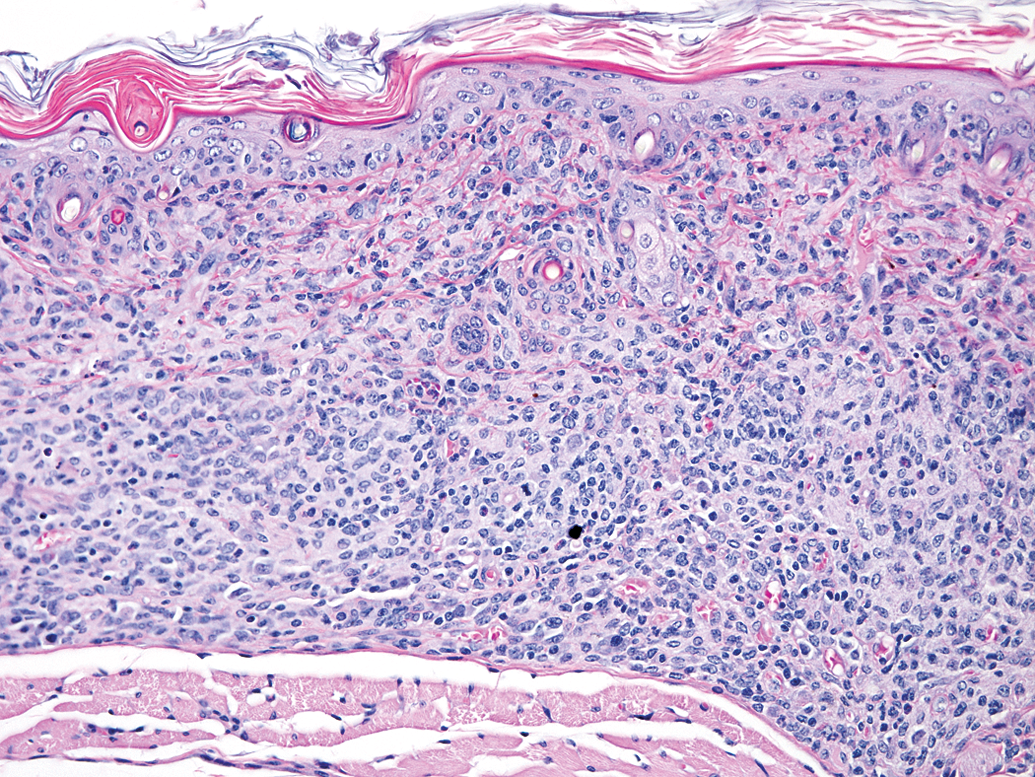
Note the prominent mononuclear inflammatory cell accumulation in the dermis and upper subcutis from a “Scurfy” mouse. Hematoxylin and eosin, 200× magnification.
IPEX in Humans
IPEX is a rare human multisystemic autoimmune disease (X-linked: females are carriers, males have the disease) that is linked to the dysfunction of the transcriptional activator FOXP3 which results in dysfunction of regulatory T-cells with subsequent autoimmunity (Ochs et al. 2002). Mutations in the forkhead domain of FOXP3 disrupt FOXP3 protein: DNA interactions (Ochs et al. 2002; Patel 2001). The disorder manifests with enteropathy, food allergy, massive lymphoproliferation, psoriasiform or eczematous dermatitis, nail dystrophy, autoimmune endocrinopathies (primarily insulin-dependent diabetes mellitus and autoimmune thyroid disease), Coombs-positive anemia, autoimmune thrombocytopenia, autoimmune neutropenia, tubular nephropathy, and autoimmune skin conditions such as alopecia universalis and bullous pemphigoid (Ochs et al. 2002). Treatment for IPEX includes immunosuppressive agents (e.g., cyclosporin A, FK506) alone or in combination with steroids (Ochs et al. 2002). There has been limited success in treating the syndrome with bone marrow transplantation (Ochs et al. 2002).
TH17 cells and TREG: A Reciprocal Balance
TH17 cells are a subpopulation of effector T cells that are very pro-inflammatory and implicated in allergic/autoimmune disease (Abraham and Cho 2009; Crome et al. 2009; Korn et al. 2009 and 2007; Nistala and Wedderburn 2009; Romagnani et al. 2009). TH17 cells secrete IL-17, IL-22, IL-21 and IL-17F (Korn et al. 2009, 2007; Veldhoen et al. 2006; Bettelli et al. 2006; Mangan et al. 2006). TGF-β is critical in induced/adaptive TREG cell (i.e., TH3 TREG) differentiation as well as development of TH17 effector cells (Wan and Flavell 2007) (Figure 13). Naïve T-cells develop into a “transitional” cell-type that expresses FOXP3 (TH3 TREG cell marker) and ROR-γt and RORα (TH17 effector cell markers) in the presence of TGF-β (Figure 14) (Nistala et al. 2009; Korn et al. 2007; Veldhoen et al. 2006; Bettelli et al. 2006; Mangan et al. 2006). Further exposure to TGF-β or IL-6/IL-21 in the inflammatory milieu leads to TH3 cell differentiation or TH17 effector cell differentiation (Zhou et al. 2008; Korn et al. 2007; Veldhoen et al. 2006; Bettelli et al. 2006; Mangan et al. 2006). Therefore, a reciprocal balance between TH17 cells and TH3 TREG cells exists (Bettelli et al. 2006) where IL-6 and IL-21 inhibit TH3 cell differentiation to the benefit of TH17 cells (Korn et al. 2009, 2007) and TGF-β elicits TH3 cell differentiation to the disadvantage of TH17 cells (Zhou et al. 2008).
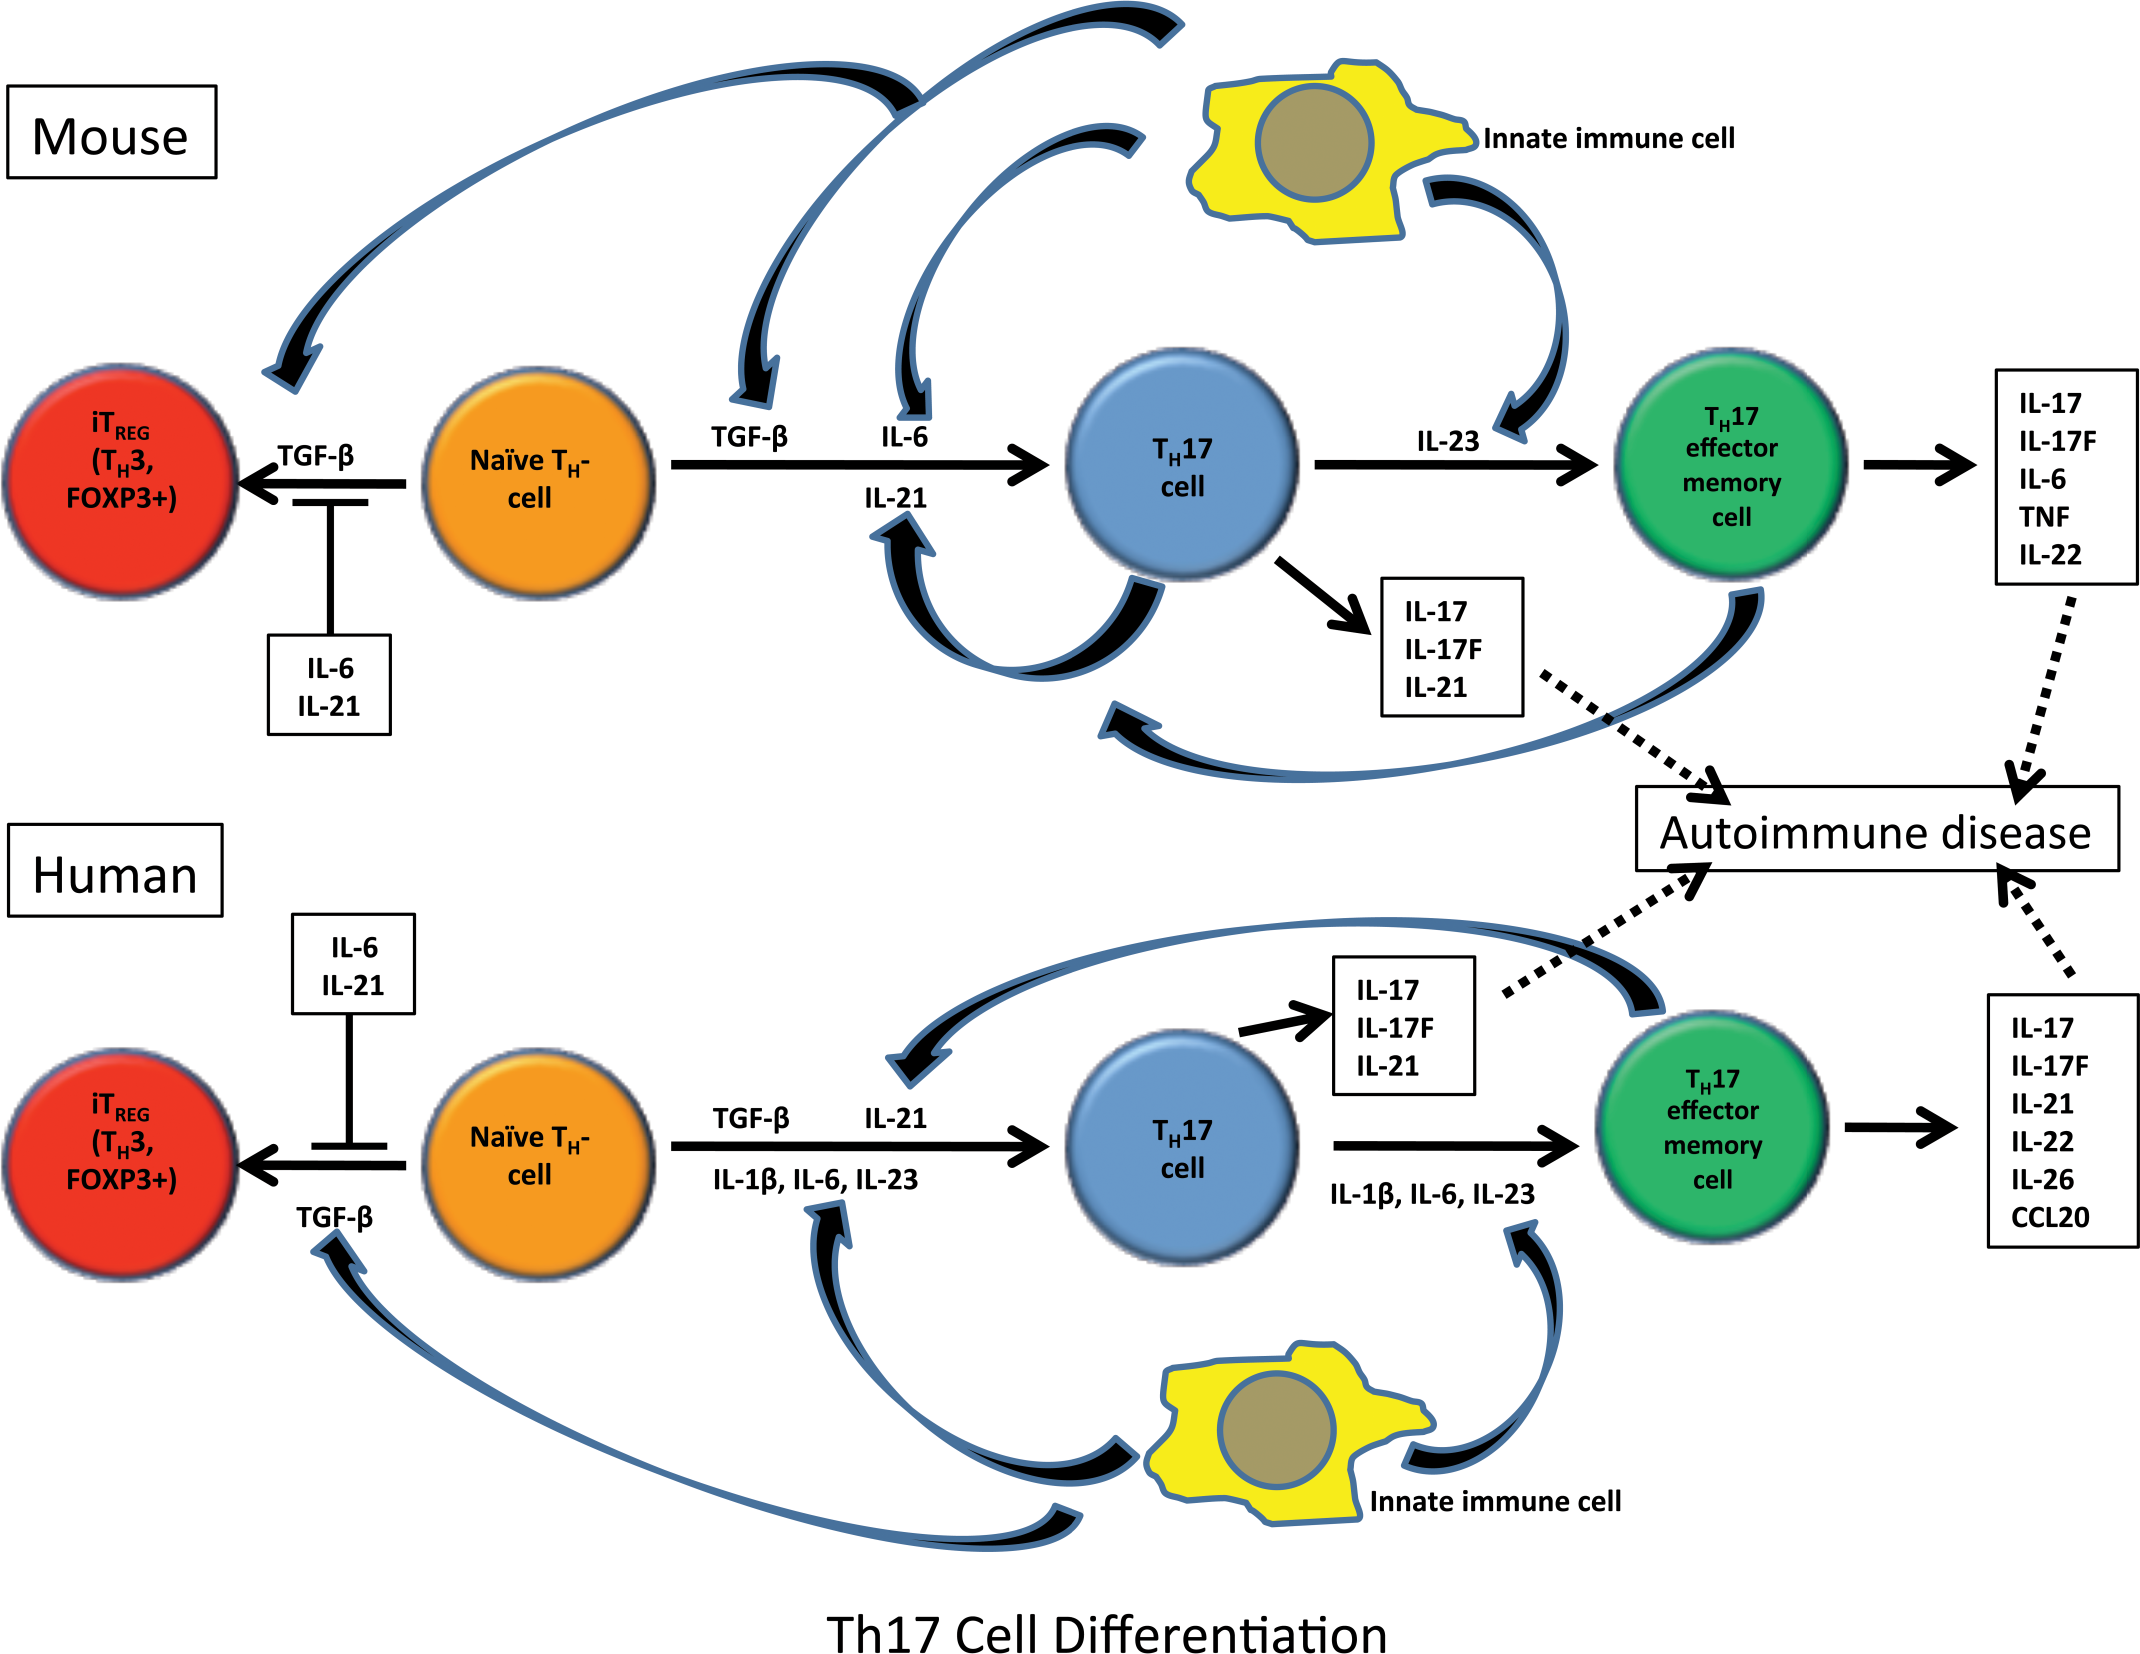
There is a reciprocal relationship between TH17 (proinflammatory effector T-cell subset that are associated with autoimmune disease) and TH3 cells (iTREG that are CD4+CD25+FOXP3+), which is elicited during differentiation of naïve TH0 cells, but final differentiation depends on the cytokine milieu. TGF-β is critical in differentiation of both cell types but depends on the cytokine milieu. The schematic shows the cytokine pathways in the differentiation of TH17 and TH3 cells from TH0 effector cells.
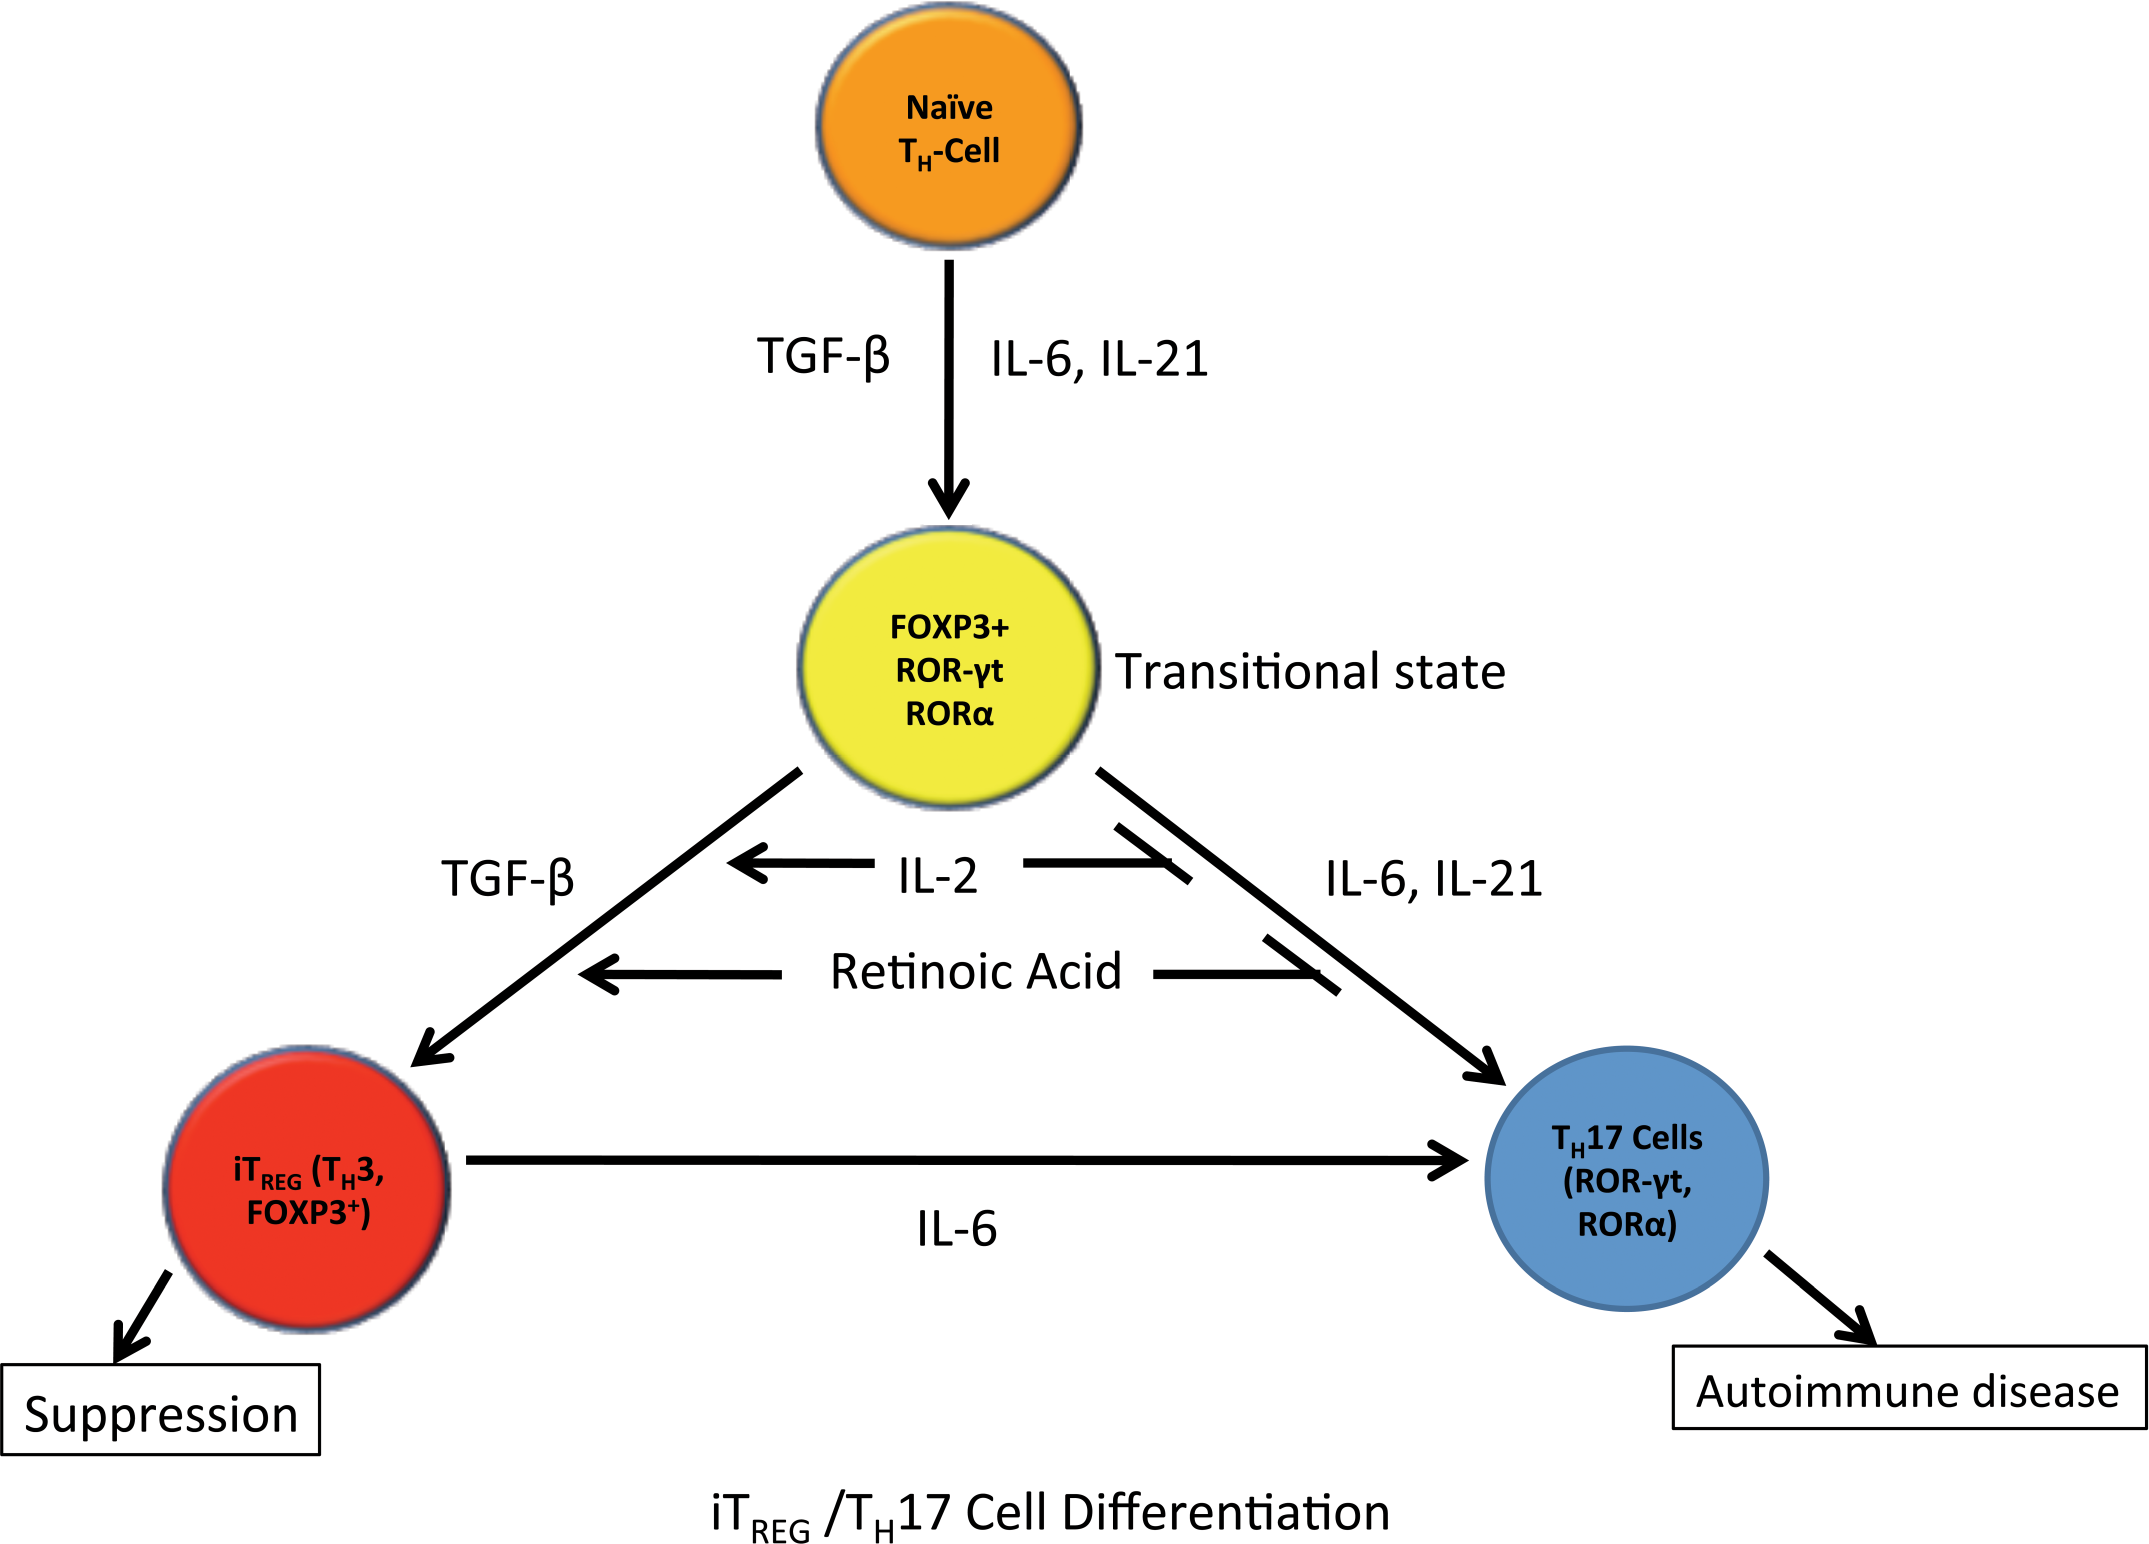
This schematic focuses on the differentiation pathways of TH0 to TH17 and TH3 cells showing a transitional state (FOXP3+, ROR-γt+ and RORα+ cell) where addition of certain cytokines/factors drives differentiation to TH3 cells (FOXP3+) leading to suppression or TH17 cells (ROR-γt+ and RORα+) resulting in inflammation/autoimmune disease.
Role of TREG in Mucosal Sites
Oral tolerance is an important mechanism in the mucosal immune system whereby oral administration of a specific antigen induces unresponsiveness of systemic immune responses with the same or different antigens (Chen et al. 2007; Weiner et al. 1994). TGF-β is critical for the induction of oral tolerance (Chen et al. 2007; Weiner et al. 1994). Low-dose of antigen cells leads to “dampening,” a paracrine effect, of the immune response due to TGF-β derived from nTREG, TH3, and Tr1 cells. High-dose of an antigen is associated with mucosal T-cell anergy and apoptosis (Chen et al. 2007; Weiner 1997; Weiner et al. 1994). At mucosal sites, TREG are responsible for “bystander” suppression, where TGF-β produced at mucosal sites during development of oral tolerance regulates immune responses on T-cells, B-cells, NK cells, macrophages, and dendritic cells in an antigen nonspecific manner (Weiner 1997). Animal models of inflammatory bowel disease (IBD) have been used to study TREG and mucosal tolerance (Blumberg 2009). Researchers have adoptively transferred CD4+CD45RBhigh T-cells into SCID or Rag-1 mice (Powrie et al. 1994) or have relied on the 2, 4,6-trinitrobenzene sulfonic acid (TNBS)-induced colitis rodent model (Te Velde et al. 2006). A negative effect of TREG in mucosal immunity is the secretion of TGF-β from TREG in the face of IL-6 and IL-21 in the inflammatory milieu. TGF-β can lead to differentiation of TH17 cells and subsequent inhibition of TREG differentiation, resulting in more severe inflammation (Korn et al. 2009, 2007). TREG have a critical role in tolerance and “bystander” suppression of mucosal sites with resident γδ T-cells.
Role of TREG in Inflammatory/Infectious Disease
Both natural and induced TREG are important in suppressing inflammation in infectious disease (Figure 15; Abraham and Medhitzov 2011; Liu et al. 2010; Jager and Kuchroo 2010; Scholzen et al. 2009; de Boer et al. 2007; Belkaid and Rouse 2005). nTREG are activated by microbial infections and products of the resulting inflammatory milieu. TREG express toll-like receptors 4, 5, 7, and 8, allowing the cells to respond to bacterial products such as lipopolysaccharide leading to increased TREG survival and proliferation (Caramahlo et al. 2003). Probiotics have been shown to elicit activation of TREG, which then suppress TH1-mediated colitis in the TNBS mouse colitis model (Di Giacinto et al. 2005). Microbes are also able to manipulate antigen-presenting cells leading to priming/activation of TREG and elicit secretion of chemokines and cytokines that favor induction, priming, recruitment, and survival of TREG, thus using TREG for their own benefit (Cabrera et al. 2004; Hesse et al. 2004; Caramahlo et al. 2003; Belkaid et al. 2002). These microbial organisms include virus (HIV [Aandahl et al. 2004], HCV [Cabrera et al. 2004], CMV [Aandahl et al. 2004], FIV [Vahlenkamp et al. 2004], Herpes simplex virus [Suvas et al. 2004]), bacteria (Helicobacter spp. [Lundgren et al. 2003; Kullberg et al. 2002] and Listeria monocytogenes [Kursar et al. 2002]), fungi (Candida albicans [Montagnoli et al. 2002] and Pneumocystis carinii [Hori et al. 2002]), and protozoal (Leishmania major [Belkaid et al. 2002], Schistosoma mansoni [Hesse et al. 2004] and Plasmodium spp. [Scholzen et al. 2009]). TREG can become infected with viral pathogens (e.g., HIV and FIV), and it is uncertain if they remain suppressive when infected (Joshi et al. 2004; Oswald-Richter et al. 2004). Animal infection models and infected humans show accumulation of TREG at the site of infection with leishmaniasis, herpes simplex virus, and schistosomiasis (Hesse et al. 2004; Suvas et al. 2004; Belkaid et al. 2002), in the peripheral blood with HIV and HCV (Oswald-Richter et al. 2004) and in lymphoid organs of HIV patients (Andersson et al. 2005). A good example of the role of TREG in infection would be Plasmodium spp. that causes malaria in human patients and rodent models and is associated with increased numbers of TREG (i.e., natural and induced), which have a direct association with the parasitic load in the host. TREG accumulate in areas of inflammation induced by the organisms and inhibit TH1 responses (i.e., both protective and pathologic) primarily by the suppressive effects of IL-10 and TGF-β, and ultimately result in either clearance of the organism and resolution or clinical cases of malaria depending on the level of TREG cell induction and the organism’s manipulation of this lymphocyte population (Scholzen et al. 2009). TREG has also been shown to be a factor in the development of silica-induced pulmonary fibrosis in a mouse model. Depletion of TREG leads to the maintenance of a TH1 response and subsequent attenuation of fibrosis versus the shift to a TH2 response that normally predisposes to development of fibrosis in this model (Liu et al. 2010). The balance between effector T-cells and TREG is critical in determining the immune response to pathogens (Figure 16).
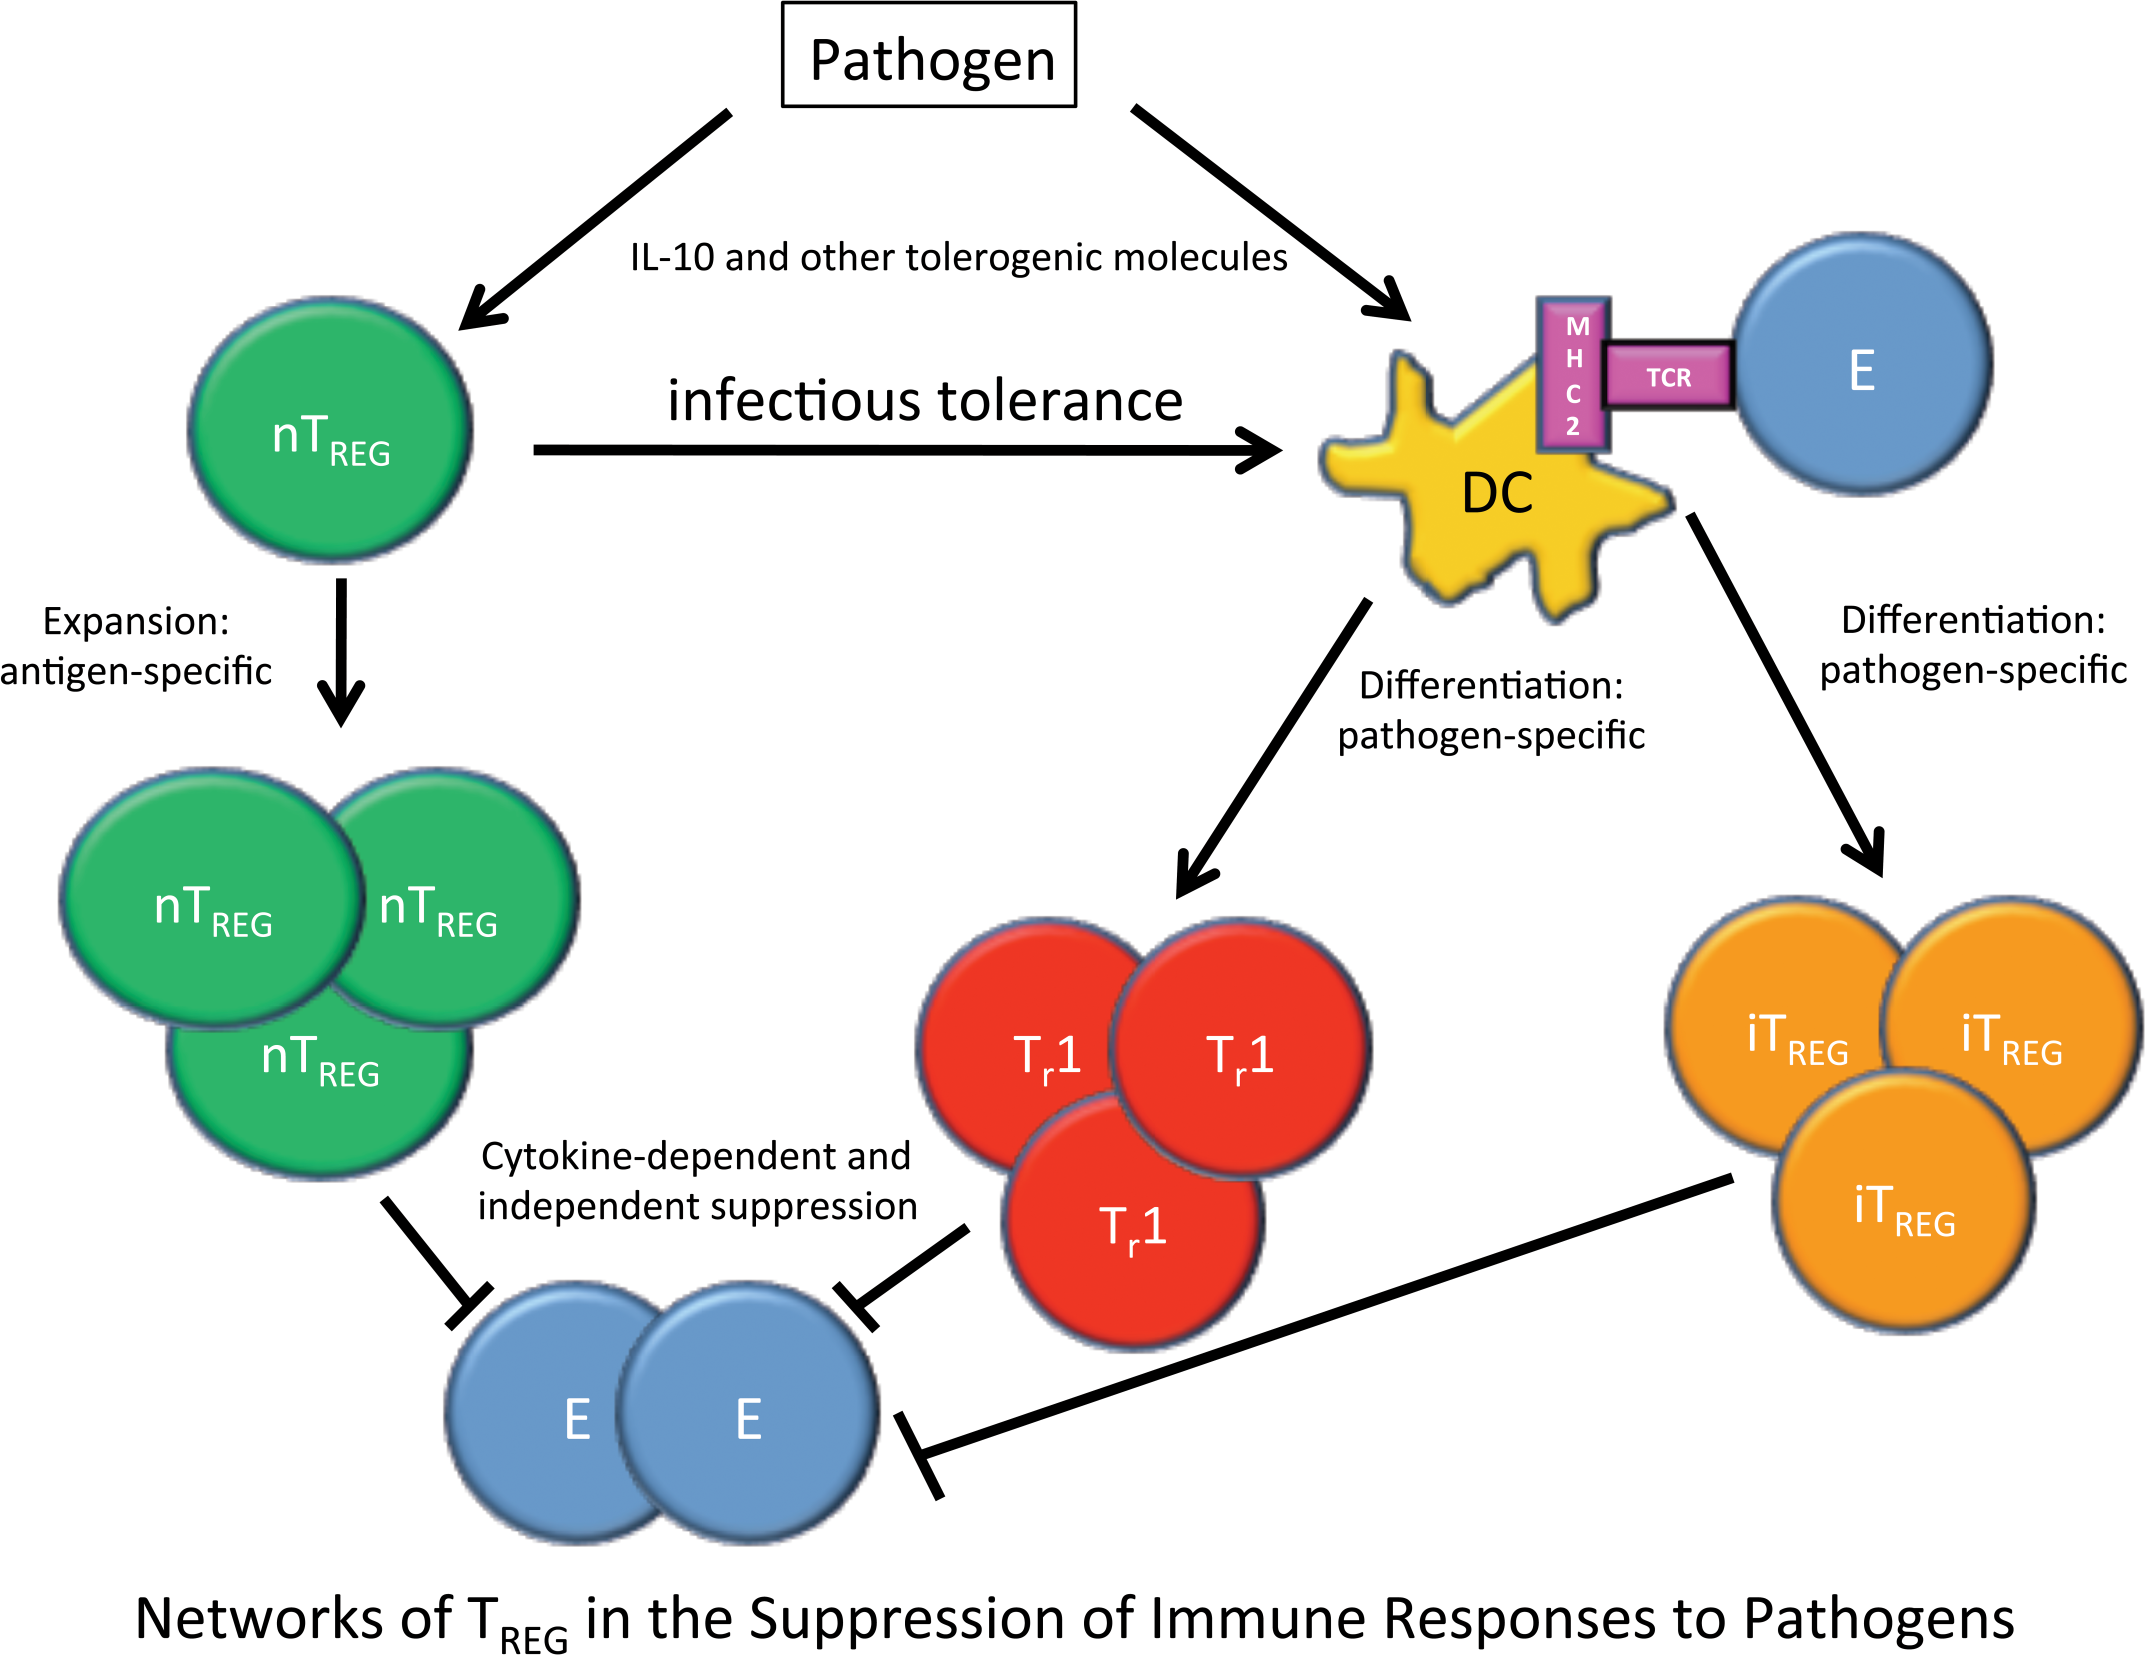
During an infection with a pathogenic organism complex networks develop where nTREG undergo antigen-specific expansion and Tr1 and iTREG cells undergo pathogen-specific differentiation in the presence of tolerogenic cytokines (IL-10 and TGF-β). All three types of TREG cells then work to suppress effector T-cells in the inflammatory milieu by soluble factors, cell-to-cell contact, or competing for IL-2. nTREG can also induce infectious tolerance in dendritic cells. Together these result in suppression of immune responses to pathogens. Pathogens can also use TREG for their own benefit to evade the immune response.
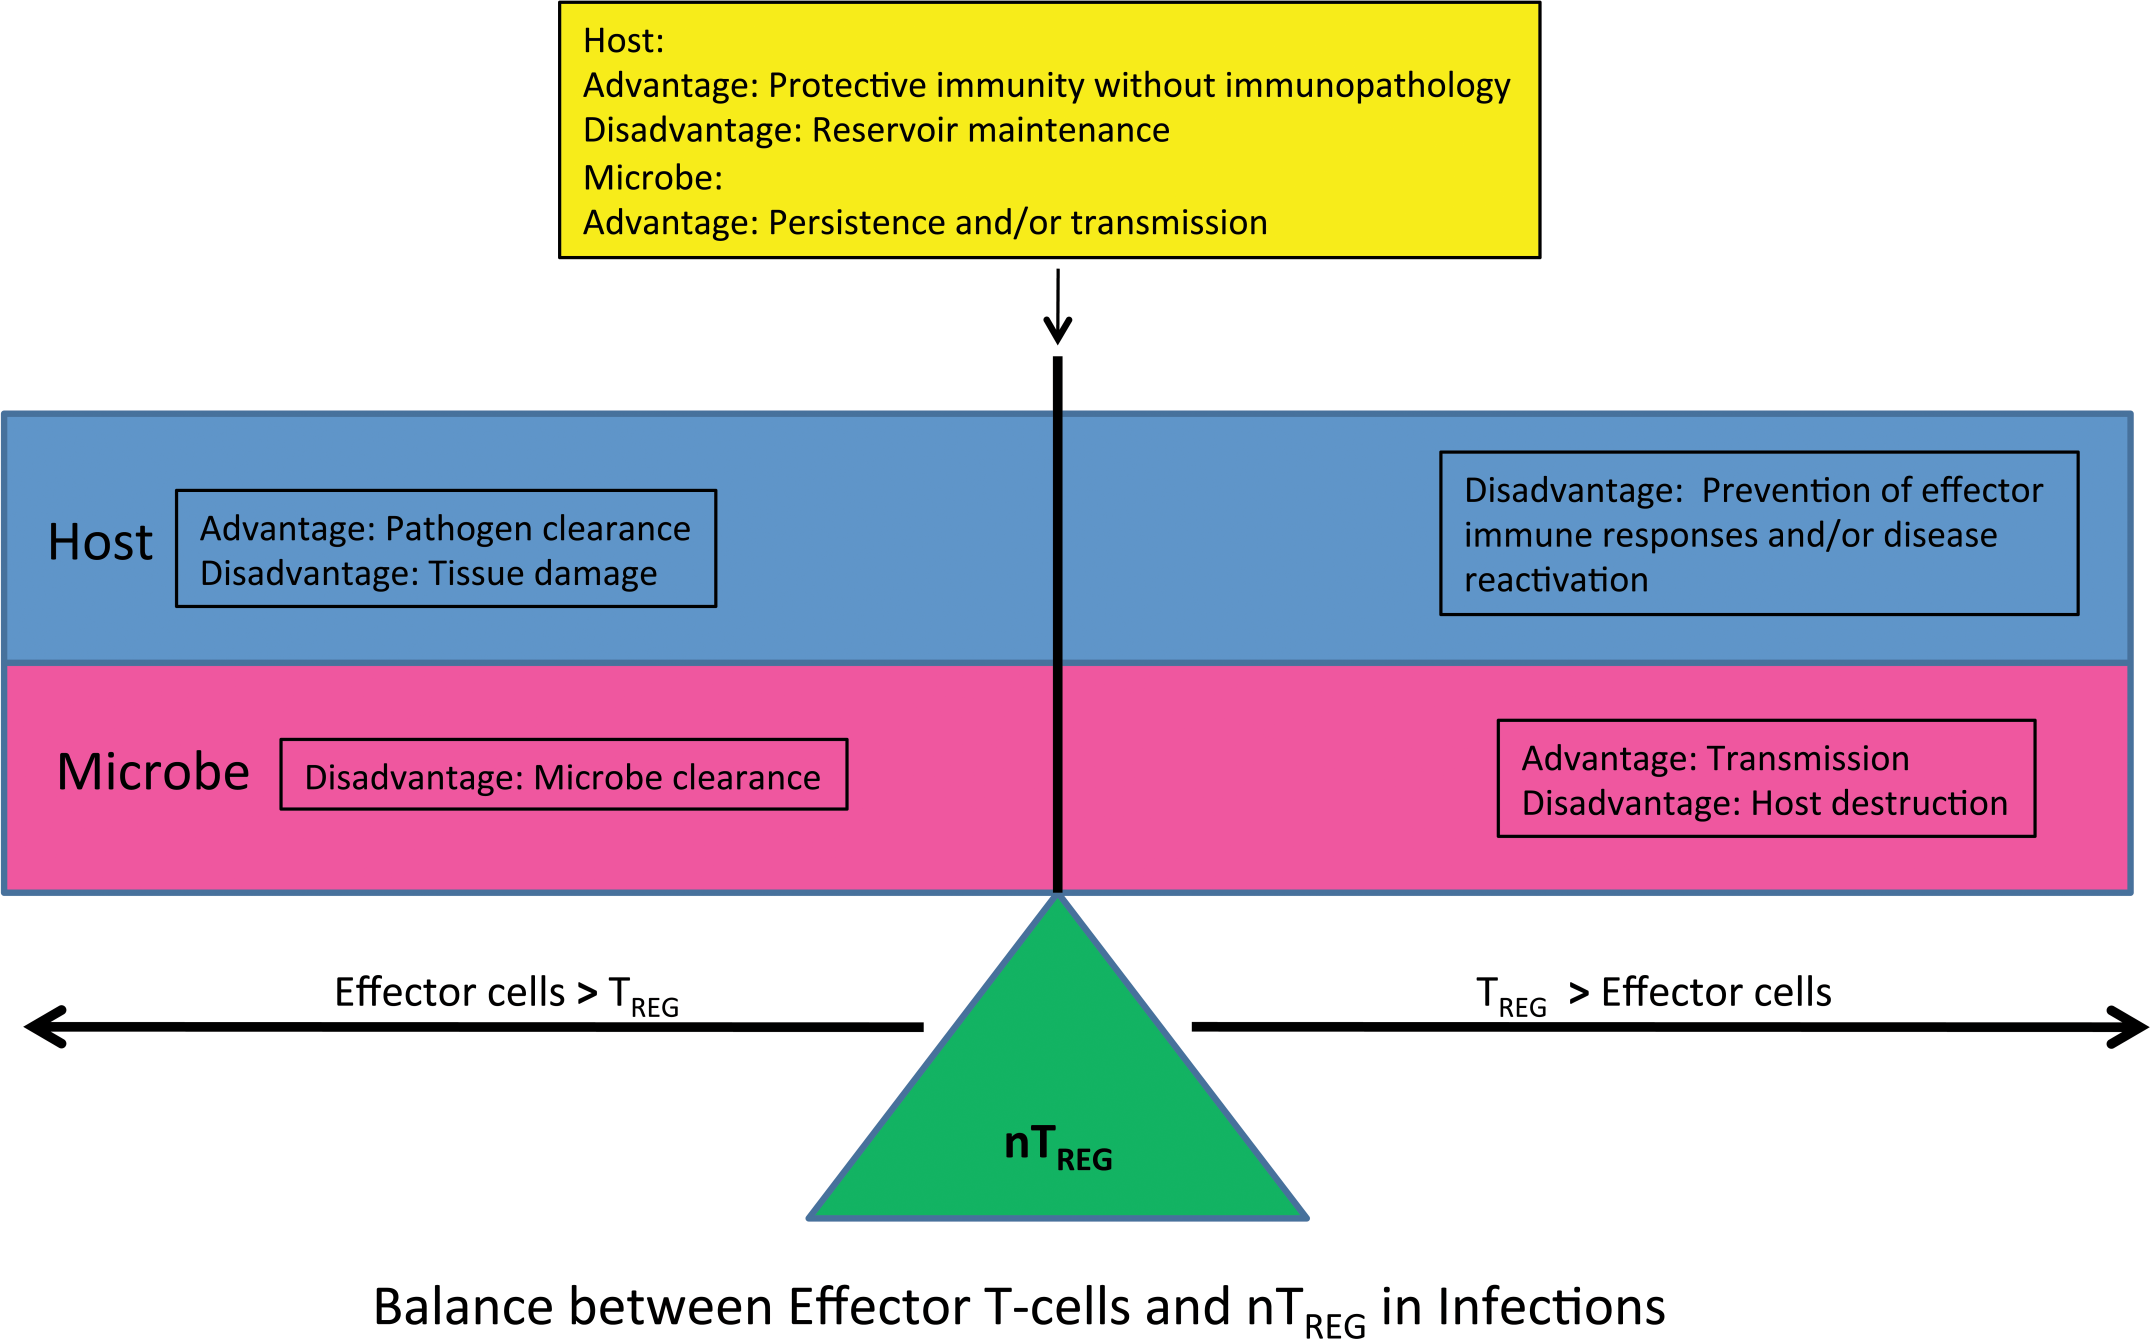
The balance between effector cells and TREG cells in the inflammatory milieu dictate the course of and ultimate resolution or persistence of the inflammatory response to an infectious agent. There are advantages and disadvantages for both the host and microbe if there is an imbalance in the numbers/function of effector cells and TREG.
Role of TREG in Organ Transplantation
TREG have been shown to have a pivotal role in transplant tolerance leading to graft acceptance and prevention of rejection in xenotransplantation (Muller et al. 2009; Zhang et al. 2009; Le and Chao 2007; Yong et al. 2007). Adoptive transfer of TREG into mice has been shown to inhibit, delay, and prevent development of graft versus host disease (GVHD) (Taylor et al. 2002; Cohen et al. 2002) as well as to prevent allograft (i.e., pancreatic islet cell transplant) rejection (Battaglia et al. 2006; Gregori et al. 2001). Post-transplant immunosuppressive drugs have been shown to have variable effects on TREG. Mycophenolate mofetil increases TREG numbers and induces transplant tolerance when given with vitamin D (Han et al. 2005; Huang et al. 2003; Gregori et al. 2001), calcineurin inhibitors (e.g., cyclosporine, tacrolimus, sirolimus) decrease TREG and abrogate transplant tolerance (Shoji et al. 2005; Larsen et al. 1996), and Rapamycin and methylprednisolone do not seem to have effects on TREG or transplant tolerance (Blaha et al. 2003).
Role of TREG in Pregnancy
Natural TREG, CD8+ TREG, TH3 cells, and Tr1 cells have been shown to be important in immune tolerance during pregnancy (Guerin et al. 2009; Trowsdale and Betz 2006; Aluvihare et al. 2004). IL-2/STAT5 signaling and 17-β-estradiol (E2) during pregnancy cause induction of FOXP3 and increased TREG numbers (i.e., humans and animal models) by induction of FOXP3+ iTREG and TREG cell expansion (Fainboim and Arruvito 2011). Fetal alloantigen (Zhao et al. 2007) and placental trophoblast antigens such as heat shock protein-60, carcinoembryonic antigen, CD274 (i.e., ligand for programmed cell death-1 receptor), and human leukocyte antigen-G (Taglauer et al. 2008; Yang et al. 2006; Shao et al. 2005; LeMaoult et al. 2004) are also important in TREG cell induction/activation and expansion during early pregnancy. Paternal alloantigens and TGF-β in seminal fluid can also induce/activate TREG (Robertson et al. 2009; Robertson and Sharkey 2001). During the course of pregnancy, there are increased numbers of CD4+CD25+ cells in the circulation in early pregnancy, reaching an apex during the second trimester and declining until the postpartum period where they reach a number that is nearly at the prepregnancy level (Heikkinen et al. 2004). TREG are significantly decreased in deciduas from spontaneous vaginal deliveries when compared with Caesarean section, indicating a potential role of declining TREG in fetal delivery (Xhao et al. 2007; Sindram-Trujillo et al. 2004). The ovary normally contains a population of thymic-derived nTREG (Samy et al. 2005), and the testis has been shown to have a locally induced iTREG population that are specifically targeted to testicular antigens and contributes to testicular immune privilege (Nasr et al. 2005). TREG have been shown to be necessary for immune tolerance of the conceptus, oocytes, and spermatozoa (Trowsdale and Betz 2006). There are increased numbers of TREG in the blood, decidual tissue, and lymph nodes draining the uterus (Tilburgs et al. 2008; Thuere et al. 2007). TREG cell depletion and/or decreased function have been shown to lead to loss of pregnancy in rodent models (Aluvihare et al. 2004) and in patients who have miscarried (Yang et al. 2008; Sasaki et al. 2004). Infertility, miscarriage, and pre-eclampsia have been linked with decreased TREG number and/or function (Guerin et al. 2009; Tilburgs et al. 2008; Thuere et al. 2007; Trowsdale and Betz 2006; Aluvihare et al. 2004).
Role of TREG in Cancer
TREG have been shown to dampen the cytotoxic immune response (CD8+/NK cell) as well as suppressing overall level of host immune response to the neoplasm in cancer. Researchers have looked at numbers and location of TREG and the effects on cancer patient outcome (Menetrier-Caux et al. 2009). They showed that TREG are present in a large panel of solid tumors in humans. TREG in pulmonary, pancreatic, gastric, hepatic, and ovarian carcinomas have been correlated with a negative outcome; while in B-cell lymphoma, head and neck cancer and colonic carcinoma TREG have been associated with a positive patient outcome (Menetrier-Caux et al. 2009). TREG had no effect on survival with prostatic, renal, and squamous cell carcinomas (Menetrier-Caux et al. 2009). In breast cancer, TREG in peri-tumoral lymphoid aggregates were correlated with a negative outcome, while intra-tumoral TREG were associated with a positive outcome. (Menetrier-Caux et al. 2009) The results of vaccine-induced cancer T-cell mediated immunotherapy (i.e., cancer vaccine therapy) have proven to be disappointing (Welters et al. 2008) due to the vaccine’s inability to induce effector T-cells, TREG already present in the tumor, and/or induction of TREG by the vaccine itself. Based on these findings, the success of cancer vaccine therapy will depend on the balance between TREG and effector cells at the start of therapy (Welters et al. 2008). Neoplastic TREG cells in Sézary Syndrome (leukemic variant of cutaneous T-cell lymphoma in the human) express variant splices of FOXP3. The neoplastic cells with variant FOXP3 are able to function as TREG and work to dampen the host immune response against the neoplastic T-lymphocytes (Krejsgaard et al. 2008).
TREG as a Modulatory Target in Drug Development
Pharmacological agents have been developed that control TREG number and/or function (Ohkura et al. 2011; Nizar et al. 2010; Thorburn and Hansbro 2010; Nandakumar et al. 2009; Tao et al. 2007; Yang et al. 2006). Molecules that increase TREG number include rTGF-β, FTY720 (Fingolimod, a S1P1 modulator), retinoic acids, histone deacetylase inhibitors, and probiotics. TREG suppressive function is augmented with the following agents: recombinant IL-2, Rapamycin (mTOR pathway inhibitor) in type-1-diabetes mellitus and renal transplantation, and histone deacetylase inhibitors. Histone deacetylase inhibitors that are also known as chromatin modifying agents (e.g., HDAC9) lead to increased TREG number and function by a combination of FOXP3 protein acetylation, TREG chromatin remodeling, and promotion of TREG development (Tao et al. 2007). While agents that block the TGF-β and/or CTLA-4 signaling pathways decrease TREG number and/or function. Aromatase inhibitors (e.g., Letrozole) used for estrogen modulation in cancer chemotherapy regimens and recombinant IL-2 lead to decreased TREG numbers.
Biopharmaceutical agents have been developed to modulate TREG (Khan et al. 2011; Ohkura et al. 2011; De Serres et al. 2011; Weber et al. 2009) including Tremelimumab (CTLA-4 modulation) in advanced melanoma which leads to increased effector T-cell numbers with no change in TREG number, CD25 modulation by Daclizumab in multiple sclerosis (MS) and advanced breast cancer, Denileukin diftitox as a cancer vaccine, LMB-2 and RFT5-SMPY-dgA in advanced melanoma decrease TREG number, anti-GITR MoAb (DTA1) which leads to decreased TREG number, agonist anti-OX40 MoAb (OX86) and anti-FR4 MoAb which decrease TREG number, and Alemtuzumab (anti-CD52 MoAb) which increases TREG number.
Adoptive transfer of TREG has been evaluated in clinical trials of patients that have received human stem cell transplants to induce transplant tolerance, patients with GVHD, and type 1 diabetes mellitus patients to ameliorate autoimmune disease with a good patient safety profile and showed that the procedure is feasible, yet efficacy still needs to be shown convincingly (Riley et al. 2009; Trzonkowski et al. 2009).
Conclusions
TREG have both positive and negative functions in the immune system. Positive aspects of TREG include suppression of immune responses including autoimmunity, maintaining immune homeostasis, as well as tolerance in xenotransplantation, at mucosal sites, and during pregnancy. Negative aspects of TREG can include manipulation by some infectious agents to avoid the host’s immune response and in cancer TREG can suppress the body’s cytotoxic immune response to neoplastic cells. The balance between TREG and effector cells determines the fate of an immune response. The fact that the immune system has so many sources of regulatory cells which overlap functionally but have slightly different induction/activation pathways underscores the importance of TREG in host survival.
Footnotes
The author declared no potential conflicts of interests with respect to the authorship and/or publication of this article. The author received no financial support for the research and/or authorship of this article.
Abbreviations
Acknowledgments
I would like to acknowledge the following researchers: Virginia Godfrey, DVM, PhD, DACVP, from the University of North Carolina at Chapel Hill for her kind donation of the “Scurfy” mouse images; Caroline Genell from the GlaxoSmithKline, Safety Assessment, Immunotoxicology Group for the rat TREG flow cytometry data; and John Spaull of the GlaxoSmithKline MCT Cell Biology Group for the FOXP3 immunofluorescence images.