
Abstract
The first electron microscopic images of biological specimens were made in the 1940s, and the next 30 years comprised an era of descriptive ultrastructure during which transmission electron microscopy (TEM) was integral to an explosion in cellular and molecular biology. However, when questions could no longer be answered by ultrastructural information alone, the use of TEM in biological research declined. Innovative molecular techniques and newer imaging technologies such as confocal fluorescence microscopy filled the gap, providing faster answers with less rigorous training as a prerequisite to data collection. The use of TEM in toxicologic pathology has paralleled the rise and fall of its popularity in other disciplines. However, TEM remains an essential resource that provides direct and unequivocal data to explain and address safety concerns in preclinical toxicity studies. There is still an important place for TEM in preclinical safety evaluation and mechanistic studies, particularly when visualization of subcellular structures provides a link to other endpoints. This review reinforces the value of TEM in preclinical safety testing and model development and encourages best practices for ultrastructural evaluation.
The first electron microscopic images of biological specimens were made in the 1940s, and the next 30 years comprised an era of descriptive ultrastructure during which transmission electron microscopy (TEM) was integral to an explosion in cellular and molecular biology knowledge. Each new image provided novel information about cellular physiology, because for the first time, function could be linked to structure in organelles such as mitochondria (respiration), rough endoplasmic reticulum (protein synthesis), and the Golgi apparatus (secretion). However, when questions could no longer be answered by ultrastructural information, innovative molecular techniques filled the gap to elucidate mechanisms of protein transcription and expression, among others. Molecular methods and newer imaging technologies such as confocal fluorescence microscopy provided faster answers and required less rigorous training as a prerequisite to data collection. Factors such as labor-intensive specimen preparation, inherently low throughput, complicated instrument operation, high maintenance costs, and pitfalls in image interpretation contributed to the declining use of TEM in biological research.
The use of TEM in toxicologic pathology has paralleled the rise and fall of its popularity in other disciplines. However, TEM remains an essential resource that provides direct and unequivocal data to explain and address safety concerns that arise in preclinical toxicity studies. There is still an important place for TEM in preclinical safety evaluation and mechanistic studies, particularly when visualization of subcellular structures provides a link to other endpoints.
Interpretation of ultrastructural images requires training and experience akin to that required for gaining expertise in histopathology, but there are far fewer dedicated training opportunities for students, junior scientists, and even more seasoned professionals to become proficient in ultrastructural pathology. Modern instruments are easier to use, and digital imaging allows the rapid acquisition of numerous images; however, in the absence of mentoring, there is a danger for TEM to be used inappropriately or for images to be interpreted incorrectly. In addition, the margin of error for TEM tissue collection and sample handling is greatly reduced compared with the requirements for light microscopic sample processing. The intent of this review is to reinforce the value of TEM in preclinical safety testing and model development, as well as to encourage best practices for ultrastructural evaluation.
Technical Considerations
Although electron microscopes provide much greater magnification than light microscopes, the attribute that enables visualization of subcellular structures that cannot be seen by conventional light microscopy (LM) is greater resolving power (i.e., the ability to visualize two small structures as separate). TEM is capable of higher resolution and, therefore, higher usable magnification.
Improved resolution results from using electrons rather than light to illuminate specimens, which places certain constraints on tissue sections: they must be thin enough to allow electrons to pass through them yet stable enough to withstand high vacuum and temperature environment of the TEM specimen chamber. The introduction of epoxy embedding resins and diamond knives for making uniformly thin, high-quality sections was in large part responsible for the tremendous number of descriptive EM studies carried out in the 1970s and 1980s.
Since those technical developments, little has changed in standard TEM specimen preparation. The greatest advances have been in the microscopes themselves, whose operation is now far more user-friendly due to electronic controls and improved instrument stability. The advent of digital imaging has also eliminated one of the most time-consuming aspects of electron microscopy, that is, laborious darkroom sessions for development and printing of photographic negatives.
Specimen collection and handling during preparation determine the ultimate quality of ultrastructure. Tissues that appear to be well preserved by light microscopy may not be adequately preserved when examined at higher magnifications of TEM. Because preclinical toxicity studies are expensive, often of several months’ duration, and not able to be repeated in most pharmaceutical company settings, it is critical to carefully plan tissue collection for TEM. There is no downstream technical remedy for tissues that have been mishandled during collection or processing.
Optimal TEM fixatives usually contain glutaraldehyde, and often paraformaldehyde, to fix proteins. While perfusion rather than immersion fixation provides the highest quality ultrastructure, this level of preservation is seldom necessary or practical for samples from a preclinical toxicity study. In our experience, immersion fixation of specially trimmed tissues in 10% neutral buffered formalin (the standard fixative for hematoxylin and eosin–stained tissue sections, histochemistry, and immunohistochemistry) provides adequate fixation for most preclinical study samples, particularly liver and kidney. To achieve acceptable ultrastructural preservation in formalin, however, it is essential that tissue thickness not exceed 3 mm, that adequate fixative volumes be used (20:1 ratio of fixative to tissue), and that sharp blades be used to reduce mechanical damage to tissue surfaces. While usable information can be obtained in this way, glutaraldehyde-fixation of 1-mm3 tissue pieces is the method of choice for optimum preservation of ultrastructure. Any subtle ultrastructural changes noted in formalin-fixed material (e.g., evidence of mitochondrial swelling) may require further exploration in a dedicated study for ultrastructural evaluation or in a subsequent toxicity study using tissues collected in a glutaraldehyde-containing fixative.
After aldehyde fixation, tissues for TEM are postfixed in osmium tetroxide, which cross-links lipids and thereby stabilizes cellular membranes. Subsequent processing steps are analogous to those used for light microscopy, that is, dehydration, embedment (in epoxy resin), sectioning, and staining (using heavy metals such as lead and uranium). Orientation sections are made for light microscopy first (generally stained with toluidine blue) to ensure that the area of interest is present and to further select areas for thin sectioning.
Many excellent publications of standard TEM methods exist (Bozzola and Russell 1999; Dykstra et al. 2002; Dykstra and Reuss 2003; Dykstra 2011; Glauert and Lewis 1998; Hayat 1989). While standard methods can be used for most tissues, optimized methods may occasionally be required (e.g., perfusion fixation for evaluations focused on the central nervous system). For nonstandard target organs, the literature should be consulted for the best fixation solutions and conditions.
Interpretation
A standard histological section may comprise several square centimeters of area and can include the profile of an entire organ, particularly for rodents. In contrast, the area of a standard TEM section is usually less than 1 mm2. For optimum preservation of ultrastructure, tissue samples should be no more than approximately 1 mm in any dimension to accommodate rapid fixation and the challenges of thoroughly infiltrating tissues with viscous epoxy embedding resins. This small sample size dictates meticulous specimen selection to ensure inclusion of the area of interest.
In preclinical toxicity studies, the most commonly collected tissues for TEM are liver and kidney cortex, organs in which there can be considerable regional variation in ultrastructure. For accurate comparisons between study animals, TEM specimens must be collected from comparable regions. In liver, the same general location in a specified liver lobe should be sampled, avoiding the edges of the lobe and central areas containing large vessels and bile ducts. Furthermore, it is important to compare the ultrastructure of cells from the same region of the liver lobule (e.g., centrilobular vs. periportal) in control and test animals. The same principle holds for kidney tubules, where comparable segments of convoluted tubules, for example, should be compared between control and dosed animals. When kidney cortex is the area of interest, samples should be collected from approximately the same distance from the capsule. Sampling too close to the medulla should be avoided, unless, of course, this is the area of interest. Figure 1 illustrates the levels of sampling in kidney, from the macroscopic level, to a standard histological section, to an epoxy-embedded “semi-thin” section of the area that will be examined in the TEM. Semi-thin sections are approximately 1-μm-thick epoxy sections for LM that are cut and stained (usually in 1% toluidine blue in 1% aqueous sodium borate) from the same block that will be used for TEM sections. The use of semi-thin sections confirms accurate sampling. In addition, LM evaluation of semi-thin sections can provide additional insights into histologic changes, as the sections are thinner than standard paraffin-embedded histological sections and have not been subjected to the lipid extraction that occurs during paraffin embedding.
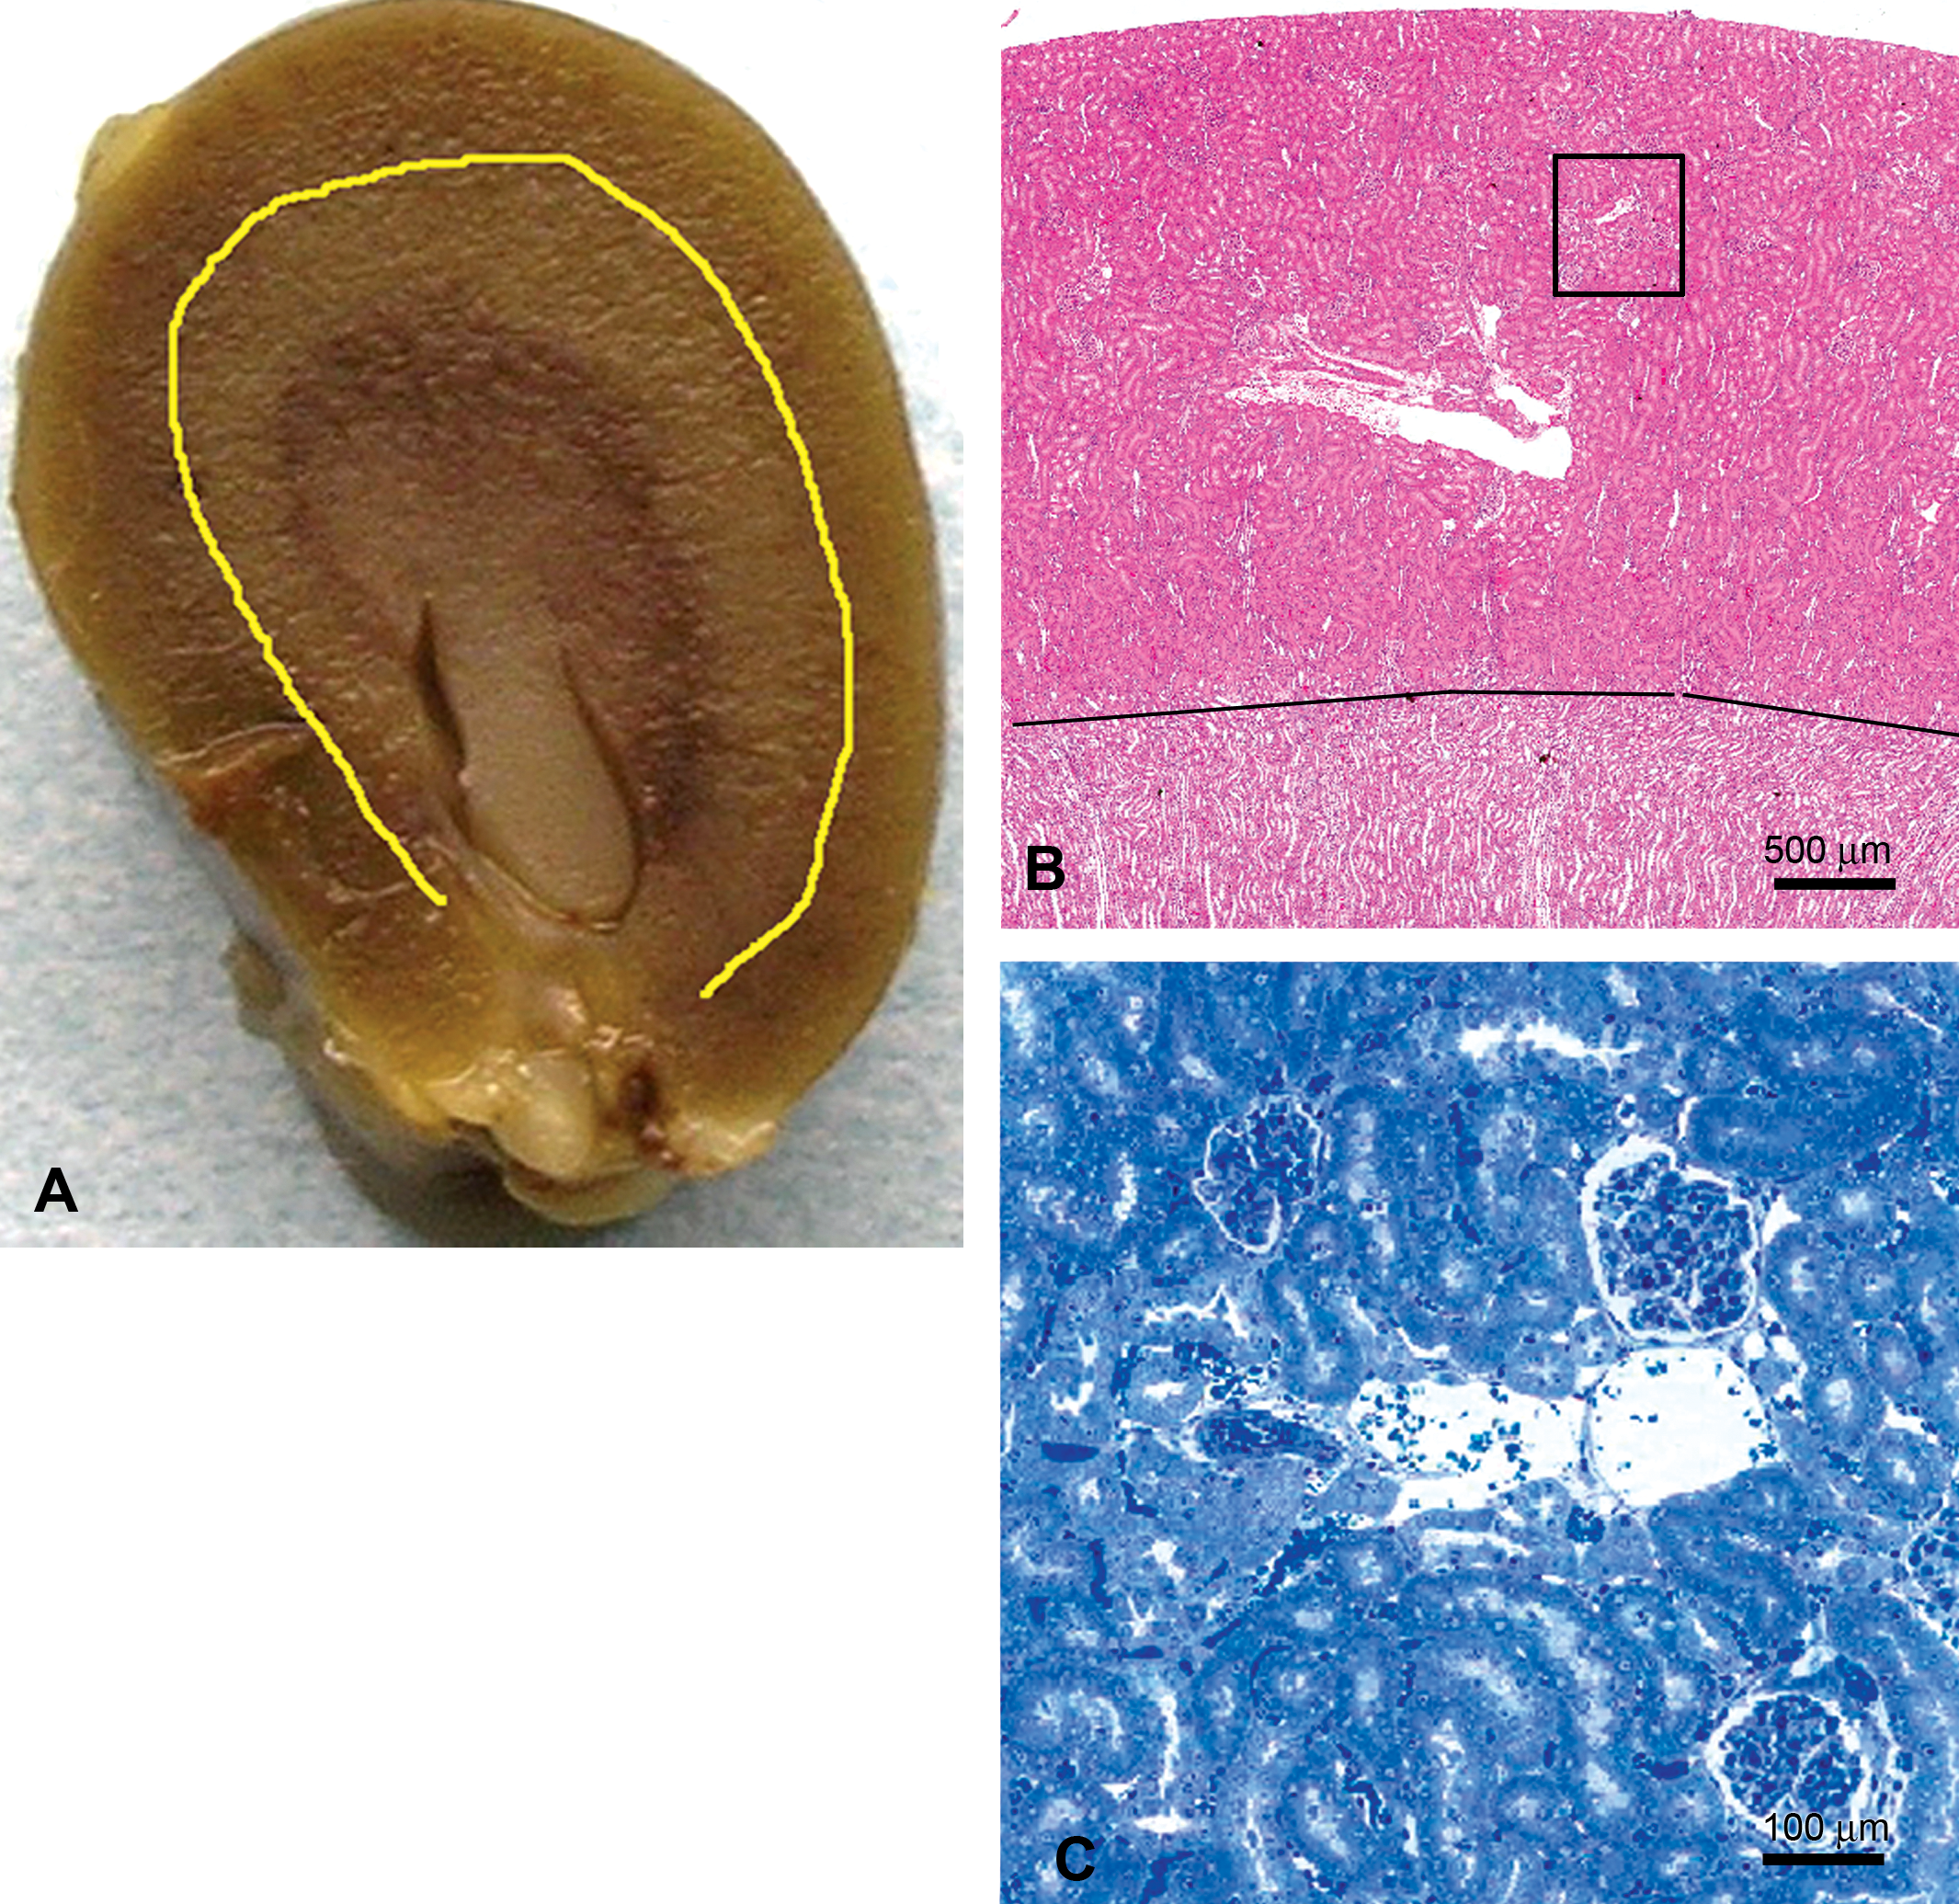
Accurate tissue sampling for transmission electron microscopy (TEM), rat kidney. (A) Cut surface of whole kidney. The yellow line demarcates the kidney cortex and kidney medulla, demonstrating use of gross appearance to collect correct tissue region. (B) Hematoxylin and eosin section. The black line separates the cortex and medulla; the black box represents the size of the region in the cortex to be examined by TEM. (C) Semi-thin section (toluidine blue–stained epoxy resin section for light microscopy, T-blue) of the kidney cortex, representing the typical area of the TEM section.
It is essential to include controls in any preclinical toxicity study. While it may not be necessary to routinely evaluate every control, they can be used to distinguish processing artifacts from test material–induced changes or to identify background changes. In our experience, collecting corresponding tissues from three control animals and three dosed animals per group is sufficient.
Several practices during specimen examination will ensure data and interpretation of the highest quality. First, to enable meaningful assessments of ultrastructural changes in the limited field of view in a high-magnification TEM image, a low-magnification survey image that includes the same area should be captured for each high-magnification image. The low-magnification image will include a larger sample area that provides context for the higher-power view. Having a survey image is especially important for peer review of TEM findings in toxicity studies, as this review generally is carried out on micrographs rather than of the actual specimens. Second, it is important to use identical magnifications when comparing specimens from animals receiving test compound and their concurrent controls. And finally, it is often very informative to use TEM and LM iteratively. For example, TEM may be used to identify structures (e.g., LM inclusions that prove to be membranous whorls characteristic of phospholipidosis) followed by LM to identify the distribution of the structures or to identify them in other cell types, which can again be confirmed by TEM. Similarly, when TEM identifies the composition of LM vacuoles as neutral lipid, the relative amount and distribution of lipid are subsequently best determined in standard histologic sections. In addition, immunohistochemical labeling of histological sections, when relevant antibodies are available, is extremely valuable to further characterize ultrastructural features.
Even with great attention to careful specimen preparation techniques, artifacts can occur and may even masquerade as ultrastructural changes consistent with cellular damage. Delayed fixation of the liver can produce characteristic vacuoles that might otherwise be mistaken for a pathologic change (Li et al. 2003). Lipids are prone to extraction artifacts due to incomplete fixation resulting from the inherently slow penetration of osmium tetroxide. Lipid droplets may be completely extracted (i.e., appear as empty round holes) or partially extracted, producing membranous remnants that can mimic phospholipidosis.
The key to proper interpretation of antemortem ultrastructural changes is a thorough knowledge of normal ultrastructure, including the range of normal background features. The foundation for this knowledge can be obtained from reference texts (e.g., Cheville 1983; Ghadially 1997; Lenz 1971; Mescher 2010) but must be supplemented with experience gained from thoughtful and thorough examination of a variety of specimens on the electron microscope. Carefully evaluating the following parameters will allow true changes to be distinguished from artifacts:
change in size or relative number of organelles,
change in number of aggregated organelles,
altered organelle structure (shape, integrity),
abnormal intracellular or intraorganelle content, and
altered extracellular content or structure.
There is always a danger of overinterpretation of ultrastructural changes. To minimize this, the following points should be taken into consideration to enable accurate interpretation of test article effects in preclinical toxicity studies:
application of clear and adequate diagnostic criteria;
consistent application of diagnostic criteria;
correlation with LM findings (including immunohistochemistry), as well as any other relevant study data, such as clinical chemistry, hematology, or organ weights;
consideration of related findings in other organs that may help confirm TEM diagnosis; and
knowledge of compound structure, mechanism, and class effects of both the chemical compound and its pharmacologic target.
When to Use TEM in Preclinical Safety Studies
The previous section defines how to use TEM in preclinical toxicity studies. The primary standard for when to use TEM in a preclinical study is to do so only when a well-defined question can be formulated. Lack of a clear objective in ultrastructural studies can lead to frustration at having unnecessarily collected data at considerable expense and time and, in the worst case, having that data complicate the interpretation of an overall study outcome. Appropriate uses of TEM in preclinical safety and examples of the types of questions to ask include the following:
To characterize a LM finding:
What is the reason for cellular vacuolation? Is it due to neutral lipid accumulation, phospholipidosis, or organelle damage?
What is the cause of thickened glomerular capillary walls? Is it due to protein deposits? Thickened basement membrane?
To corroborate or clarify a finding for which there is other evidence, such as clinical chemistry or hematology:
Is there a correlation between proteinuria and podocyte ultrastructure?
For microvesicular steatosis, is mitochondrial structure altered?
To characterize a disease model or biomarker:
Can a nerve injury model be used to assess demyelination/remyelination?
For renal injury models, have literature-reported ultrastructural changes in glomeruli been replicated in the model?
TEM to Characterize LM Findings
One of the most common indications for ultrastructural evaluation is to further characterize histologic findings of inclusions or vacuoles that cannot be conclusively identified by LM. In particular, knowing whether inclusions represent phospholipidosis is important in pharmaceutical development, as it may indicate accumulation of compound in cells (Reasor, Hastings, and Ulrich 2006). TEM has been called the gold standard for determinations of phospholipidosis, as it provides direct confirmation by demonstrating concentric lamellar inclusions (sometimes called myelin/myeloid bodies), which often occur in lung, spleen, lymph nodes, liver, kidney, and retina, although they are not limited to these locations (Figure 2).
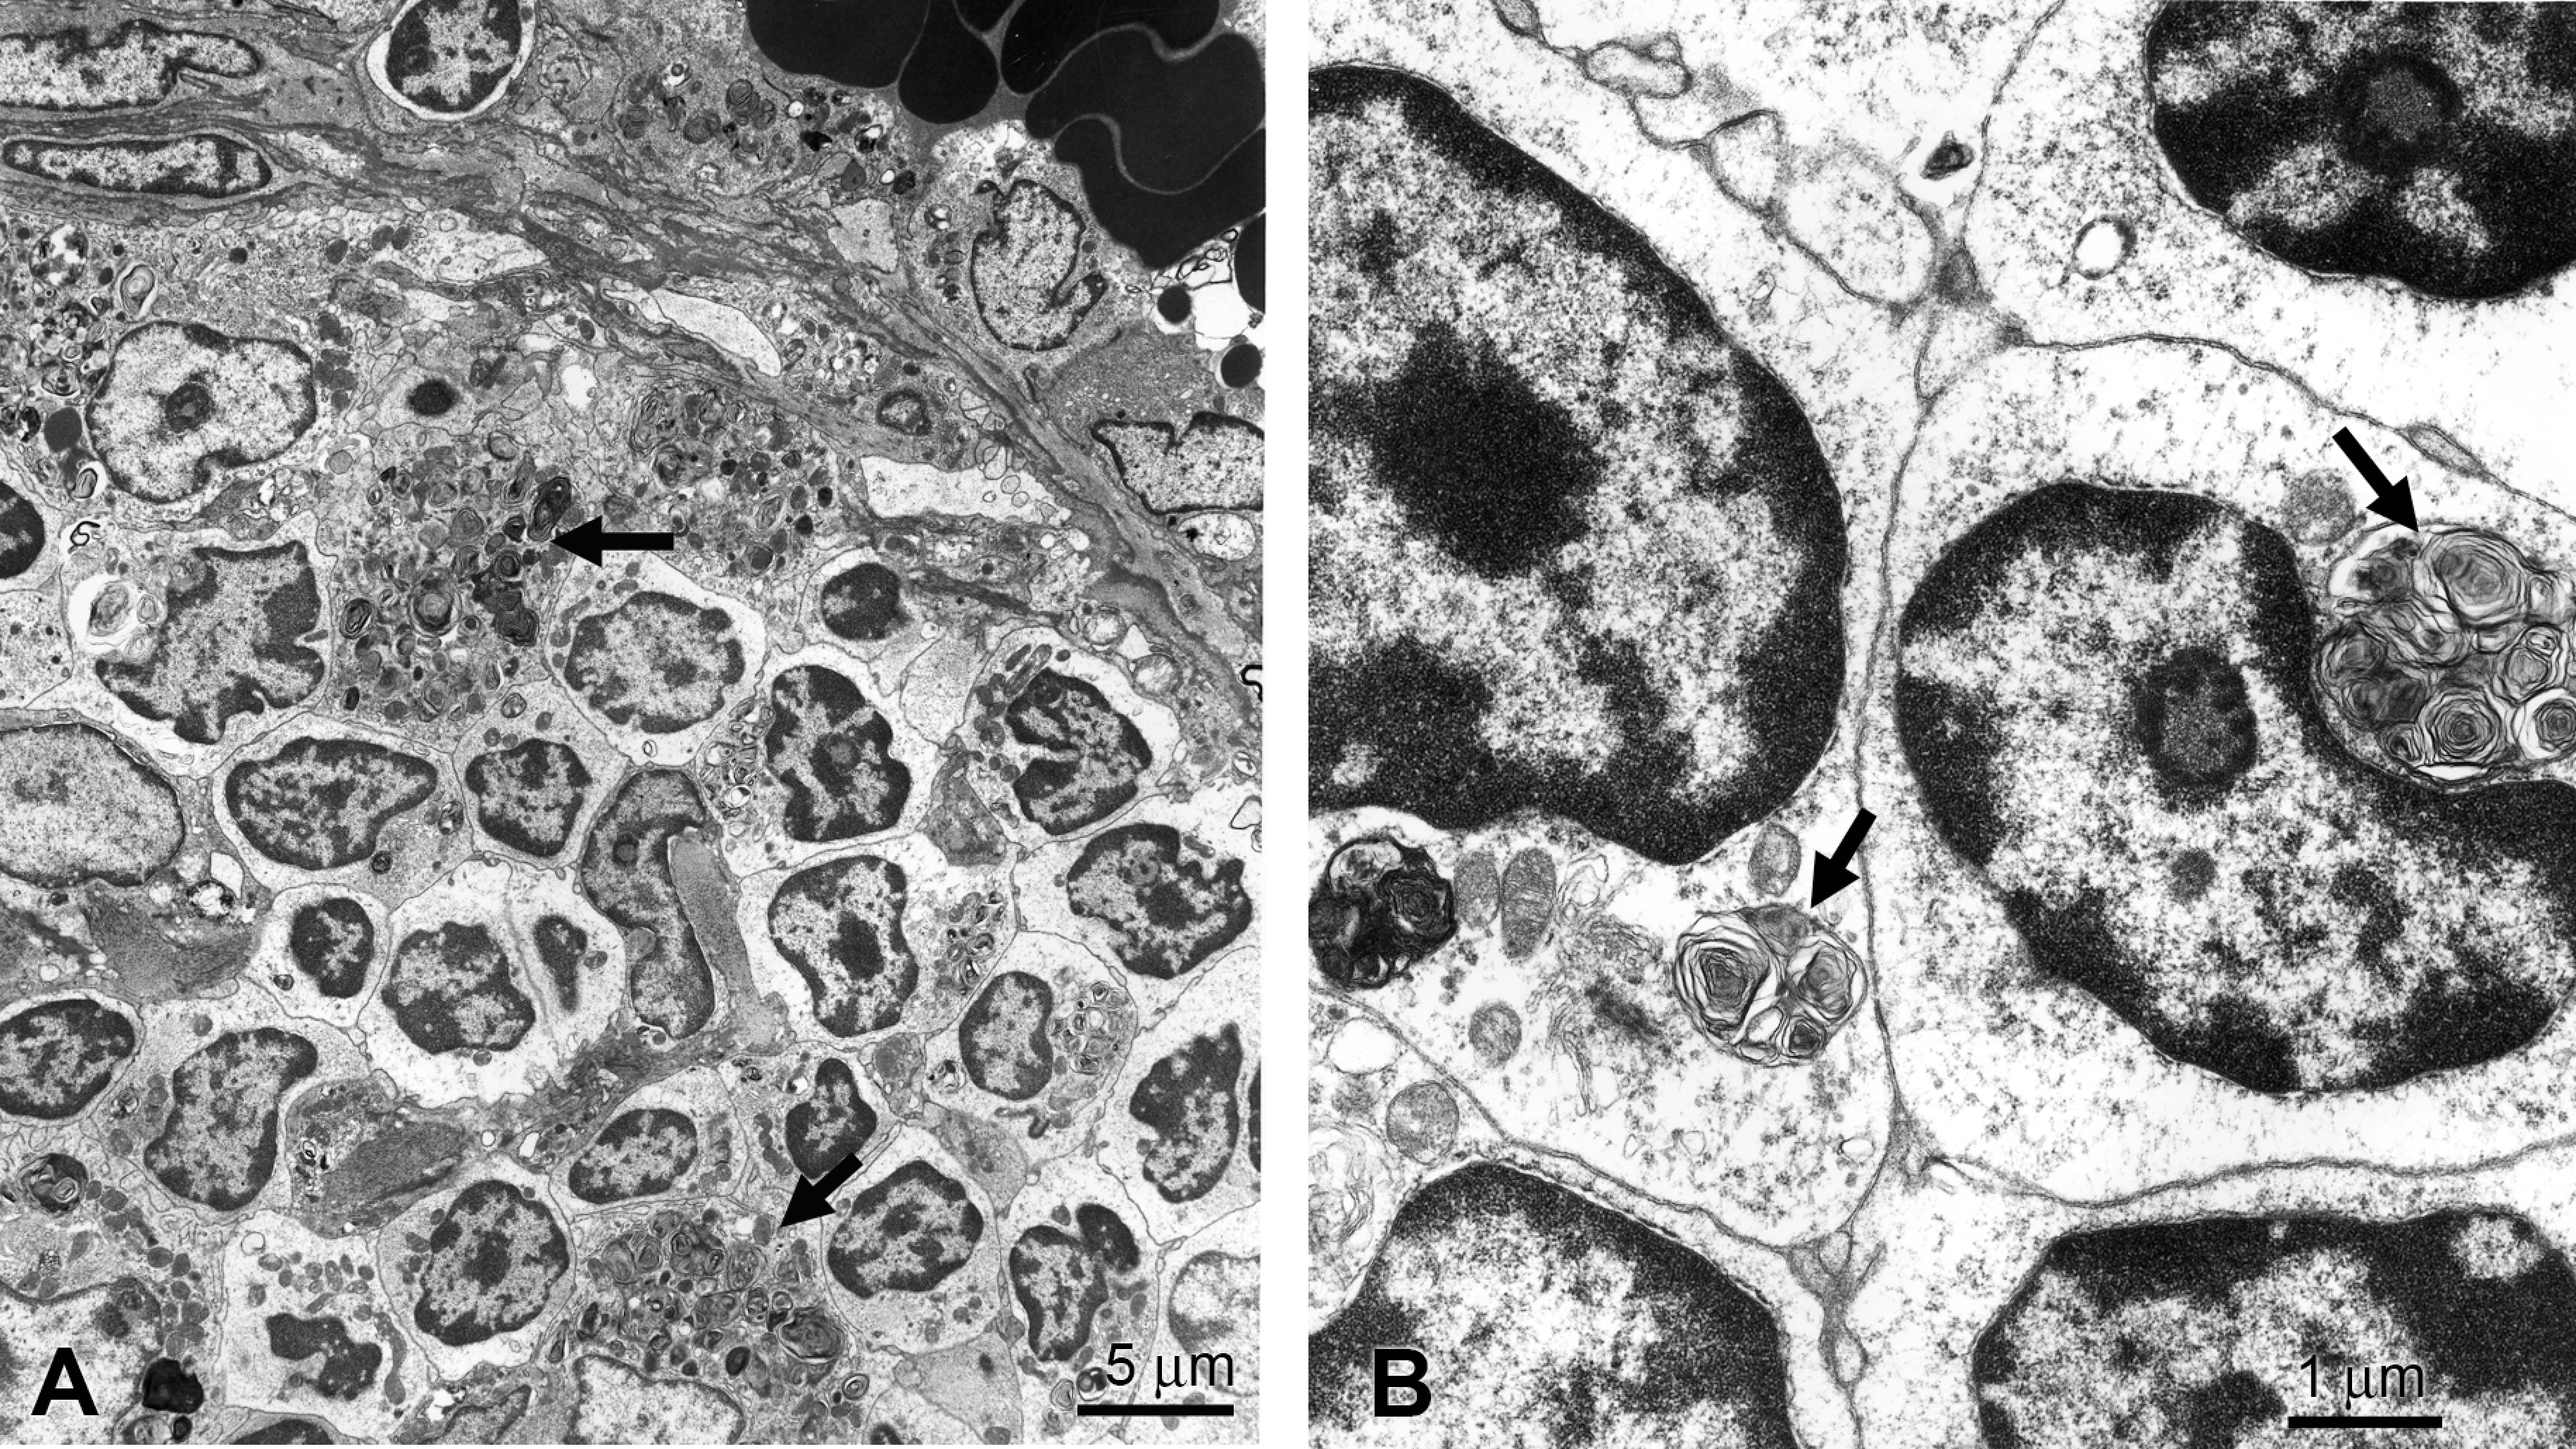
Rat spleen, phospholipidosis, transmission electron microscopy. Arrows indicate concentric membrane whorls in macrophages (A) and lymphocytes (B).
Different types of inclusions and vacuoles may occur in the same organ, as is illustrated in Figure 3. In this preclinical toxicity study in dogs, two findings were noted in the liver: a stippled vacuolation in some areas and the presence of unusual intracytoplasmic inclusions in other regions. The stippled vacuolation was determined by TEM to be neutral lipid in microvesicular form, of potential concern because of its association with mitochondrial injury (Pessayre, Fromenty, and Mansouri 2002). If this compound were to continue in development, the TEM finding might trigger additional studies evaluating the effect of the compound on mitochondrial function. The intracytoplasmic inclusions were identified as whorls of endoplasmic reticulum, often enclosing organelles and other cytoplasmic elements. While the significance of the whorls was not determined, they likely represent a nonspecific change, as they have been seen with a variety of unrelated compounds being developed for unrelated targets. Similar whorls have been associated with autophagy of damaged organelles (Ishida et al. 2009; Kurz et al. 2008; Okiyoneda et al. 2004; and Sriburi et al. 2004).
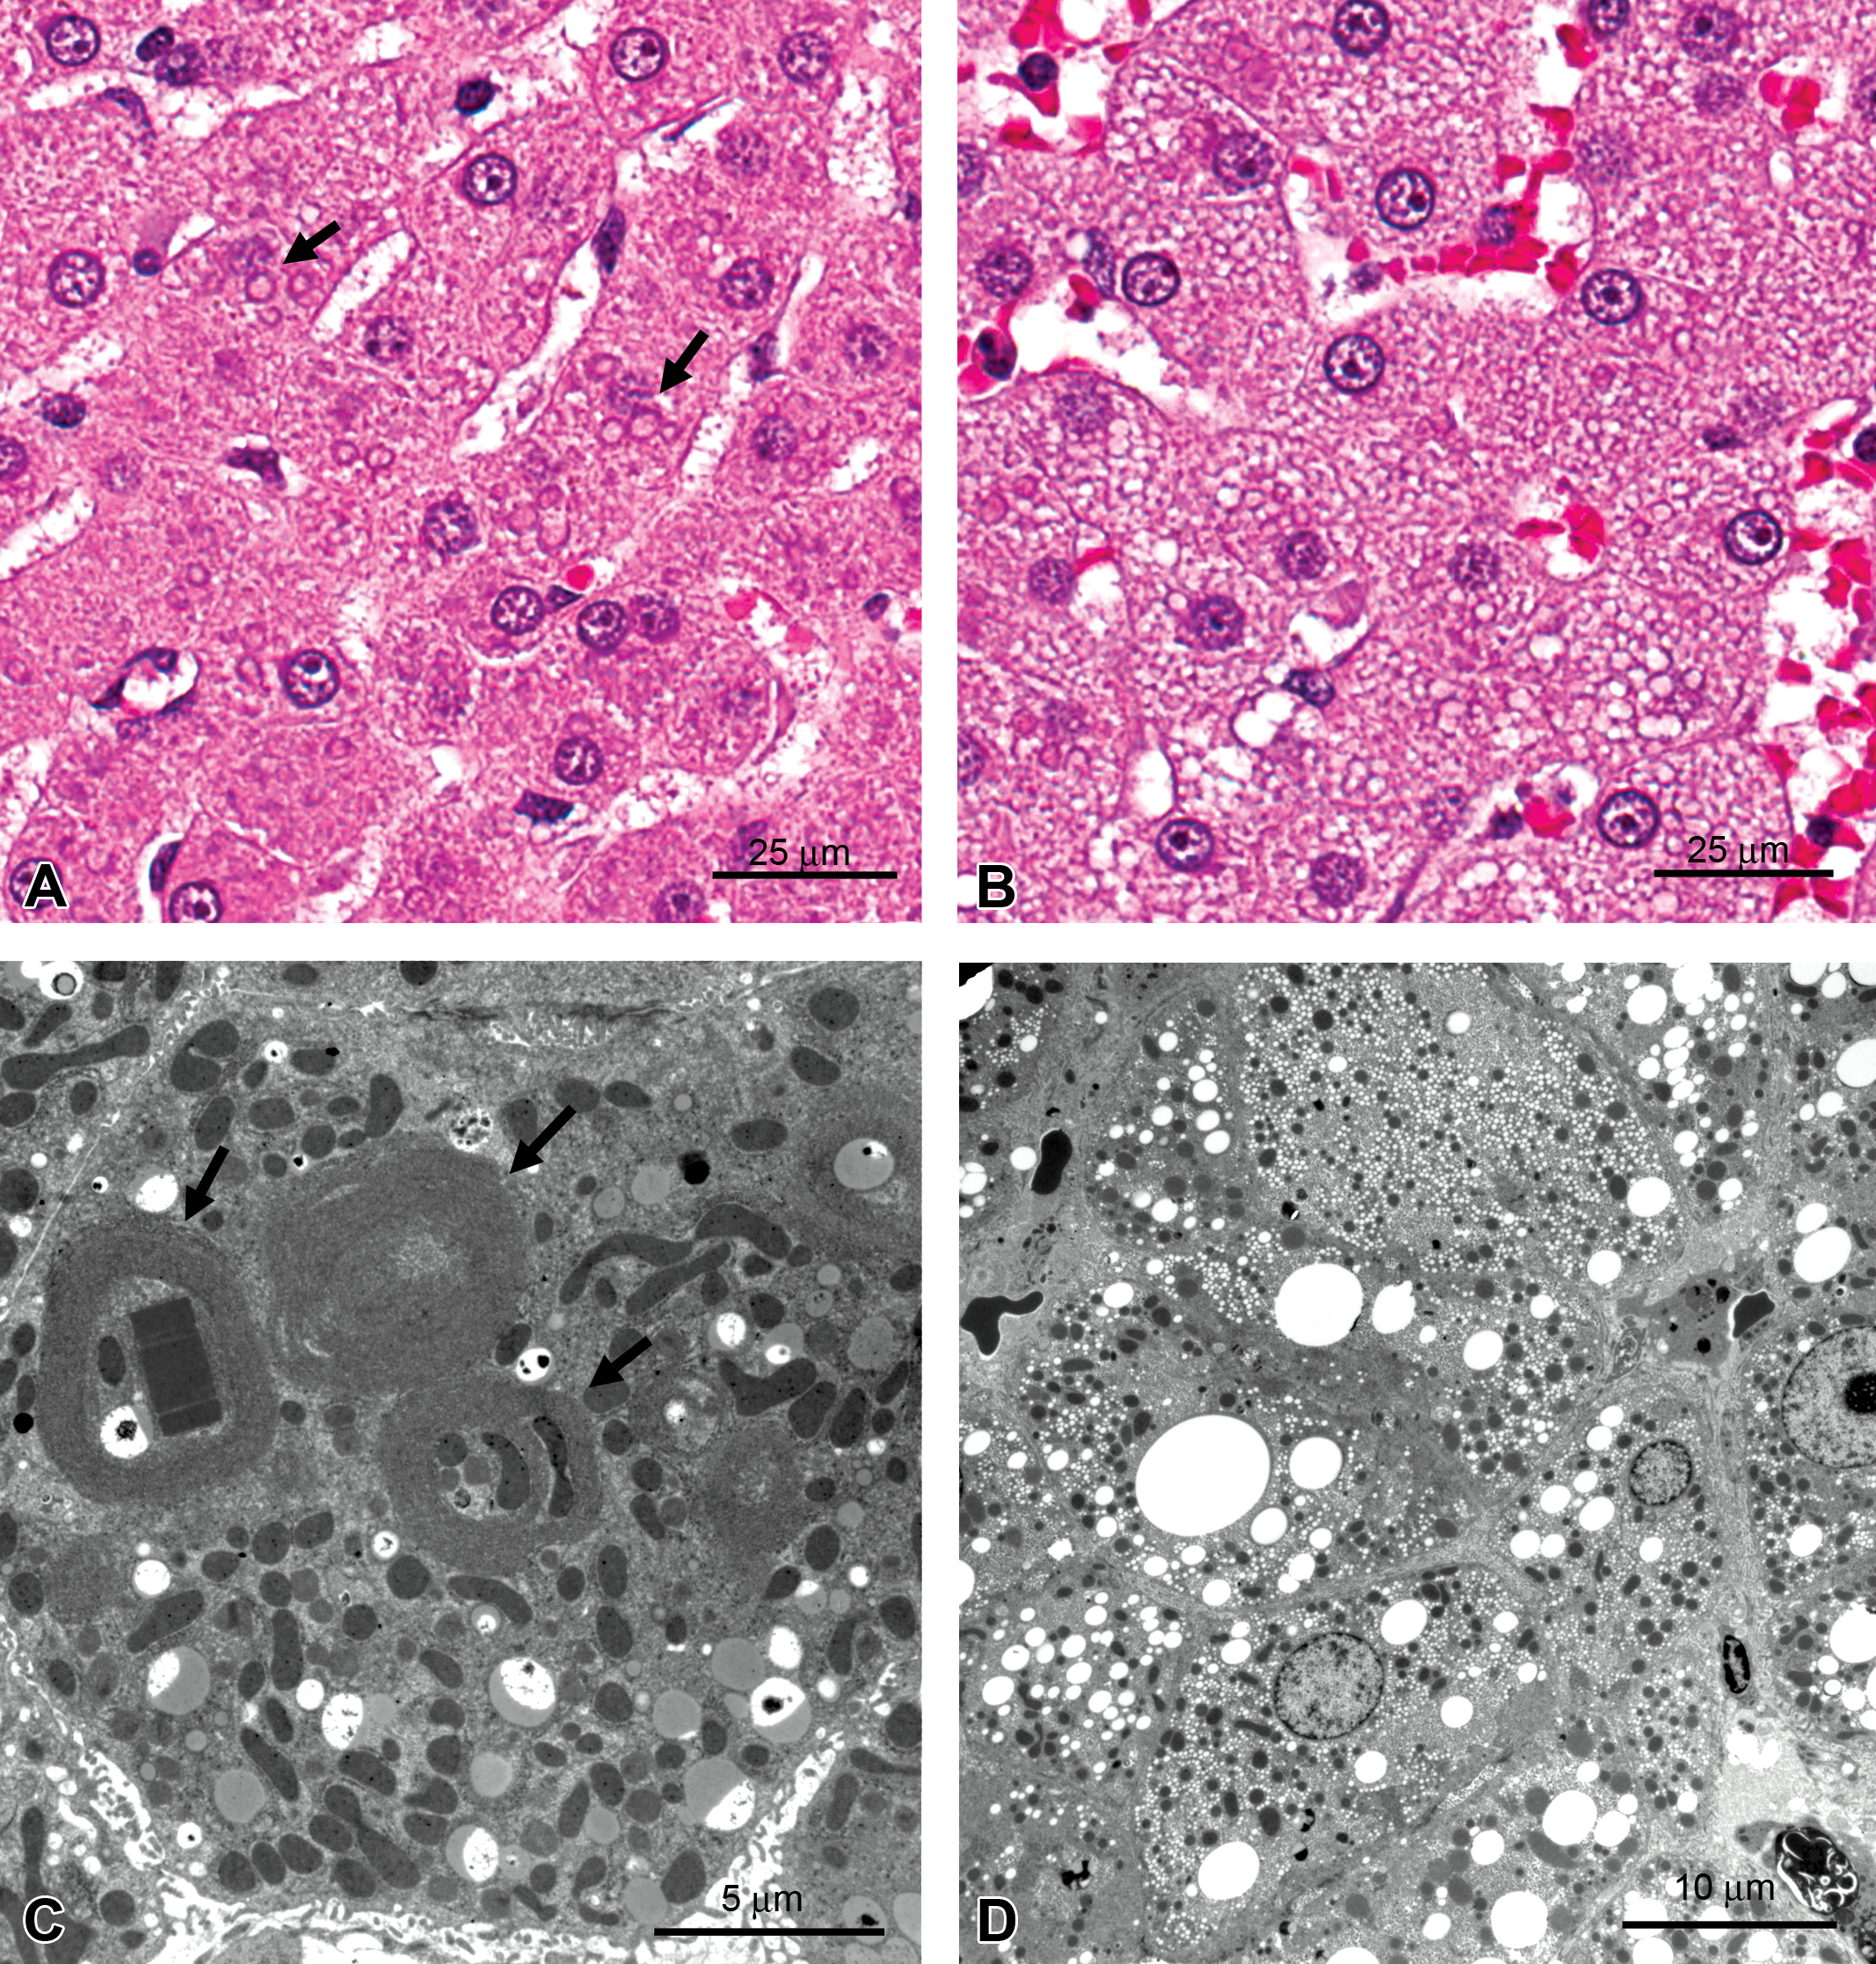
Dog liver. (A) Intracytoplasmic inclusions (arrows), hematoxylin and eosin (HE). (B) Stippled cytoplasmic vacuolation, HE. (C) Transmission electron microscopy (TEM). Intracytoplasmic inclusions in (A) are whorls of endoplasmic reticulum (arrows) enclosing cytoplasm, organelles such as mitochondria, or rectangular crystalloid inclusions of undetermined composition, TEM. (D) Stippled light microscopy appearance is due to accumulation of microvesicular lipid droplets, TEM.
In a preclinical toxicity study, LM detection of pigment-like material may prompt a concern that parent compound or metabolite is accumulating in tissues, usually an undesirable effect. Identification of the material as a naturally occurring pigment such as lipofuscin may lower the level of concern (Figure 4). While there are several LM methods for identifying lipofuscin, its heterogeneous nature can result in variable staining, whereas TEM provides direct morphological confirmation of its identity.
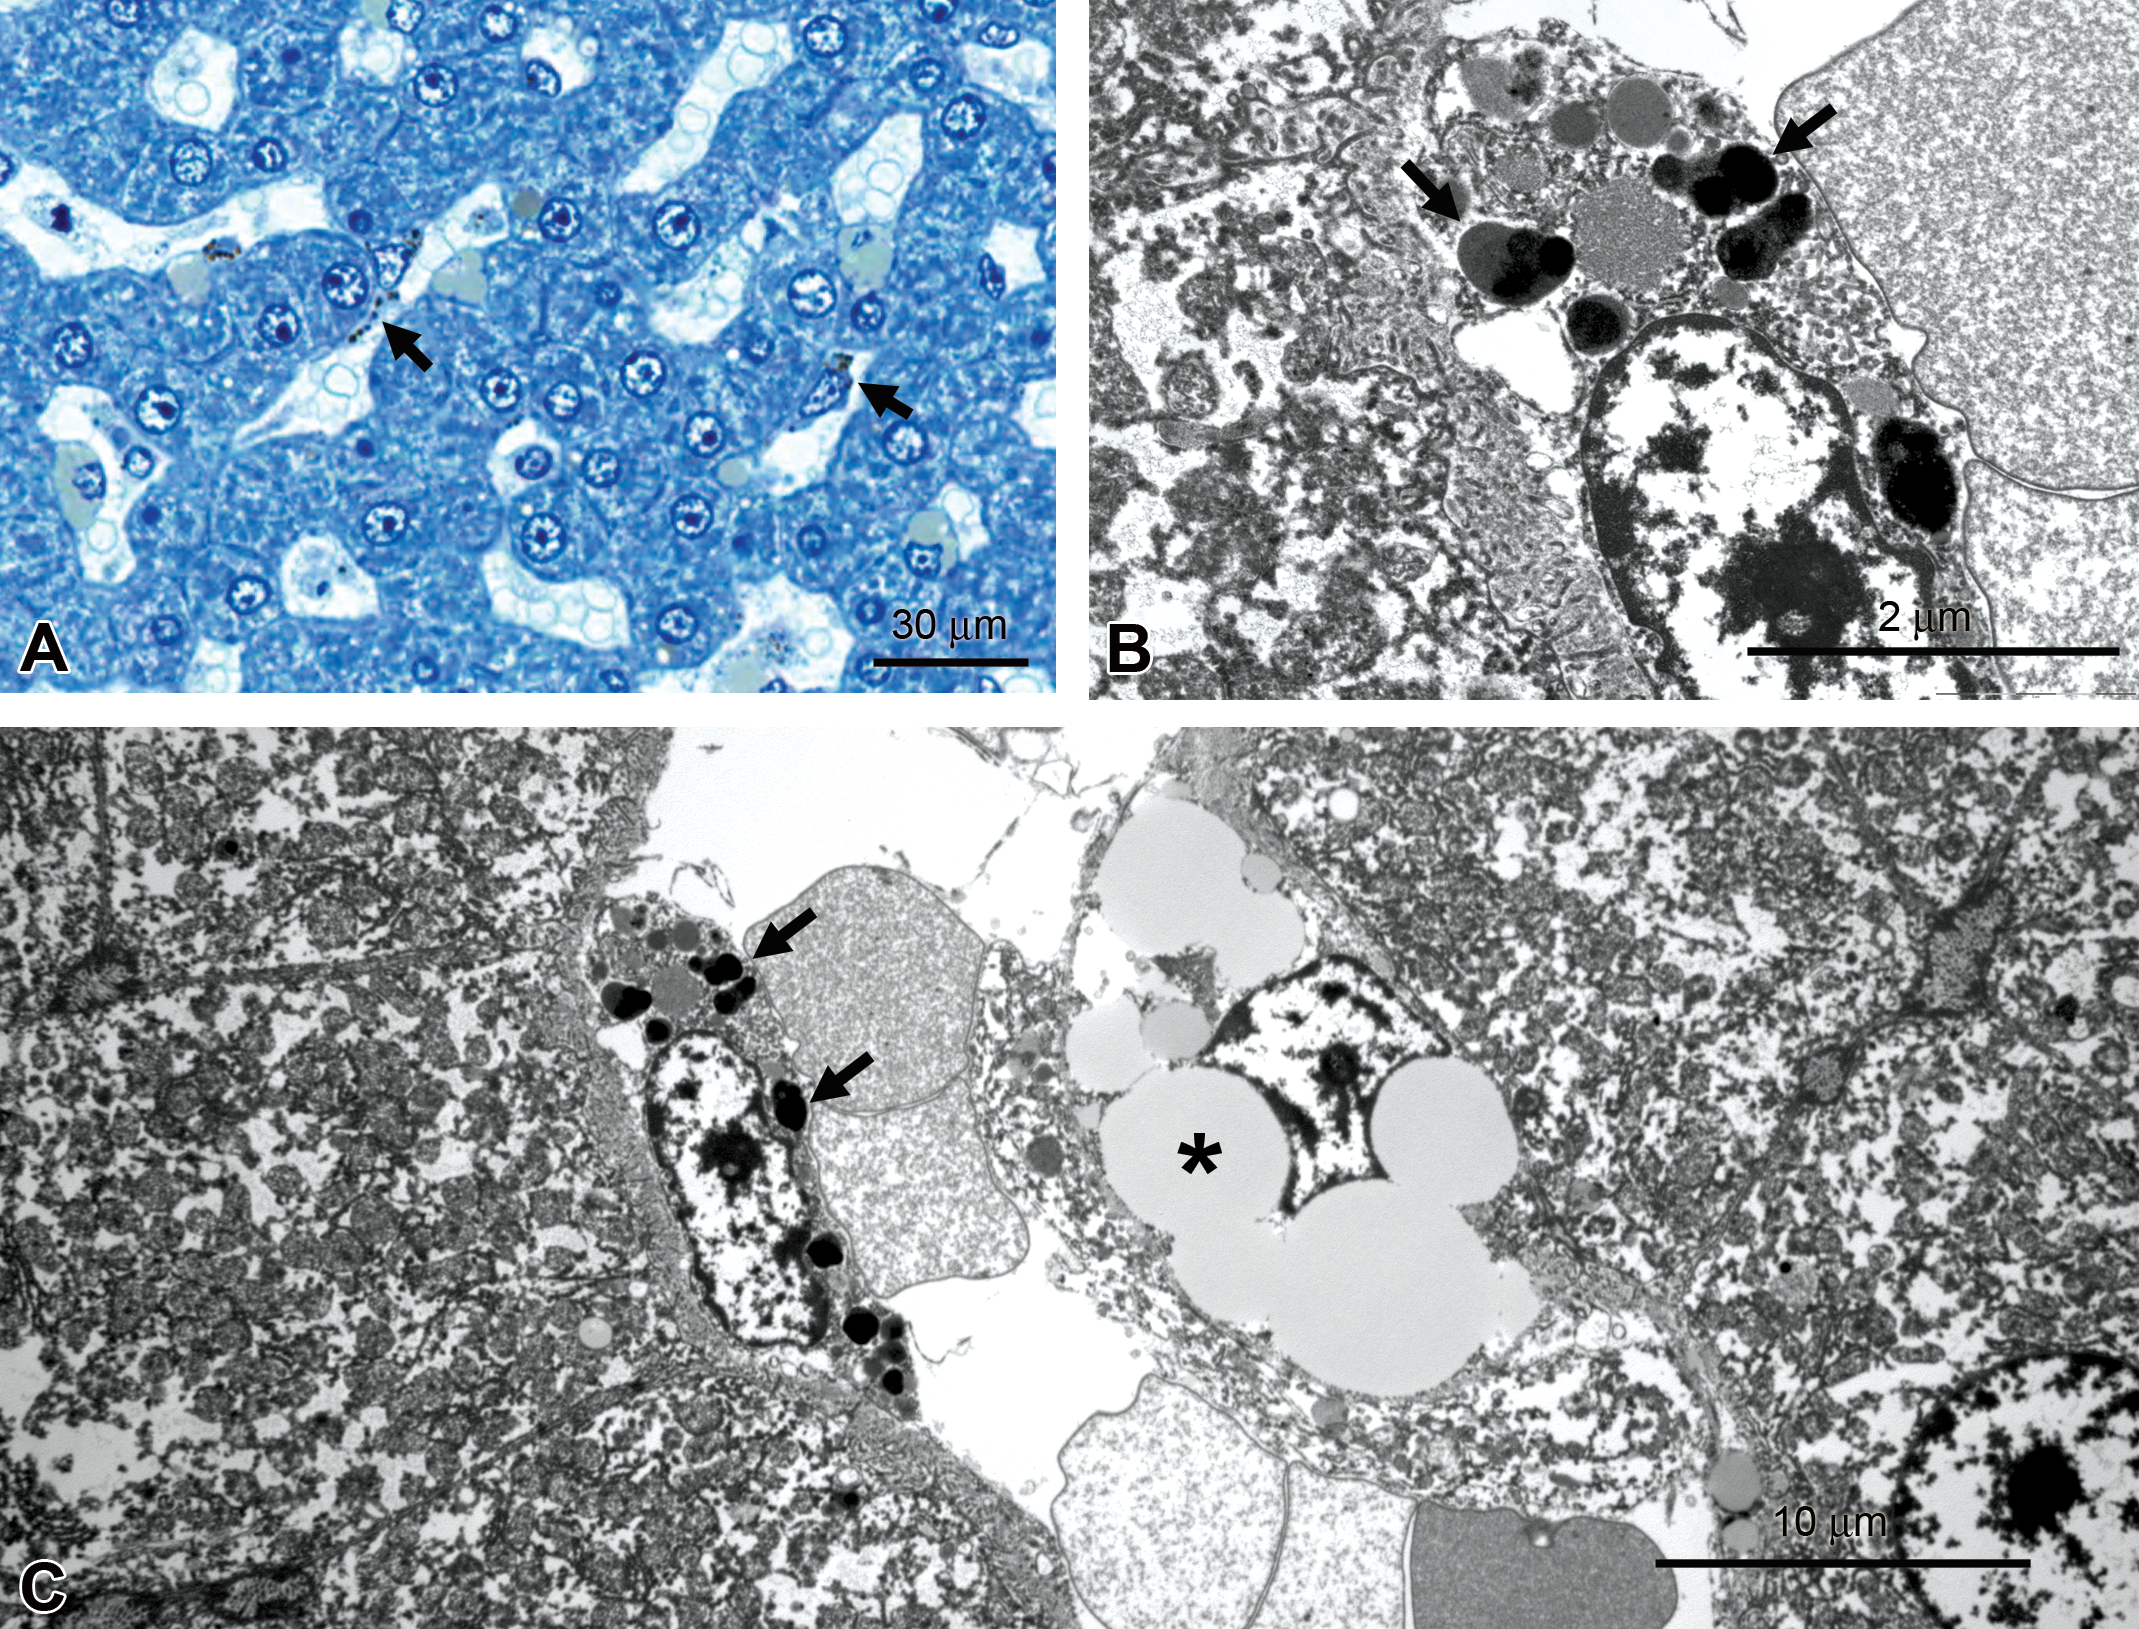
Monkey liver, pigmented inclusions. (A) Brownish-black inclusions in sinusoidal cells (arrows), T-blue. (B, C) Pigmented inclusions are lipofuscin (arrows in B), lipid droplets in hepatic stellate, or Ito, cell (asterisk), transmission electron microscopy.
Ancillary methods can assist in identifying a pigment, particularly when evidence points to administered compound as its source. In the example shown in Figure 5, pigmented material was found within hepatocytes toward the end of a 2-year rat carcinogenicity study. Representative pigmented and nonpigmented cells were collected using laser capture microdissection followed by chemical extraction. Mass spectrometric analysis was employed using matrix-assisted laser desorption ionization (MALDI) to compare mass-to-charge ratios of extracted microdissected material to the profiles of parent compound and known metabolites (Rubakhin et al. 2005). The pigmented material was unequivocally identified as parent compound that had accumulated in the liver.
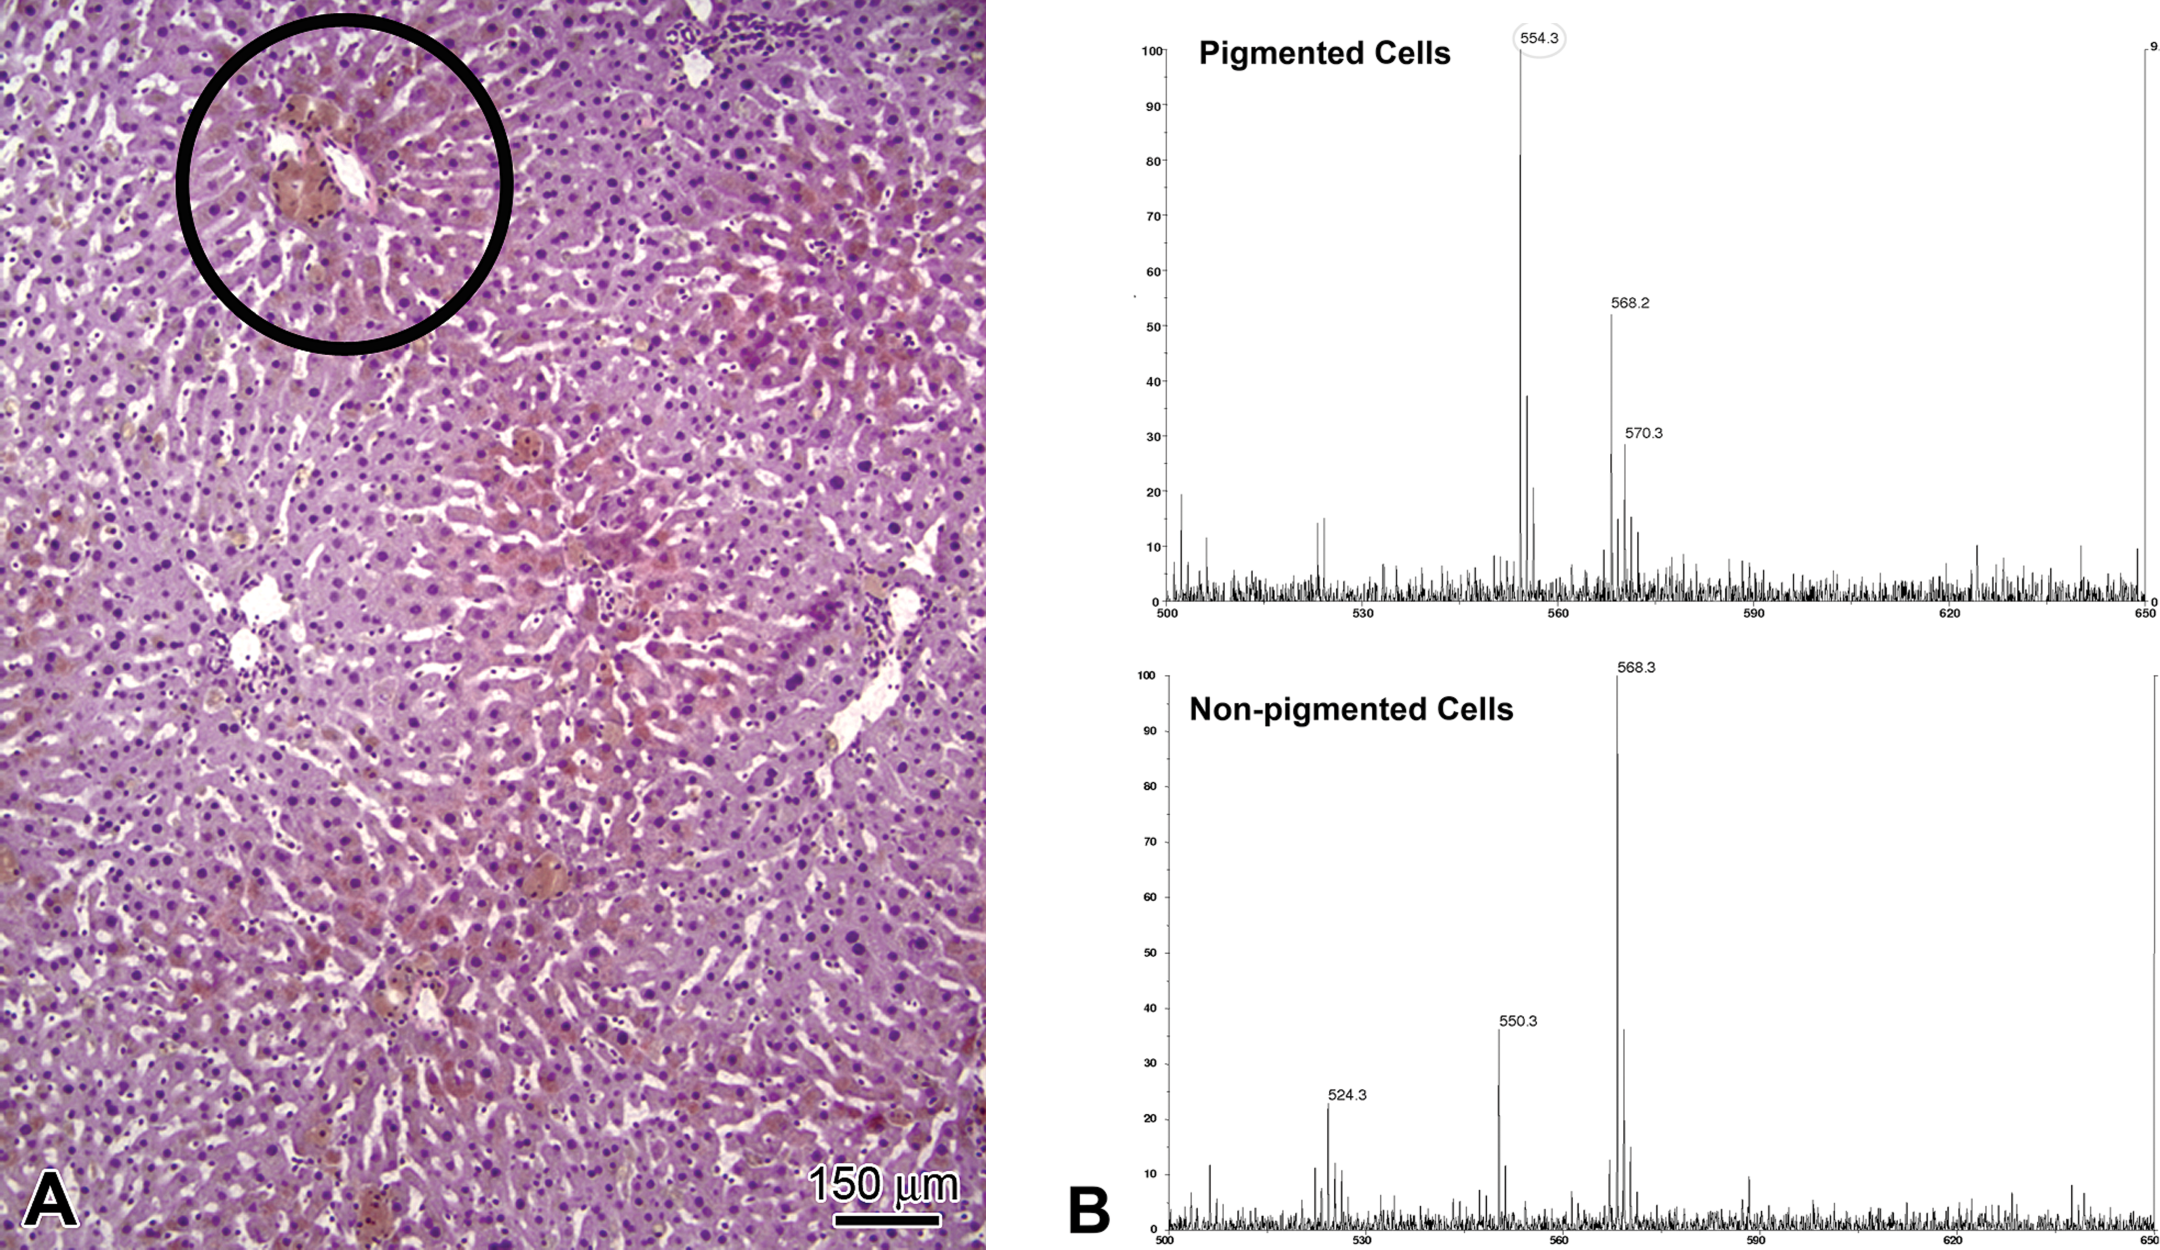
Rat liver, hematoxylin and eosin (HE) and matrix-assisted laser desorption ionization (MALDI) mass spectrometry. (A) Circle in HE indicates pigmented area representative of those collected by laser capture microdissection. (B) MALDI spectra, peak at m/z = 554.28 corresponds to parent compound, detected only in pigmented cells.
TEM to Characterize Hematologic Findings
TEM can clarify hematologic findings, as illustrated by a recent report of transient macrothrombocytopenia in a normal beagle dog (Bodie et al. 2011). The condition was discovered fortuitously during prestudy baseline hematology assessment and prevented the dog from being included in a preclinical toxicity study, where the transient nature of thrombocytopenia could have confounded toxicity assessments. Other clinical chemistry and hematology parameters were normal, and there were no coagulation abnormalities. The β-1 tubulin gene was sequenced for a microtubule defect associated with macrothrombocytopenia in Cavalier King Charles Spaniels (Davis et al. 2008); however, the gene sequence in the beagle dog was normal. Ultrastructure of enlarged platelets was characteristic of immature, rather than abnormal, platelets; TEM confirmed that microtubules were structurally normal (Figure 6). However, enlarged platelets contained a prominent canalicular system that is normally reduced in mature platelets, as well as well-developed rough endoplasmic reticulum and Golgi apparatus, also characteristic of immature platelets (Zucker-Franklin 1980). The authors concluded that an autoimmune condition was likely responsible for the macrothrombocytopenia.
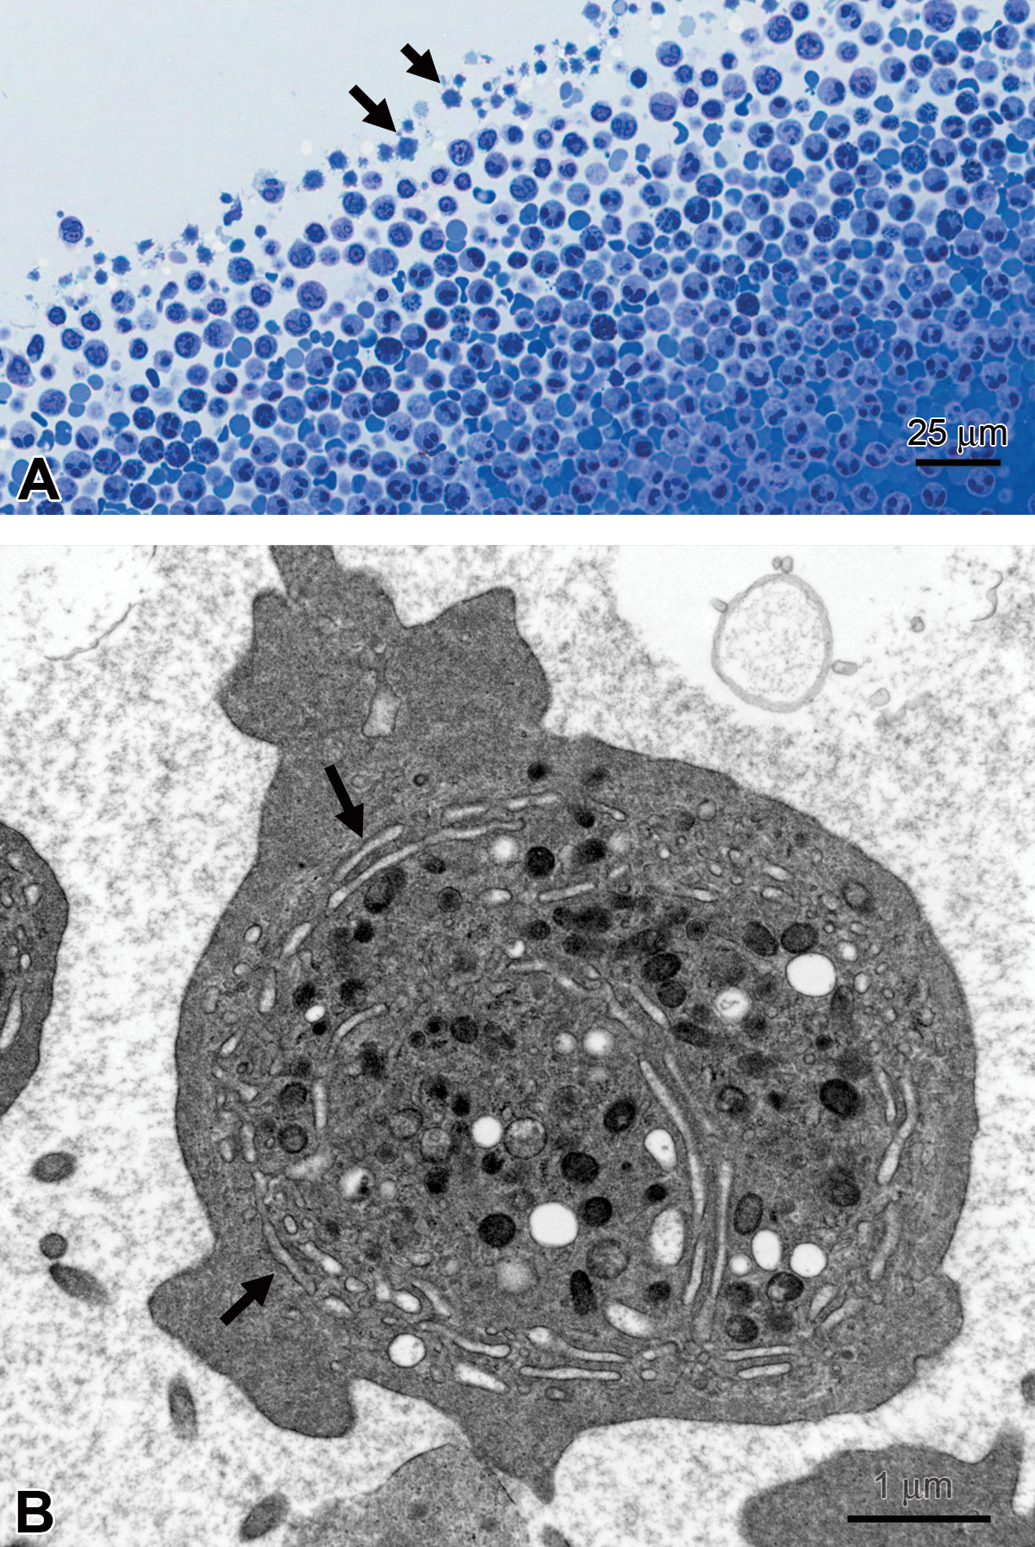
Dog platelets. (A) Enlarged platelets (arrows), T-blue. (B) Immature platelet with prominent canalicular system (arrow), transmission electron microscopy.
Ultrastructural evaluation explained an anomalous hematologic finding in a rat study in which lymphocytosis was unexpectedly reported from automated hematology evaluation. Upon examination of peripheral blood smears from the study, large numbers of nucleated erythrocytes were determined to be responsible for the apparent increase in lymphocytes identified by the automated hematology analyzer. In addition, in histologic sections of spleen, there were numerous apparent erythroid precursors and small deeply basophilic round bodies that resembled apoptotic bodies, lymphocytes, or erythrocyte nuclei. Ultrastructural evaluation allowed unequivocal identification of the erythroid precursors and determined the round bodies to be erythrocyte nuclei (Figure 7). This information in conjunction with other study data led to the conclusion that administration of the test compound resulted in aberrant erythropoiesis, a determination that assisted the project team in a decision to deprioritize the compound from further development.
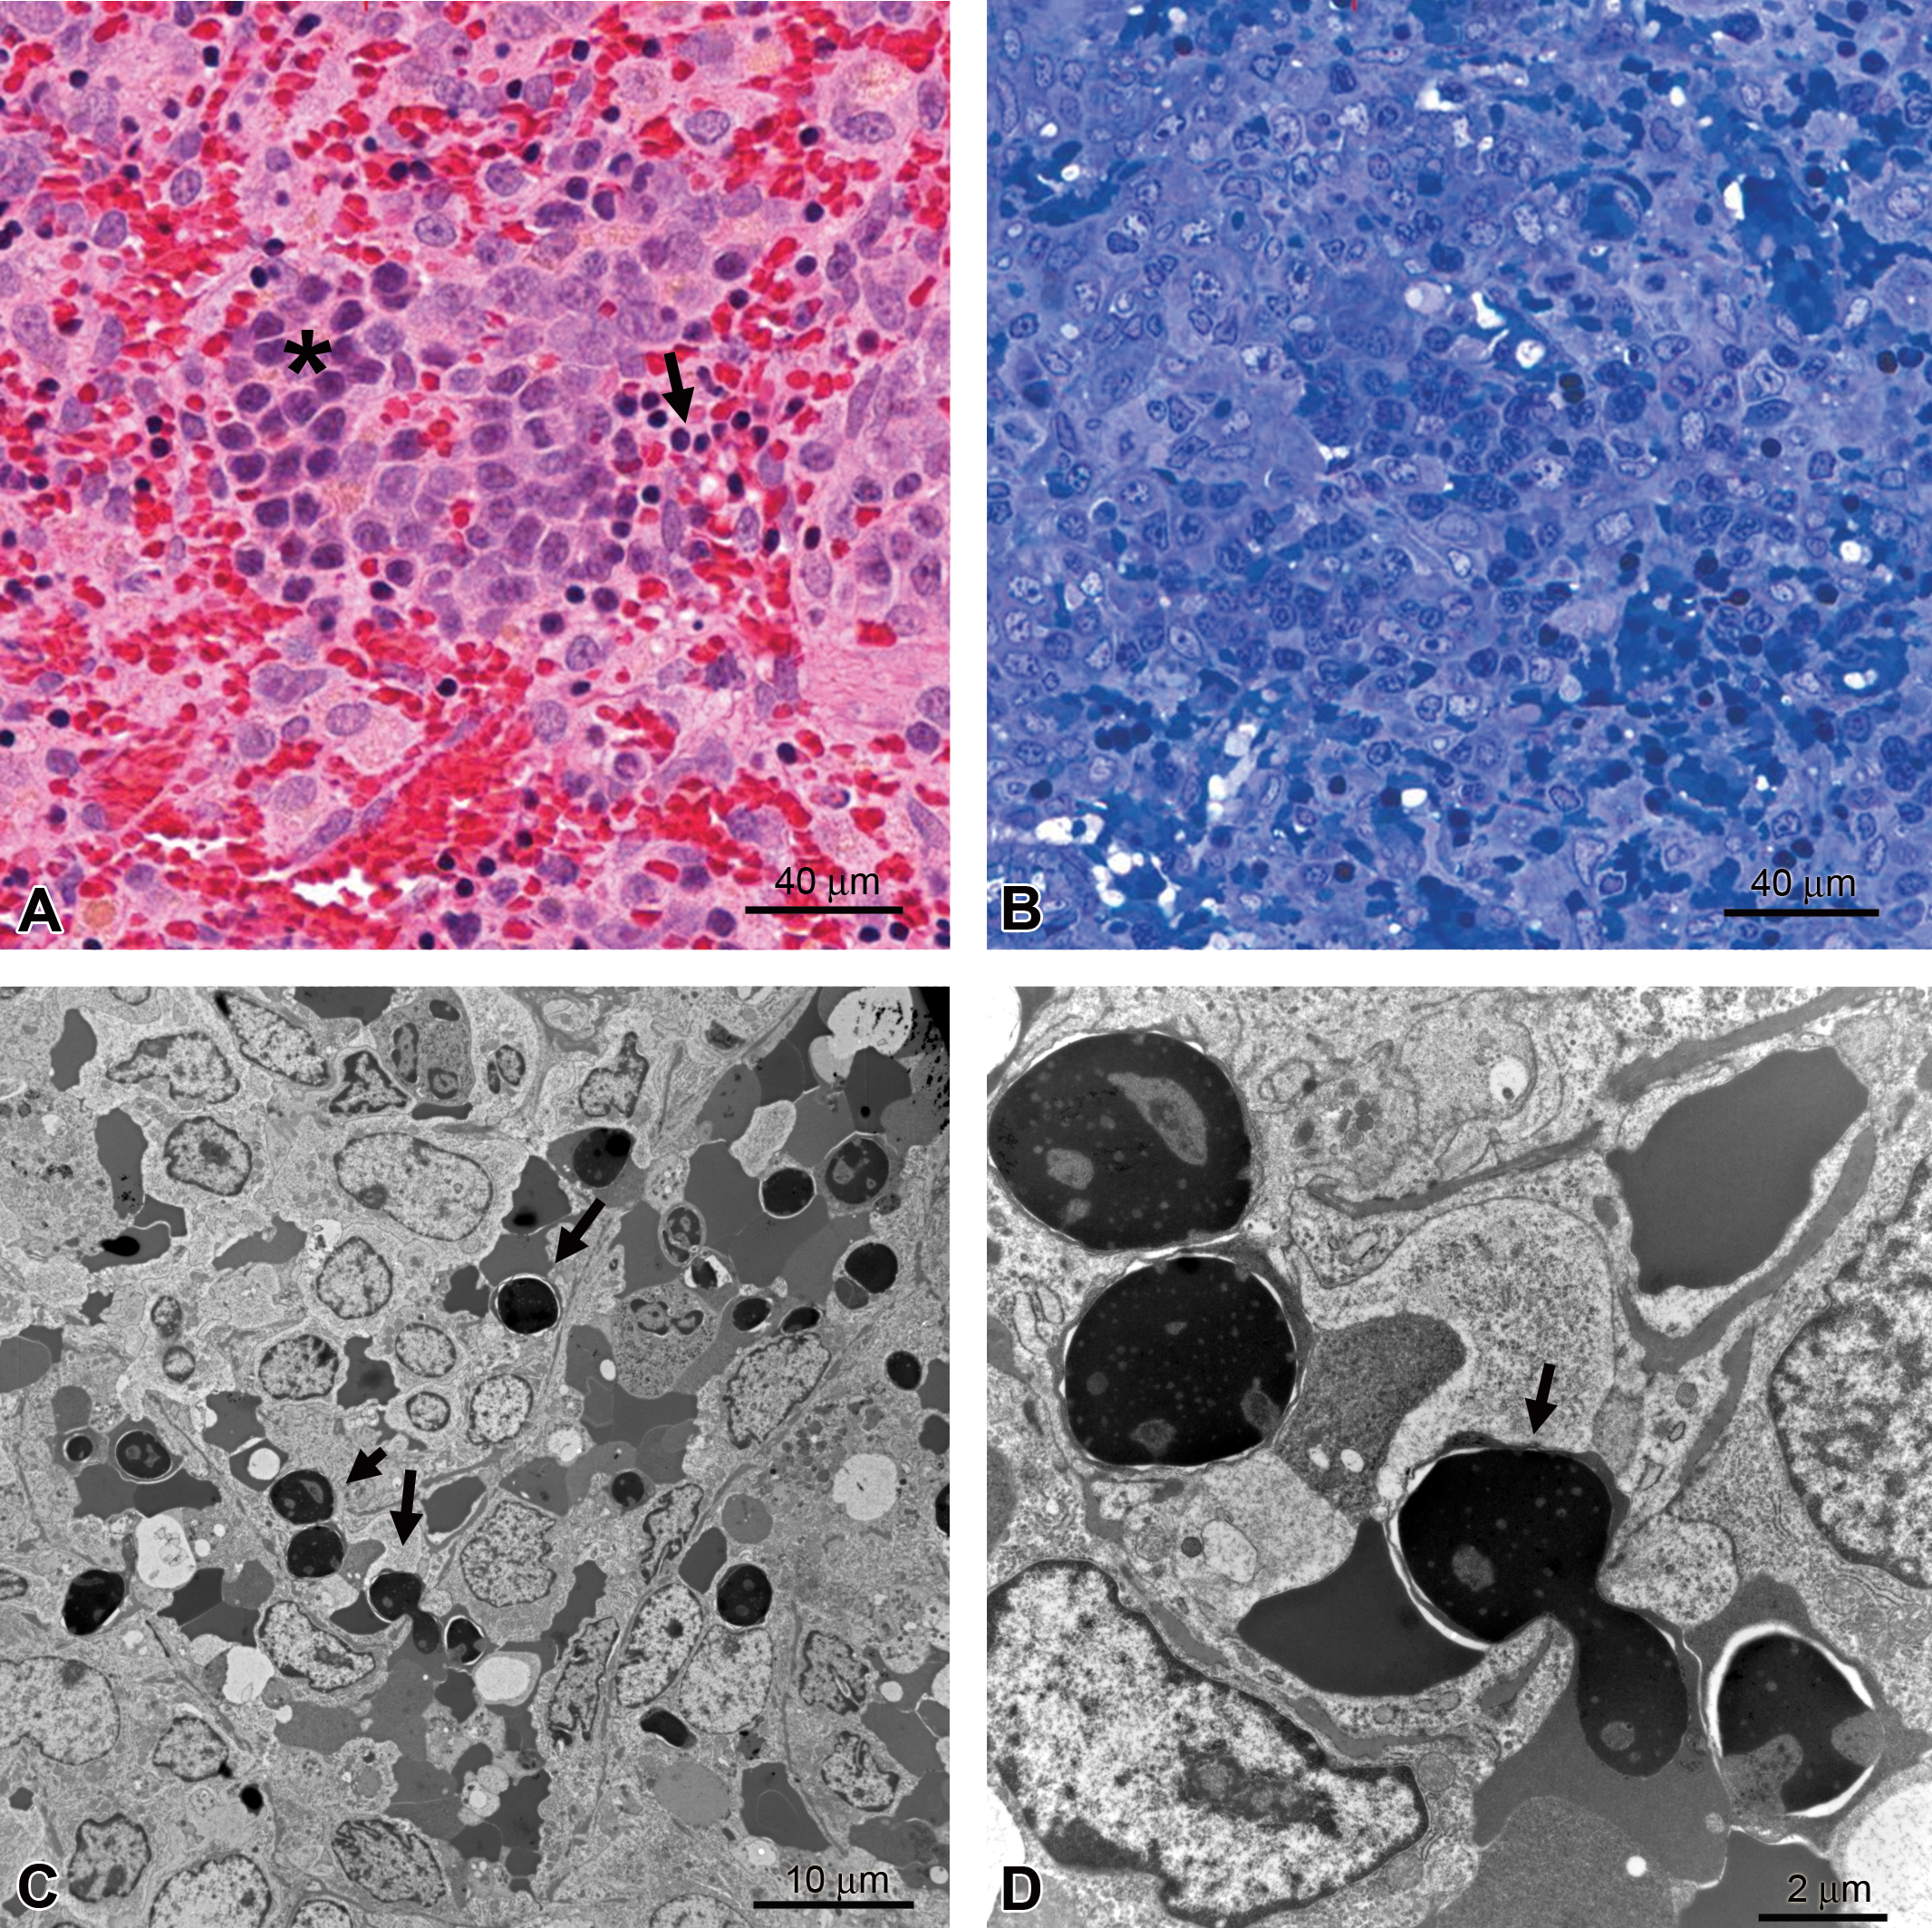
Rat spleen. (A) Erythroid precursors (asterisk) and dense round bodies (arrow), hematoxylin and eosin. (B) T-blue section of comparable area. (C) Round bodies are erythrocyte nuclei (arrows), transmission electron microscopy. (D) Higher magnification illustrating extrusion of erythrocyte nucleus (arrow), transmission electron microscopy.
TEM to Characterize Models and Biomarkers
TEM is a valuable adjunct to other endpoints in characterizing animal models of human disease that can be used in preclinical efficacy studies. TEM is particularly useful in renal models of glomerular injury, as subtle glomerular changes are not always detected by LM, even when there is functional evidence of damage (e.g., proteinuria). One commonly used model is the puromycin aminonucleoside (PAN) model, in which glomerular injury is induced by a single injection of PAN (Ryan and Karnovsky 1975). TEM was used to verify that the model was working as intended and that morphologic changes in glomerular podocytes (e.g., foot process effacement) reported in the literature were present and correlated in severity with protein levels in urine (Figure 8). These results validated the use of urinary protein levels in future efficacy studies with test compounds to assess reversal of glomerular injury.
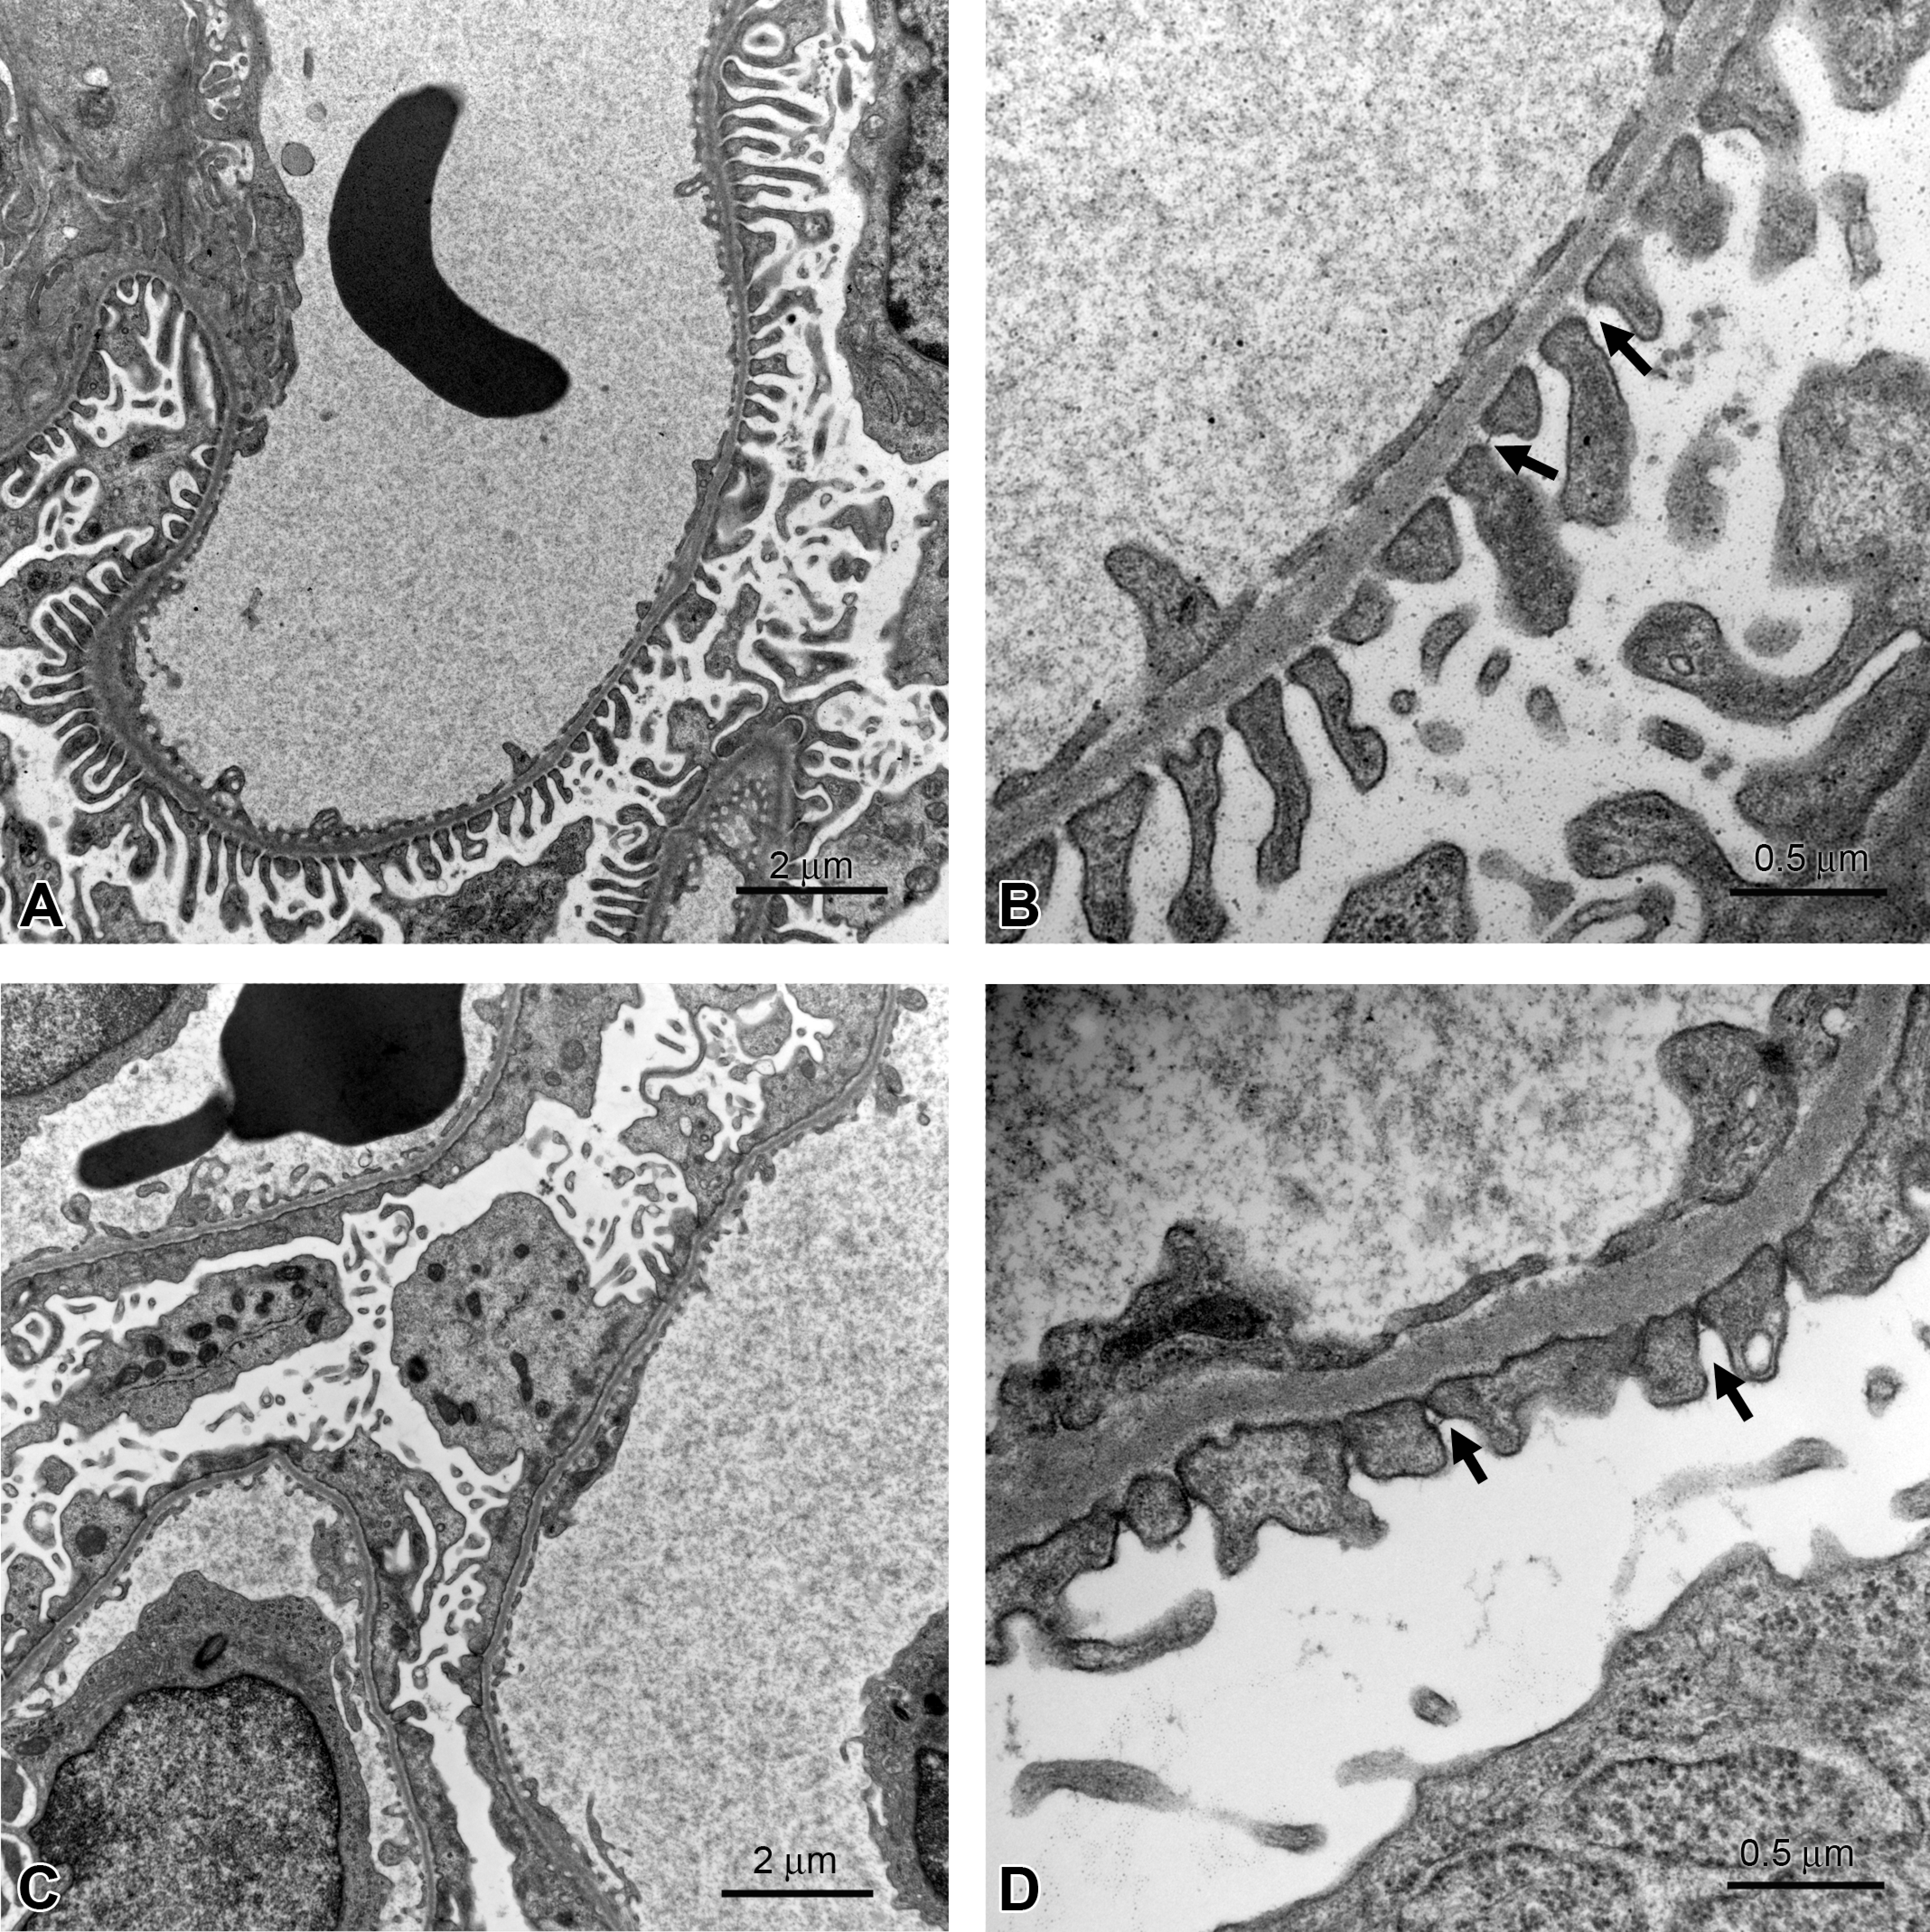
Rat kidney, glomerulus, puromycin aminonucleoside (PAN) model, transmission electron microscopy. (A, B) Control with normal podocyte filtration slits (arrows in B). (C, D) PAN-dosed rat with occluded filtration slits (arrows) and thickened basement membrane. Urinary protein levels in the PAN-dosed rat were approximately 65-fold higher than those in the control rat.
TEM corroborated the use of albumin and osteopontin as sensitive biomarkers of glomerular injury in a 7-d toxicity study of a compound known to induce glomerular damage (Buck et al. 2009; Yang et al. 2010). After only 4 d of dosing, increased urinary albumin and osteopontin levels were detected using the Mesoscale Multiplex Rat Kidney Toxicity Panel. By LM, only an increase in mesangium was detected, but TEM confirmed several changes indicative of injury to podocytes (i.e., effacement of foot processes and presence of intracytoplasmic electron-dense droplets). Thus, TEM evidence provided support for efforts to identify novel and sensitive biomarkers of kidney toxicity (Bonventre 2010).
Assessing models of nerve injury with TEM has also proved useful. In one experimental model, myelin oligodendrocyte glycoprotein is injected into rats to produce experimental autoimmune encephalitis (Mi et al. 2007). The optic nerve can then be evaluated to assess the efficacy of agents to reverse demyelination. In this model, TEM clearly showed the progression of demyelinating change with increasing numbers of unmyelinated axons and phagocytosed myelin remnants between day 17 and 24 postinjection (Figure 9), demonstrating the potential utility of TEM to confirm remyelination in efficacy studies.
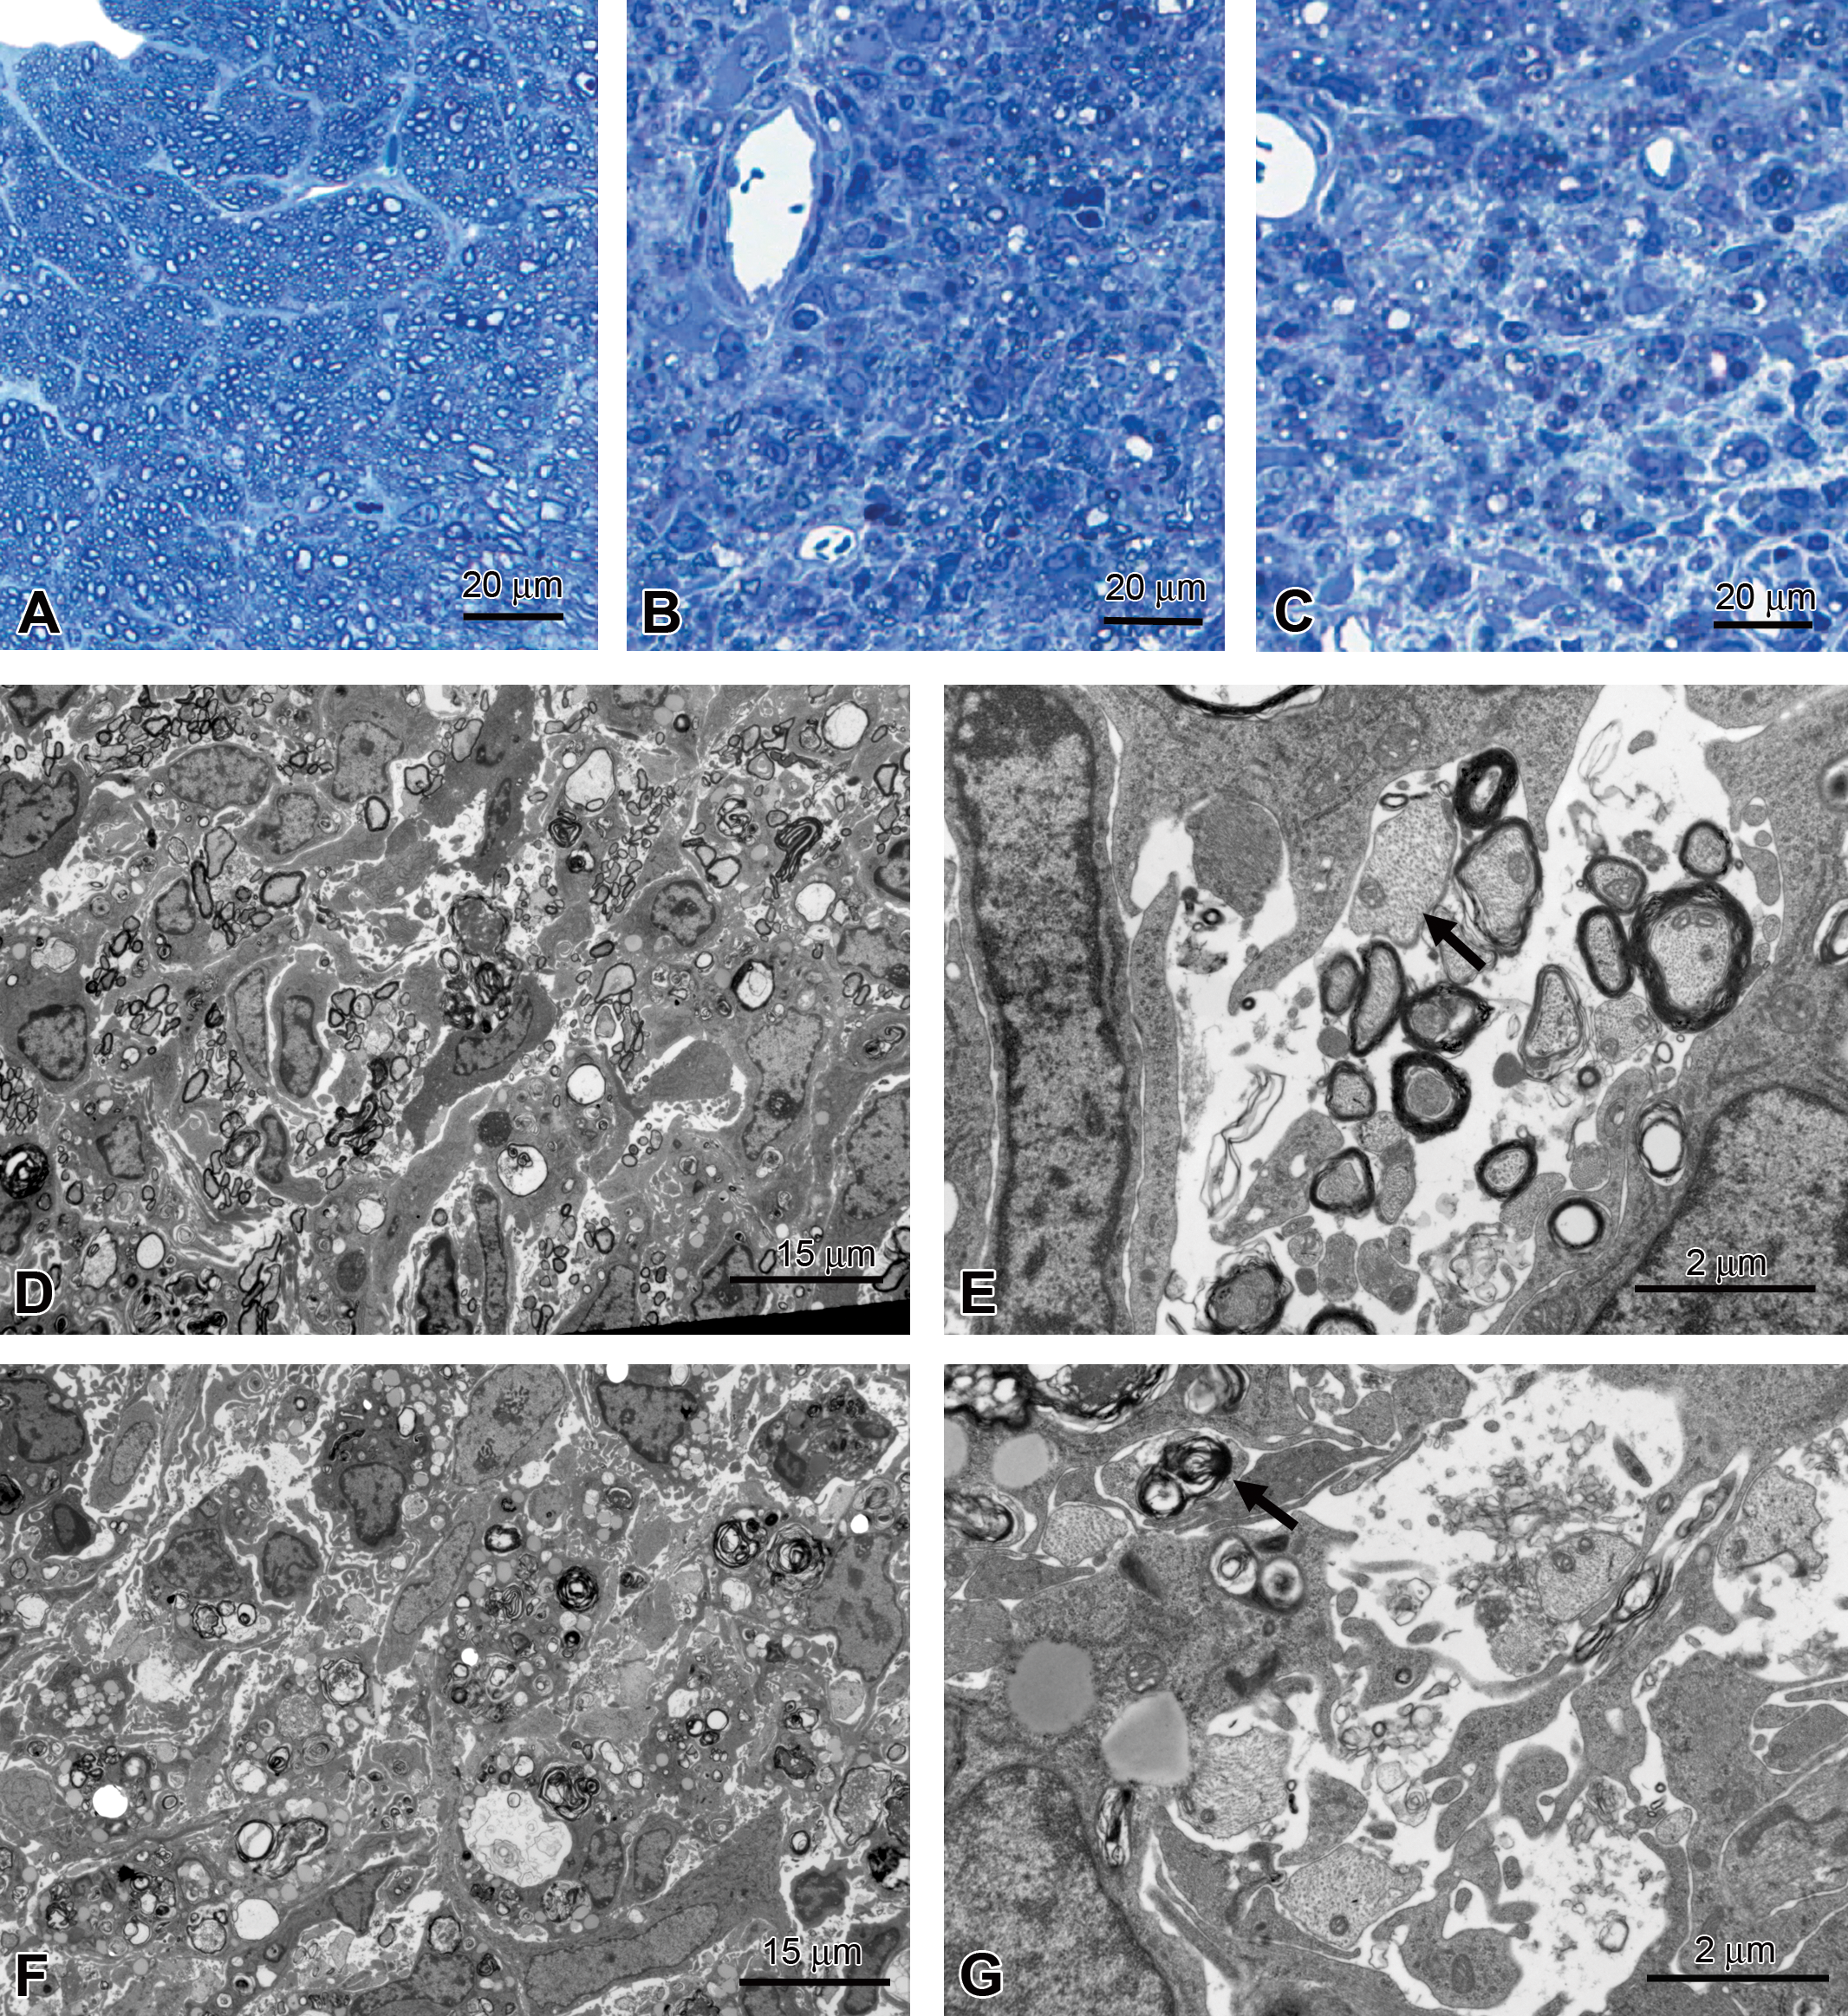
Rat optic nerve, myelin oligodendrocyte glycoprotein–induced experimental autoimmune encephalitis. (A) Control rat. (B, D, E) Seventeen days postinjection, demyelination and influx of inflammatory cells; arrow in E indicates unmyelinated axon. (C, F, G) Twenty-four days postinjection, increased numbers of unmyelinated axons, presence of myelin fragments (arrow). T-blue (A–C), transmission electron microscopy (D–G).
Summary
TEM is a low-throughput, high-content method that can contribute to toxicologic pathology assessments in preclinical toxicity and efficacy studies. While often considered an arduous methodology, several technological improvements have made it less onerous. Current generation instruments are more user-friendly, with electronic controls and automatic adjustments replacing cumbersome manual procedures. A valuable feature for assessing specimens from preclinical safety studies is specimen relocation software used with specimen holders that hold more than one specimen grid. This allows quick comparisons to be made between specific areas in control and experimental animals without having to switch sample grids and risk losing the location of areas of interest. Digital imaging has revolutionized image acquisition, replacing hours of darkroom work with simple capture of images that can be directly incorporated into reports, presentations, and manuscripts. Whole-slide scanning instruments make it much easier to link LM with EM, even across geographically separate sites. For example, a study pathologist and electron microscopist, at different locations, can simultaneously view and discuss standard histological and semi-thin sections to confirm that areas of interest are represented in sections for TEM (Gagne et al. 2010).
The key to successful application of TEM to preclinical safety studies, however, is not technological but rather human. It is important to carefully plan ultrastructural studies, to formulate specific questions before carrying them out, to carefully collect and prepare specimens, and to safeguard accurate interpretation of ultrastructural findings by applying the guidelines presented here. TEM remains a valuable tool for assessing preclinical safety in the development of new therapeutic agents.
Footnotes
Acknowledgments
The authors acknowledge the contributions of the following individuals: Peter Bousquet, Brad McRae, and Annette Schwartz (Abbott Laboratories) for studies using the experimental autoimmune encephalitis model; Laura Miesbauer (Abbott Laboratories) for carrying out the MALDI analysis; Zhi Su and Xiaoqin Liu (Abbott Laboratories) for studies using the PAN model; Sabine Halm (Abbott Laboratories), study pathologist on the dog liver vacuolation example; and David Cugier (Abbott Laboratories) for excellent electron microscopy technical assistance.
The authors declared no potential conflicts of interests with respect to the authorship and/or publication of this article. The authors received no financial support for the research and/or authorship of this article.