
Abstract
Peroxisome proliferator-activated receptor gamma (PPARγ) agonists and PPARγ/α dual agonists are used in the treatment of type 2 diabetes mellitus and hyperlipidemias. In carcinogenicity studies, some of these agonists induced hemangiomas/hemangiosarcomas in mice, but not in rats. We hypothesized that increased endothelial cell (EC) proliferation may be involved in the mechanism of PPAR agonist–induced vascular tumors in mice. We previously showed that the sarcomagenic PPARγ agonist troglitazone (TG) increased EC proliferation in brown and white adipose tissue and liver in mice at sarcomagenic doses (400 and 800 mg/kg) after four weeks of treatment. In vitro, TG had a mitogenic effect on mouse microvascular mouse ECs by increasing cell proliferation and survival. The current studies showed that treatment of mouse ECs in vitro induced alterations in proliferation pathway gene expression, especially the expression of insulin-like growth factor-1, but had no effect on mouse oxidative stress pathways. In vivo, treatment with vitamin E did not inhibit TG-induced EC proliferation in liver and adipose tissue. In addition, no hypoxic effect was detected in adipose tissue of TG-treated mice; however, TG had a minor effect on hepatocellular hypoxia. These results provide additional evidence supporting a direct mitogenic effect in the mode of action of TG-induced hemangiosarcomas in mice.
Keywords
Introduction
Hemangiosarcomas (HS) are aggressive malignant tumors characterized by the formation of irregular vascular structures and consisting of multilayered or solid clusters of endothelial cells (ECs) (Hardisty et al. 2007; Rosai and Sobin 1998). Although the occurrence of spontaneous HS formation is rare in humans, HS have recently become the focus of considerable attention because a wide range of pharmaceutical and chemical agents are reported to increase the incidence of HS, primarily in mice in two-year carcinogenicity studies (Cohen et al. 2009). Numerous sarcomagenic agents in mice are non-DNA–reactive chemicals, and increased EC proliferation resulting in an elevation of spontaneous mutation may be involved in the mechanism (Cohen and Ellwein 1990; Cohen and Ellwein 1991; Cohen et al. 2009). However, more investigation is required to determine the mode of action for induction of mouse HS and their relevance to humans.
Peroxisome proliferator-activated receptor gamma (PPARγ) and PPAR α/γ dual agonists are non-DNA–reactive pharmaceuticals that have been developed for the treatment of type 2 diabetes mellitus. Many of them produced HS in mice but not in rats in two-year carcinogenicity studies (Aoki 2007; Cohen et al. 2009; Hardisty et al. 2007; Herman et al. 2002). Since the mechanism of chemical-induced HS in mice and its relevance to human risk are not known, HS in mice have made it more difficult to obtain approval of these pharmaceuticals, which contributes to the discontinued development of many of these compounds (Cohen et al. 2009).
Troglitazone (TG), a prototypical sarcomagenic PPARγ agonist, significantly increased the incidence of HS in female mice at 400 mg/kg and in both sexes at 800 mg/kg in multiple tissues, including liver and subcutaneous adipose tissue, in a two-year bioassay using B6C3F1 mice (Duddy et al. 1999; Herman et al. 2002). There was no sarcomagenic or carcinogenic effect in any tissue in Wistar rats (Duddy et al. 1999; Herman et al. 2002). We previously demonstrated that TG increased EC proliferation in liver and in brown (BAT) and white (WAT) adipose tissue in B6C3F1 female mice at the sarcomagenic doses administered by gavage for four weeks, at least in part through a direct mitogenic effect and inhibition of apoptosis on mouse microvascular ECs (Kakiuchi-Kiyota et al. 2009). Although we observed a direct proliferative and survival effect of TG on mouse ECs, little is known about the genes or gene networks that are directly altered by PPARγ agonists or PPARγ activation. We hypothesized that TG altered the expression of genes involved in proliferation and apoptosis in mouse ECs, contributing to increased EC proliferation observed in vivo and in HS formation. In the present study, mouse ECs (MFP MVEC) were treated with TG at the concentration that showed the greatest mitogenic effect (Kakiuchi-Kiyota et al. 2009), 5 µM for three days, and transcriptional profiles induced by TG were analyzed by microarray analysis.
In addition, we investigated the possibility that hypoxia and/or oxidative stress is involved in the mechanism of TG-increased EC proliferation in mice. Hypoxia is known to contribute to EC proliferation (Humar et al. 2002; Pugh and Ratcliffe 2003). Recently, Cohen et al. (2009) and Laifenfeld et al. (2009) indicated a possible role for localized tissue hypoxia associated with EC proliferation induced by the sarcomagenic chemical 2-butoxyethanol. Pregabalin, another sarcomagenic chemical, causes respiratory suppression followed by hypoxia (Cohen et al. 2009). An increased level of reactive oxygen species (ROS) is also known to stimulate proliferation in a wide variety of mammalian cells, including ECs (Martindale and Holbrook 2002; Stone and Collins 2002). Oxidative stress is implicated in HS formation in mouse liver caused by 2-butoxyethanol. Livers in 2-butoxyethanol-treated mice showed increased DNA synthesis in ECs along with evidence of increased oxidative stress, indicating increased levels of lipid peroxidation (malondialdehyde), oxidative damage to DNA (8-hydroxydeoxyguanosine adducts), and decreased levels of vitamin E, a major antioxidant in liver (Siesky et al. 2002). We hypothesized that, in addition to the direct proliferative effect of TG, tissue hypoxia and/or oxidative stress was involved in TG-induced EC proliferation that we observed in our previous mouse study.
In the present study, we investigated whether tissue hypoxia was induced in mice by TG treatment in liver and adipose tissue using pimonidazole hydrochloride (Hypoxyprobe-1 [HP-1, NPI, Burlington, MA]) as the hypoxia marker. Pimonidazole is reduced to a radical anion and forms adducts with thiol-containing proteins, peptides, and amino acids at oxygen concentrations less than 1.3%, considered to be hypoxic conditions (Varia et al. 1998). Pimonidazole-protein adducts can be detected by immunostaining using an anti-pimonidazole antibody as a primary antibody. Evidence has accumulated showing that pimonidazole staining detects hypoxic cells and is an effective marker of hypoxia (Arteel et al. 1995; Morani et al. 2006; Samoszuk et al. 2004; Varia et al. 1998). In addition, we investigated whether TG-induced EC proliferation was reduced by co-administration with vitamin E in mice. Mice fed a diet supplemented with α-tocopheryl acetate, which is the most biologically active form of vitamin E, at 1,000 IU/kg showed slightly, but consistently higher liver and serum vitamin E levels without any abnormal clinical or histopathological findings (personal communication, Dr. Jon Cook and Kimberly Navetta). Previous publications also showed that diet supplemented with 1,000 IU/kg vitamin E increased hepatic α-tocopherol concentrations and reduced lipid peroxidation (Ibrahim et al. 1997; Knight et al. 2003). Taken together, if TG-induced EC proliferation in mice involves increased oxidative stress, the Ki-67/CD31 labeling index (LI) of ECs should be reduced by co-administration of vitamin E with TG.
The purposes of the current investigation were to: (1) determine the transcriptional changes directly induced by TG in mouse ECs using cultured cells; and (2) evaluate whether hypoxia and/or oxidative stress was involved in TG-increased EC proliferation in mice after treatment for four weeks.
Materials and Methods
Test Article
Troglitazone (purity: 99.5%) was kindly provided by Bristol Myers Squibb Co. and used as received. In the in vitro studies, stock solutions of TG were prepared by dissolving in dimethyl sulfoxide (Sigma, St. Louis, MO) and diluting in appropriate cell culture medium to 0.01–5 µM before addition to the cells. The dimethyl sulfoxide concentration in TG working solutions was 0.1%. In in vivo studies, the administered dose (400 mg/kg) was the sarcomagenic dose in the two-year bioassay in B6C3F1 mice (Herman et al. 2002), and this dose increased EC proliferation in liver, BAT, and WAT in B6C3F1 mice after a four-week treatment (Kakiuchi-Kiyota et al. 2009). Troglitazone was prepared daily in vehicle, 0.5% methylcellulose (MC), purchased from Sigma, and stirred approximately thirty minutes before and during administration. Vitamin E (dl-α tocopheryl acetate) was purchased from Seltzer Ingredients (Carlsbad, CA).
Study 1: Investigation of Transcriptional Profile in TG-Treated Mouse ECs
Cell Line
Mouse mammary fat pad microvascular endothelial cells (MFP MVEC; Kakiuchi-Kiyota et al. 2009) were provided by Dr. Joseph Vetro (University of Nebraska Medical Center, Omaha, NE). They were isolated from mammary fat pad (MFP) of two female H-2Kb-ts-A58 mice (Immortomice, Charles River Laboratories). Briefly, Immortomice (Jat et al. 1991) carry a temperature-sensitive mutant of SV40 large T antigen under the control of the H-2Kb promoter (activated by interferon-γ), which can be used to conditionally immortalize isolated primary cells when grown at a permissive temperature (33°C). Mammary fat pad microvascular endothelial cells were isolated from heterogeneous cultures of MFP by fluorescence-activated cell sorting (FACSAria, BD Biosciences, San Jose, CA) by double staining for TNF-α inducible VCAM1/E-selectin expression (Langley et al. 2003) using fluorescein isothiocyanate (FITC)-labeled rat anti-mouse CD106/VCAM1 (1.5 µg/1×106 cells) and R-phycoerythrin (PE)-conjugated rat anti-mouse CD62E/Eselectin (3.0 µg/1×106 cells), all from BD Biosciences. Mammary fat pad microvascular endothelial cells were cultured on 0.2% gelatin (Sigma)-coated flasks in Gibco DMEM supplemented with 2 mM GlutaMax, 1 mM sodium pyruvate, 0.1 mM MEM nonessential amino acids, 1× MEM vitamins, 100 units/mL penicillin, 100 µg/mL streptomycin, 0.25 µg/mL amphotericin B (Fungizon), 40 µg/mL gentamicin (all from Invitrogen, Carlsbad, CA), and 10% heat-inactivated fetal bovine serum (FBS; Atlanta Biologicals, Lawrenceville, GA) in an atmosphere of 95% air and 5% CO2 at 33°C for routine expansion and at 37°C for at least five days before experiments for the in vivo studies.
RNA Isolation and Microarray Analysis
Immediately after seeding (1×10⁵ cells/well) to 6-well plates, mammary fat pad microvascular endothelial cells incubated with 1% FBS were treated with or without a mitogenic concentration (5 µM) of TG for three days. Total RNA from each sample was isolated using an RNeasy Plus Micro Kit (Qiagen, Valencia, CA). The RNA was quantified by optical density measurements (Nanodrop 1000, Thermo Fisher Scientific, Waltham, MA), and used as a template to generate cDNA using WT-Ovation Pico RNA Amplification System (Nugen Technologies, Inc., San Carlos, CA). The cDNA generated was fragmented and biotin labeled using FL-Ovation cDNA Biotin Module V2 (Nugen). Fragmented biotin-labeled cDNA was hybridized to an individual Mouse Genome 430 2.0 Array (Affymetrix, San Carlos, CA) representing 39,000 transcripts and variants including 34,000 well-characterized mouse genes. The arrays were washed, stained, and scanned under low photomultiplier tube setting. Quality metric parameters including noise level, background, and the efficiency of transcription were ascertained for all hybridizations. The array results were normalized by Microarray Suite 5.0 (Affymetrix) to identify differentially expressed genes and associated fold changes.
Gene Expression Analysis
Data cleansing was performed to remove the values for which fluorescent intensity was too low compared with negative controls. Next, a gene demonstrating significant differences between an untreated group and a TG-treated group was selected by the Welch t test. To limit the number of false positives, only genes whose p value was less than .01 were selected.
Target Gene Analysis of PPARγ Signaling
To determine whether a gene whose expression was changed by TG treatment is a target gene of PPARγ signaling or not, Transcriptional Regulatory Element Database (TRED) was employed (Zhao et al. 2005). Transcriptional Regulatory Element Database collects cis-regulatory elements, such as promoters, and trans-regulatory elements, such as transcription factors, to provide and predict the gene regulatory networks.
Pathway Analysis
Biologically relevant pathways were constructed using pathway analysis software from Ingenuity Systems (ingenuity pathway analysis: IPA, Redwood City, CA). The differentially expressed genes (p < .01) containing Affymetrix identifiers and associated log-ratio changes (log2 base) were uploaded for IPA analysis to generate networks of interacting genes and other functional groups. The application queries the Ingenuity Pathways Knowledge Base for interactions between focus genes and all other gene objects stored in the knowledge base, and it then generates a gene set with a network size of approximately thirty-five genes or proteins.
Validation of Gene Expression Change (Insulin-Like Growth Factor-1)
Immediately after seeding (1 × 10⁵ cells/well) to six-well plates, MFP MVEC were treated with or without 0.01, 0.1, 1, and 5 µM TG under reduced concentration of growth factors (1% FBS) for three days. Total RNA from each sample was isolated using RNeasy Plus Micro Kit (Qiagen), and cDNA was synthesized as previously described (Kakiuchi-Kiyota et al. 2009). One microliter of first-strand cDNA was amplified using the following primer sets:
GAPDH (product size: 150 bp)
(forward)
5′-AAGGGCTCATGACCACAGTC-3′
(reverse)
5′-GGATGACCTTGCCCACAG-3′
Insulin-like growth factor-1 (product size: 151 bp)
(forward)
5′-TGCAAAGGAGAAGGAAAGGA-3′
(reverse)
5′-TGTTTTGCAGGTTGCTCAAG-3′
Polymerase chain reactions (PCR) were carried out using FastStart SYBR Green Master mix (Roche, Alameda, CA) and a MyIQ iCycler (Bio-Rad, Hercules, CA). The following thermocycling conditions were employed: 95°C for ten minutes, followed by 95°C for thirty seconds, 60°C for sixty seconds, and 72°C for thirty seconds for thirty-five cycles. Fluorescence intensity was measured at the end of each elongation step as a means to evaluate the amount of formed PCR product. Each cDNA sample was run in duplicate, and the corresponding sample with no cDNA was included as a negative control. Glyceraldehyde-3-phosphate dehydrogenase was used as a reference to normalize the samples. Insulin-like growth factor-1 expression between untreated and TG-treated MFP MVEC was analyzed by Student t test using Prism 5.01 (Released in September, 2007, GraphPad software, La Jolla, CA).
Study 2: Evaluation of Hypoxia in Liver and Adipose Tissue in TG-Treated Mice
Animals
Twenty-two female B6C3F1 mice (Charles River Breeding Laboratories, Kingston, NY), seven weeks old on arrival, were used in this study. Animals were group housed (five per cage) in plastic cages with dry corn-cob bedding and acclimated in quarantine approximately one week prior to treatment. The animal room was on a twelve-hour light/dark cycle at a targeted temperature of 22°C ± 2°C and humidity of 50% ± 20%. Food (Certified Purina 5002, Dyets, Bethlehem, PA) and tap water were available ad libitum throughout the study. The protocol was approved by the University of Nebraska Medical Center Institutional Animal Care and Use Committee, and the level of care provided to the animals met or exceeded the basic requirements outlined in the Guide for the Care and Use of Laboratory Animals (NIH publication #86-23, revised 1986).
Experimental Design
Mice were randomized into two groups of eleven mice each using a weight stratification method (Martin et al. 1986), and they were treated with vehicle (0.5 % MC) or 400 mg/kg TG. Vehicle or TG was administered by oral gavage once daily in the morning, seven days/week for four weeks. The dose volume was 10 mL/kg body weight. Water and food consumption were measured during week 3 of the study, and body weights were measured weekly. After treatment for four weeks, two and a half hours prior to sacrifice, 100 mg/kg HP-1 diluted in saline was injected i.p. into ten mice in each group (10 mL/kg). As the negative control for hypoxia staining, one mouse in each group was injected i.p. with saline. All mice were sacrificed between 9:00 a.m. and 12:00 p.m. by an overdose of nembutal (150 mg/kg of body weight, i.p.). Heart, liver, and interscapular adipose tissue, including BAT and WAT, were removed, and the heart and adipose tissue were weighed prior to fixation. The relative weight of these tissues per body weight was calculated. All tissue was fixed in ice-cold 10% neutral buffered formalin, embedded in paraffin, and sectioned for hematoxylin and eosin staining for histopathological evaluation. A diagnosis of mild mammary ductal hyperplasia was made when there were three cell layers in the mammary gland duct, and a diagnosis of moderate ductal hyperplasia was made when four or more layers were present. Unstained slides were used for immunological detection of tissue hypoxia.
Immunohistochemistry for the Hypoxia Marker
There are several reports in the literature showing the effectiveness of immunohistochemical detection of pimonidazole hydrochloride (HP-1) using an anti-pimonidazole antibody as a primary antibody to detect hypoxic cells (Arteel et al. 1995; Morani et al. 2006; Samoszuk et al. 2004; Varia et al. 1998). In a preliminary study to validate the method in our laboratory, increased HP-1 staining was observed in liver tissue collected from male B6C3F1 mice treated for seven days with 2-butoxyethanol (data not shown). Immunostaining for the hypoxia marker HP-1 was performed using the protocol provided by the manufacturer (http://www.hypoxyprobe.com) and verified in our laboratory, with some modifications. Briefly, after deparaffinization of the sections and exposure of the slides to 3% H2O2 for five minutes to quench endogenous peroxidase, epitope retrieval was performed in 10 mM citrate buffer, pH 6.0 at 55°C for twenty minutes according to the manufacturer’s direction. After incubation with 1% nonfat milk used for blocking nonspecific reactions, the sections were incubated overnight at approximately 4°C with monoclonal mouse anti-HP-1 antibody, clone 4.3.11.3, directly conjugated with FITC, and diluted 1:25. After washing with phosphate-buffered saline, the sections were incubated with rabbit anti-FITC antibody conjugated with horseradish peroxidase as a secondary antibody and diluted 1:50. Positive reactions for hypoxia resulted in brown nuclear and/or cytoplasmic staining with the DAB substrate kit (Vector Laboratories, Burlingame, CA). Hypoxic staining in liver and BAT was determined microscopically by the number of positive-stained nuclei in approximately 1,000 hepatocytes or adipocytes, respectively. Since mouse liver is hypoxic even under normal conditions (Van Os-Corby et al. 1987; Samoszuk et al. 2004; Morani et al. 2006), the liver tissue from each female mouse was used as the positive control for hypoxia detection. Liver tissue from the one mouse per group injected with saline instead of HP-1 prior to sacrifice was included as the negative control.
Study 3: Investigation of the Effect of Vitamin E Treatment on TG-Increased EC Proliferation in Mice
Animals
Forty female B6C3F1 mice (Charles River Breeding Laboratories), six weeks old on arrival, were used in this study. Animals were group housed (five per cage) in plastic cages with dry corn-cob bedding and acclimated in quarantine for fourteen days prior to treatment. The animal room was on a twelve-hour light/dark cycle at a targeted temperature of 22°C ± 2°C and humidity of 50% ± 20%. Food and tap water were available ad libitum throughout the study. The protocol was approved by the University of Nebraska Medical Center Institutional Animal Care and Use Committee, and the level of care provided to the animals met or exceeded the basic requirements outlined in the Guide for the Care and Use of Laboratory Animals (NIH publication #86-23, revised 1986).
Experimental Design
Twenty-two B6C3F1 female mice were fed semi-synthetic basal diet (AIN-76A, Dyets Inc.) with or without vitamin E supplementation (1,000 IU/kg) for fourteen days prior to and during oral gavage treatment with 0.5% MC or TG. The background level of vitamin E in the basal diet was 50 IU/kg. Within each diet, at eight weeks of age animals were randomized into two groups of ten mice each using a weight stratification method (Martin et al. 1986) and treated with vehicle (0.5% MC) or 400 mg/kg TG. Vehicle or TG was administered by oral gavage once daily in the morning, seven days/week for four weeks, and the dose volume was 10 mL/kg body weight. Water and food consumption were measured during week 3 of the study, and body weights were measured weekly. All mice were sacrificed between 9:00 a.m. and 12:00 p.m. by an overdose of nembutal (150 mg/kg of body weight, ip) after treatment for four weeks. Heart, liver, and dorsal BAT with adjacent WAT were removed. The heart and adipose tissue, including BAT and WAT, were weighed prior to fixation, and the relative weight of these tissues per body weight was calculated. All tissue was immediately fixed in 10% phosphate buffered formalin, embedded in paraffin, and sectioned for hematoxylin and eosin staining for histopathological evaluation. Mammary ductal hyperplasia was diagnosed as described above. Unstained slides were used for dual immunohistochemical analysis.
Immunohistochemical Analysis of EC Proliferation
Dual immunostaining of liver, BAT, and WAT using rat anti-mouse Ki-67 (1:25, TEC-3; DAKO, Carpinteria, CA) as a marker of DNA replication and mouse anti-human CD31 (1:25, Clone; JC70A, DAKO) as a marker to detect EC proliferation was performed as described previously (Kakiuchi-Kiyota et al. 2009). Endothelial cell proliferation in liver, BAT, and WAT was determined microscopically by counting the number of Ki-67–positive cells (nuclear staining) in approximately 1,000 CD31-positive cells (cytoplasmic membrane staining) in each tissue.
Statistical Analysis of Study 2 and Study 3
All values were reported as the mean ± SE. In Study 2, comparison of body weight, food and water consumption, and absolute and relative heart and adipose tissue weight were evaluated using the unpaired Student t test. Histological ductal hyperplasia was analyzed using the two-tailed Fisher exact test. Hypoxia staining was analyzed using the Mann-Whitney test. In Study 3, comparisons of body weight, food and water consumption, and absolute and relative heart and adipose tissue weight were evaluated using one-way analysis of variance followed by the Tukey multiple comparison test. Comparisons of incidences of fatty liver and ductal hyperplasia were analyzed using the two-tailed Fisher exact test. The Ki-67 LI in CD31-positive cells was analyzed using the Kruskal-Wallis test followed by the Dunn multiple comparison test. All statistical analyses were performed using Prism 5.03 (Released in January, 2010, GraphPad Software).
Results
Study 1
Gene Expression Changes
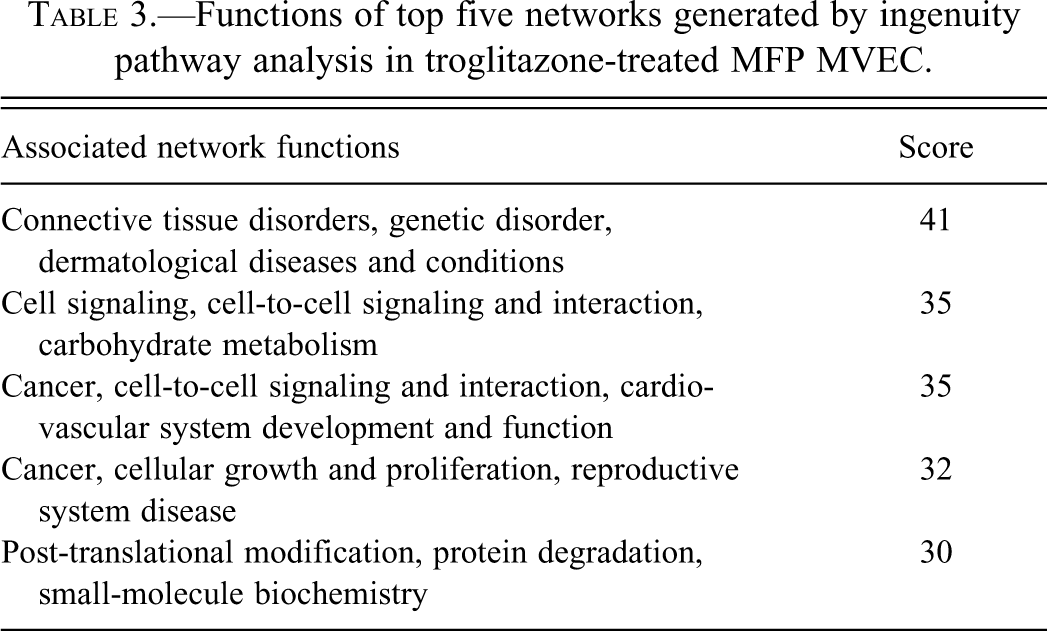
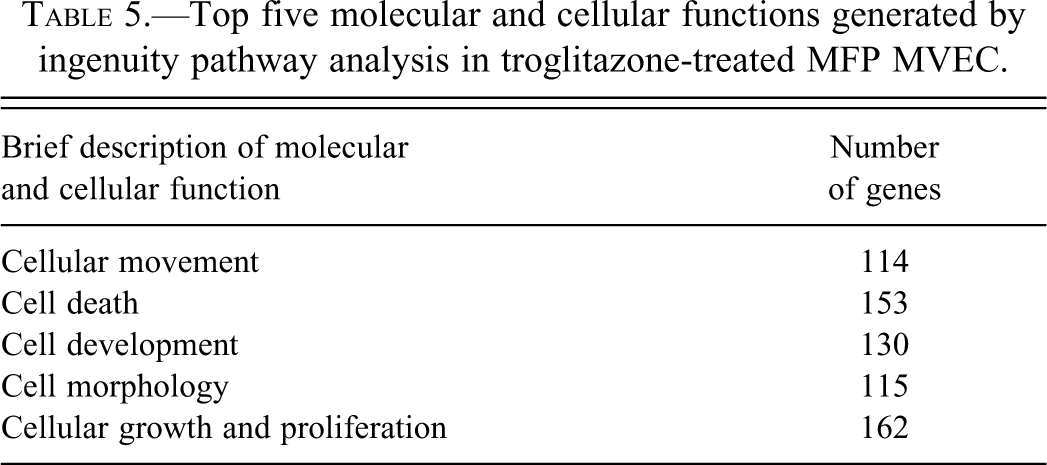
After data cleansing, there were 24,889 genes to be analyzed in MFP MVEC. In TG-treated MFP MVEC, 694 genes were selected by p < .01 compared with untreated cells. There were 465 genes up-regulated and 229 genes down-regulated. In these selected genes, the top ten genes up-regulated or down-regulated by TG treatment in MFP MVEC were detected by IPA and are listed in Tables 1 and 2. According to the TRED analysis, none of the ten genes was detected or predicted as downstream target genes of murine PPARγ signaling. In MFP MVEC, IPA generated networks listed in Table 3. Of these networks, we focused on the “Cancer, Cellular Growth and Proliferation, Reproductive Disease” network (Table 4) because of the direct proliferative effect and suppression of apoptosis detected in TG-treated MFP MVEC in our previous studies (Kakiuchi-Kiyota et al. 2009). The pathway network is shown with gene expression in MFP MVEC treated with the mitogenic dose of TG in Figure 1. In this network, insulin-like growth factor-1 (IGF1), which was the most highly up-regulated gene in MFP MVEC (approximately 2.2-fold, Table 1), was involved. Ingenuity pathway analysis also indicated that TG-induced gene expression changes many genes involved in cell death, cell growth and proliferation, and cell development in MFP MVEC (Table 5).
Genes up-regulated in troglitazone-treated MFP MVEC.
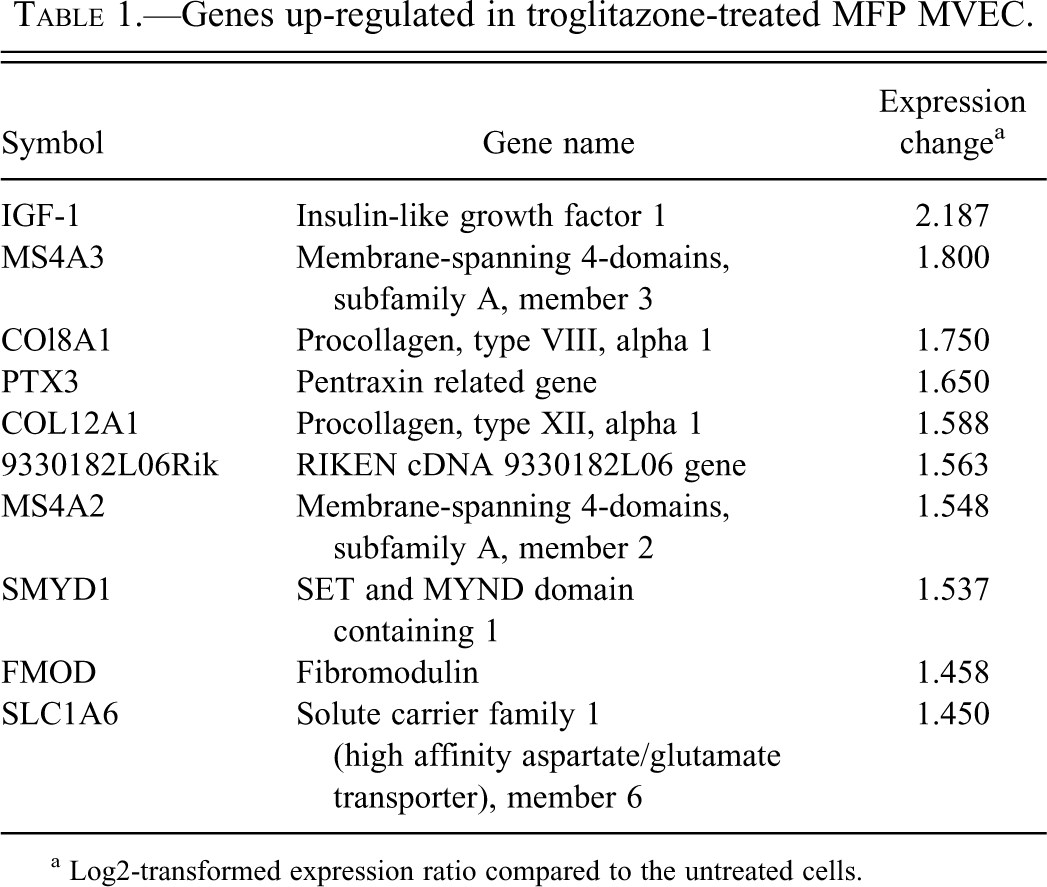
a Log2-transformed expression ratio compared to the untreated cells.
Genes down-regulated in troglitazone-treated MFP MVEC.
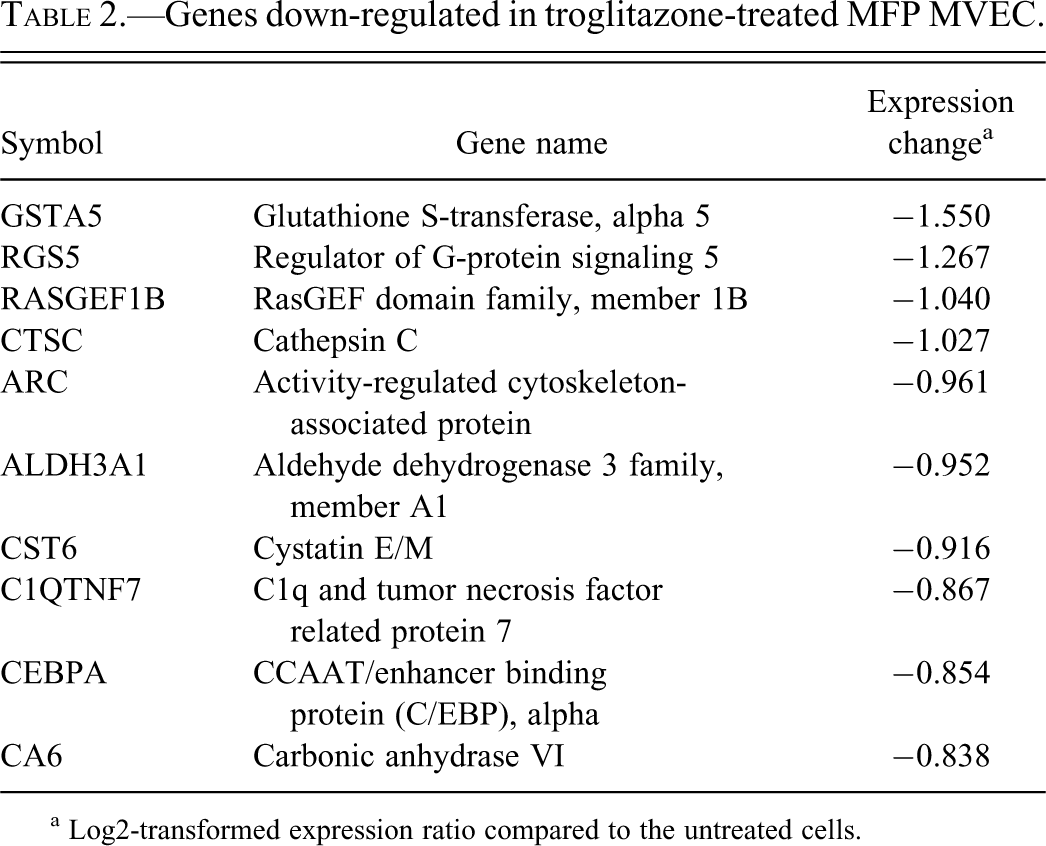
a Log2-transformed expression ratio compared to the untreated cells.
Functions of top five networks generated by ingenuity pathway analysis in troglitazone-treated MFP MVEC.
Genes involved in focused network generated by ingenuity pathway analysis in troglitazone-treated MFP MVEC.
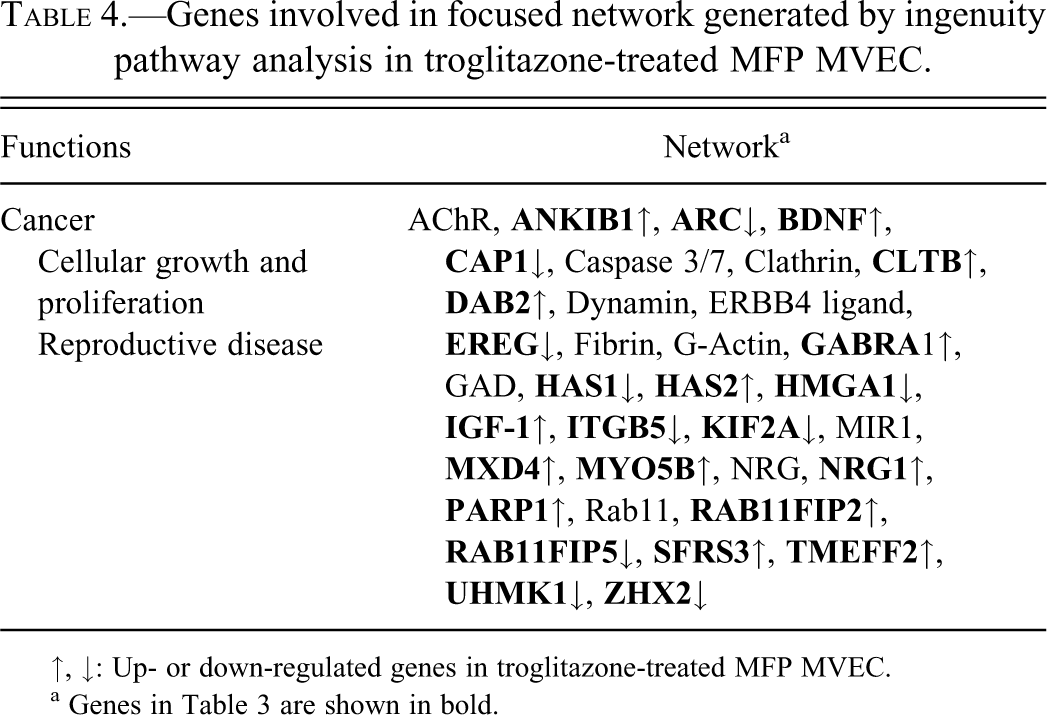
↑, ↓: Up- or down-regulated genes in troglitazone-treated MFP MVEC.
a Genes in Table 3 are shown in bold.
Top five molecular and cellular functions generated by ingenuity pathway analysis in troglitazone-treated MFP MVEC.
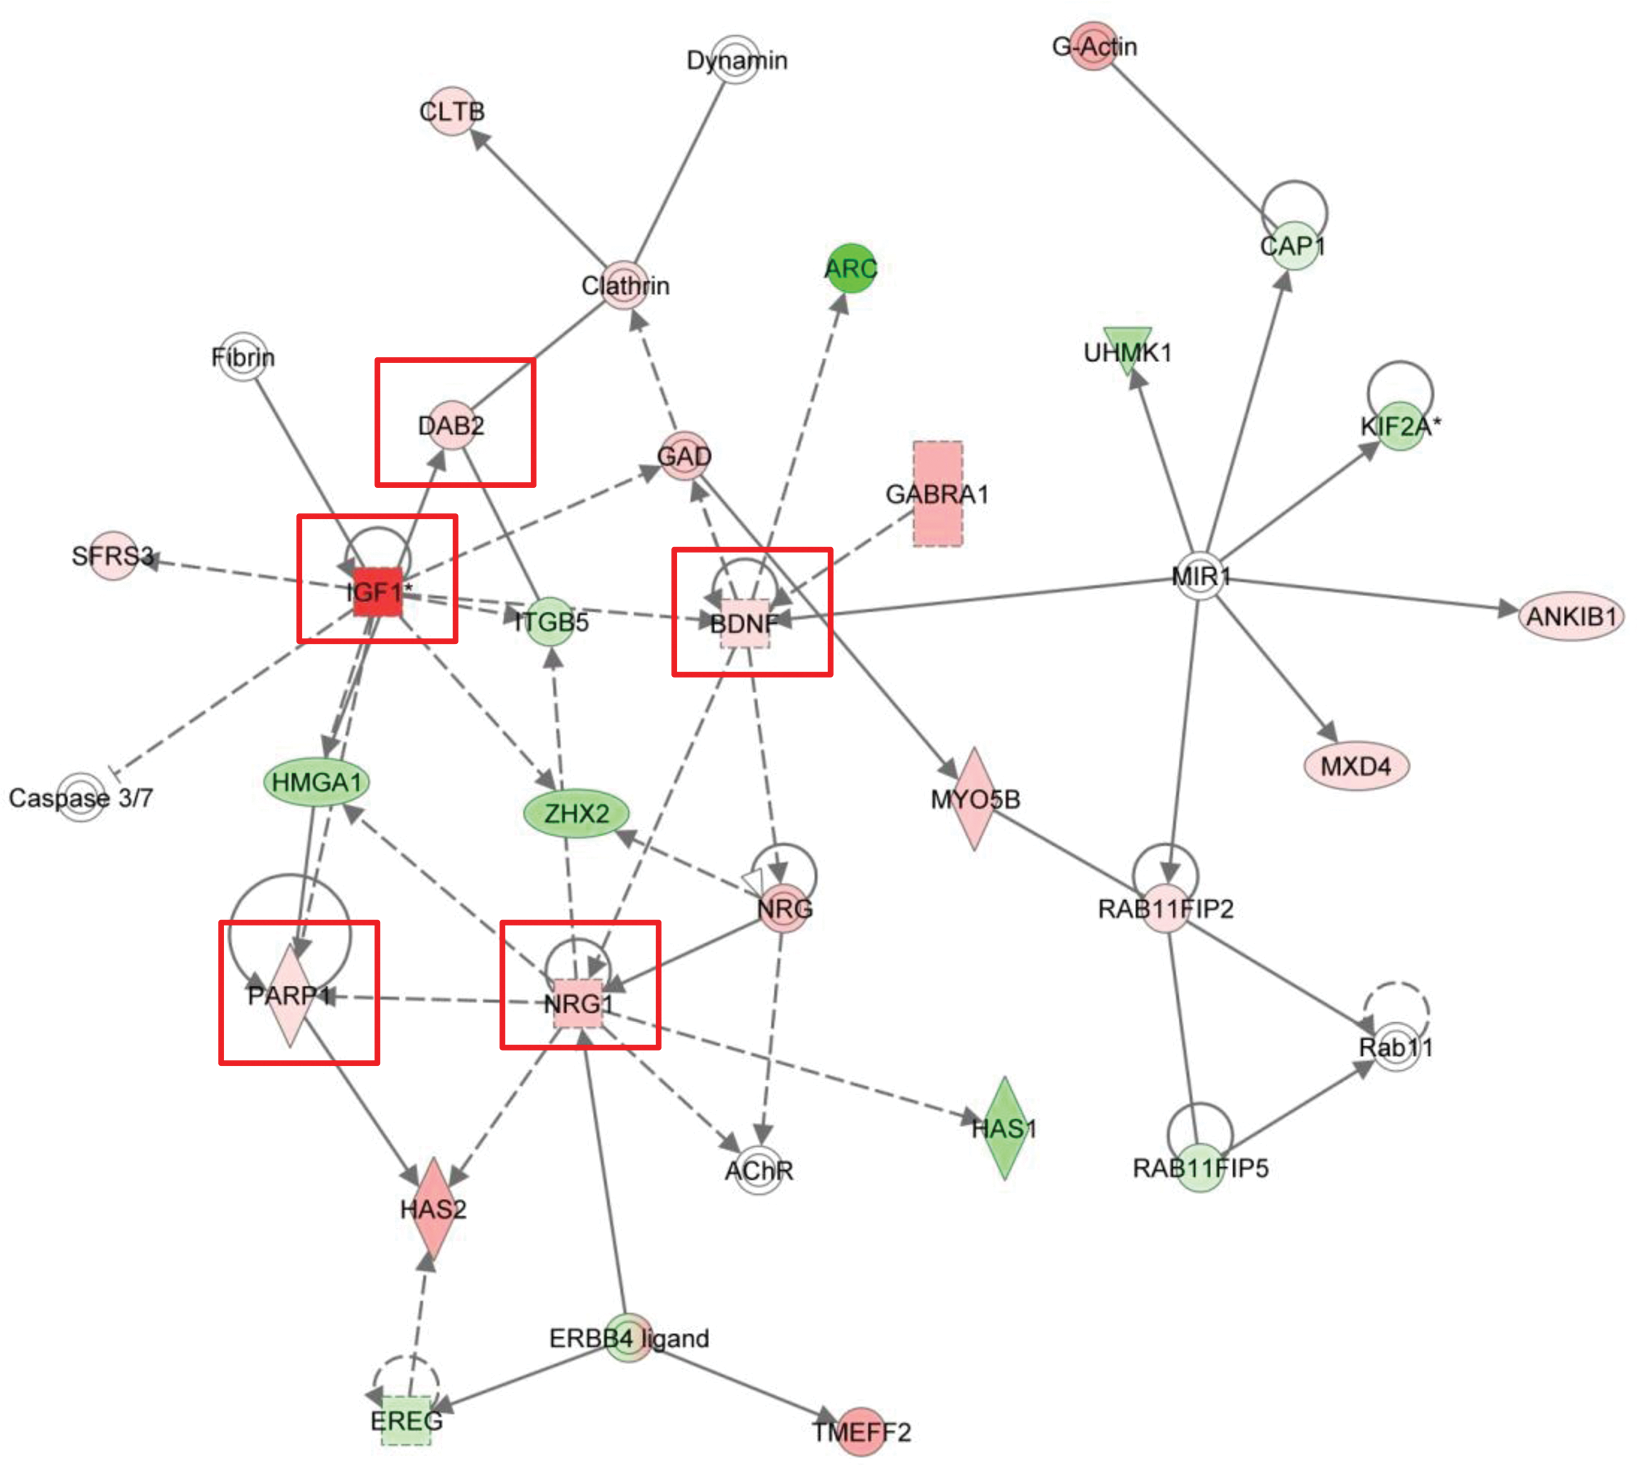
Gene network in MFP MVEC cultured with 1% fetal bovine serum and 5 µM troglitazone for three days was generated by ingenuity pathway analysis software. We focused on one network whose function was implicated in “Cancer, Cellular Growth and Proliferation, Reproductive Disease.” Previous publications reported that genes in this network, such as IGF1, HAS2, PARP1, DAB2, BDNF, and NRG-1 (circled by a red line), were involved in EC survival or angiogenesis. Genes are represented as nodes, and the biological relationship between two nodes is represented as a line. All lines are supported by at least one reference from publications or from canonical information stored in the Ingenuity Pathways Knowledge Base. Nodes are displayed using various shapes that represent the functional class of the gene product: squares represent growth factors; down-pointing triangles represent kinases; diamonds represent enzymes; horizontal ovals represent transcription regulators; vertical rectangles represent G-protein coupled receptors; horizontal rectangles represent ligand-dependent nuclear receptors; concentric circles represent a group or complex, and circles represent other entities. Solid lines are for direct and broken ones for indirect associations. Lines beginning and ending at a single node show self-regulation, whereas a line without an arrowhead represents binding. Arrowheads represent directionality of the relationship. The node color intensity indicates the degree of increase (red) or decrease (green).
Confirmation of IGF1 Upregulation in TG-Treated MFP MVEC
As observed in the microarray analysis, IGF1 expression was increased by TG at 0.1 µM or greater concentrations, with a significant increase at 5 µM in MFP MVEC under a reduced concentration of growth factors (1% FBS) on day 3 (Figure 2).
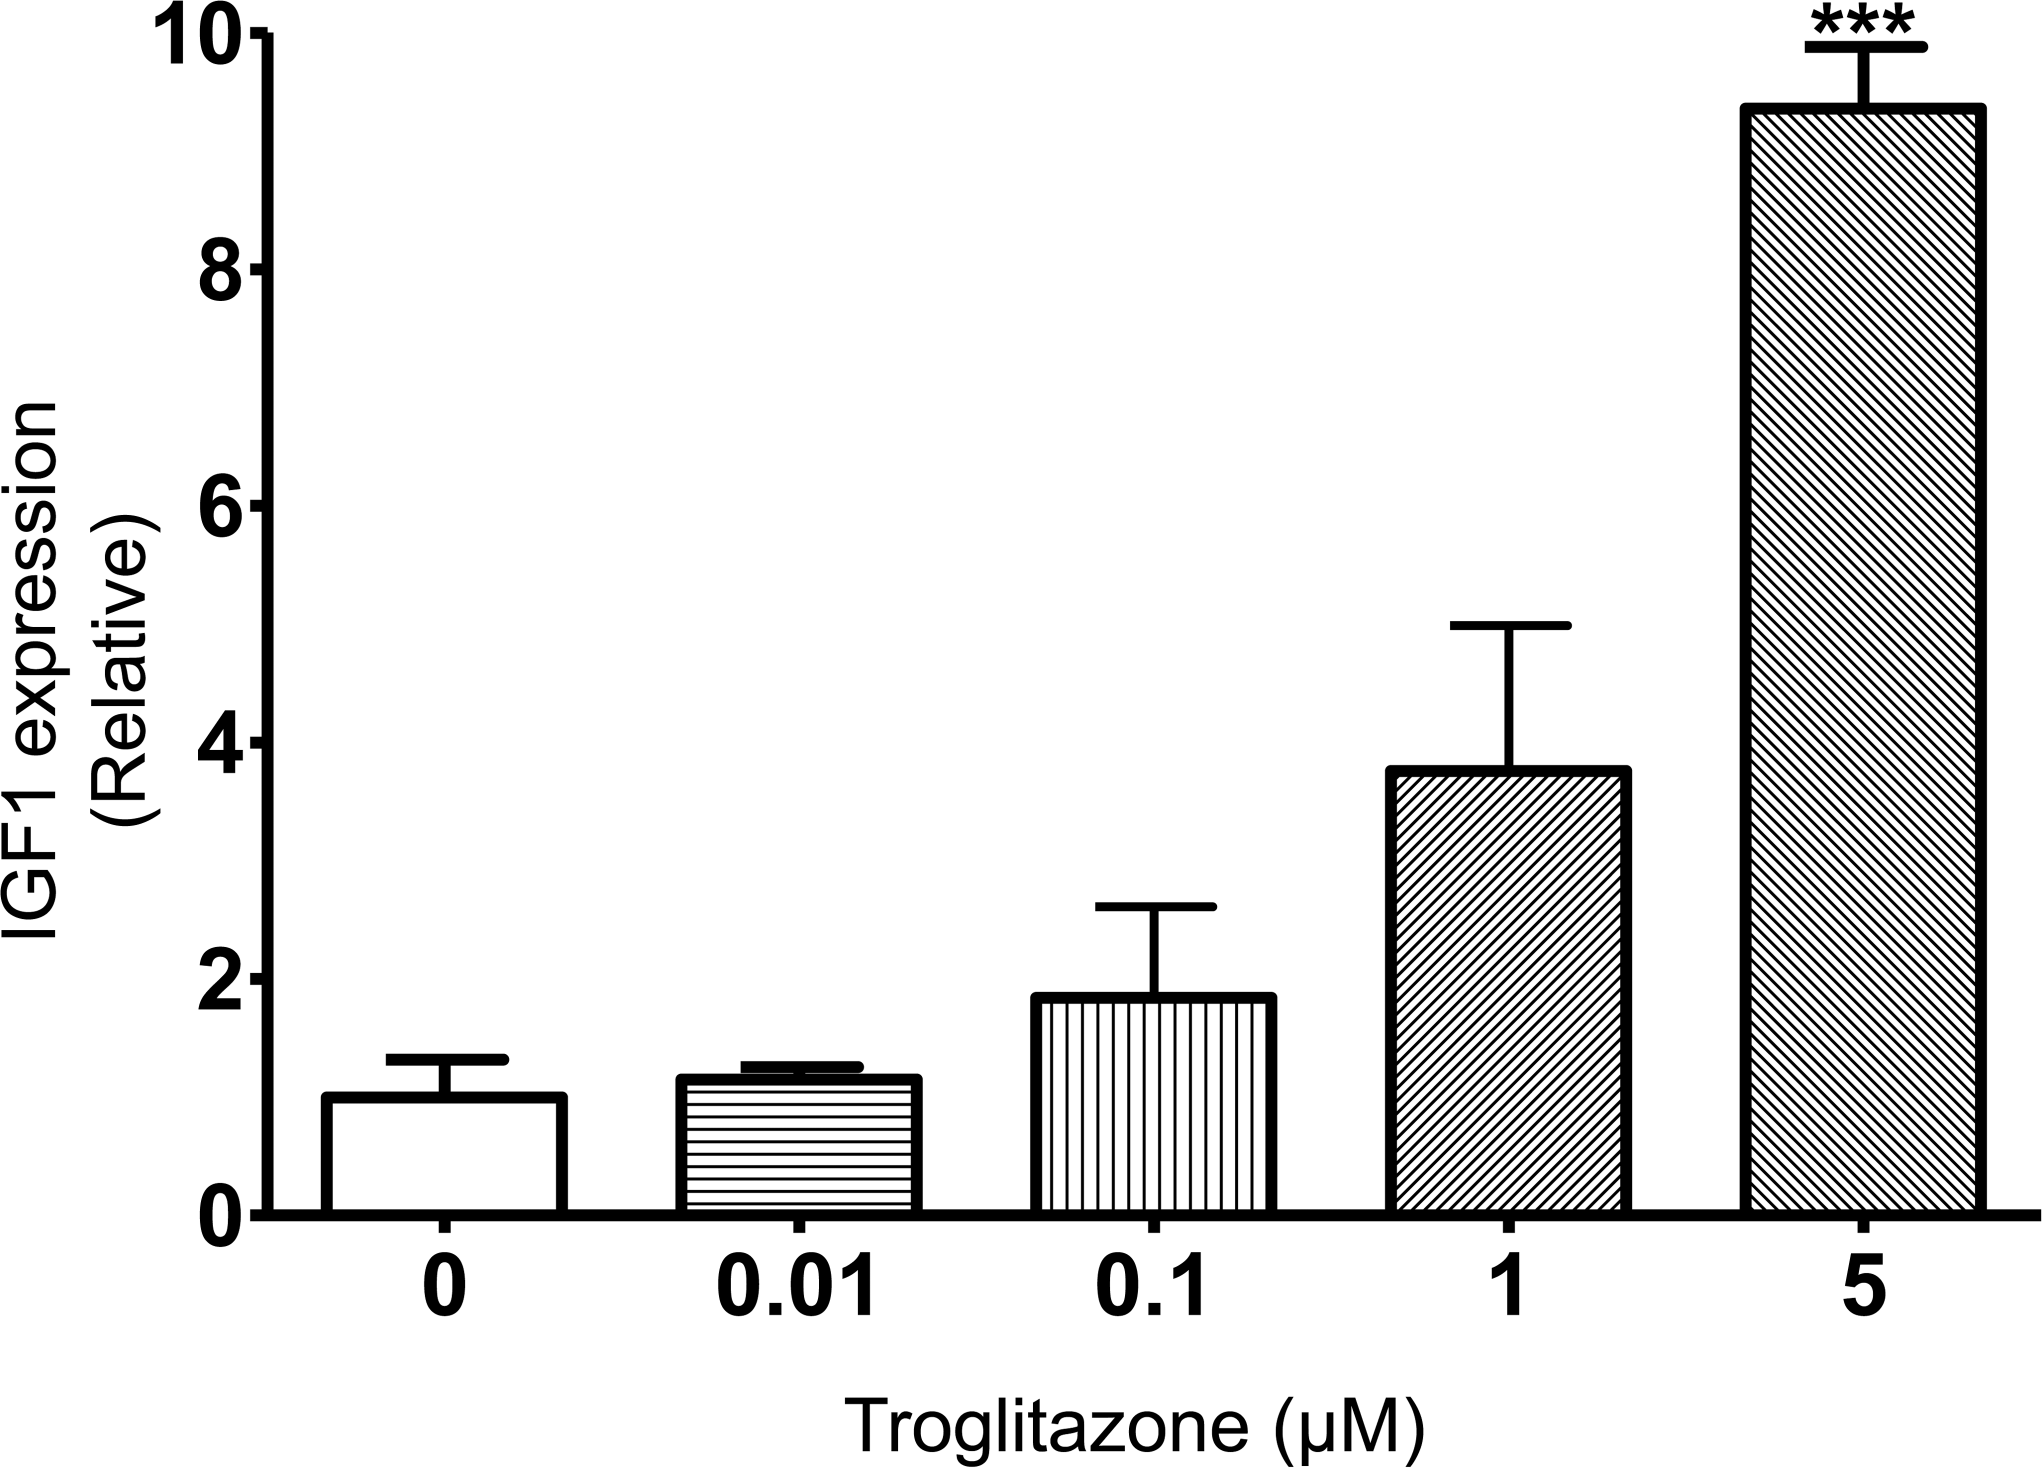
Insulin-like growth factor-1 expression was increased by troglitazone at 0.1 µM or greater concentrations with a statistically significant increase at 5 µM in MFP MVEC under a reduced concentration of growth factor on day 3. ***p < .001 compared with the untreated cells.
Study 2
Clinical Observation, Body Weight, Water Consumption, Food Consumption, Organ Weight, and Histopathological Observation
B6C3F1 female mice were treated with TG at a sarcomagenic dose (400 mg/kg) for four weeks. Treatment with TG resulted in no apparent systemic toxicity to the mice in terms of mortality, water or food consumption, or clinical signs (data not shown). Although the body weights in the 400 mg/kg group were statistically decreased at week 2 compared with the control group (Table 6), the decrease was minor and was not evident at other times. Mice treated with TG showed no statistically significant changes in heart weights (Table 6). However, the relative heart weights in mice treated with 400 mg/kg TG were slightly higher compared with the control group, similar to what we observed in our previous study (Kakiuchi-Kiyota et al. 2009). Troglitazone did not change the absolute or relative weights of the interscapular adipose tissue (BAT and WAT; Table 6). As previously observed (Kakiuchi-Kiyota et al. 2009), TG increased the incidence of mammary gland ductal hyperplasia in glands present in the interscapular adipose tissue (BAT and WAT; Table 7). No abnormal histopathologic findings related to TG treatment were observed in the liver.
Body weight and organ weight in B6C3F1 mice treated with troglitazone (Study 2).
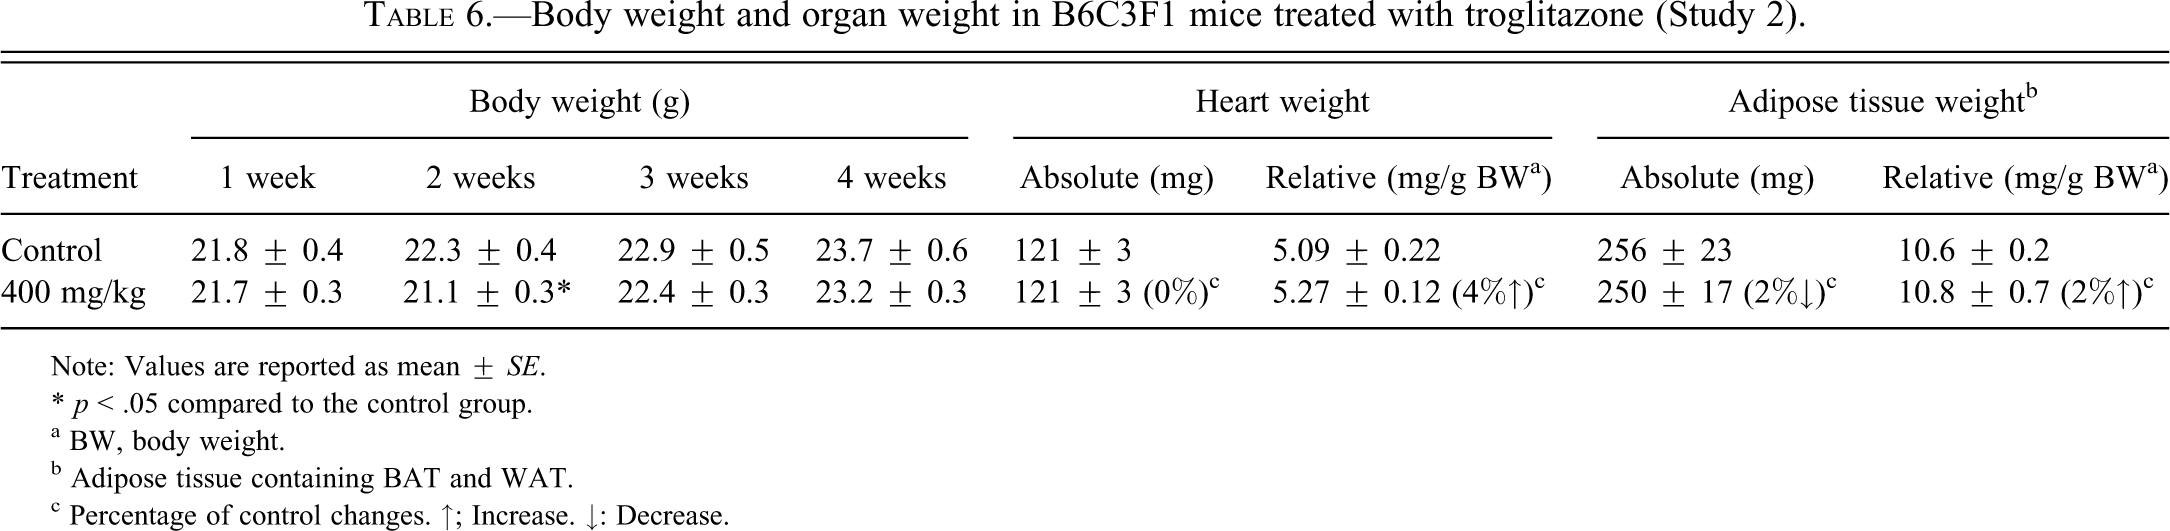
Note: Values are reported as mean ± SE.
* p < .05 compared to the control group.
a BW, body weight.
b Adipose tissue containing BAT and WAT.
c Percentage of control changes. ↑; Increase. ↓: Decrease.
Incidences of mammary gland ductal hyperplasia of interscapular adipose tissue in mice after four weeks of treatment with troglitazone (Study 2).
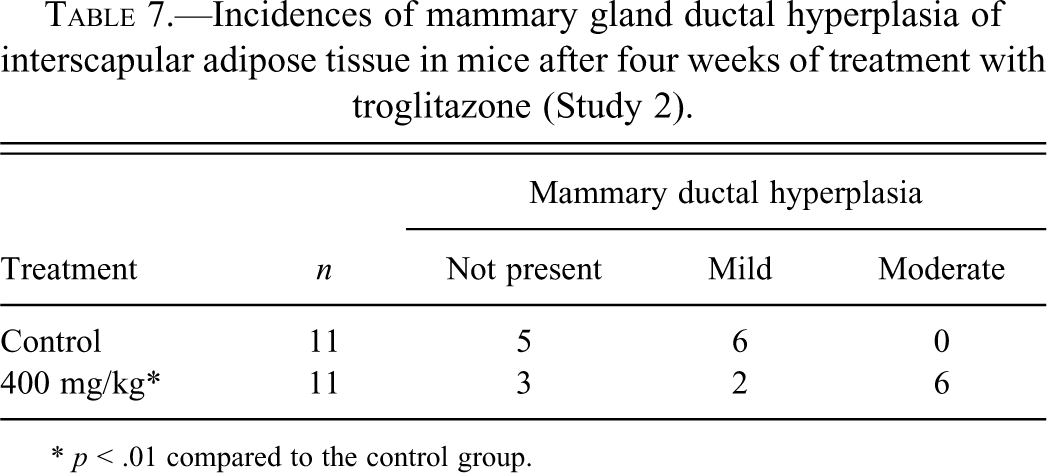
* p < .01 compared to the control group.
Local Hypoxia Was Observed in Liver but Not in Adipose Tissue in TG-Treated Mice
We investigated whether TG at 400 mg/kg increased hypoxia in liver and adipose tissues after treatment for four weeks in B6C3F1 mice by detecting pimonidazole-protein adducts. As observed previously (Samoszuk et al. 2004), immunostaining for hypoxia in control liver was localized predominantly in pericentral regions and showed a gradient of cytoplasmic staining that extended radially from the central veins in the centribular regions in control mice (Figure 3A). Hypoxic hepatocyte nuclei were observed close to the central veins (Figure 3C). In TG-treated mice, the gradient of cytoplasmic staining around the central veins was microscopically similar to the control mice (Figure 3B). However, the number of hypoxic hepatocyte nuclei was increased (Figure 3D); the HP-1 LI in hepatocyte nuclei was significantly increased in the 400 mg/kg group compared to the control group (Table 8). Adipocyte cytoplasm consists of lipid droplets, but during the deparaffinization of the paraffin sections, the lipid droplets were dissolved by ethanol and xylene, showing up as vacuoles in the staining sections. This process removes the cytoplasm from adipocytes, leaving nothing to evaluate for hypoxia with anti-pimonidazole antibodies. All that is left is the adipocyte nucleus and cell membrane. Therefore, we were able to evaluate the immunostaining of HP-1 only in adipocyte nuclei. In BAT, there was no significant difference between the HP-1 LI in adipocyte nuclei in the control group and in the 400 mg/kg group (Table 8). Hypoxic staining in WAT was not evaluated since it was difficult to distinguish between nuclei of adipocytes and nuclei of non-adipocytes microscopically. Liver and adipose tissue in mice injected only with saline, not HP-1 solution, in both control and 400 mg/kg groups showed no staining (data not shown).
HP-1 labeling index of hepatocyte and adipocyte nuclei in mice after four weeks of treatment with troglitazone (Study 2).
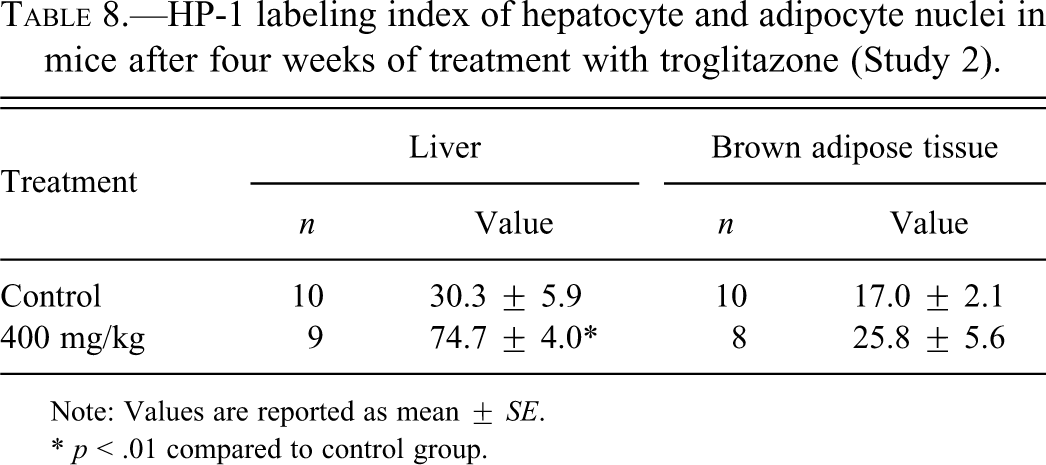
Note: Values are reported as mean ± SE.
* p < .01 compared to control group.
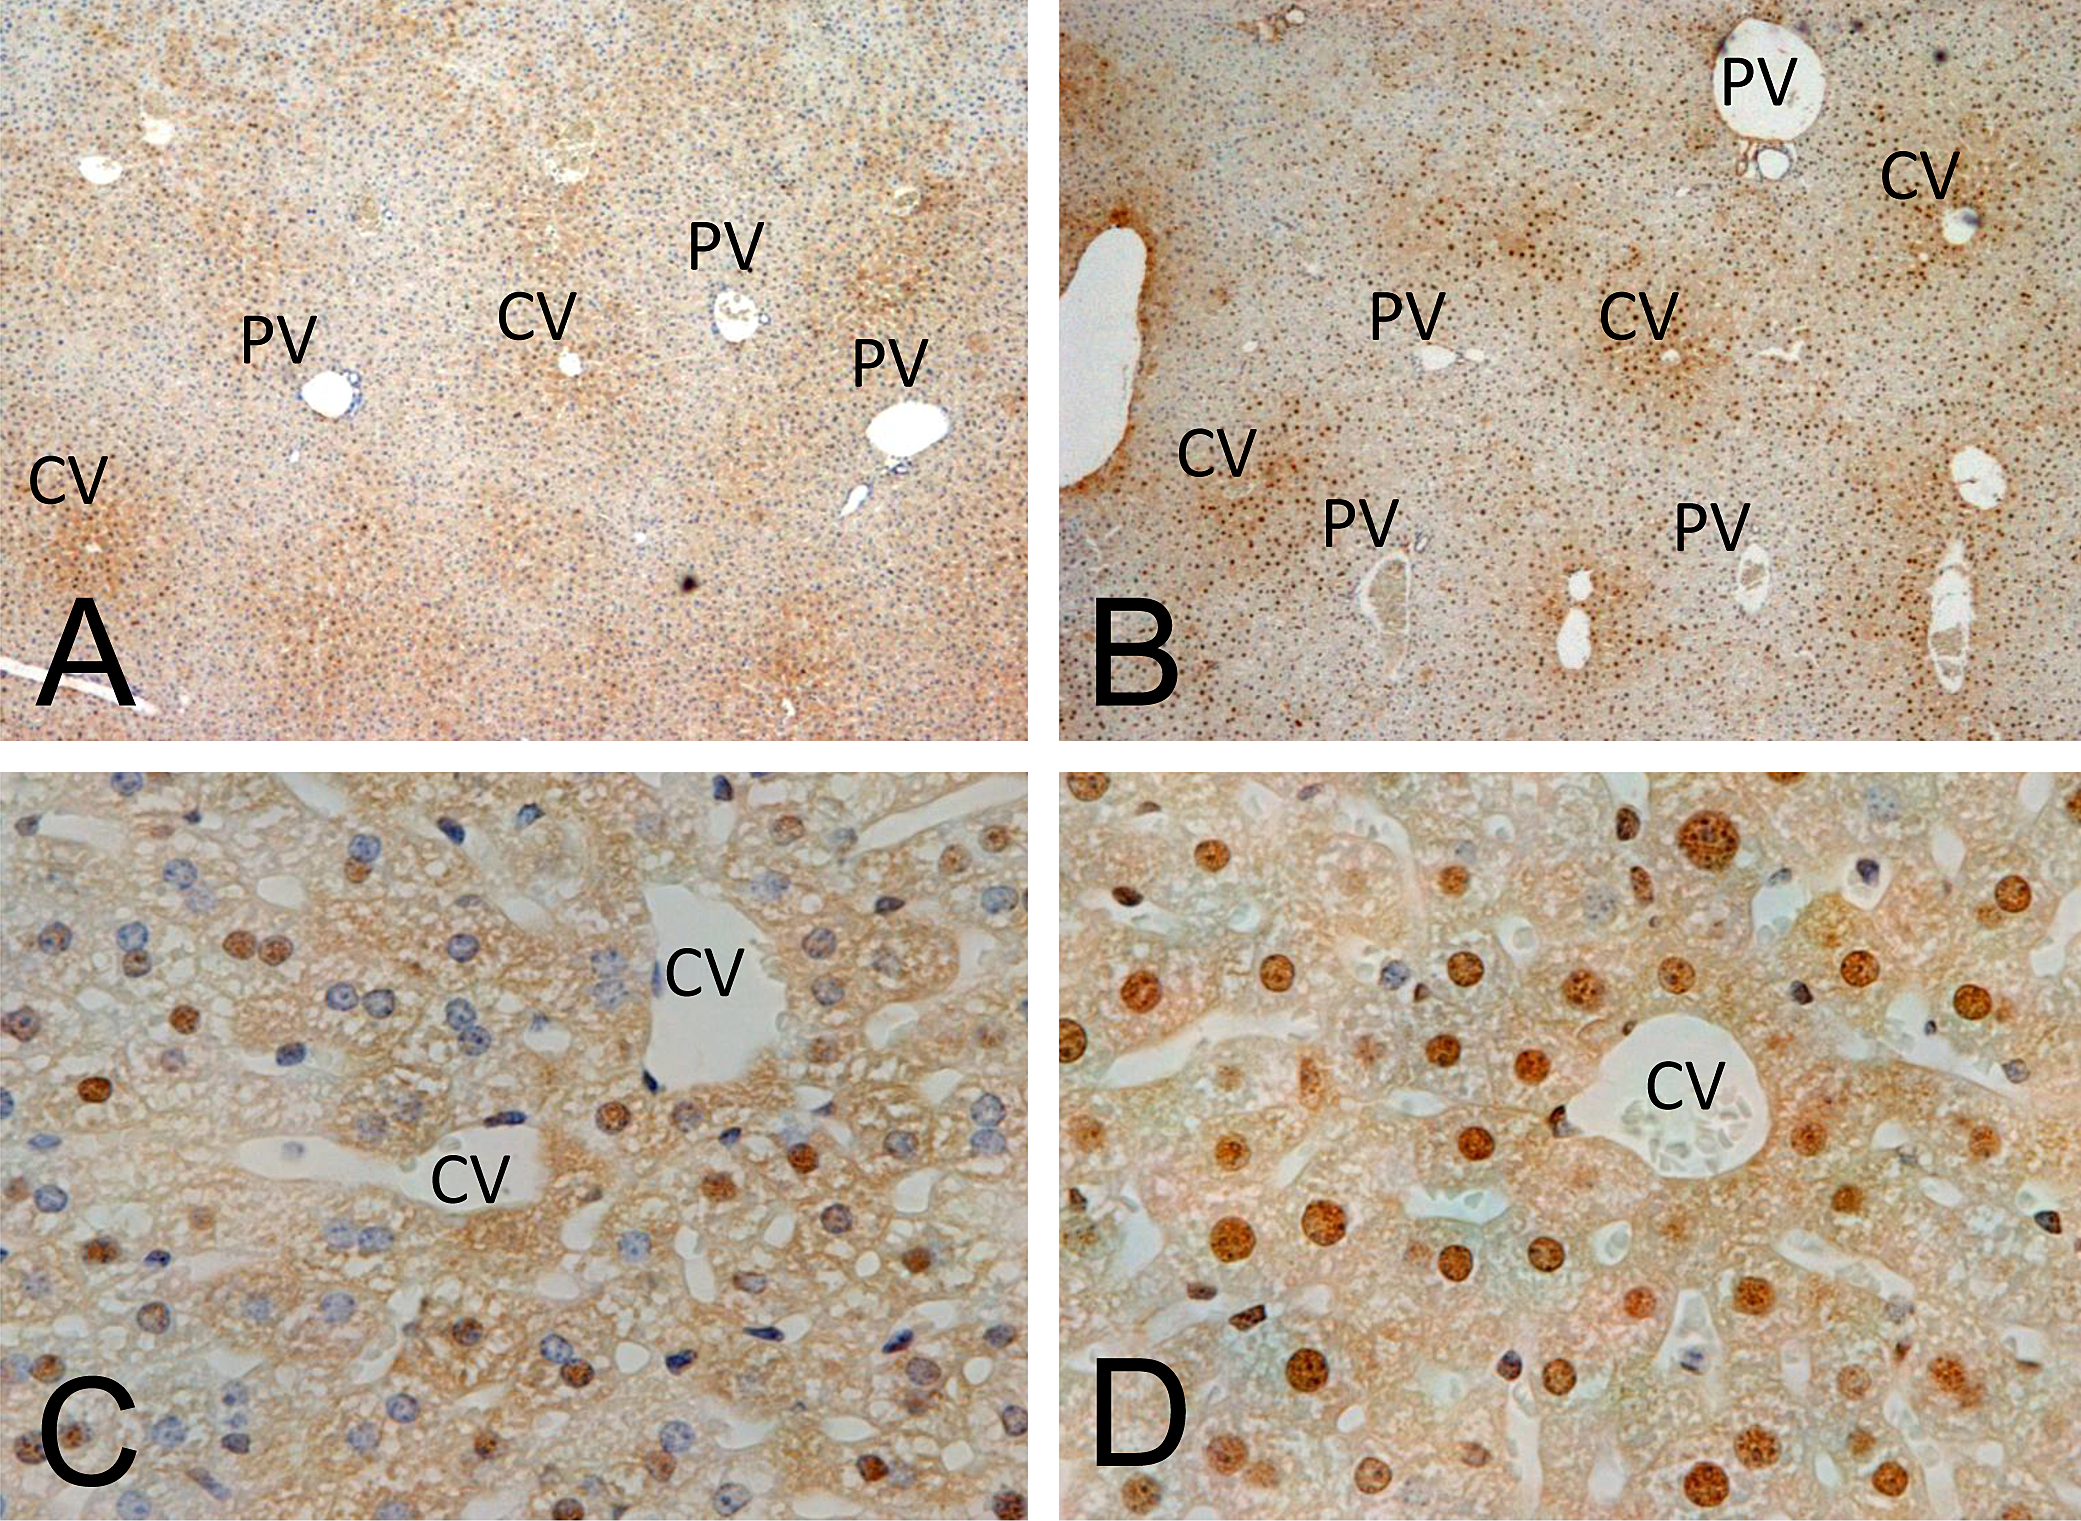
Mice were treated with troglitazone (TG) at 400 mg/kg for four weeks, and two and a half hours prior to sacrifice, HP-1 solution was intraperitoneally injected to detect local tissue hypoxia. A positive reaction for HP-1-protein adduct formed only under hypoxic conditions, resulting in brown nuclear and cytoplasmic staining. Liver in control mice (A and C) and TG-treated mice at 400 mg/kg for four weeks (B and D). A similar cytoplasmic staining gradient was observed radially from the central veins (CV) to the portal veins (PV) of the liver in the control mice (A) and TG-treated mice (B). However, there was a significant difference in nuclear staining between the control mice (C) and TG-treated mice (D). Original magnification was 40× (A and B) and 400× (C and D).
Study 3
Clinical Observations, Body Weight, Water Consumption, Food Consumption, Organ Weight, and Histopathological Observations
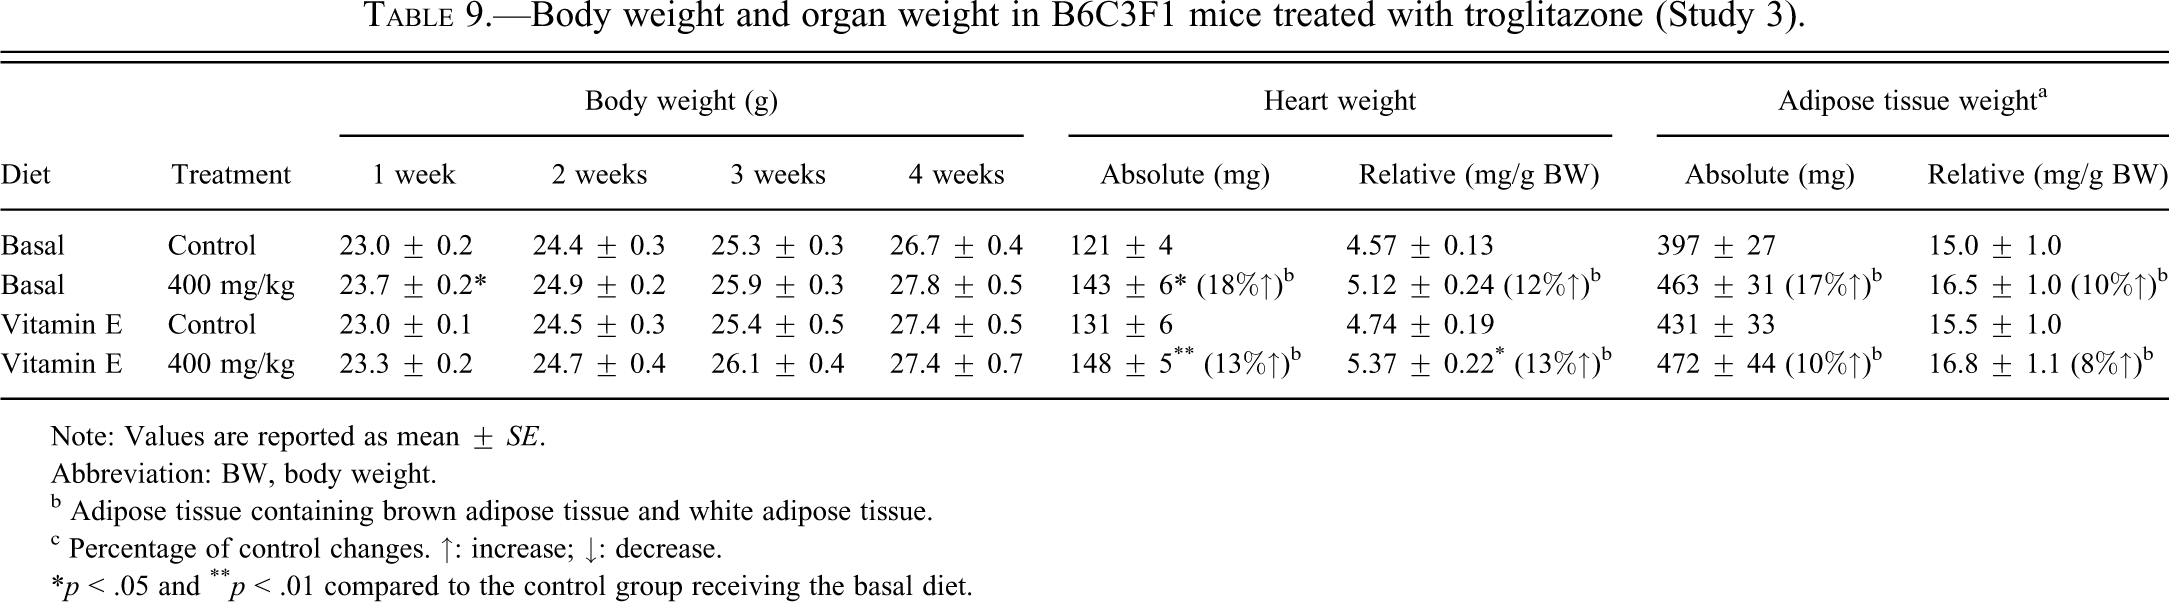
B6C3F1 female mice were fed basal diet supplemented with or without vitamin E for fourteen days prior to and during the treatment with vehicle (control) or TG at a sarcomagenic dose (400 mg/kg) for four weeks. Treatment with TG resulted in no apparent systemic toxicity to the mice in terms of mortality, water or food consumption, or clinical signs in the basal diet group and vitamin E–supplemented diet group compared to the respective controls (data not shown). Although the body weights in mice treated with 400 mg/kg TG and fed basal diet were statistically increased compared to mice in the control group receiving the basal diet at week 1, TG treatment in the basal diet group and in the vitamin E–supplemented diet group had no statistically significant effects on the body weights compared to the respective controls (Table 9). Although only the absolute heart weight in the 400 mg/kg group receiving the basal diet showed a significant increase compared to the control group receiving the basal diet, TG treatment increased both absolute and relative heart weight in the basal diet group and vitamin E–supplemented diet group compared to the respective controls (Table 9). The increase in absolute and relative adipose tissue and heart weight in Study 3 (Table 9) was higher compared to Study 2 (Table 6) or our previous study (Kakiuchi-Kiyota et al. 2009). Purina 5002 was used in Study 2 as was used in our previous study (Kakiuchi-Kiyota et al. 2009), but AIN-76A was used in Study 3. The difference of diet might have caused the different response to TG observed in heart and adipose tissue. As we observed in our previous study (Kakiuchi-Kiyota et al. 2009) and Study 2, TG increased the incidence of mammary gland ductal hyperplasia in adipose tissue (BAT and WAT) in the basal diet group and the vitamin E–supplemented diet group compared to the respective controls (Table 10). AIN-76A induced fatty liver in the control groups receiving either the basal diet or the vitamin E–supplemented diet (Table 10 and Figure 4). Troglitazone inhibited the extent of this fatty change in mice fed either the control AIN-76A diet or the vitamin E–supplemented diet, although not to a statistically significant extent.
Body weight and organ weight in B6C3F1 mice treated with troglitazone (Study 3).
Note: Values are reported as mean ± SE.
Abbreviation: BW, body weight.
b Adipose tissue containing brown adipose tissue and white adipose tissue.
c Percentage of control changes. ↑: increase; ↓: decrease.
*p < .05 and ** p < .01 compared to the control group receiving the basal diet.
Incidences of mammary gland ductal hyperplasia in interscapular adipose tissue and fatty liver in mice after four weeks of treatment with troglitazone (Study 3).
*p < .01 compared to the control group receiving the basal diet.
**p < .001 compared to the control group receiving vitamin E diet.
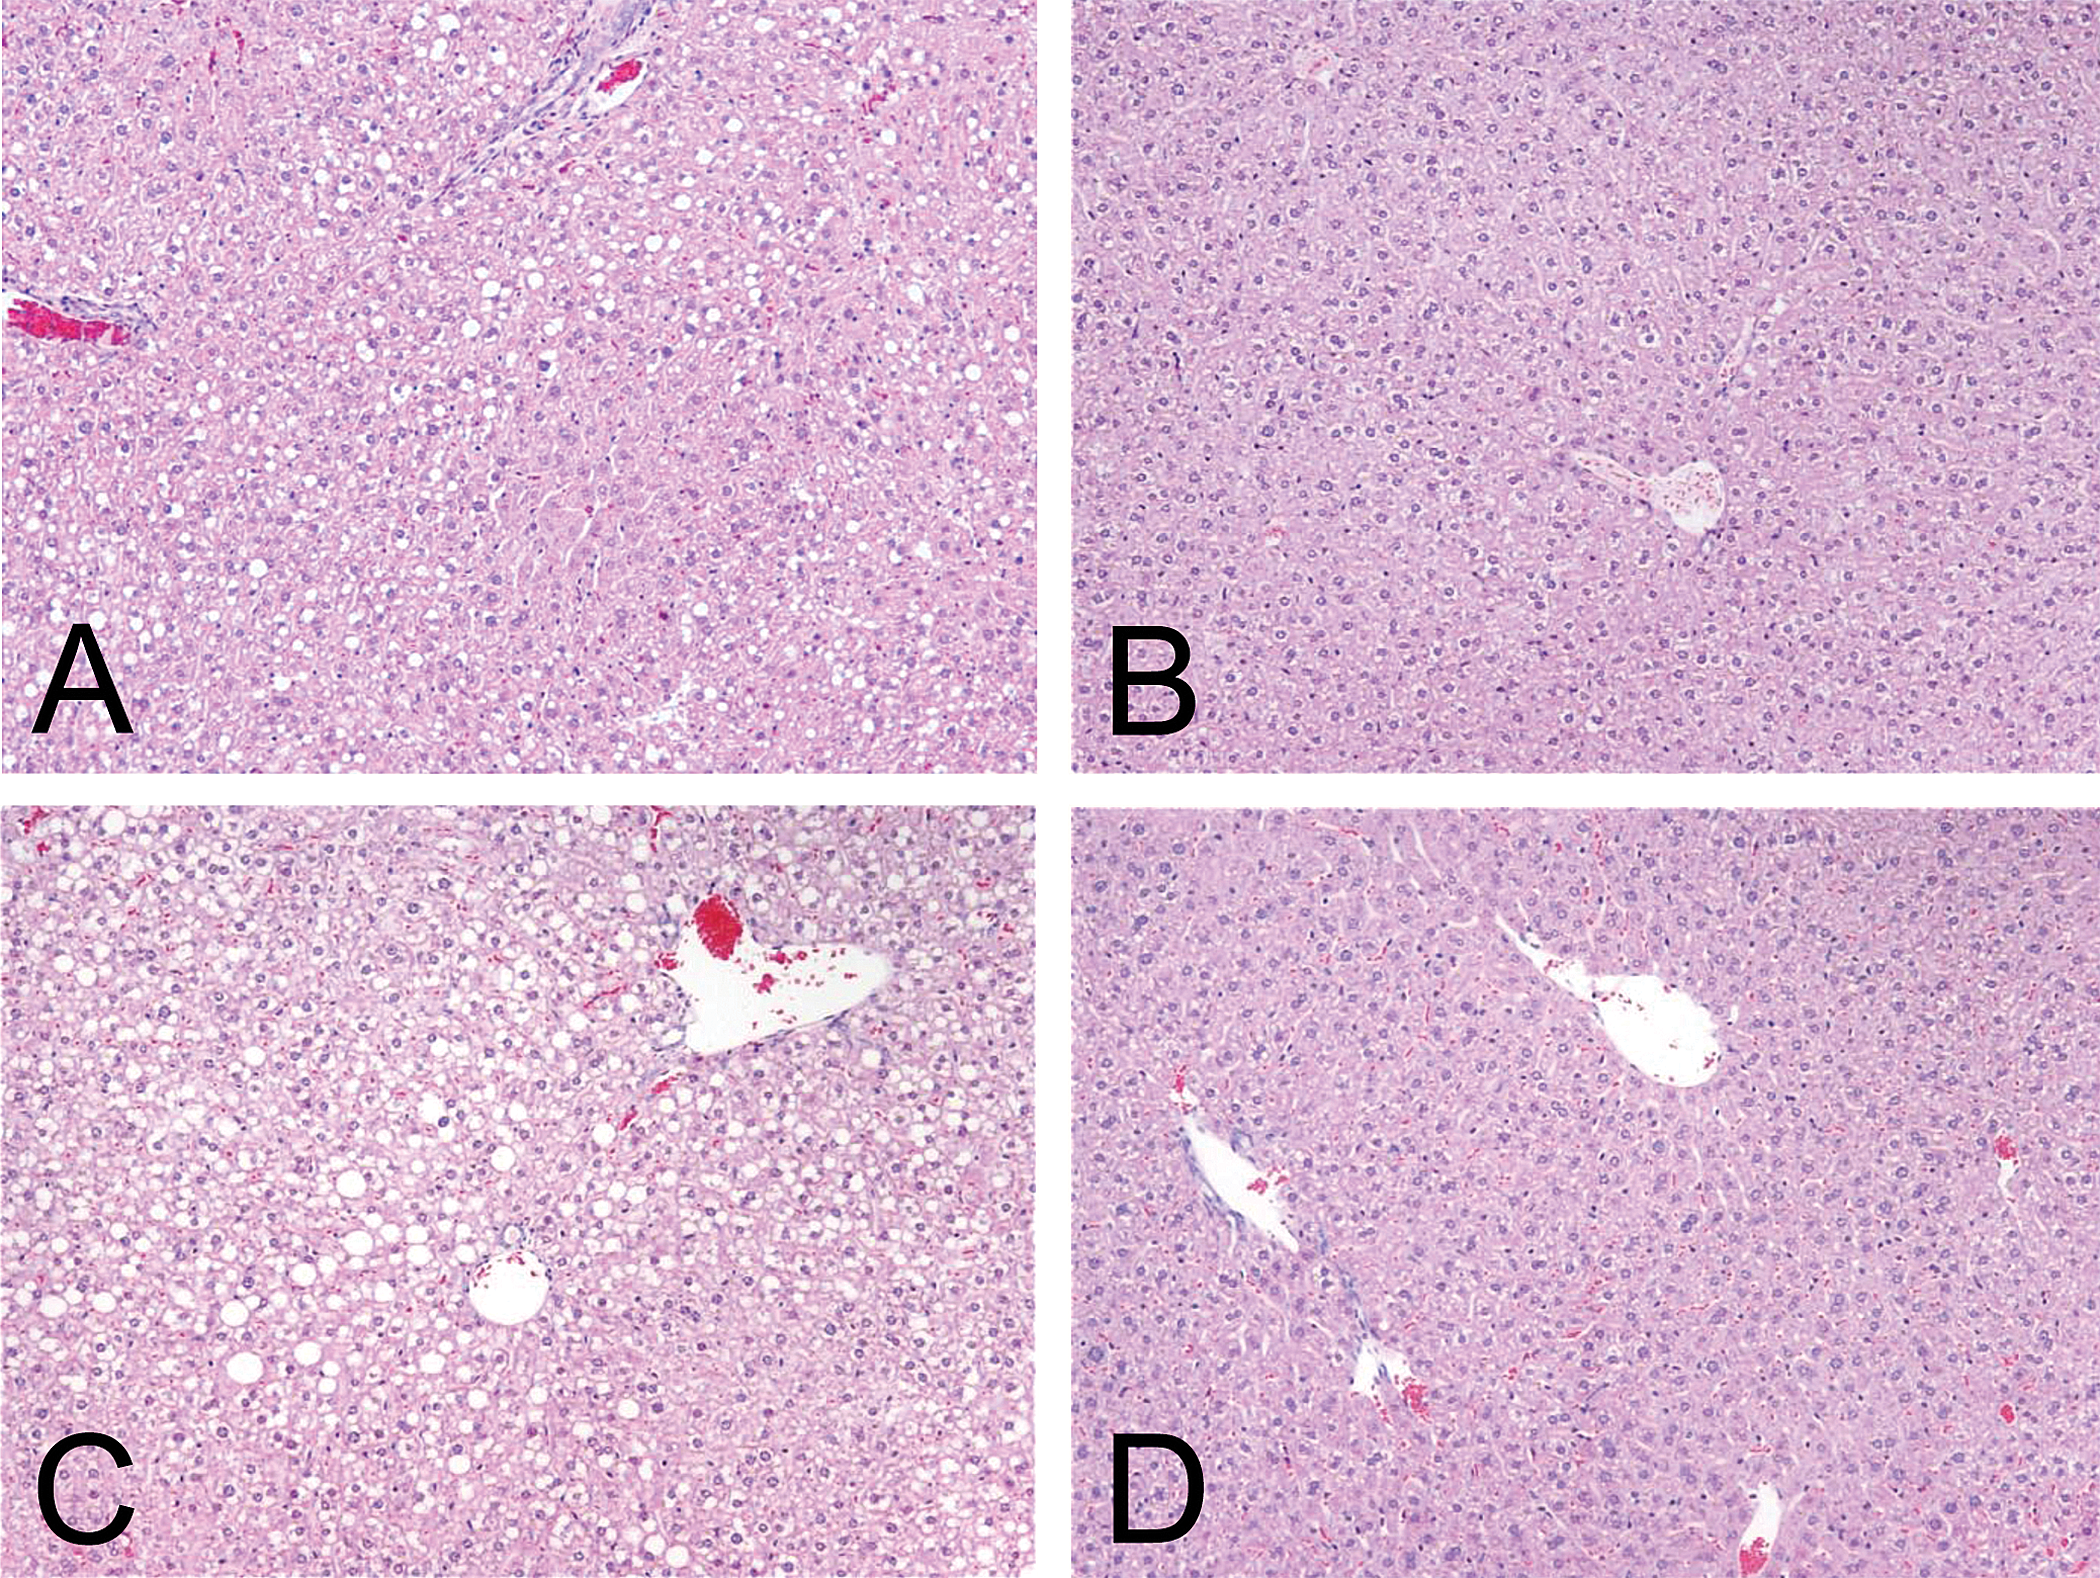
Fatty liver was observed in the control group receiving the basal diet (AIN-76A) (A) or the basal diet supplemented with vitamin E (C). Troglitazone significantly improved the fatty change in the liver in mice fed the basal diet (B) or in mice fed the basal diet supplemented with vitamin E (D). Original magnification was 100×.
Effects of TG on EC Proliferation in the Basal Diet–Fed Mice and the Vitamin E Diet–Fed Mice
To investigate whether an antioxidant (vitamin E) would inhibit the EC proliferation induced by 400 mg/kg TG in mice observed in our previous study (Kakiuchi-Kiyota et al. 2009), we performed dual immunohistochemical staining for Ki-67 and CD31 in mouse liver, BAT, and WAT tissue. Similar to the previous study, a significant increase in Ki-67/CD31 LI in liver, BAT, and WAT was observed in the 400 mg/kg TG group receiving the basal diet compared to the respective control (Table 11). Dietary vitamin E did not inhibit EC proliferation induced by TG treatment (Table 11).
Evaluation of a possible effect of vitamin E co-administration on endothelial cell labeling index of liver, brown adipose tissue, and white adipose tissue in mice after four weeks of treatment with troglitazone (Study 3).
Note: Values are reported as mean (%) ± SE.
*p < .05 and **p < .01 compared to control group receiving the basal diet.
# p < .05, ## p < .01, and ### p < .001 compared to control group receiving the vitamin E diet.
Discussion
Troglitazone, a prototypical sarcomagenic PPARγ agonist, significantly increased the incidence of HS in females at 400 mg/kg and in both sexes at 800 mg/kg in multiple tissues, including liver and subcutaneous adipose tissue in a two-year bioassay using B6C3F1 mice, but not in Wistar rats (Duddy et al. 1999; Herman et al. 2002). Troglitazone increased EC proliferation in liver, BAT, and WAT in female B6C3F1 mice at the sarcomagenic doses administered for four weeks, at least in part through a direct mitogenic effect and inhibition of apoptosis on mouse microvascular ECs (MFP MVEC) (Kakiuchi-Kiyota et al. 2009). To understand the mechanism of direct effects of TG in mouse ECs, we investigated the transcriptional profiles in TG-treated MFP MVEC under reduced concentrations of growth factors. None of the top ten genes up-regulated or down-regulated by TG were reported or predicted as the downstream genes of murine PPARγ signaling. Troglitazone changed the expression of many genes involved in cell death, cell proliferation and growth, and cell development in MFP MVEC. Since TG increased the incidence of HS formation in mice after treatment for two years, and our previous study indicated that increased EC proliferation and survival might be involved, we focused on one network whose function was implicated in the title “Cancer, Cellular Growth and Proliferation, Reproductive Disease.” In addition, IGF1, the most highly up-regulated gene (log2 transformed ratio: 2.2-fold) in TG-treated MFP MVEC, is a critical part of this pathway. The known functions of the other genes with TG-induced expression changes and the IPA-generated networks made them unlikely candidates for involvement in the TG-induced increase in HS formation in mice. Previous publications reported that genes in this network, such as HAS2 (Simpson 2006), PARP1 (Tentori et al. 2007), DAB2 (Cheong et al. 2006), BDNF (Kermani and Hempstead 2007; Sun et al. 2006), and NRG-1 (Iivanainen et al. 2007), were involved in EC survival or angiogenesis. In addition to these genes, IGF1, which was the most highly up-regulated gene, is well-known to function in neovascularization, EC proliferation, and EC survival. Retinal vascular growth was prevented in IGF1 knockout mice (which lack both circulating and locally acting IGF1) even with comparable amounts of VEGF mRNA compared to normal controls (Hellstrom et al. 2001). Another group showed that the retinal neovascularization induced by hypoxia was inhibited in mice with a vascular EC-specific knockout of the insulin receptor (Kondo et al. 2003). Both microvascular and macrovascular ECs express IGF1 receptor (IGF1R), but microvascular ECs are more susceptible to the proliferative effects of IGF1 (Bar et al. 1986; King et al. 1985). In addition to the proliferative effect on ECs, IGF1 showed inhibition of apoptosis and G0/G1 arrest induced by angiotensin II and increased proliferation in human umbilical vein ECs (Ma et al. 2009). These data suggest that this network may have an important role in the direct effects of TG on proliferation and/or apoptosis in MFP MVEC. Furthermore, IGF/IGF1R has been implicated in various malignancies (Pollak et al. 2004). Further in vitro and in vivo investigation is required to determine whether (1) IGF1 expression is directly regulated by PPARγ activation, and (2) whether IGF1 has an important role to increase EC proliferation in mice in vivo.
Given the role of oxidative stress and/or hypoxia in the induction of mouse HS by agents such as 2-butyoxyethanol and pregabalin, it was surprising that there was no evidence of an effect on pathways related to these processes in the array studies with TG. However, an evaluation of such processes in vivo following TG treatment in mice is necessary to fully assess their possible role. The experiments in studies 2 and 3, evaluating hypoxia and the effect of vitamin E on TG-induced HS, are the initial experiments needed for such an assessment.
Hypoxic conditions and increased levels of ROS are known to stimulate EC proliferation (Humar et al. 2002; Pugh and Ratcliffe 2003; Stone and Collins 2002) and have been implicated in the increased EC proliferation induced by other sarcomagenic chemicals, such as 2-butoxyethanol and pregabalin (Cohen et al. 2009; Laifenfeld et al. 2009). However, it is not clear whether they are contributing factors to the increased EC proliferation induced by TG.
In the present studies, female B6C3F1 mice were treated with TG at 400 mg/kg for four weeks (Study 2), or female B6C3F1 mice fed with the basal diet with or without vitamin E supplementation (Study 3) were treated with TG at 400 mg/kg for four weeks. Although we did not measure blood levels of TG, in these studies, increases in heart weight, mammary ductal hyperplasia, and endothelial proliferation were similar to previous studies (Kakiuchi-Kiyota et al. 2009).
There was some evidence of a hypoxic effect induced by TG in the liver. Troglitazone increased the number of hypoxic nuclei in liver, whereas a gradient of cytoplasmic staining that extended radially from the central veins in the centrilobular regions of the liver was microscopically similar between the control and the 400 mg/kg groups. In liver, in addition to the lobular oxygen gradient from the portal area to the central vein (Ji et al. 1982), a cell membrane-to-nucleus oxygen gradient also exists (Alati et al. 1989). The large hepatocyte size can contribute to a situation in which hepatocyte nuclei are hypoxic because the cytoplasm consumes much of the oxygen before it reaches the nuclei (Alati et al. 1989). Since we did not observe any histopathological abnormalities, such as necrotic cells, in the liver with TG treatment, hepatocytes apparently induce a response to the hypoxic conditions that is adequate to maintain viability. One of the most important responses to hypoxia is stimulation of angiogenesis for additional delivery of oxygen. Hypoxia-activated hypoxia inducible factor (HIF) signaling is a key mediator in regulation of angiogenic factors, such as vascular endothelial growth factor (VEGF), vascular endothelial growth factor receptor (VEGFR), inducible nitric oxide synthase, heme oxygenase 1, angiopoietins, and platelet-derived growth factor, leading to angiogenesis (Elson et al. 2001; Iyer et al. 1998; Pugh and Ratcliffe 2003; Yamakawa et al. 2003). Copple et al. (2009) indicated that increased HIF-1α signaling may be a major regulator of VEGF production induced in hypoxic hepatocytes. Thus, in addition to the direct proliferative and anti-apoptotic effects of TG on mouse EC, hypoxic conditions in hepatocytes induced by TG might contribute to the increased EC proliferation in the liver of mice treated at sarcomagenic doses.
The relationship of the hypoxia in the liver in response to TG treatment and increased EC proliferation is unclear, since a similar induction of hypoxia was not detected in adipose tissue even though endothelial cell proliferation is increased. It may be that hypoxia contributes to the increased EC proliferation in the liver of TG-treated mice. However, since no hypoxia was detected in adipose tissue, some other factor must contribute to increased EC proliferation in adipose tissue, possibly an indirect stimulus of EC proliferation by vascular growth factors secreted by the PPARγ-activated adipocytes (Herman et al. 2002).
Microarray studies of cells in culture are unable to detect hypoxia. However, the microarray analysis did not indicate oxidative damage. In support of a lack of a role for oxidative damage in TG-induced endothelial cell proliferation, we observed no effect of the antioxidant vitamin E on TG-induced EC proliferation in either the liver or adipose tissue. Chow et al. (1999) showed that hydrogen peroxide production in liver mitochondria in mice fed basal diet not supplemented with vitamin E was significantly higher than mice fed diet supplemented with vitamin E, and that the vitamin E decreased hydrogen peroxide production in rat hepatic mitochondria in a dose-dependent manner (Chow et al. 1999). Although Irwin et al. (2009) used macrovascular ECs (human pulmonary artery ECs), an antioxidant cocktail, including ascorbate, glutathione, and α-tocopherol, completely blocked hypoxia-induced hydrogen peroxide production and VEGF expression, whereas accumulation of HIF-1α was inhibited, but not completely blocked (Irwin et al. 2009). Taken together, vitamin E treatment is likely to prevent hypoxia-induced responses by inhibiting ROS generation in mitochondria, at least in part. Furthermore, in examples of HS induced by other chemicals in mice, such as 2-butoxyethanol, vitamin E levels have been shown to decrease (Siesky et al. 2002). In addition, 2-butoxyethanol is known to induce macrophage activation leading to increased ROS and consequent release of various endothelial growth factors and increased EC proliferation in mice (Corthals et al. 2006; Cohen et al. 2009). However, we did not observe any histopathological evidence related to macrophage activation, and such activation has not been reported in the literature with TG or other PPARγ agonists.
In the present study, as in the previous study (Kakiuchi-Kiyota et al. 2009), TG treatment increased EC LI in liver, BAT, and WAT in mice fed basal diet. Vitamin E treatment did not prevent TG-increased EC proliferation in any of these tissues. Troglitazone has revealed a potential to induce intracellular oxidative stress, including lipid peroxidation, GSH oxidation, and increased superoxide generation, in normal rat hepatocytes and hepatoma cells, again in vitro (Narayanan et al. 2003; Tafazoli et al. 2005). Lipid peroxidation can stimulate cell proliferation (Bull et al. 1984; Bull et al. 1988). For example, 2-butoxyethanol induced increased EC proliferation, with evidence of increased oxidative stress, such as decreased levels of vitamin E, a major antioxidant against lipid peroxidation, and increased levels of malondialdehyde, indicating a correlation of increased EC proliferation with elevated oxidative stress (Klaunig and Kamendulis 2005; Siesky et al. 2002). Mice fed basal diet (AIN-76A) supplemented with vitamin E (1,000 IU/kg) showed slightly, but consistently higher liver and serum vitamin E levels (Kimberly Navetta, personal communication). Previous studies showed that diet supplemented with 1,000 IU/kg vitamin E reduced lipid peroxidation (Ibrahim et al. 1997; Knight et al. 2003). Taken together, the lack of inhibition of EC proliferation by vitamin E in the in vivo study and the lack of effect on oxidative stress pathways in the in vitro microarray study suggest that TG-induced increases in oxidative stress, if they do occur in the mice, are not involved in increased EC proliferation induced by TG treatment. However, different antioxidants have different affinities for specific oxidative species, such as hydroxyl radicals, singlet oxygen, hydrogen peroxide, peroxyl radicals, or superoxide anion, and it is possible that vitamin E, a scavenger of oxygen radicals, is not an effective antioxidant against possible TG-induced increases in oxidative stress. Further studies with other antioxidants will be necessary to determine whether TG-induced increases in oxidative stress are involved in TG-induced increases in EC proliferation.
Although we observed TG-induced hypoxia in hepatocytes, it was not induced in adipose tissue. Furthermore, considering that co-administration of vitamin E with TG did not lower the EC proliferation rate induced by TG, hypoxia-induced angiogenesis might not be involved in increased EC proliferation following TG administration. In the liver, increased EC proliferation and hypoxia might be simultaneous but unrelated events associated with TG treatment.
In Study 3, in the control group receiving basal diet (AIN-76A) with or without vitamin E supplementation, an increased incidence of fatty liver (steatosis) was observed. In our previous study (Kakiuchi-Kiyota et al. 2009) and in Study 2, mice were fed Purina 5002 and no histological abnormality in the liver, including fatty liver, was observed. Troglitazone treatment decreased the incidence of this hepatocellular change in the mice fed AIN-76A diet. The increased incidence of lipid accumulation in liver has been previously reported in rats fed AIN-76A diet (Lien et al. 2001; Medinsky et al. 1982). Many clinical studies showed the potential of TG to reduce visceral fat accumulation, including fatty liver, in patients with type 2 diabetes (Katoh et al. 2001; Kawai et al. 1999; Mori et al. 1999). Therefore, the hepatocellular fatty changes observed in the control group receiving the basal diet with or without vitamin E supplementation are likely to be associated with AIN-76A diet, and the decreased incidence of fatty liver is related to TG treatment. Regardless, the findings related to EC LI with or without TG in the present study with AIN-76A semisynthetic diet were similar to what we observed with Purina 5002 diet in our previous study (Kakiuchi-Kiyota et al. 2009). The fatty change had no influence on the EC response to TG.
Our previous studies demonstrated that TG induced an increase in EC proliferation in the liver, BAT, and WAT of mice treated with the same doses that induced HS in a two-year bioassay. In tissue culture, TG was mitogenic to small-vessel EC at concentrations comparable to systemic blood levels observed in the two-year bioassay. Thus, these concentrations are achieved in vivo following administration of doses of TG that induced HS. The mitogenic effect in vitro was a result of both an increase in proliferation and a decrease in apoptosis. Our present studies showed alterations in gene expression of proliferation pathways by microarray analysis, and particularly, increased expression of IGF1. There was no indication of an effect on pathways associated with oxidative stress. In an experiment in mice, vitamin E did not affect the TG-induced increase in EC proliferation. Furthermore, there was only a minor effect on hepatocellular hypoxia following TG administration, but no hypoxic effect was detected in adipose tissue.
Footnotes
Acknowledgments
We gratefully acknowledge the generosity of Bristol Myers Squibb Co. for providing TG for our experiments; Drs. Joseph Vetro and Tomomi Kiyota at the University of Nebraska Medical Center; and Drs. Jon Cook and Leslie Obert, Timothy Coskran, and Kimberly Navetta at Pfizer, Inc., for many valuable discussions and technical advice.
The authors declared the following sources of funding for the article:
This research was supported in part by a grant to the Cohen research lab from Takeda Pharmaceutical Co. Takeda produces the PPARγ agonist Actos (pioglitazone).
Satoko Kakiuchi-Kiyota, Lora Arnold, Masanao Yokohira, Karen Pennington, and Samuel M. Cohen are members of the Cohen lab.
Dr. Cohen has consulted for several companies regarding the rat bladder carcinogenicity of PPAR agonists.
Various companies involved in the development/marketing of PPARγ and dual agonists.
Dr. Kakiuchi-Kiyota is currently affiliated with Pfizer Drug Safety and Development, Groton, CT, USA. Dr. Yokohira is currently affiliated with the Faculty of Medicine, Kagawa University, Kagawa, Japan.