
Abstract
Seven novel and potent Raf small molecule kinase inhibitors (C1–7) were evaluated in seven-day oral repeat dose rat toxicity studies. All compounds tested induced hyperplasia in multiple tissues. Consistently affected was stratified squamous epithelium at a number of sites and transitional epithelium of urinary bladder and kidney. A seven-day time course study in rats showed morphologic evidence of epithelial proliferation in the nonglandular stomach within four to five hours after a single dose of C-1. Similar indications of cellular proliferation were observed in the urinary bladder by day 2 and in the heart, kidney, and liver by day 3. Transcriptional evidence of proliferation in the urinary bladder was detected within four to five hours after a single dose consistent with activation of the PI3K/AKT and ERK/MAPK pathways. In a twenty-eight-day rat toxicity study of C-1, hyperplasia was observed in the esophagus, nonglandular stomach, skin, urinary bladder, kidney, and heart. Hyperplasia of transitional epithelium of the urinary bladder was particularly severe and in one female rat was accompanied by the presence of a transitional cell carcinoma. These results suggest that these Raf inhibitors induce early transcriptional changes driving unchecked cell proliferation, resulting in marked tissue hyperplasia that can progress to carcinoma within a short time frame.
Introduction
B-Raf is a member of the Raf serine/threonine kinase family that includes the three isoforms A-Raf, B-Raf, and C-Raf (also known as Raf1). It is well established that B-Raf is the main activator of the mitogen-activated-protein kinase (MAPK) pathway, likely the result of its elevated basal kinase activity and higher affinity for the direct substrate MEK1/2 (Papin et al. 1996; Marais et al. 1997), which in turn controls cell proliferation and differentiation. Aberrant activation of this pathway can result in unchecked cell proliferation and lead to cancer (Boutros, Chevet, and Petrakos 2008; Haagenson and Wu 2010). Approximately 60% of melanomas in humans harbor activating mutations in B-Raf, leading to chronic activation of the MAPK pathway, and promote proliferation and malignant transformation (Davies et al. 2002). The B-Raf mutation V600E is one of the most common mutations in melanomas and has emerged as a potential target for melanoma therapy. Indeed, it has been shown that pharmacological inhibition or down-regulation of expression of B-Raf (V600E) blocks melanoma cell proliferation, induces apoptosis in vitro, and inhibits melanoma xenograft growth in vivo (Wan et al. 2004; Hoeflich et al. 2009). Additionally, it has been speculated that selective inhibition of mutant B-Raf (V600E) and reduced inhibition of WT Raf isoforms may provide a wider therapeutic index by virtue of sparing inhibition of MAPK signaling that may be undesirable in nontumor tissue. However, inhibitors selectively blocking mutant B-RAF (V600E) have not been described. Because of their very highly homologous kinase domain, none of the current Raf inhibitors (C1–7) or others described in the literature (Smith et al. 2009; Hatzivassiliou et al. 2010; Carnahan, Beltran, Babij, et al. 2010) show significant molecular Raf isoform selectivity.
Paradoxically, several recent publications have shown that small molecule inhibitors of WT Raf can activate the MAPK pathway and stimulate cell growth in normal tissues (Heidorn et al. 2010; Poulikakos et al. 2010; Hatzivassiliou et al. 2010; Carnahan, Beltran, Babij, et al. 2010). In contrast to tumors harboring mutant B-Raf (V600E), in tumors with WT B-Raf, Raf inhibitors can activate the RAF-MEK-ERK pathway and enhance tumor growth in some xenograft models (Carnahan, Beltran, Babij, et al. 2010; Carnahan, Beltran, Babij, Fernando, et al. 2010). Binding of inhibitors to the ATP binding site of WT Raf was found to induce conformational changes, stabilization of Raf homo/heterodimer and stimulation of MAPK signaling and proliferation. Formation of Raf homo/heterodimers was suggested to result in Raf transactivation only in cells harboring WT B-Raf. These results suggest the potential for unwanted hyperplasia in WT B-Raf expressing tissues exposed to Raf inhibitors. Consistent with this hypothesis are recent Phase 1 and 2 clinical trial results with PLX-4032, a pan-Raf inhibitor. While PLX-4032 demonstrated a significant regression of B-Raf (V600E) expressing melanomas, approximately a third of patients reportedly developed squamous-cell carcinoma of the skin (Brower 2010; Flaherty et al. 2010). The relatively high incidence of squamous-cell carcinomas in these patients does support the hypothesis that Raf inhibitors have the potential to alter WT Raf MAPK pathway homeostasis and induce hyperplasia and neoplasia.
In support of drug discovery efforts, we profiled a number of Raf inhibitors in short-term (seven-day) repeat dose toxicology studies in rats and observed multiple tissue hyperplasia in the rat. A subsequent twenty-eight-day GLP repeat dose toxicology study in rats with one compound showed similar multiple tissue hyperplasia, with one rat showing progression to urinary bladder transitional cell carcinoma. This prompted an investigation to characterize the time course of hyperplasia development and to identify molecular markers and expression changes to understand the mechanism of action. This article outlines the results of these in vivo toxicology and mechanistic studies.
Materials and Methods
Seven-day Repeat Dose Rat Studies
Test Substances
All test substances are novel small molecule B-Raf inhibitors with nanomolar inhibitory potency against both mutant (V600E) and WT B-Raf. Most of these molecules have been previously described (Smith et al. 2009); C-1 is specifically described in Figure 1. All test substances used in this study inhibited Raf activity as evidenced in enzyme assays and in cell and in vivo pharmacodynamic studies that used phospho-ERK as a readout (Carnahan, Beltran, Babij, et al. 2010). In particular, C-1 was the most biochemically potent molecule (WT B-Raf Ki or V600E B-Raf = 1nmol/L; in vitro homogeneous time resolved fluorescence assays) of the seven molecules tested. It should be noted that all compounds also had activity directed against other kinases (Smith et al. 2009). Vehicles used for dosing were 1% (w/v) hydroxypropyl methylcellulose (HPMC)/1% (w/v) Tween 80 in distilled water, pH 2.2 (C-1); 2% (w/v) HPMC/1% (w/v) Tween 80 in deionized or distilled water, pH 2.2 (C-2 or C-3, respectively); 2% (w/v) HPMC/1% (w/v) Tween 80, pH 2.2 (C-6 and C-7), or 0.5% (w/v) carboxymethylcellulose (CMC)/1% (w/v) Tween 80, pH 2.2 (C-4 and C-5). Test article and vehicle control article were stored at room temperature (C-1, C-4, C-5, C-6, and C-7), at room temperature and protected from light (C-2), or refrigerated and protected from light (C-3). Predose and postdose concentrations of test article in vehicle were within 10% of target concentrations for C-1, C-2, C-3, C-4, C-5, and C-7. C-6 concentrations were 121% and 119% of target concentrations predose and postdose, respectively (data not shown).
Test Animals
Sprague Dawley rats were obtained from Charles River Laboratories. Rats were housed individually in stainless steel, wire-bottom suspended cages (C-1, C-2, and C-3) or triple-housed in ventilated, polycarbonate, microisolated cages containing corncob bedding (Harlan Teklad, Madison, WI) (C-4, C-5, C-6, and C-7). Environmental controls for the animal rooms were set to maintain a temperature range of 60° to 80°F, relative humidity of 30% to 70%, a twelve-hour light/dark cycle, and a minimum of ten air exchanges per hour. The animals were offered Teklad Rodent Diet (Harlan Laboratories) and municipal tap water further purified by reverse osmosis ad libitum. C-1 was administered to male and female rats; C-2 and C-3 to female rats; and C-4, C-5, C-6, and C-7 to male rats. At initiation of treatment, rats were approximately eight to ten weeks of age and 200 to 250 g (C-1, C-2, and C-3) or eight to twelve weeks of age and 200 to 350 g (C-4, C-5, C-6, and C-7).
Experimental Design
Studies were conducted at Amgen Inc., Thousand Oaks, California, in AAALAC-accredited facilities. All procedures in the protocols were compliant with the Animal Welfare Act, the Guide for the Care and Use of Laboratory Animals, and the Office of Protection from Research Risks.
Animals were assigned to treatment groups using a manual or computerized randomization blocking procedure. Rats received vehicle or test article by oral gavage (10 mL/kg) once daily for seven consecutive days at approximately the same time every morning; C-1 doses were 30, 100, or 300 mg/kg (five rats/sex/group); C-2 doses were 30, 100, or 300 mg/kg (three rats/group); C-3: 30, 150, or 500 mg/kg (three/group); C-4: 300 mg/kg (two rats); C-5: 80 mg/kg (three rats); C-6: 30 mg/kg (three rats); and C-7: 150 mg (three rats). Dose levels were selected to ensure coverage and inhibition of the B-Raf target and to explore the toxicological profile of each molecule.
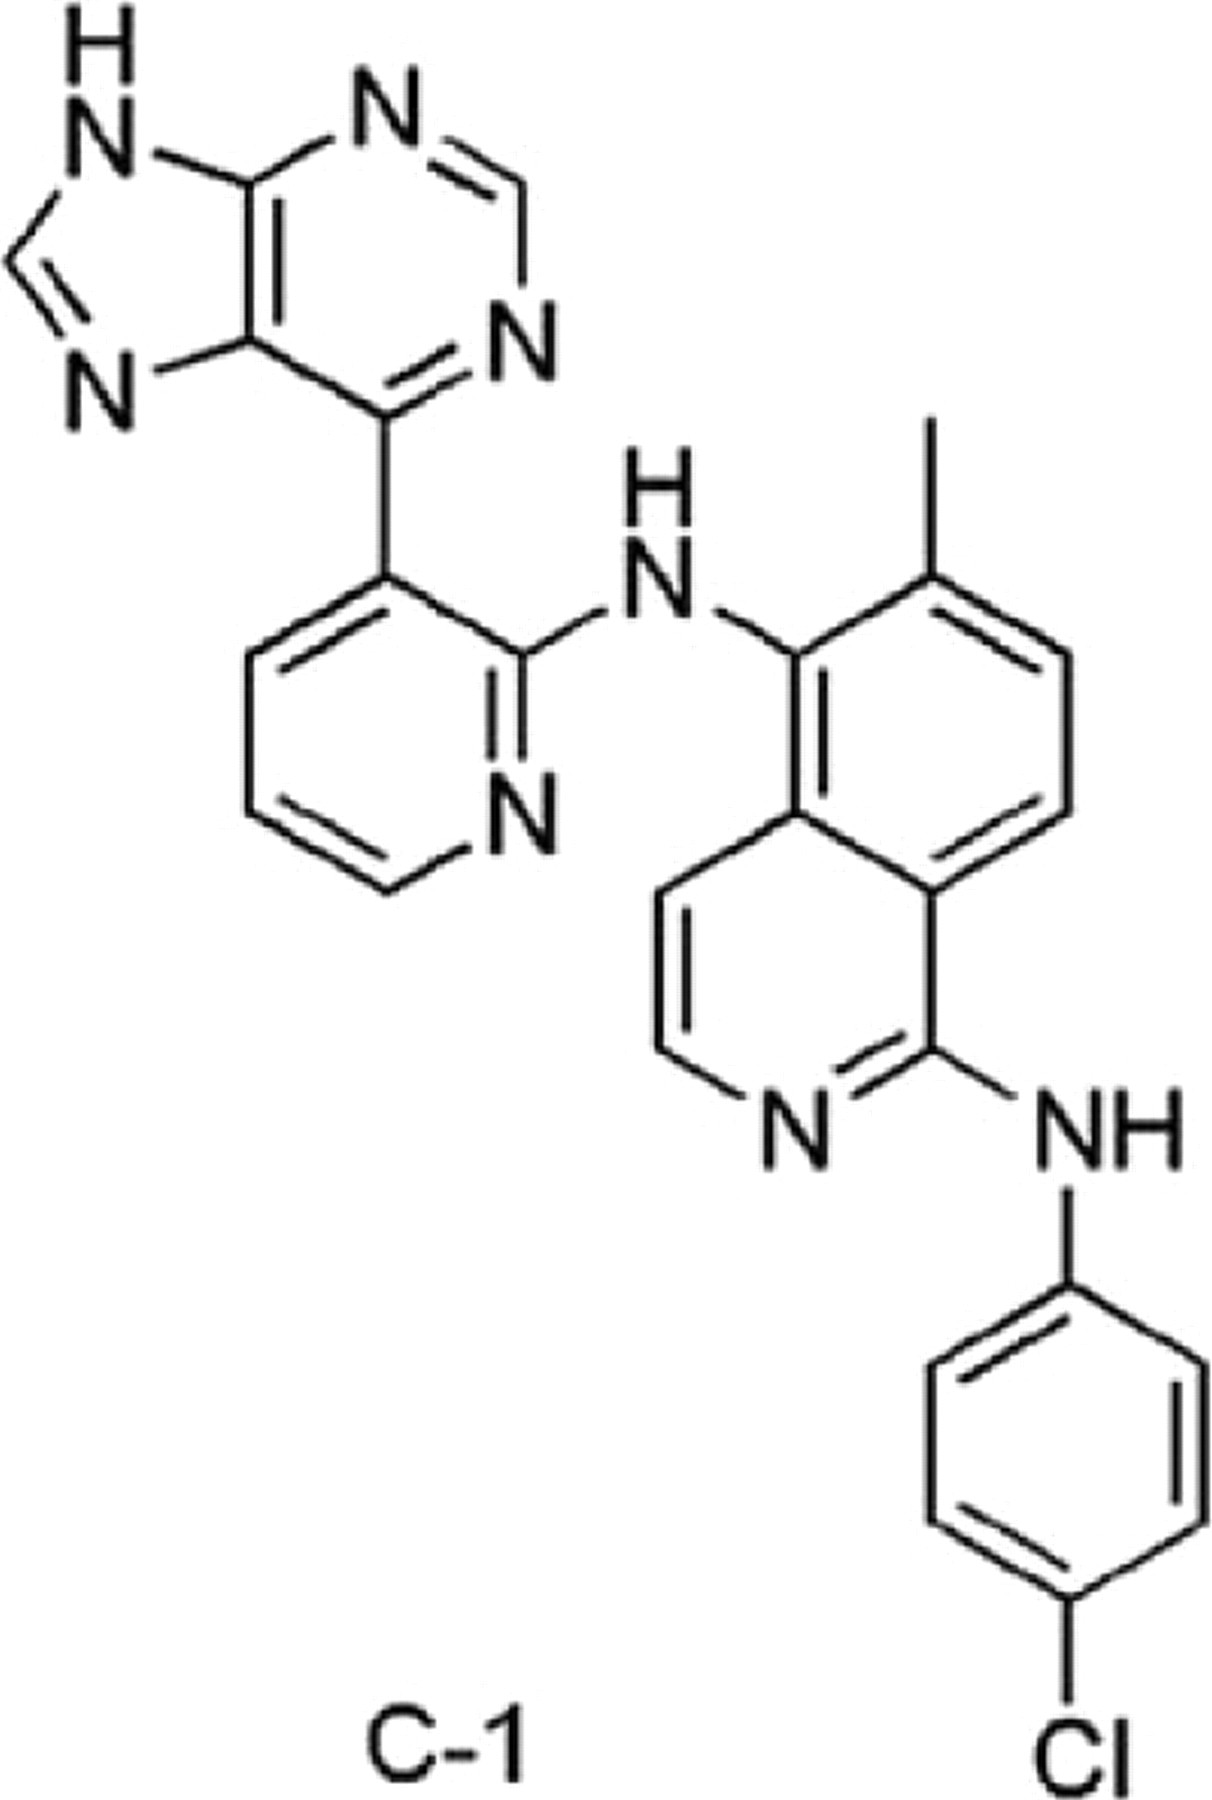
Structure of C-1.
Animals were euthanized on day 8 and necropsied. The following tissues were collected from each male or female animal and preserved in appropriate fixative (Davidson’s fixative for eyes and testes; 10% neutral buffered formalin for other tissues): heart; liver; spleen; kidney; adrenal; tongue; esophagus; stomach; duodenum; ileum; cecum; colon; eyes; ovary; uterus; vagina; epididymis; testis; thymus; foot pad; mammary gland; pancreas; sciatic nerve; trachea; brain; aorta; skeletal muscle; bone and bone marrow (tibia or femur); jejunum; lungs; lymph node; thyroid with parathyroid; urinary bladder; skin; tail; and gross lesions. Tissues were embedded in paraffin, sectioned, and stained with hematoxylin and eosin (H&E). Slides were examined by routine light microscopy.
Seven-day Time Course Rat Study with Immunohistochemistry and Toxicogenomics Assessments
Test Substance
The test substance was C-1 (Figure 1). The vehicle control article was 0.5% (w/v) CMC/1% (w/v) Tween 80 in reverse osmosis water, pH 2.2. Test article and vehicle control article were stored at room temperature and protected from light. Predose and postdose concentrations of test article in vehicle were within 10% of target concentrations (data not shown).
Test Animals
Female Crl:CD(SD) rats were obtained from Charles River Laboratories (Portage, MI). Animals were individually housed in stainless steel cages. Environmental controls for the animal room were set to maintain a temperature range of 18° to 26°C, relative humidity of 30% to 70%, a twelve-hour light/dark cycle, and a minimum of ten air changes/hour. Animals were given dietary supplements as a form of environmental enrichment and were also given various cage-enrichment devices. The animals were offered Certified Rodent Diet #2016C (Harlan Teklad) and purified municipal tap water ad libitum. Rats were fifty-nine to sixty-five days of age at initiation of treatment and weighed 189 to 237 g.
Experimental Design
The in-life portion of the study was conducted at Covance Laboratories Inc., Madison, Wisconsin. Amgen Inc. was responsible for pathology, immunohistochemistry, and toxicogenomic assessments. All procedures in the protocols were compliant with the Animal Welfare Act, the Guide for the Care and Use of Laboratory Animals, and the Office of Laboratory Animal Welfare.
Animals were assigned to treatment groups using a computerized randomization procedure designed to achieve body weight balance with respect to treatment group. Rats (twenty-five/group) were assigned to groups receiving 0 (vehicle) or 100 mg C-1/kg by oral gavage (10 mL/kg). Five sets of five females/dose group received either a single dose on day 1 with necropsy four to five hours postdose; a single dose on day 1 with necropsy on day 2 (approximately twenty-four hours post–day 1 dosing); two daily doses with necropsy on day 3; four daily doses with necropsy on day 5; or seven daily doses with necropsy on day 8.
Heart, kidney, liver, nonglandular stomach, and urinary bladder were collected and divided; 1 portion was flash frozen in liquid nitrogen in preparation for potential toxicogenomics assessments, and the other portion was placed in 10% neutral buffered formalin in preparation for light microscopy. The urinary bladder was marked on the ventral surface while in situ with tissue marking dye so that the ventral surface could be identified during evaluation of sections. Tissue samples fixed in 10% neutral buffered formalin were processed and embedded in paraffin. Sections from all organs were stained with H&E.
Immunohistochemistry Assessment
Sections of liver, nonglandular stomach, and urinary bladder were stained by immunohistochemical methods to demonstrate Ki67 and phosphorylated histone H3 (pHistone H3) as markers of cellular proliferation. Additionally, sections of urinary bladder were stained by immunohistochemical methods to demonstrate keratins 5, 17, and 20; uroplakin III and claudin 4 as markers of epithelial differentiation. The immunohistochemical staining methods are summarized in Table 1. All sections were examined by routine light microscopy.
Toxicogenomics Data Generation
Samples of the frozen urinary bladder tissue from each necropsy time point and from the nonglandular stomach tissue from the two earliest time points were used for toxicogenomics assessment. Total RNA was isolated from 16 to 37 mg pieces of frozen intact tissue. All samples were of good quality, as evidenced by distinct 18S and 28S ribosomal RNA peaks, low baseline, and high RNA Integrity Number values (Agilent Bioanalyzer). Microarray hybridization to Affymetrix Rat Genome 230 2.0 Arrays (Affymetrix, Santa Clara, CA) was performed according to the manufacturer’s protocol. Initial data analyses and quality checks were carried out using Affymetrix GeneChip Operating Software and Quality Reporter.
Toxicogenomics Data Analysis
Each tissue and time point were analyzed independently. Expression data was preprocessed using Rosetta Resolver (Rosetta Inpharmatics LLC, Seattle, WA). A probe set was considered present if the p value associated with its intensity being different from the background intensity was ≤ .05. Probe sets that were present on at least five microarrays out of ten at each given time point were included for further analysis. The data was normalized using quantile normalization (Gautier et al. 2004). The Empirical Bayes Method for Microarrays (Kendziorski et al. 2003) was used to identify the signature probe sets that were differentially expressed (DE) between treatment and controls at each time point and for each tissue. The False Discovery Rate (FDR) was stringently controlled at a level of .01. Signature probe sets having an average fold change greater than ± 1.25 were submitted to the Ingenuity Pathways Analysis (IPA)–Tox™ analysis function in IPA (Ingenuity Systems, Inc., Redwood City, CA) to identify canonical pathways with pathway members that are overrepresented in the list of treatment related signature genes. Canonical pathways with an associated FDR ≤ 0.1 were deemed to be pathways that were significantly perturbed by treatment. Note that approximately 50% of sequences were mapped to annotated pathways in IPA.
Twenty-eight-day Oral Gavage Rat GLP Toxicity Study
Test Substance
The test substance was C-1 (Figure 1). The vehicle control article was 0.5% (w/v) CMC/1% (w/v) Tween 80 in deionized water, pH 2.2. Test article and vehicle control article were stored at room temperature and protected from light. Concentrations of test article in vehicle were within 10% of target concentrations on days 1, 8, 15, and 22.
Test Animals
Male and female Sprague Dawley rats were obtained from Shanghai Sippr-BK Lab Animal Co. Ltd. (Shanghai, China). Rats were housed in plastic cages each fitted with a stainless cover-feed rack with Corn Cobs Bedding (Shanghai Maosheng Biologic Science & Technology Development Co. Ltd., Shanghai, China). Environmental controls for the animal room were set to maintain 18° to 26°C, a relative humidity of 30 to 70%, a twelve-hour light/dark cycle, and a minimum of 10 air changes/hour. The animals were offered certified rodent diet (Growth and Reproduction Diets, Shanghai Shilin Bio-Technology Company, Shanghai, China) and Litree Household Ultrafiltration Filter-purified and sterilized water. Rats were approximately seven weeks of age at initiation of treatment and weighed 187 to 228 g.
Experimental Design
The study was conducted at the Shanghai Institute of Materia Medica, Shanghai, People’s Republic of China, in accordance with the Chinese State of Food and Drug Administration Good Laboratory Practice (GLP) regulations. All procedures in the protocol were compliant with the Animal Welfare Act, the Guide for the Care and Use of Laboratory Animals, and the Office of Laboratory Animal Welfare.
Animals were assigned to treatment groups using a computerized randomization procedure designed to achieve body weight balance with respect to groups. Rats (five/sex/group) received 0 (vehicle), 1, 5, or 50 mg C-1/kg (males) and 0 (vehicle), 5, 15, or 100 mg C-1/kg (females) by oral gavage (10 mL/kg) once daily for twenty-eight days.
Summary of immunohistochemical methods.
HRP, horseradish peroxidase; IgG, immunoglobulin G; NA, not applicable; no., number; pHistone H3, phosphorylated histone H3; pMAPK, phosphorylated mitogen-activated protein kinase.
a Diva, Biocare Medical; Concord CA, catalog no. DV2004 under pressure in the Decloaking Chamber (Biocare, catalog no. DC2002) at 125°C for 30 seconds then 90°C for 10 seconds;
b Citra, BioGenex; San Ramon, CA, catalog no. HK086-9K; heated in microwave at 99.9°C for 10 minutes;
c Pepsin, Biocare Medical; catalog no. PEP956, 10 minutes at room temperature.
After twenty-eight days of treatment animals were euthanized and necropsied. The following tissues were collected from each animal and placed in appropriate fixative: heart; liver; spleen; kidney; adrenal; tongue; esophagus; stomach; duodenum; ileum; cecum; colon; eye; ovary; uterus; vagina; cervix; seminal vesicle; epididymis; prostate; testis; optic nerve; pituitary gland; thymus; foot pad; harderian gland; mammary gland; pancreas; sciatic nerve; trachea; brain; aorta; skeletal muscle (thigh); femur with bone marrow; jejunum; lung with large bronchi; lymph node; Peyer’s patch; rectum; salivary gland (mandibular and sublingual); spinal cord (cervical, thoracic, and lumbar); sternum with bone marrow; thyroid with parathyroid; urinary bladder, Zymbal’s gland, skin/subcutis, and gross lesions. Tissues were embedded in paraffin, sectioned, and stained with H&E. Slides were examined by routine light microscopy and peer-reviewed by Amgen Pathology.
Results
Seven-Day Repeat Dose Studies in Rats
All Raf inhibitors tested induced hyperplasia in multiple tissues in the rat at the dosages and time tested (Table 2). Cell types most commonly affected were stratified squamous epithelium (esophagus, nonglandular stomach, footpad, and skin of the tail; Figure 2) and transitional epithelium (urinary bladder and renal papilla/pelvis; Figures 3 and 4). Affected epithelia were thickened and often had increased numbers of mitotic figures in the basal layers. The thickened stratified squamous epithelium was usually hyperkeratotic. Additionally, increased numbers of mitotic figures were seen in sebaceous glands in the hyperplastic skin of the tail. No evidence of inflammation was present in these tissues.
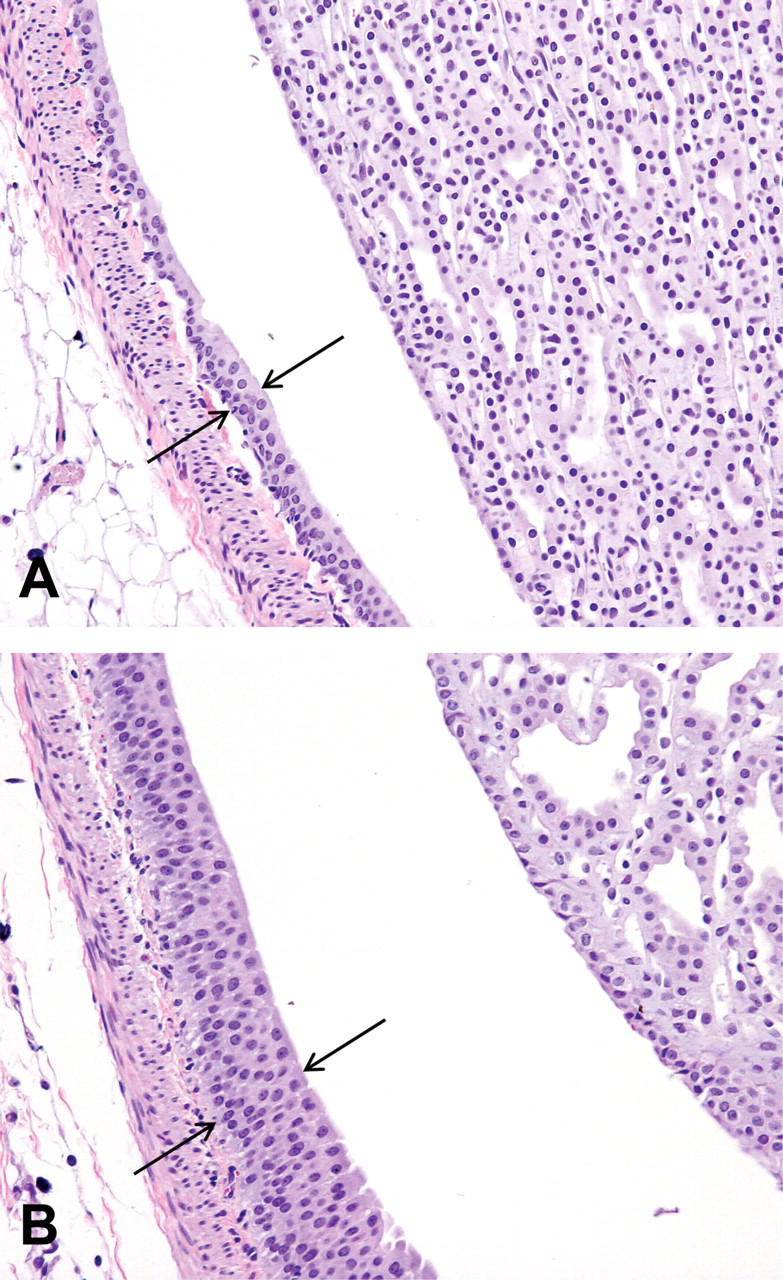
Renal pelvis and papilla from rats treated orally for seven consecutive days with vehicle (A) or C-1 (B) (100 mg/kg/day). The transitional epithelium (solid arrows) of the renal pelvis is hyperplastic following treatment with C-1. H&E; 200x.
Urinary bladder from rats treated orally for seven consecutive days with vehicle (A) or C-1 (B) (100 mg/kg/day). The transitional epithelium (solid arrows) of the bladder is hyperplastic following treatment with C-1. H&E; 200x.
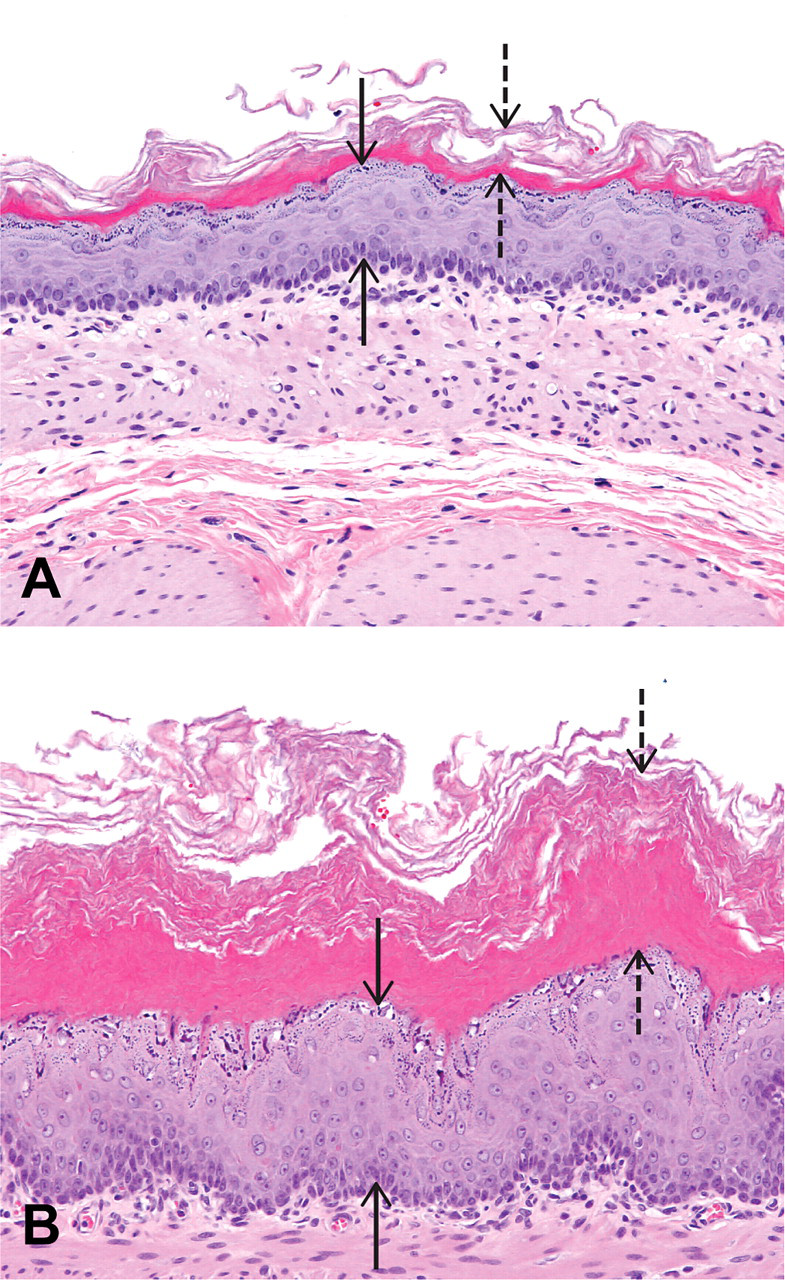
Nonglandular stomach from rats treated orally for seven consecutive days with vehicle (A) or C-1 (B) (100 mg/kg/day). The epithelial cell layer (solid arrows) is hyperplastic, and the keratin layer (dashed arrows) is thickened (hyperkeratosis) following treatment with C-1. H&E; 200x.
Histological findings of cellular proliferation from seven-day studies of B-Raf inhibitors in rats.
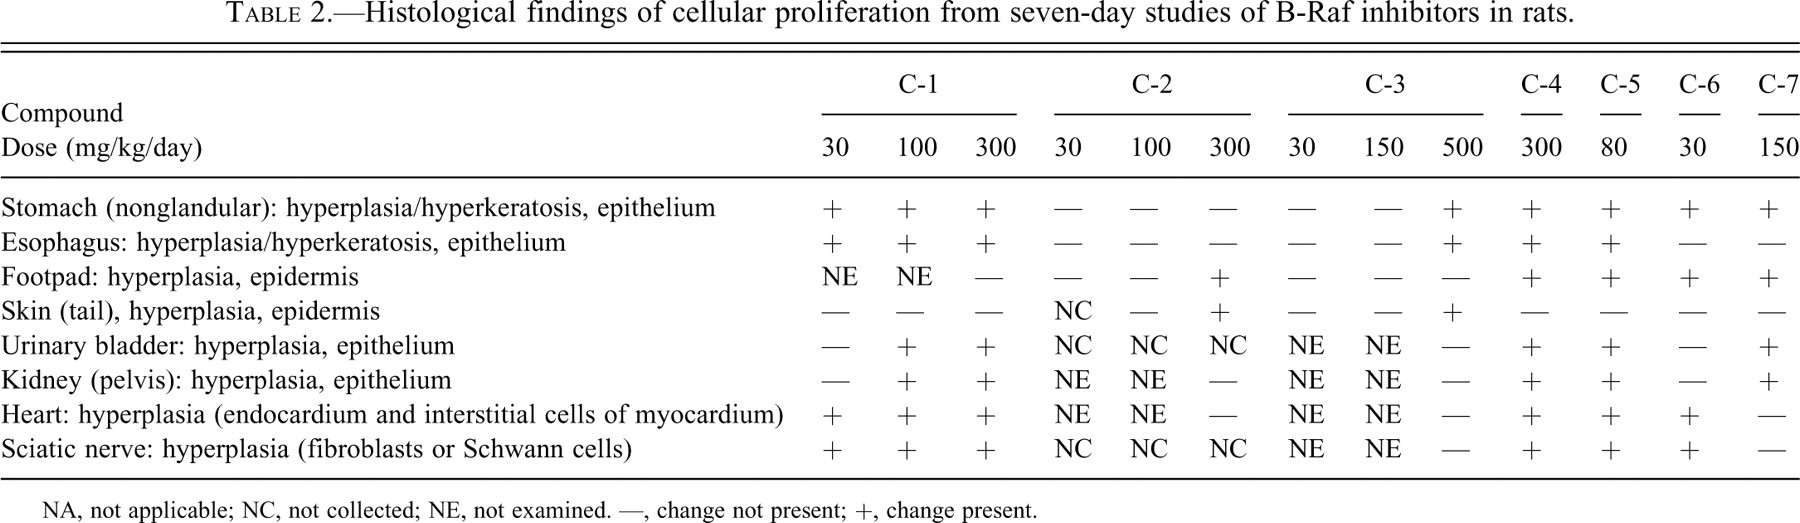
NA, not applicable; NC, not collected; NE, not examined. —, change not present; +, change present.
Hyperplasia was also noted in the heart and sciatic nerve. In the heart, the endocardium was most commonly affected and was characterized by increased size and numbers of elongated cells that in some instances appeared to be endothelium, but in most instances were clearly below the endothelium (Figure 5). The precise nature of these cells is unknown, although they are likely to be fibroblasts of the endocardium. Mitotic figures were often observed in these cells. These changes occurred predominantly in the left ventricle and were most easily seen in the chordae tendinae, but also occurred in other areas of the endocardium and in the atrioventricular valve leaflets. In several rats with endocardial changes, the myocardium of the apex of the heart appeared hypercellular due to hyperplasia of spindle-shaped, interstitial cells. Areas of myocyte necrosis were noted in some rats.
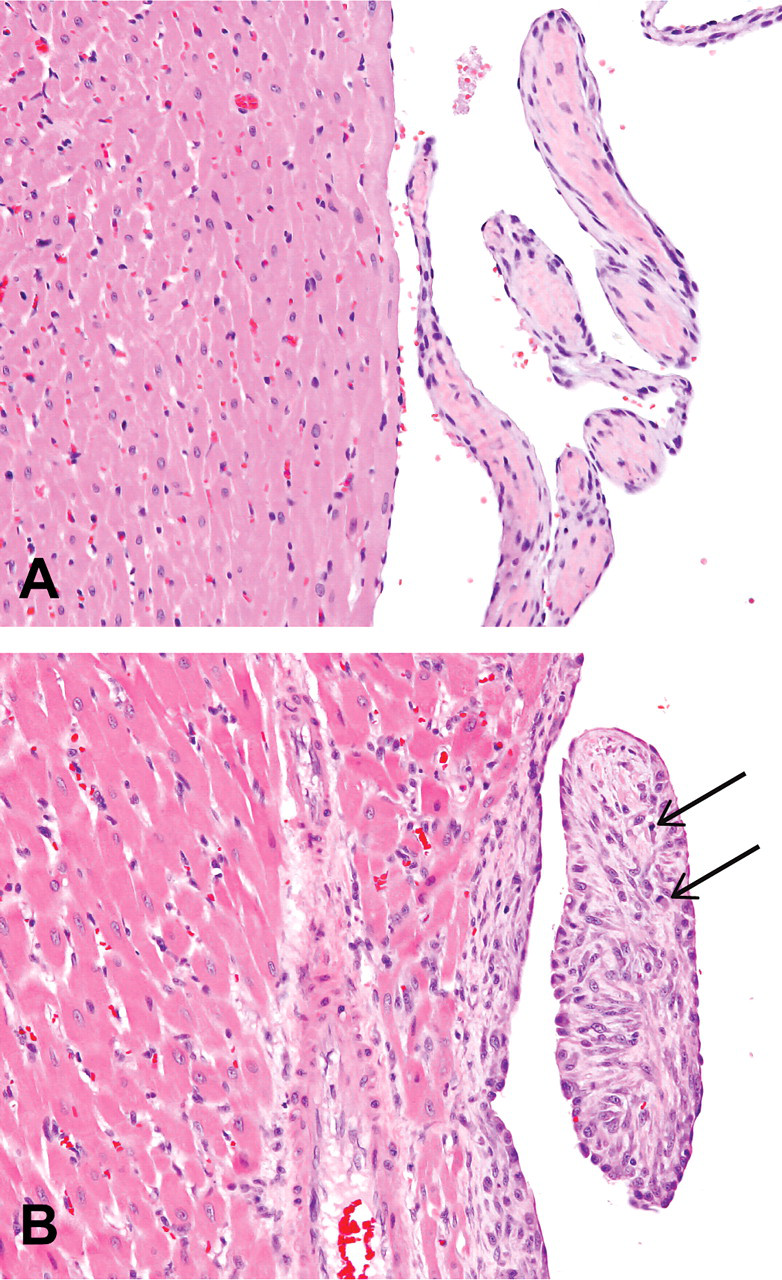
Heart from rats treated orally for seven consecutive days with vehicle (A) or C-1 (B) (300 mg/kg/day). The endocardium of the left ventricular wall and of chordae tendinae are hyperplastic following treatment with C-1. Mitotic figures (arrows) were often observed in these cells. H&E; 200x.
Affected sciatic nerves were hypercellular and individual myelinated axons were separated from adjacent axons (Figure 6). No evidence of demyelination, such as myelin vacuolation or the presence of foamy macrophages was noted. The increased cellularity was due to hyperplasia of cells with plump, elongated nuclei. The precise nature of the cells is unknown although they are likely either fibroblasts or Schwann cells. Mitotic figures were occasionally seen in them. Similar changes were occasionally noted in peripheral nerves in other tissues.
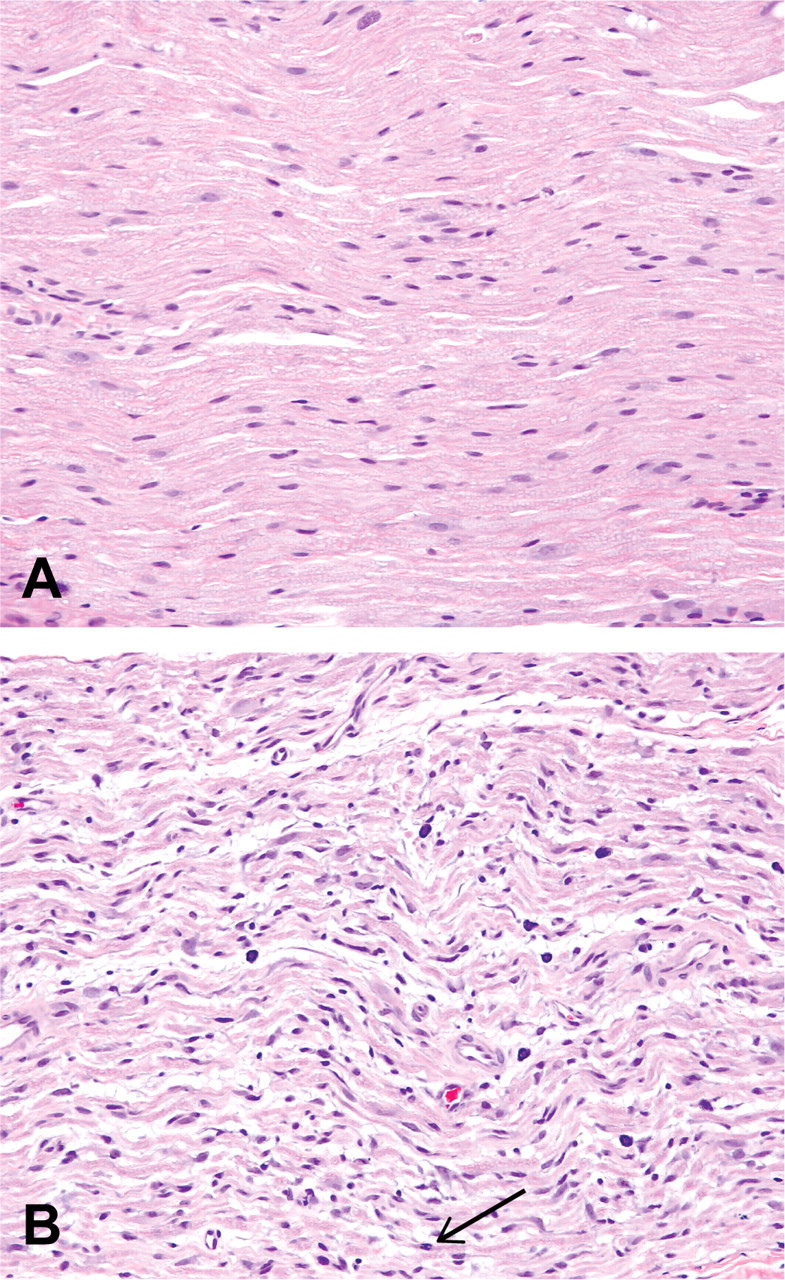
Sciatic nerve from rats treated orally for seven consecutive days with vehicle (A) or C-1 (B) (30 mg/kg/day). Individual myelinated axons are separated from adjacent axons, and the nerve is hypercellular due to hyperplasia of cells with plump, elongated nuclei. Mitotic figures (arrow) were occasionally seen in these cells. H&E; 200x.
Seven-day Time Course Study in Rats
The first observed proliferative change related to C-1 treatment occurred in the epithelium of the nonglandular stomach at the first time point on day 1, only four to five hours after the first dose, and consisted of increased numbers of mitotic figures and increased numbers of cells stained for pHistone H3 (Figure 7). On day 2, twety-four hours after the first dose of C-1, the epithelium of the nonglandular stomach showed increased basophilia, crowding and slight disorganization of the basal layer of the epithelium, and had increased numbers of mitotic figures as well as increased staining for pHistone H3 and Ki67 (day 2 data not shown). The epithelial changes were accompanied by submucosal edema in some rats. These changes were present at all subsequent time points. At later time points, the epithelium was also noticeably thickened (hyperplastic).
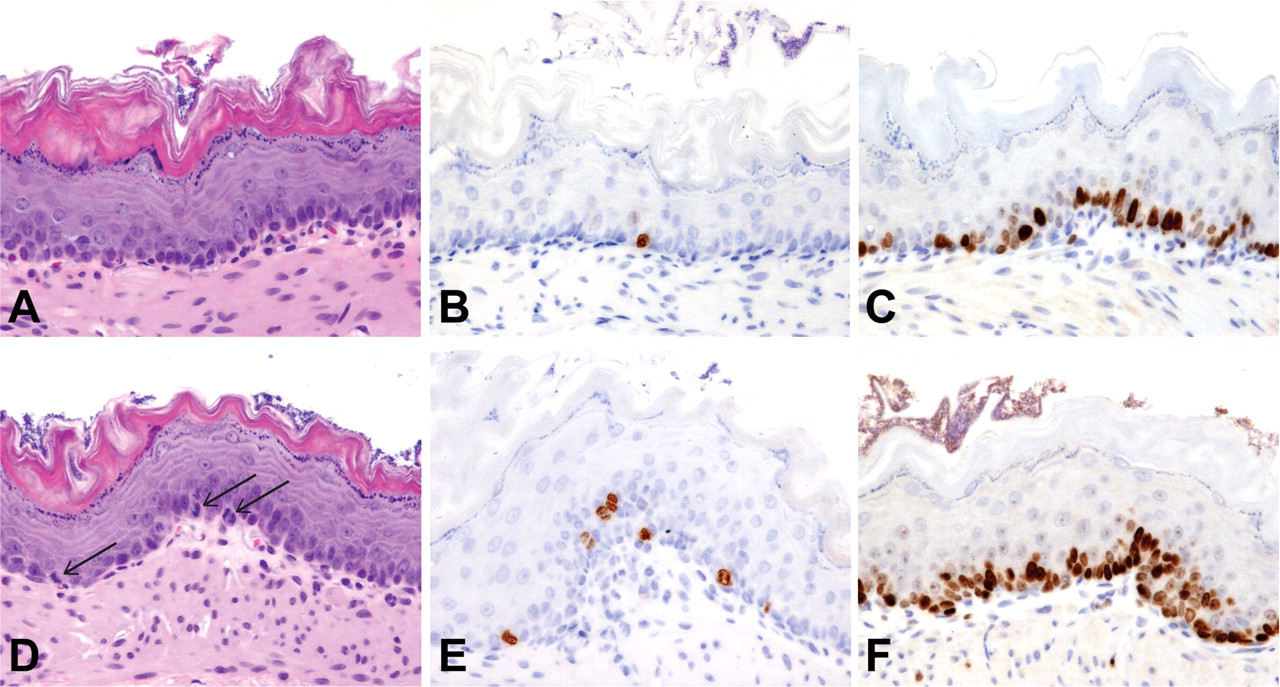
Sections of nonglandular stomach collected from rats four to five hours after a single oral dose of vehicle (A-C) or C-1 (D–F) (100 mg/kg/day). Sections were stained with H&E (A and D) or by immunohistochemical methods to demonstrate pHistone H3 (B and E) or Ki67 (C and F) as markers of cellular proliferation. Several mitotic figures (arrows) are present in the basal layer of the epithelium in the H&E-stained section from the rat treated with C-1 (D). A corresponding increase in numbers of epithelial cell nuclei staining for pHistone H3 (stained brown) is also observed in the nonglandular stomach from this rat (E). The number of epithelial cell nuclei staining for Ki67 was not considered increased above control levels in the entire section of nonglandular stomach from the rat receiving C-1; however, the region of the nonglandular stomach shown (F) does have an increased number of tightly crowded, epithelial cell nuclei staining for Ki67 (stained brown). Hematoxylin counterstain (B and C; E and F); 400x.
Changes in urinary bladder were first noted on day 2 and consisted of crowding and slight disorganization of the basal layer of the transitional epithelium associated with increased numbers of mitotic figures and increased staining for pHistone H3 and Ki67 (Figure 8). Ectopic staining of superficial epithelium for keratin 17, decreased staining of superficial epithelium for keratin 20, and submucosal edema were noted in some rats on this day. Hyperplasia of the epithelium occurred at later time points. These epithelial changes had no particular orientation to the ventral or any other portion of the bladder mucosa. On days 5 and 8 (after five and seven doses of C-1, respectively), 1 rat had abnormal distribution of staining for keratin 5, and a few rats had decreased staining for uroplakin III, which often accompanied the previously described alterations in staining for keratins 17 and 20 (Figure 9). Areas of degeneration were present in the smooth muscle of the bladder in one rat on day 5 and one rat on day 8. Immunohistochemical staining for claudin 4 was performed on sections of urinary bladder; however, no treatment-related effects were seen.
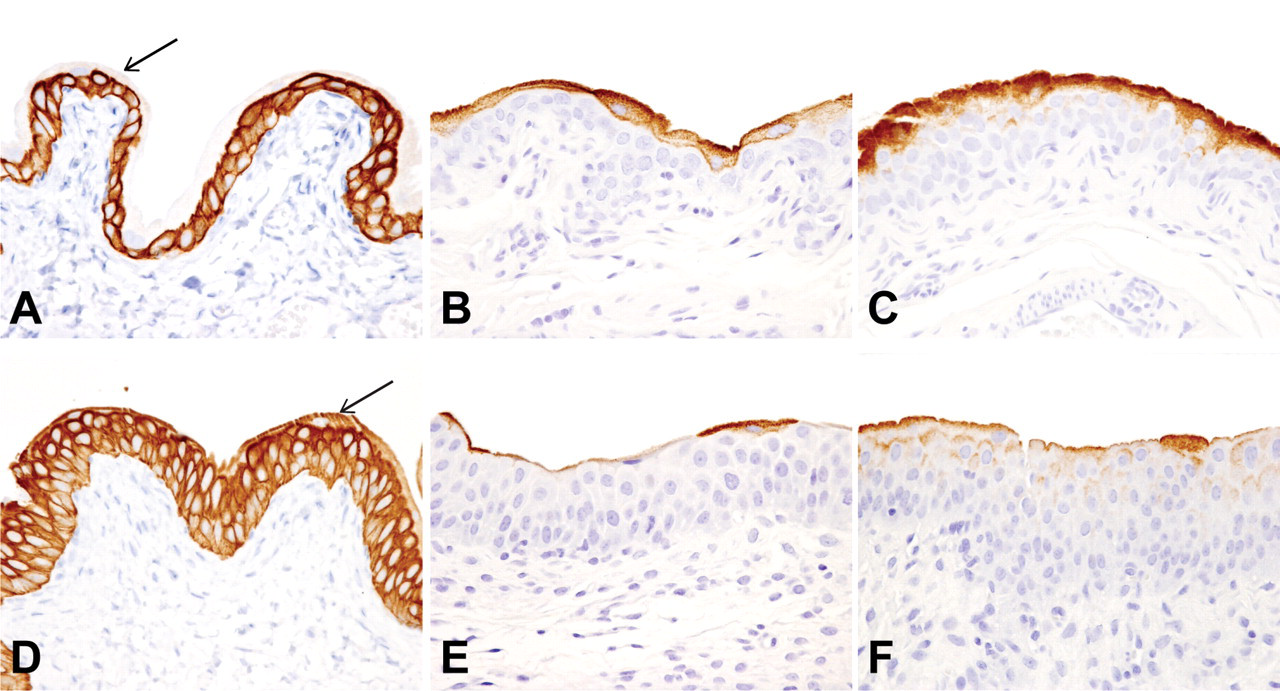
Sections of urinary bladder collected from rats on day 5 after receiving four daily doses of vehicle (A-C) or C-1 (D–F) (100 mg/kg/day). Sections were stained by immunohistochemical methods to demonstrate keratin 17 (A and D), keratin 20 (B and E), or uroplakin (C and F). Note that keratin 17 (stained brown) is present in the basal and intermediate layers of the epithelium of the urinary bladder from the vehicle-treated rat, but is not present in the superficial (luminal) layer of the epithelium (arrow; A). In contrast, keratin 17 is present in all portions of the epithelium, including the superficial layer (arrow), of the urinary bladder from the C-1-treated rat (D). Keratin 20 (B) and uroplakin (C) (stained brown) are present in only the superficial portion of the epithelium in the vehicle-treated rat. Staining for these epithelial cell markers is reduced in the epithelium of the rat treated with C-1. Hematoxylin counterstain; 400x.
Sections of urinary bladder collected from rats on day 2, twenty-four hours after receiving a single dose of vehicle (A-C) or C-1 (D–F) (100 mg/kg/day). Sections were stained with H&E (A and D) or by immunohistochemical methods to demonstrate pHistone H3 (B and E) or Ki67 (C and F) as markers of cellular proliferation. Increased mitotic activity is present in the epithelium of the urinary bladder from the C-1-treated rat as shown by mitotic figures in the H&E-stained section (arrows, D) and increased numbers of epithelial cells staining for pHistone H3 (E) or Ki67 (F) (stained brown). Hematoxylin counterstain (B and C; E and F); 400x.
Treatment-related changes in the heart first became apparent on day 3 and consisted of vacuolar degeneration of cardiac myocytes and hypertrophy/hyperplasia of endothelial/subendothelial cells of the endocardium. The endocardial changes were similar to those observed in the seven-day repeat dose studies (described above) and were present from day 3 through the remaining days of this time course study. Additionally, on days 5 and 8, hyperplasia of spindle-shaped, interstitial cells was noted in the myocardium at the apex of the heart. One of the affected rats had areas of myocardial necrosis.
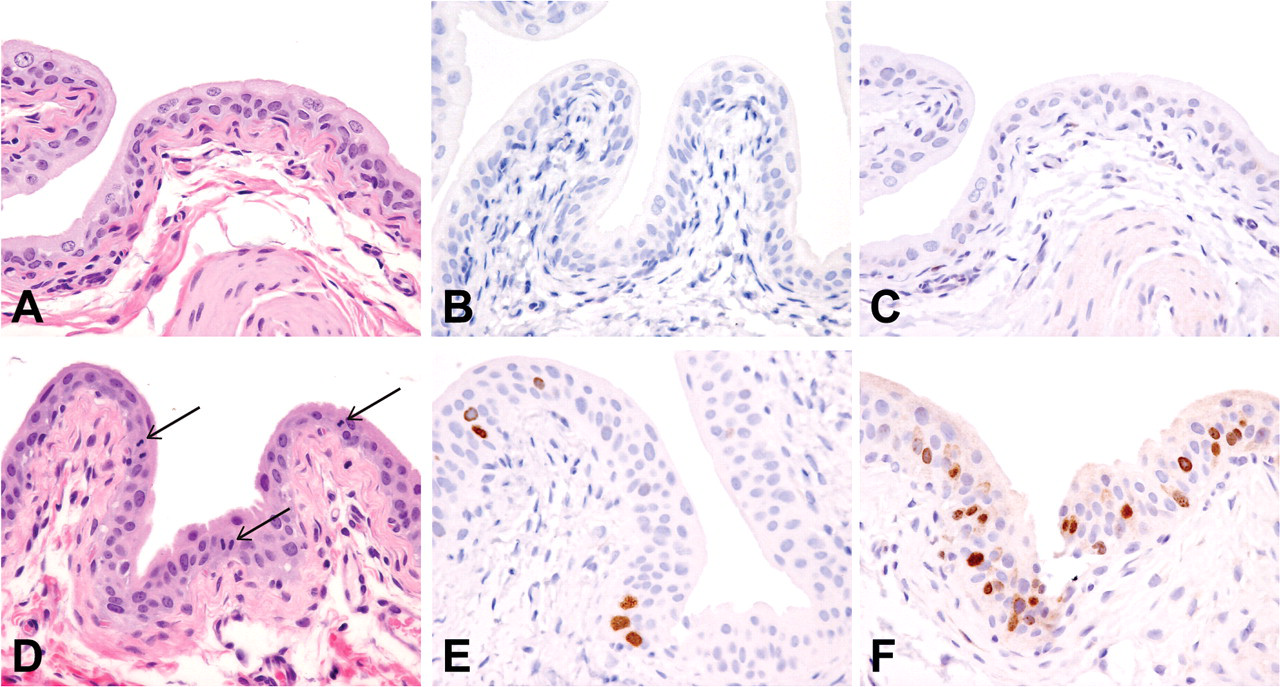
Hyperplasia of the transitional epithelium of the renal papilla/pelvis occurred from day 2 through the remainder of the study in several rats receiving C-1. Additionally, hyperplasia/hypertrophy of hepatic intrasinusoidal cells (possibly Kupffer cells) was noted in a few C-1-treated rats from day 3 through the remainder of the study. This change was associated with increased numbers of intrasinusoidal cells staining for Ki67. One of these rats also had a minimal increase in numbers of intrasinudoidal cells staining for pHistone H3.
Toxicogenomics Assessment from the seven-day Time Course Rat Study
Exposure of C-1 to female rats led to dramatic changes in gene expression in bladder tissue within five hours of exposure. Approximately 14% of the genes expressed in bladder were changed at this time point (data not shown). Using Ingenuity IPA, a number of pathways were identified as being significantly impacted by treatment. For example, modulation of the extracellular signal-regulated kinase/mitogen-activated protein kinase (ERK/MAPK) and phosphatidylinositol 3-kinase/AKT family (PI3K/AKT) pathways was observed. Included in these pathways were changes related to the up-regulation of a number of factors involved in cell growth and protein synthesis such as AKT1 and AKT2 (2.5-fold), PIK3CA (2-fold), RRAS (2-fold), HSP90 AB1 (3-fold), eIF4e (1.5-fold), cyclin D1 (2-fold), JAK2 (2-fold), RPS6KB1 (2-fold), and a number of phosphatases including PP2R4, PP2R1A, PP2R5E (4- to 5-fold). Changes in the IPA PI3K/AKT pathway are illustrated in Figure 10. There were a number of proliferative signaling pathways that were identified as being significantly impacted in the bladder by C-1 treatment at the five-hour time point. IPA describes these separately but there is significant overlap of the individual genes across these pathways and they are illustrated in Figure 11. The pathways affected in the nonglandular stomach samples at twenty-four hours were similar to the changes seen in the bladder at later time points (Figure 11).
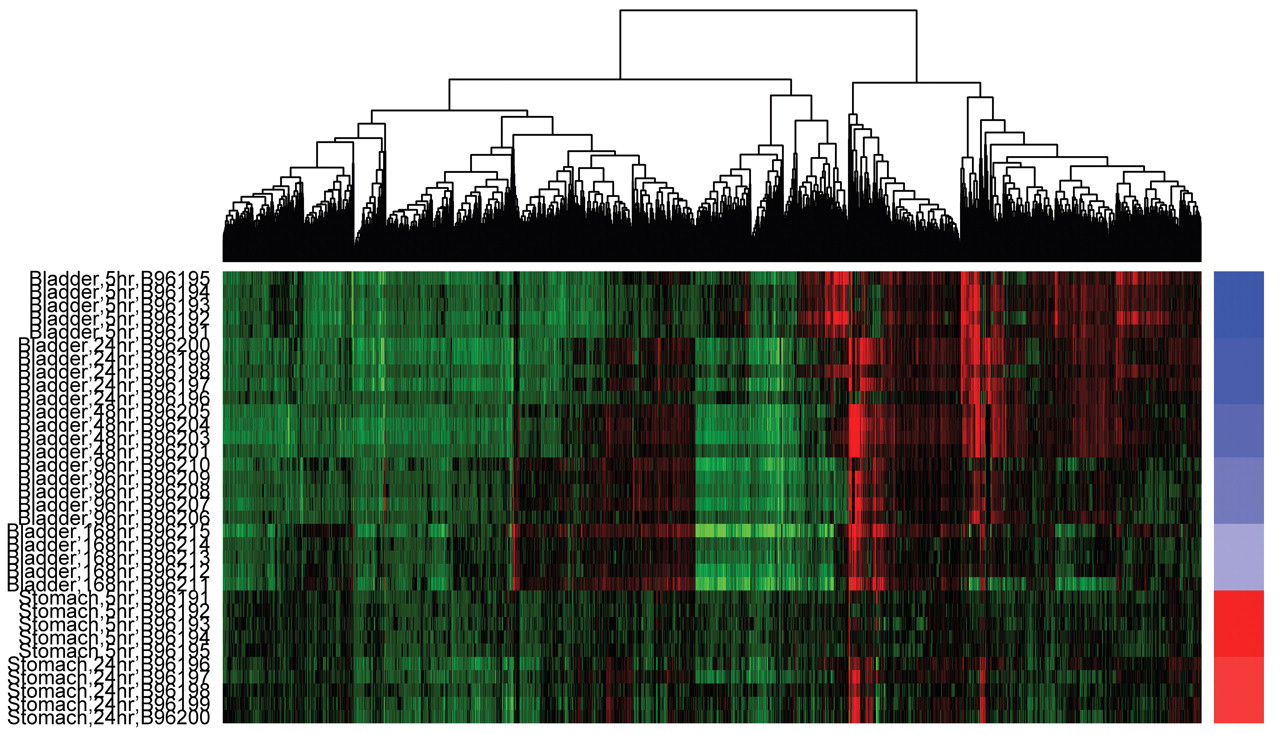
Heatmap of all of the genes belonging to the bladder signature (union of all DE genes in bladder at each time point). Bladder samples are annotated with blue shaded bars. Nonglandular stomach samples are included for comparison purposes and are marked with red-shaded bars. Within each tissue, columns are ordered from earliest to latest time point. Hierarchical clustering of genes was performed without bootstrapping to determine significance. The dynamic range represented is +5-fold change (red) to –5-fold change (green). Black indicates no change in expression with respect to controls. Fold-change is calculated on a per animal basis. Each unique animal is labeled using its unique identifier. This figure illustrates that uniformity of response for genes in the pathways across all samples and demonstrates that variation is driven by time point.
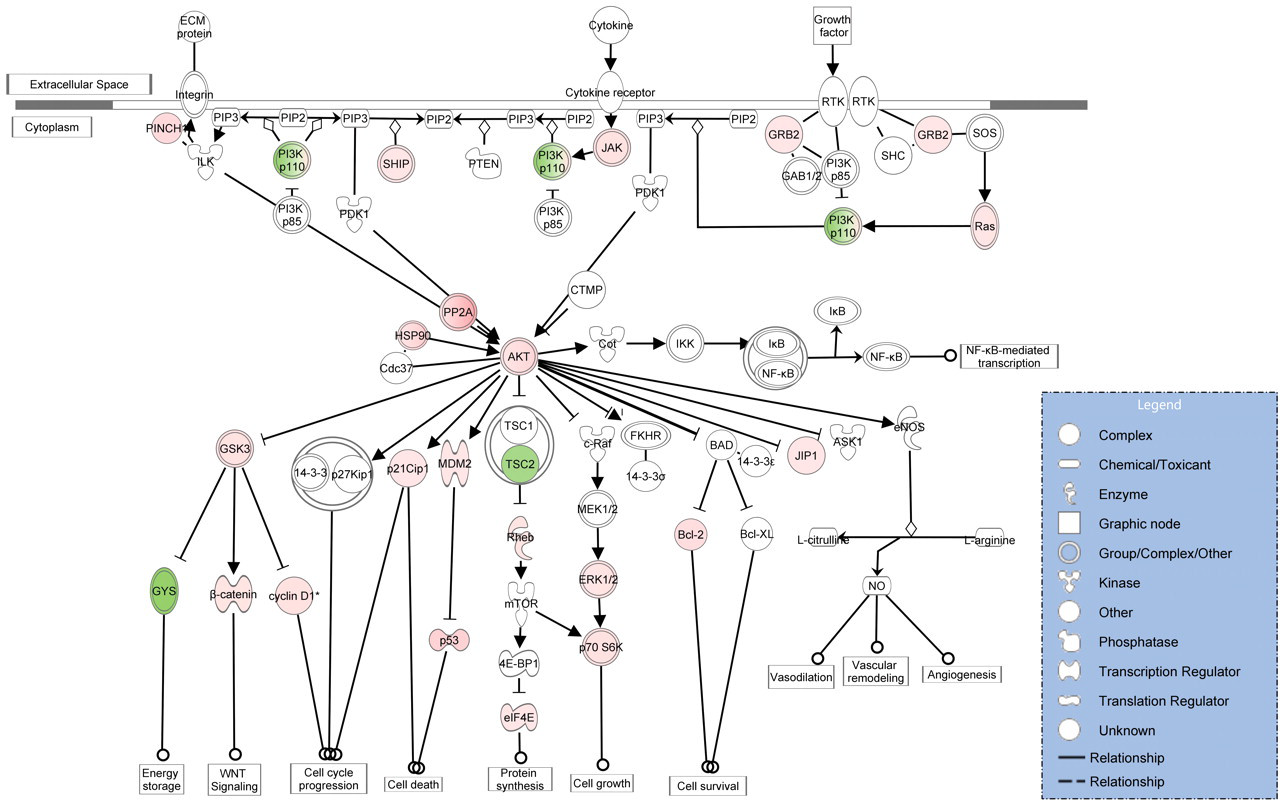
Visualization of the PI3K/AKT pathway in rat bladder tissue exposed to C-1. Genes colored in red were up-regulated and genes colored in green were down-regulated five hours after oral administration of 100 mg/kg/day C-1 relative to vehicle control animals. Data were analyzed through the use of Ingenuity Pathways Analysis (Ingenuity® Systems, www.ingenuity.com).
Twenty-eight-day Repeat Dose Rat Study
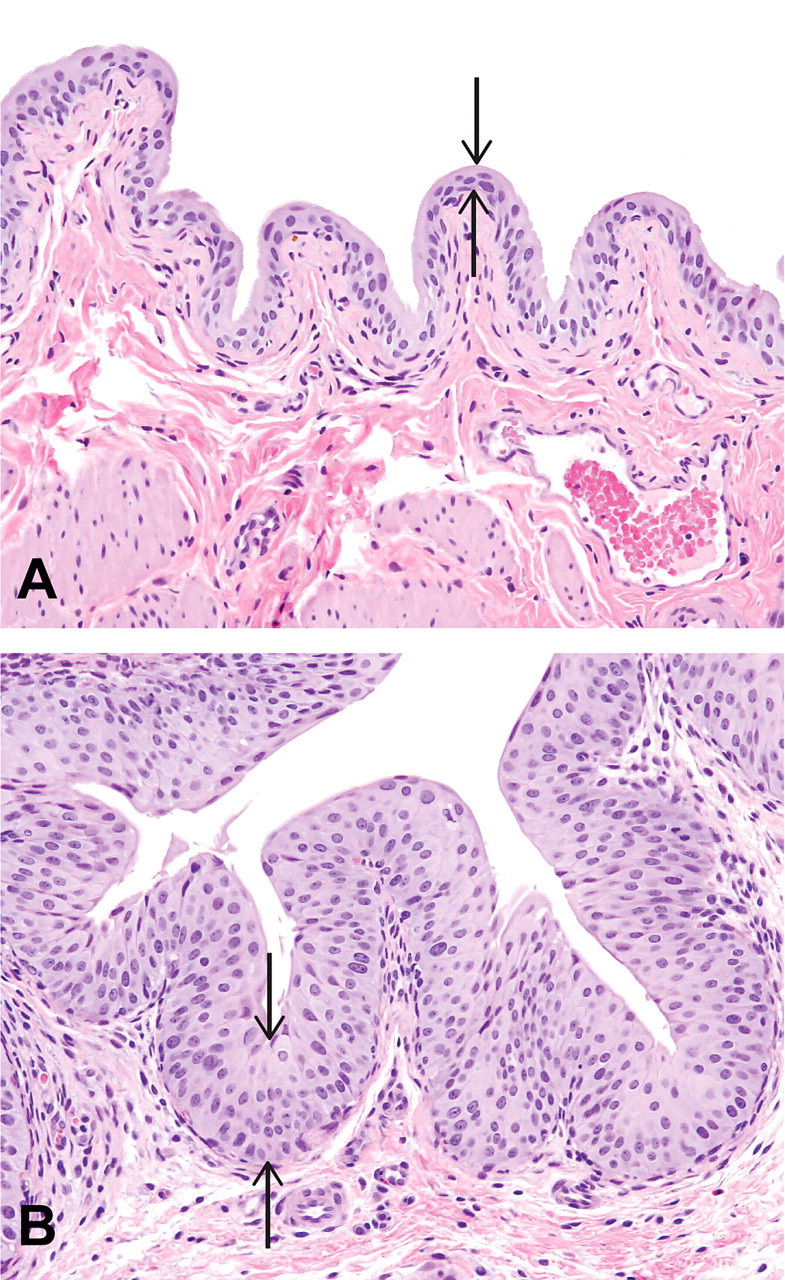
Twenty-eight consecutive days of treatment with C-1 caused proliferative changes in stratified squamous epithelia of esophagus, nonglandular stomach, skin (tail and interscapular) and tongue, transitional epithelia of urinary bladder and renal papilla/pelvis, and endocardium and myocardium. Changes in these tissues were similar in nature and severity to those seen after seven days of treatment with the notable exception of urinary bladder. Hyperplasia of the transitional epithelium of the urinary bladder was present in male and female rats in the high-dose groups and in female rats in the mid-dose group. It was considered minimal in male rats, but was substantially more severe in high-dose female rats where generally well-differentiated transitional epithelium was markedly thickened and folded. Additionally, one of the high-dose females had a grossly visible nodule in the wall of the urinary bladder, which on histopathological examination revealed a region of the bladder in which “fingers” and “nests” of epithelial cells extended from the mucosa, through the submucosa and muscle layers, and onto the outer surface of the bladder (Figure 12). The epithelial cells in this area were disorganized and contained larger, more open-faced nuclei. Mitotic figures were frequently noted in these cells. Proliferation of fibroblasts and infiltration of neutrophils were present around “fingers” and “nests” of transitional epithelium on the external surface of the bladder. Also, there was no evidence of urinary solids or calculi in the urinary tract. These microscopic observations are diagnostic features of transitional cell carcinoma (Mohr 1992). The mucosa of the urinary bladder in this rat showed a continuum of changes ranging from simple hyperplasia of the epithelium to papillary hyperplasia to hyperplasia with atypia characterized by nuclear crowding and disorganization and increased numbers of mitotic figures, to invasive growth through the bladder wall.
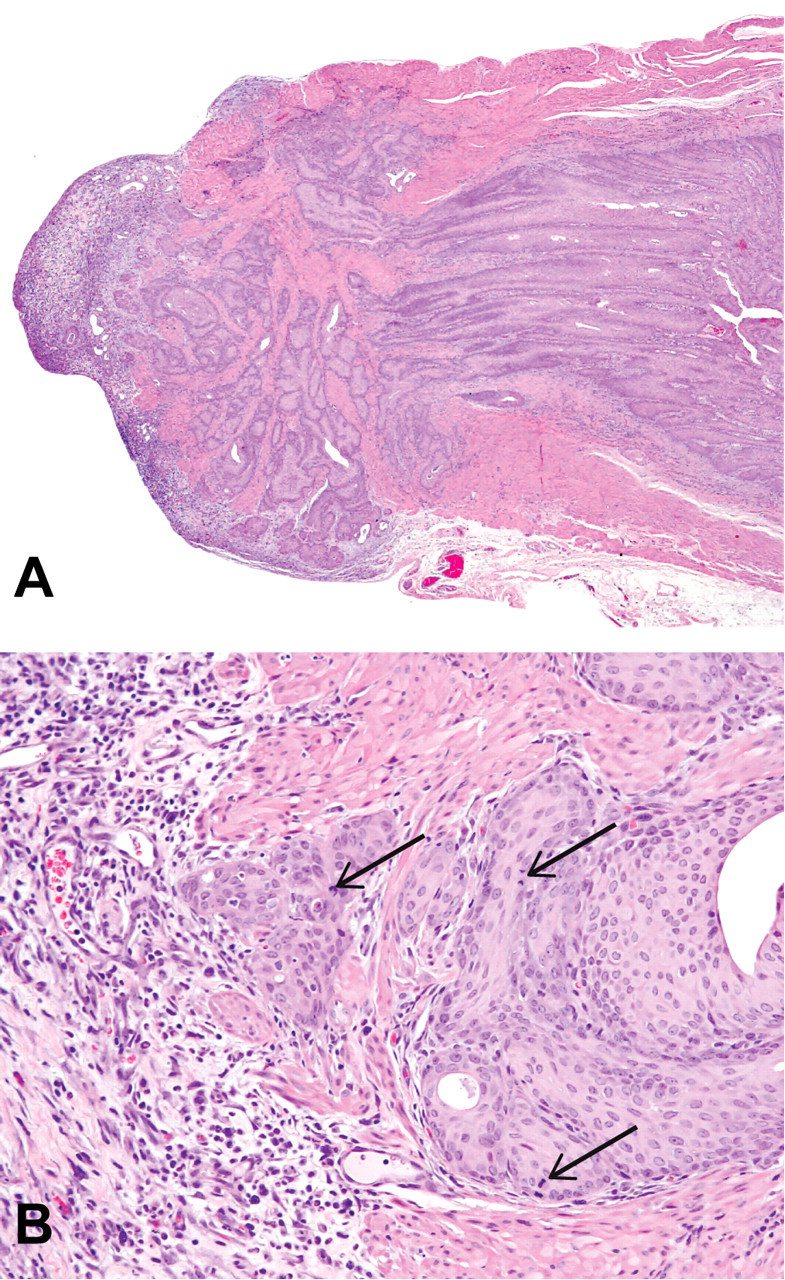
Urinary bladder from a female rat treated with 100 mg/kg/day C-1 orally for twenty-eight consecutive days. “Fingers” and “nests” of epithelial cells extended from the mucosa, through the submucosa and muscle layers, and onto the outer surface of the bladder (A; 20x). Several mitotic figures (arrows) are present in the epithelial cells forming ‘nests’ within the smooth muscle of the bladder (B; 200x). H&E.
Discussion
The present study has shown that exposure to seven mutant and WT B-Raf inhibitors consistently induced rapid hyperplasia in a number of common target tissues of the rat, mostly notably in stratified squamous epithelium in a number of tissues and transitional epithelium of urinary bladder and kidney, but also in heart and peripheral nerve. The proliferative effect was evident by an increased number of mitotic figures observed in H&E-stained sections and an increase in the immunodetection of the cell cycle markers pHistone H3 and Ki67, which were further supported by increases in the mRNA expression of genes in the PI3K/AKT and MAPK pathways. These results provide preclinical evidence to substantiate the hypothesis suggested by in vitro findings (Heidorn et al. 2010; Poulikakos et al. 2010; Hatzivassiliou et al. 2010; Carnahan, Beltran, Babij, et al. 2010) that small molecule inhibitors of Raf have the potential to lead to activation of WT Raf kinase, and the MAPK pathways resulting in entry into the cell cycle and enhanced proliferation. According to this hypothesis, activation of WT Raf likely occurs because of binding of inhibitors to the ATP binding site of WT Raf inducing conformational changes, stabilization of Raf homo (C-Raf: C-Raf)/heterodimer (C-Raf: B-Raf) and stimulation of MAPK signaling and proliferation.
The spectrum of hyperplasia observed across the seven B-Raf inhibitors was similar. The most frequently observed proliferative response was in the nonglandular stomach, which may reflect responses secondary to both systemic exposure and direct exposure of the epithelium following oral gavage. Likewise, the high incidence of urinary bladder hyperplasia might reflect high local exposure due to rapid renal excretion. Although the pathways of drug excretion have not been determined for these seven inhibitors, it is noteworthy that the hyperplasia observed in the urinary bladder was correlated with hyperplasia in the kidney (Table 2); however, hyperplasia was not more prominent in the ventral bladder suggesting no indirect mode of action due to urinary solids (Cohen 2005). C-2, C-3, and C-6 did not induce urinary bladder hyperplasia in seven days, but did cause hyperplasia in the stomach. Differences in plasma or tissue protein binding, tissue distribution, and/or metabolism are likely to account for the variations in timing of onset and tissue specificity of hyperplasia. Differences in potency against the rat WT B-Raf as opposed to human WT B-Raf may also account for compound differences in the response; however, the enzymes are highly similar (98.2%) in amino acid identity, and we have confirmed the similarity in B-Raf potency for C-1 in rat primary bladder epithelial cells (data not shown). Hyperplasia was observed in the heart and sciatic nerve in rats treated with C1 and C4–C6. The proliferative effects in the heart were first evident in endothelial and/or stromal (fibroblasts or smooth muscle) cells of the endocardium and atrioventricular valve leaflets, predominantly in the left ventricle, but later also present in the myocardium. MAPK/ ERK phosphorylation is critical to the process of cardiac endothelial differentiation and development (Xu et al. 2008; Rose et al, 2010). The proliferative effects in the sciatic nerve were characterized as hyperplasia of Schwann cells and/or fibroblasts. Ras/Raf/ERK signaling has been reported to drive Schwann cell dedifferentiation and resulting in proliferation (Harrisingh et al. 2004). It must also be acknowledged that the B-Raf inhibitors tested here are not likely to be highly specific for B-Raf at the doses tested here and other off-target effects need to be considered. However, the overall hyperplasia response across all seven compounds and multiple studies as well as observations by others (Hatzivassiliou et al. 2010; Poulikakos et al. 2010) with different B-Raf inhibitors, argues that inhibition of WT B-Raf is causally associated with cell proliferation.
The induction of proliferative changes in normal rat tissues was first observed four to five hours after a single oral dose of C-1, as shown by increased mitotic figures and immunostaining for pHistone H3 in the nonglandular stomach. The rapidity of the response may reflect direct local exposure following oral gavage of the drug in addition to systemic exposure as C-1 is rapidly absorbed (Tmax two to four hours). By day 2, proliferative effects on epithelium of the urinary bladder were observed with an increased number of mitotic figures and immunostaining for pHistone H3 and Ki67. In some rats at this time, proliferative changes in the epithelium were accompanied by alterations in the distribution of keratins 17 and 20. Keratin 17 is normally expressed in basal and intermediate cells, but not in the terminally differentiated superficial (umbrella) cells of the urinary bladder. On the other hand, keratin 20 is normally found only in the terminally differentiated superficial cells and appears to be the last in a sequence of differentiation markers that develop in these cells (Romih, Jezernik, and Masera 1998; Veranič, Romih, and Jezernik 2004; Long et al. 2008). The decreased keratin 20 and increased keratin 17 staining in superficial epithelial cells of some rats treated with the B-Raf inhibitors suggests that the normal differentiation pattern of the urothelium was disrupted by treatment with these compounds. Additionally, uroplakin III is a component of the apical unit membrane, which is of critical importance to maintaining the impermeable nature of the epithelium of the urinary bladder (Romih, Jezernik, and Masera 1998; Veranič, Romih, and Jezernik 2004). The reduction in surface epithelial staining for keratin 20 and the subsequently observed decrease in uroplakin III staining of these cells may signify a weakening of this impermeable barrier with consequent increased mucosal permeability to growth factors normally found in urine (Keay et al. 1997).
Transcriptional evidence of perturbation of pathways associated with proliferation in the bladder was detected at the first time point collected in this study (five hours postdose). These transcriptional changes suggest activation of the PI3K/AKT and ERK/MAPK pathways, which is consistent with MAPK activation described by similar B-Raf inhibitors (Carnahan, Beltran, Babij, et al. 2010). Although whole bladder and nonglandular stomach were profiled for gene expression, the transcriptional evidence of proliferation likely stems from the proliferating epithelium. However, we cannot discount the contribution of gene expression changes in the smooth muscle and submucosal areas. Triggering events for these changes may have been driven by on target effects related to activation of the Raf pathway.
Comparison of the bladder and nonglandular stomach transcriptional responses indicated that these tissues were not synchronized in their genomic responses and that the transcript pattern elucidated in the early time points for the stomach were most similar to the later time points of the bladder samples. C-1 led to gene expression changes in the bladder consistent with strong induction of numerous initial proliferative signals (e.g., Cyclin D1 2-fold, Akt1/2 2.5-fold, Rras 2-fold, eIF4e 1.5-fold) followed by a damage/repair/checkpoint response (e.g., Gadd45a 2-fold, Rad51 3-fold). This may have represented the sequence of the timing and exposure of the two tissues as C-1 was administered via oral gavage and the stomach would have been the first tissue to receive C-1 exposure.
The appearance of a transitional cell carcinoma in the urinary bladder of a rat within a twenty-eight-day treatment period is extremely rare. The background rate for development of these tumors in normal female rats during 2-year rat carcinogenicity studies is 0.06% (Giknis and Clifford 2001). The transitional cell carcinoma in the female rat treated at the high-dose level with C-1 was considered related to treatment because of the extreme rarity of spontaneous tumors of this type in rats of this age and strain. Additionally, it occurred in the setting of profound C-1-induced hyperplasia of the transitional epithelium of this rat and every other female rat in this dose group. The epithelium of the urinary bladder in this rat showed a continuum of changes from simple hyperplasia to papillary hyperplasia to hyperplasia with atypia characterized by nuclear crowding and disorganization and increased numbers of mitotic figures to invasive growth through the bladder wall. Importantly, alterations in genes involved in the RAF/MEK/ERK pathway and PI3K are associated with urinary bladder papillary tumors which are preceded by urothelial hyperplasia (Luis, Lopez-Knowles, and Real 2007). Therefore, alterations of these pathways for a sustained time period may have contributed to the observed urinary bladder hyperplasia and the transitional cell carcinoma observed in rats treated with C-1. Malignancies in the urinary bladder induced by genotoxic molecules typically develop over a period of twelve weeks to two years (Cohen, Wanibuchi, and Fukushima 2002). Since C-1 shows no genotoxic potential (AMES +/– S9 fraction screen and human peripheral blood micronucleous study were negative; data not shown), it is unlikely that there was any direct damage to DNA.
Persistent overstimulation of cell proliferation is a proposed mechanism of carcinogenesis by nongenotoxic (epigenetic) compounds (Greenfield, Ellwein, and Cohen 1984; Lima and Van der Laan 2000; Rakitsy, Koblyakov, and Turusove 2000; Pogribny, Rusyn, and Beland 2008) and has been reported to play a role in urinary bladder cancer (Luster and Simeonova 2004; Cohen 2005, 2008; Kumar et al. 2009). Nongenotoxic carcinogens that stimulate cell proliferation are more relevant in organs with minimal basal proliferation profiles such as the urinary bladder, typically induce tumors in one animal species and one sex, and the hyperplasia and/or tumor may be partially reversible after administration of the agent is discontinued (Butterworth 1990; Lima and Van der Lann 2000). Arsenic has been shown to stimulate cell proliferation via the MAPK pathways and produce hyperplasia in the urinary bladder, which is a target for arsenic carcinogenicity (Luster and Simeonova 2004; Eblin et al. 2007). Arsenic-induced hyperplasia in the bladder can be detected in female rats treated with dimethyl arsenic for 10 weeks; however, neoplasms do not appear for greater than 6 months after the initiation of treatment (Cohen et al. 2007). Many nongenotoxic molecules have been identified as bladder carcinogens in rodents via a mechanism of inducing cytotoxicity with regenerative proliferation by urinary crystals, precipitates or calculi (Cohen 1998, 2008); however, cytotoxicity was not evident in the urinary bladder transitional cell carcinoma of the female rat treated with C-1 nor was the ventral bladder predisposed. An important aspect of nongenotoxic carcinogens is the existence of a threshold response (Lima and Van der Laan 2000; Cohen 2008). Specifically, tumorigenic effects only occur when high doses are used to produce prolonged cell proliferation, but a lower dose threshold exists where the tumorigenic effect will not occur. Therefore, the preponderance of data presented supports the conclusion that C1–7 induces hyperplasia in the rat urinary bladder by activation of RAF/MEK/ERK and that the mechanism driving the transitional cell carcinoma observed in a female rat is likely nongenotoxic (epigenetic) carcinogenesis.
Our data complement several recent publications that have shown that small molecule inhibitors of WT Raf can activate the MAPK pathway and stimulate cell growth (Heidorn et al. 2010; Poulikakos et al. 2010; Hatzivassiliou et al. 2010; Carnahan, Beltran, Babij, et al. 2010) and hyperplasia. Our data further suggest that inhibition of WT Raf induces early transcriptional changes driving unchecked cell proliferation, resulting in marked tissue hyperplasia that can progress to carcinoma within a short time frame. These findings may be relevant to ongoing clinical trials in melanoma patients treated with a Raf inhibitor since these patients have shown an unexpectedly high incidence of squamous cell carcinoma (Brower 2010; Flaherty et al. 2010). While development of these cancers is not rare in melanoma patients, the relatively high incidence (approximately 31%) does support the hypothesis that WT B-Raf inhibitors have the potential to induce hyperplasia and neoplasia.
Footnotes
Acknowledgments
The authors would like to thank the following scientists who contributed technically to various aspects of this work or review of the manuscript: Ruth Lightfoot-Dunn, Glen Begley, Jeanine Bussiere, Vince Meador, Marnie Higgins-Garn, Hisham Hamadeh, Patricia Kraft, Roxanne Audenino, Pedro J. Beltran, Mark J. Rose, Joseph L. Kim, Adrian L. Smith, Karthik Nagapudi, Martin A. Broome, Rick Kendall, and Teresa L. Burgess.