
Abstract
During routine safety evaluation of RO2910, a non-nucleoside reverse transcriptase inhibitor for HIV infection, histopathology findings concurrent with robust hepatocellular induction occurred in multiple organs, including a unique, albeit related, finding in the pituitary gland. For fourteen days, male and female rats were administered, by oral gavage vehicle, 100, 300, or 1000 mg/kg/day of RO2910. Treated groups had elevated serum thyroid-stimulating hormone and decreased total thyroxine, and hypertrophy in the liver, thyroid gland, and pituitary pars distalis. These were considered consequences of hepatocellular induction and often were dose dependent and more pronounced in males than in females. Hepatocellular centrilobular hypertrophy corresponded with increased expression of cytochrome P450s 2B1/2, 3A1, and 3A2 and UGT 2B1. Bilateral thyroid follicular cell hypertrophy occurred concurrent to increased mitotic activity and sometimes colloid depletion, which were attributed to changes in thyroid hormone levels. Males had hypertrophy of thyroid-stimulating hormone–producing cells (thyrotrophs) in the pituitary pars distalis. All findings were consistent with the well-established adaptive physiologic response of rodents to xenobiotic-induced hepatocellular microsomal enzyme induction. Although the effects on the pituitary gland following hepatic enzyme induction-mediated hypothyroidism have not been reported previously, other models of stress and thyroid depletion leading to pituitary stimulation support such a shared pathogenesis.
Introduction
The safety of RO2910, a non-nucleoside reverse transcriptase inhibitor (NNRTi) under consideration for development as a treatment for HIV infection, was assessed. In vitro and in vivo experiments in rats with RO2910, presented herein, demonstrate that this compound is a potent inducer of hepatic microsomal enzymes, including cytochrome P450. Structurally similar molecules also intended for treatment of HIV infection, such as etravirine, nevirapine (NVR), efavirenz (EFV), and delavirdine (DLV), are also potent inhibitors and/or inducers of hepatic P450 (Scholler-Gyure et al. 2009; Von Moltke et al. 2001). The effect of hepatic microsomal induction in rodents includes altered pharmacokinetic profiles and toxicological consequences in the liver and other organs in toxicology studies, and ultimately it complicates the ability to conduct a thorough safety assessment (Mohutsky et al. 2010).
In repeat-dose studies in rodents, the induction of hepatic enzymes can have an impact on other organ systems beyond the liver. In particular, rats are uniquely sensitive to the induction of hepatic enzymes that ultimately overstimulate the thyroid gland as a result of increased thyroid-stimulating hormone (TSH, or thyrotropin) secretion from the pituitary pars distalis (Capen 1994; Curran and DeGroot 1991; Ennulat et al. 2010). Although different molecular mechanisms can disrupt thyroid hormone levels, including inhibition of uptake of iodine into the thyroid gland, direct inhibition of thyroid hormone synthesis and secretion, and enhanced thyroid hormone metabolism, the result in rats is hypertrophy, hyperplasia, and potentially, neoplasia of the thyroid gland. A common consequence of pharmaceutical compounds that induce rodent hepatic microsomal activity is excessive TSH secretion to compensate for the increased hepatic glucuronidation and biliary clearance of thyroid hormones (Capen 1994; Curran and DeGroot 1991; Ennulat et al. 2010).
The present study describes the effect of RO2910 on homeostasis of the hypothalamic–pituitary–thyroid axis. RO2910 induced a variety of histological effects related to hepatocellular induction–mediated thyroid physiologic adaptation, including centrilobular hepatocellular hypertrophy with concomitant increased hepatic P450 and UDP-glucuronyltransferase (UGT) activity, previously unreported hypertrophy of thyrotrophs in the pars distalis of the pituitary gland, and hypertrophy of follicular cells in the thyroid gland with concomitant increased mitotic activity and sometimes decreased colloid content, as well as changes in serum levels of thyroid gland–related hormones. The data presented provide the basis for the mechanistic understanding of the multi-organ effects of RO2910.
Materials and Methods
Animal Husbandry
Wistar (Crl:WI(Han)) rats, eight to nine weeks old, were obtained from Charles River Laboratories, Inc. (Hollister, CA). Rats were housed individually in wire-bottom cages and provided food (LabDiet Certified Rodent Diet, PMI Feeds Inc., Richmond, IN) and water ad libitum. Rats were acclimated for at least one week prior to dosing. All rats were maintained and humanely euthanized in accordance with regulatory compliance for animal care and use.
In-Life Study Design
Five male and five female rats in each of four treatment groups were administered once-daily doses of vehicle (TG10, pH 3.5, a generic HPMC aqueous solution containing 0.5% hypromellose ([HPMC 2910], 0.4% polysorbate 80, and 0.9% benzyl alcohol) or of 100, 300, or 1,000 mg/kg RO2910 by oral gavage for fourteen days. Accordingly, animal groups were designated as vehicle control, low-dose, mid-dose, and high-dose groups, respectively. In-life observations and determinations included clinical signs, body weights, and food consumption. Blood samples (approximately 0.3 mL) for the determination of plasma drug concentrations were collected using the jugular/subclavian vessel(s) from selected rats at approximately one, two, six, and twenty-four hours after dosing on treatment days 1 and 13. Samples were collected into tubes containing potassium oxalate/sodium fluoride. Blood was collected from fasted animals by cardiocentesis at necropsy after fourteen days of treatment. Blood was collected in tubes containing potassium-EDTA anticoagulant for evaluation of hematologic assays using the ADVIA 120 hematology analyzer. Blood for clinical chemistry was collected in tubes without anticoagulant, allowed to clot, and analyzed using a Hitachi 911 automated chemistry analyzer. A complete tissue set was collected and fixed in 10% neutral-buffered formalin and processed routinely through paraffin into hematoxylin and eosin (H&E)–stained slides for histopathology evaluation by light microscopy. A sample of liver was collected and frozen at -70°C for analysis of gene expression.
Immunohistochemistry and Image Analysis
Immunohistochemistry was performed using the Ventana discovery XT stainer (Ventana Medical Systems, Inc., Oro Valley, Arizona), and a biotin-secondary antibody detection system (Jackson Laboratories Inc., West Grove, PA) involving a biotinylated secondary antibody of goat anti-rabbit, anti-chicken, or anti-mouse, as appropriate (dilution 1:250), and HRP-SA DAB chromagen system. Antigen retrieval was either protease 2 (Ventana), heat-induced retrieval at standard time using cc1 buffer (CC1 standard; Ventana), or no retrieval (NR), as indicated below. The specifications for the primary antibodies were as follows: all antibodies were polyclonal rabbit anti-human and manufactured by Chemicon/Millipore, Temecula, CA, unless otherwise specified; TSH (protease 2; dilution 1:3,500; Biodesign, Saco, ME); adrenocorticotropic hormone (ACTH; protease 2; dilution 1:10,000); follicle-stimulating hormone (FSH; protease 2; dilution 1:20,000); growth hormone (GH; protease 2; dilution 1:20,000); luteinizing hormone (LH; protease 2; dilution 1:8,000); prolactin (protease 2; dilution 1:4,000); chicken anti-human proopiomelanocortin (POMC; NR; dilution 1:1,500); CYP 1A1 (no antigen retrieval; dilution 1:100); CYP 1A2 (NR; dilution 1:50); CYP 2E1 (NR; dilution 1:200); CYP 3A2 (NR; dilution 1:400); rabbit anti-rat CYP 2B1/2 (NR; dilution 1:400); and monoclonal mouse anti-human topoisomerase IIa (CC1 standard; dilution 1:200; Abcam, Cambridge, UK).
Sections of H&E–stained liver, TSH antibody–stained and topoisomerase IIa antibody–stained pituitary gland, and H&E–stained and topoisomerase IIa antibody–stained thyroid gland were scanned using a Zeiss Mirax digital scanner (Carl Zeiss Microimaging, Thornwood, NY) to obtain whole–slide images. For each type of image from all the study animals, as appropriate per stain, images were analyzed using the same automated algorithm written for the Definiens Enterprise image analysis system (Definiens, Inc., Parsipanny, NJ), and percentages reported were average measurements made using two tissue sections per animal. For H&E–stained sections of liver, the algorithm was as follows: images were automatically segmented to select hepatocytes present in the tissue section, and hepatocellular area measurements corresponding to total cell, nucleas, and cytoplasm were collected. The hepatocellular cytoplasmic area was expressed as the percentage of the total hepatocellular area. Dunnett’s test was used to evaluate intergroup differences, wherein all treated groups were compared with the vehicle control group.
Pituitary images were automatically segmented to select the pars distalis and within the pars distalis for TSH antibody–stained images, to select the immunoreactive brown–stained cytoplasm of TSH-containing cells and for topoisomerase IIa antibody–stained images, to select the immunoreactive brown–stained nuclei. Thyroid-stimulating hormone–immunoreactive cells were divided into those that stain of similar intensity to the control animals, designated “dark-staining cells,” and those that stain lighter intensity to the control animals, designated “light-staining cells.” Immunoreactive cells were counted for the total-staining, dark-staining, and light-staining cells and expressed as a percentage of the total area in the pars distalis.
A one-way analysis of variance (ANOVA) was used to evaluate intergroup differences, wherein all treated groups were compared with the vehicle group, and with statistical significance (p < .05) was followed by a post-hoc Tukey test. Topoisomerase IIa–immunoreactive cell nuclei were counted and expressed as a percentage of the total pars distalis cell nuclei. The Wilcoxon rank sum test was used for the number of immunoreactive nuclei to evaluate intergroup differences, wherein all treated groups were compared with the vehicle control group. Hematoxylin and eosin–stained thyroid gland images were automatically segmented to select follicular regions present in the tissue section, and area measurements corresponding to colloid and follicular cytoplasm were collected. The area of colloid and of follicular cell cytoplasm was expressed as a percentage of the total follicular region. Areas reported were average measurements made using two tissue sections per animal. Topoisomerase IIa antibody–stained thyroid images also were automatically segmented to select follicular regions, and immunoreactive brown–stained nuclei were counted and expressed as a percentage of the total follicular nuclei. For colloid and follicular cell area, the Dunnett’s test was used to evaluate intergroup differences, wherein all treated groups were compared with the vehicle control group. The Wilcoxon rank sum test was used for the number of immunoreactive nuclei.
Serum T3, T4, and TSH Evaluation
Serum samples were shipped on dry ice to AniLytics, Inc. (Gaithersburg, MD) for the determination of total triiodothyronine (T3), total T4, and TSH concentrations using a radioimmunoassay technique. Levels of T3 and T4 were determined using radioimmunoassay (RIA) kits supplied by Diagnostic Products (Los Angeles, CA).
Hepatocyte Culture
Fresh primary rat hepatocytes were isolated using a two-step collagenase perfusion as previously described, with minor modifications (Berry and Friend 1969). After isolation and purification, cells were plated at a density of 30,000 cells/well in ninety-six–well, collagen-coated plates (BD Biosciences, San Jose, CA) using InVitroGRO CP media (Celsis, Baltimore, MD) with Torpedo Antibiotic Mix (Celsis). All incubations were done in duplicate plates for analysis of both mRNA and enzymatic activity (data not shown). Cells were allowed to attach for twenty-four hours at 37°C with 5% CO2 before an overlay of Matrigel (BD Biosciences) was applied at a concentration of 0.25 mg/mL in InVitroGRO CI media (Celsis). After a twenty-four-hour incubation, compound dosing solutions containing dimethyl sulfoxide (0.1%), pregnenolone 16α-carbonitrile (PCN), efavirenz, or RO2910 (0.1 µM, 1 µM or 10 µM), in InVitroGRO CI media were applied to hepatocytes, and after an additional twenty-four hours of incubation, fresh dosing medium was applied. Since RO2910 is rapidly converted to the active form (RO8862) in biological fluids, positive confirmation of induction included experiments conducted with RO8862. After incubation with inducing agents, hepatocytes were analyzed for enzymatic activity and mRNA induction. For analysis of mRNA induction, medium was removed from the plates, and plates were frozen at -80°C. For enzymatic analysis, cell culture medium was aspirated from the plates; Williams E medium (Sigma, St. Louis, MO) containing 20 µM midazolam (Sigma), 40 µM phenacetin (Sigma), and 20 µM bupropion (Sigma), and 3 mM salicylamide (Sigma) was applied; hepatocytes were incubated at 37°C for two hours; and an aliquot of cell medium was removed for analysis by LC/MS/MS. For mRNA expression, one plate was analyzed for mRNA expression using Taqman analysis. Gene expression was normalized to 18S rRNA. A duplicate plate was used for measurement of enzyme activity and cell viability. Changes in treatment groups relative to vehicle control groups were assessed using ANOVA with Dunnett’s multiple comparisons post-test.
Quantitative RT-PCR of Drug Metabolism Genes
Total cellular RNA was isolated from the cultured hepatocytes and frozen rat liver samples using the PerfectPure RNA 96 Cell Kit according to the manufacturer’s instructions (5 Prime, Inc., Gaithersburg, MD). Briefly, first-strand cDNA synthesis was performed using the TaqMan Reverse Transcription Reagents (Applied Biosystems, Foster City, CA), 1X reverse transcription buffer, 5.5 mM MgCl2, 500 µM dNTP, 0.4 U/µL of RNase inhibitor, 1.25 U/µL of reverse transcriptase, and 2.5 µM Random Hexamer as primer (IDT, Coralville, IA). The reverse transcription reaction product was used for quantitative reverse transcriptase polymerase chain reaction (RT-PCR) using 100 nM of gene-specific dual-labeled probes and 150 nM of each of the forward and reverse primers (IDT; Table 1 ) designed using Primer Express (Applied Biosystems), in 1X LightCycler 480 Probe Master Mix (Roche Diagnostics, Indianapolis, IN). Quantitative RT-PCR reactions were performed and analyzed on a 7900 Sequence Detector (Applied Biosystems). Results were analyzed using the comparative CT (ΔΔCT) method, as described in User Bulletin 2 of the ABI PRISM 7700 Sequence Detection System. Data were normalized to the 18S rRNA content of each sample and graphed as fold induction relative to vehicle control rats. Changes in treatment groups relative to vehicle control groups were assessed using a two-sample (equal variance), two-sided Student t test. Changes were considered significant at p < .05.
Primer sequences for the quantitative reverse-transcriptase polymerase chain reaction that was performed on rat liver samples to assess expression levels of hepatic P450 and UDP-glucuronyltransferase enzymes.
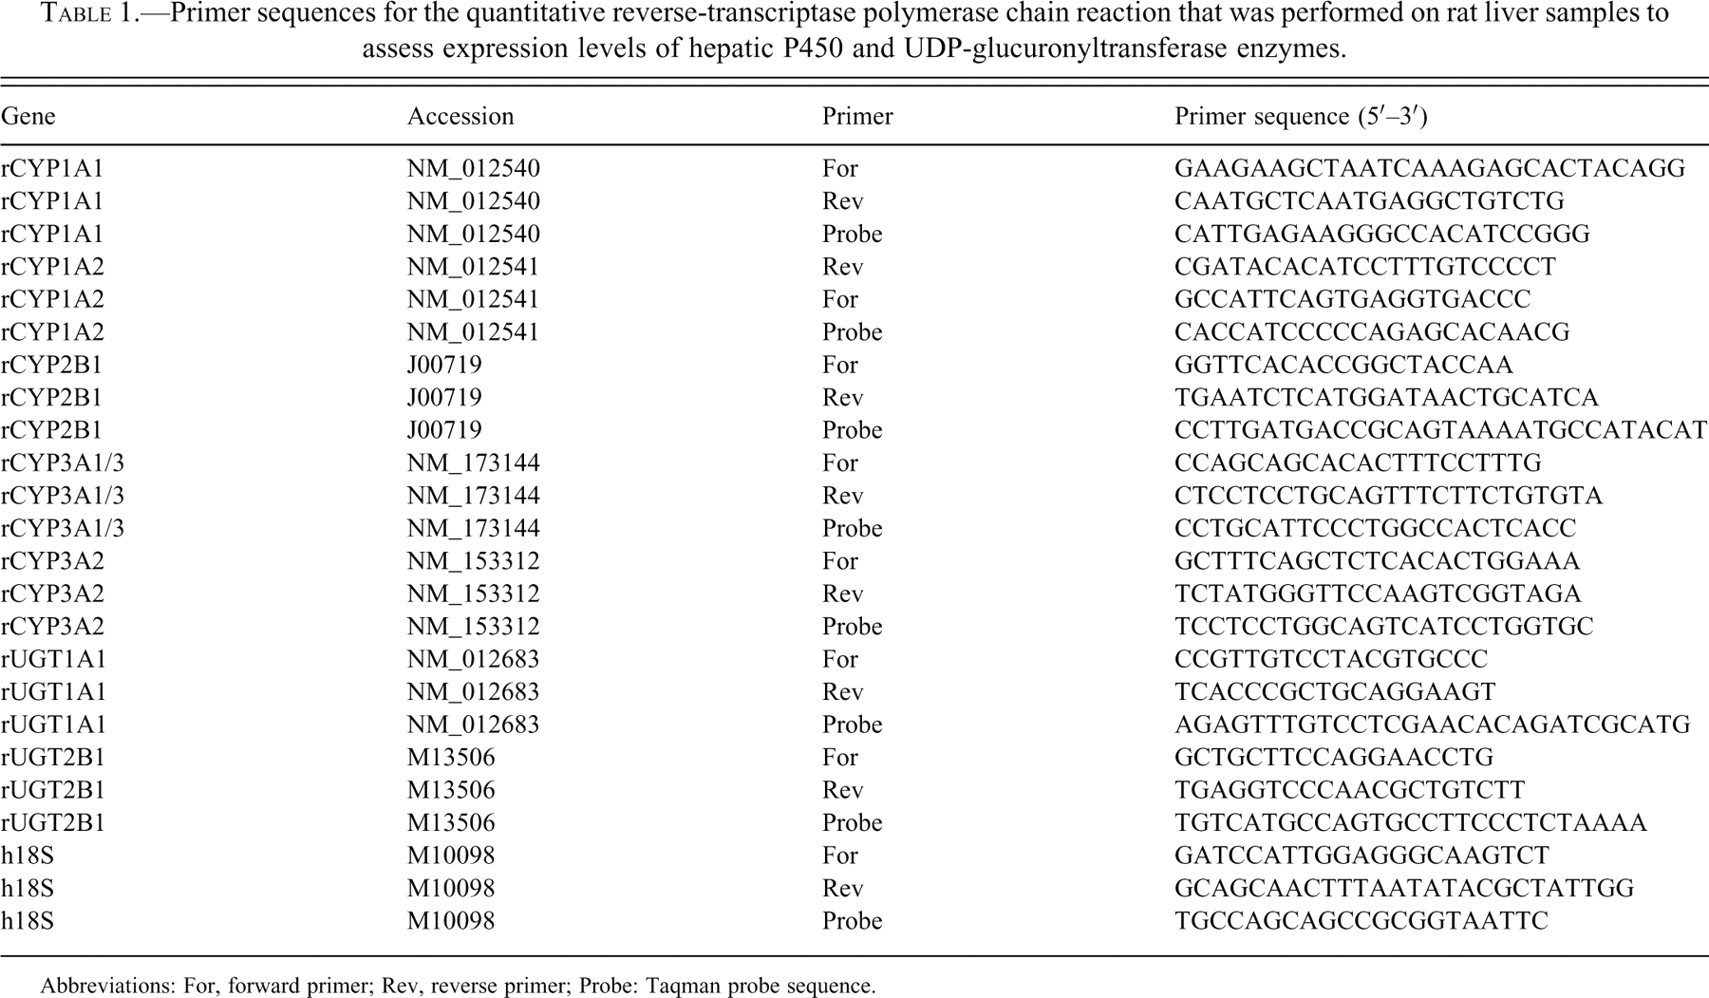
Abbreviations: For, forward primer; Rev, reverse primer; Probe: Taqman probe sequence.
Results
Five male and five female rats in each of four dose groups were administered once-daily doses of vehicle or 100, 300, or 1,000 mg/kg RO2910 by oral gavage for fourteen days. There were no adverse in-life findings during this study. Toxicokinetic data in RO2910-treated rats showed that exposures and Cmax decreased on Day 13 compared with Day 1 and that exposure values in males were generally less than in females (data not shown). Circulating levels of total T4 showed a dose-dependent decline in both sexes that was not significant for the mid-dose group only and was of similar magnitude between sexes when RO2910-treated groups within each sex were compared with their respective vehicle control group (Figure 1 ). Circulating levels of total T3 were not changed among vehicle control and RO2910-treated groups for either sex (Figure 1). Circulating levels of TSH had a dose-dependent elevation that was significant in the high-dose female group only and in all male RO2910-treated groups with a disproportionate increase in the high-dose male group (Figure 1). Serum levels of prolactin and ACTH were not changed significantly among vehicle control and treated groups for either sex (data not shown). The mean level of GH in the high-dose male group was decreased compared with the vehicle control group; however, no values were outside the range of the vehicle control group. By routine microscopy, RO2910-related hypertrophic responses were identified in the liver, thyroid gland, and pituitary gland (Table 2 ) and further characterized by immunohistochemistry, quantitative image analysis, and tissue and hepatocyte cell culture analysis for gene expression and enzymatic activity (data not shown).
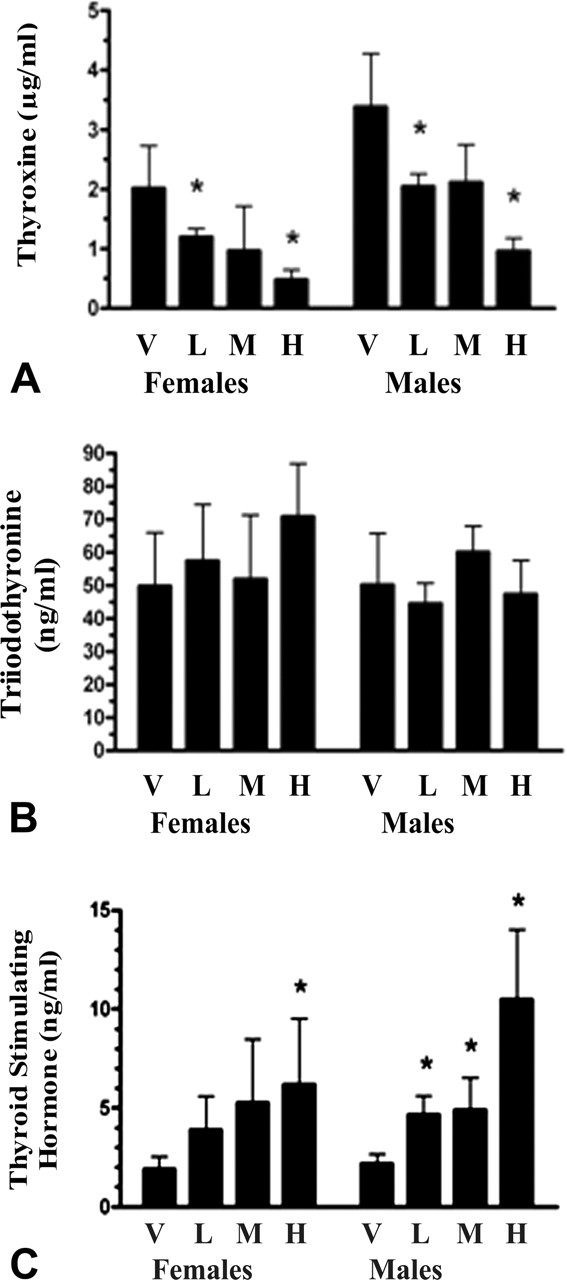
Enzyme-linked immunosorbent assay for total thyroxine (T4, µg/mL; A), total triiodothyronine (T3, ng/mL; B), and thyroid-stimulating hormone (TSH, ng/mL C) in vehicle control and RO-treated rats. In treated rats, there was a dose-dependent decline of T4 in both sexes that was not significant for the mid-dose group only and was of similar magnitude between sexes when RO-treated groups within each sex were compared with their respective vehicle control group. Elevated TSH occurred in the high-dose female group only and in all male treated groups, and there was a disproportionate increase in the high-dose male group. T3 was not significantly changed among vehicle control and treated rats. Bars represent the mean and standard deviation, and asterisk indicates significant change relative to vehicle control at p < .05. Dose groups were as described in the materials and methods. Abbreviations: H, high-dose group; M, mid-dose group; L, low-dose group; V, vehicle.
Summary of incidence per dose group and per sex for histopathology findings in the liver, thyroid gland, and pituitary gland by routine microscopic examination. Severity scores were minimal (score of 1 out of 5) or mild (score 2 out of 5) for all findings.
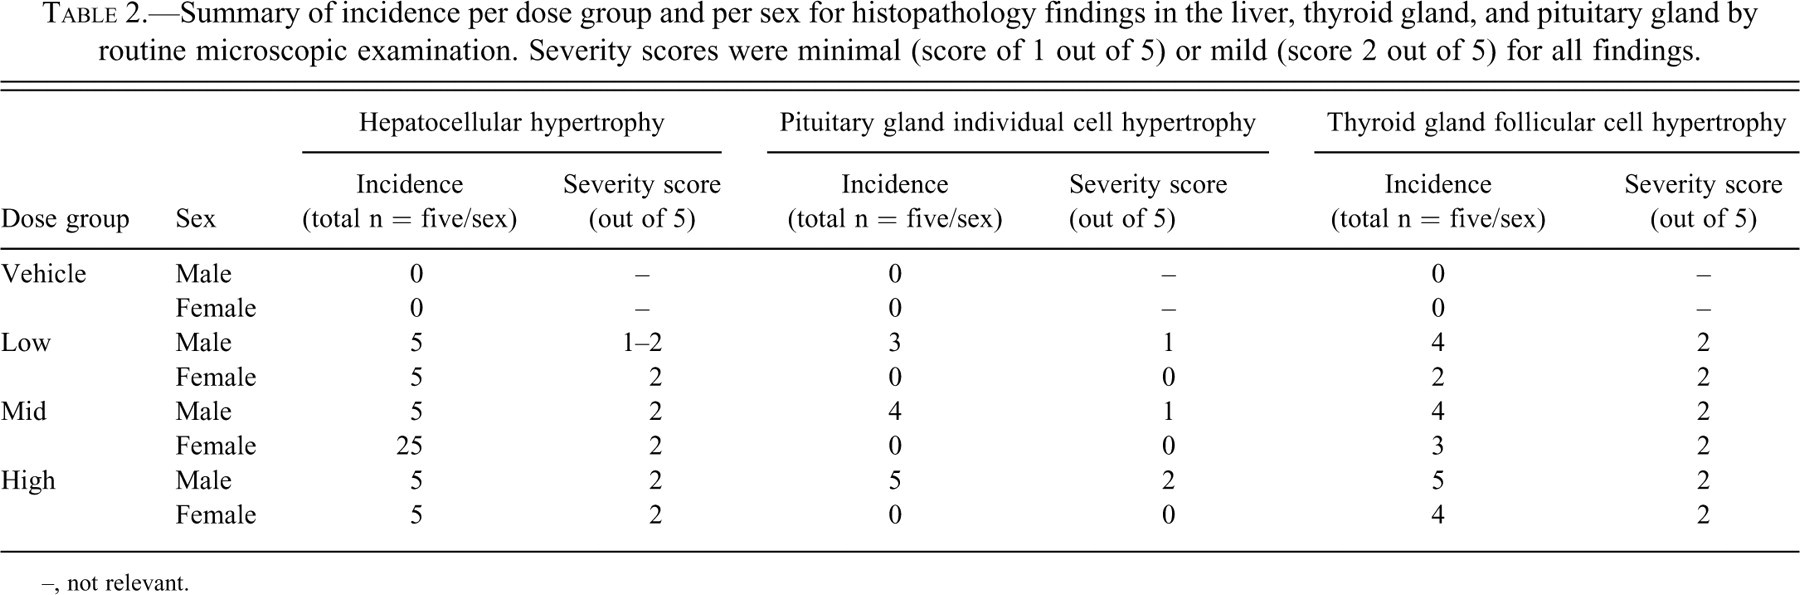
–, not relevant.
Liver
RO2910 induced hepatocellular centrilobular hypertrophy occurred in all rats, with similar severity in both sexes (Table 2, Figure 2 ). Quantitative image analysis confirmed the histopathology finding and indicated a similar magnitude of response in all but the low-dose female group (Figure 3 ). Hepatic hypertrophy corresponded to increased immunoreactive staining for CYP 2B1/2 and CYP 3A2 antibodies, but not for CYP 1A1 or 2E1 antibodies (Figure 2). Quantitative RT-PCR for mRNA expression levels of phase I and II drug metabolism genes (Figure 3) was consistent with enzymatic activity analysis (Figure 4 ) and confirmed the immunohistochemistry findings, demonstrating an increase in all groups for CYP 2B1/2 and 3A2 genes and additionally CYP 3A1 and UGT 1A1 and 2B1 genes, but not for CYP 1A1 or 1A2. Induction of all genes was dose dependent in both sexes, but the magnitude of induction was greater in females compared with males for CYP genes and slightly greater in males compared with females for UGT 2B1. CYP 1A1 had significant induction in the high-dose female group; however, the finding was not dose dependent and was not observed in male rats.
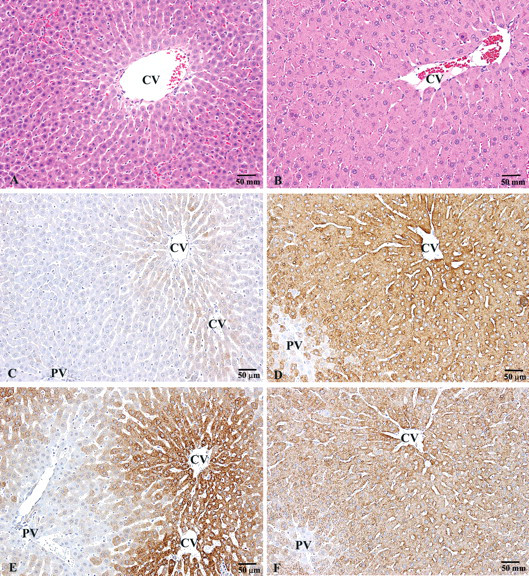
Liver of a male rat from the vehicle control group and high-dose group. Compared with the vehicle control (A), the treated rat (B) had centrilobular hepatocellular hypertrophy on hematoxylin and eosin–stained sections. Increased immunoreactive staining (brown staining) for CYP 2B1/2 and CYP 3A2 antibodies, compared with the vehicle control (C and E, respectively), corresponded to hypertrophy in the treated rat (D and F, respectively). Magnification 10×, bar = 50 µm. Abbreviations: CV, central vein; PV, portal vein.
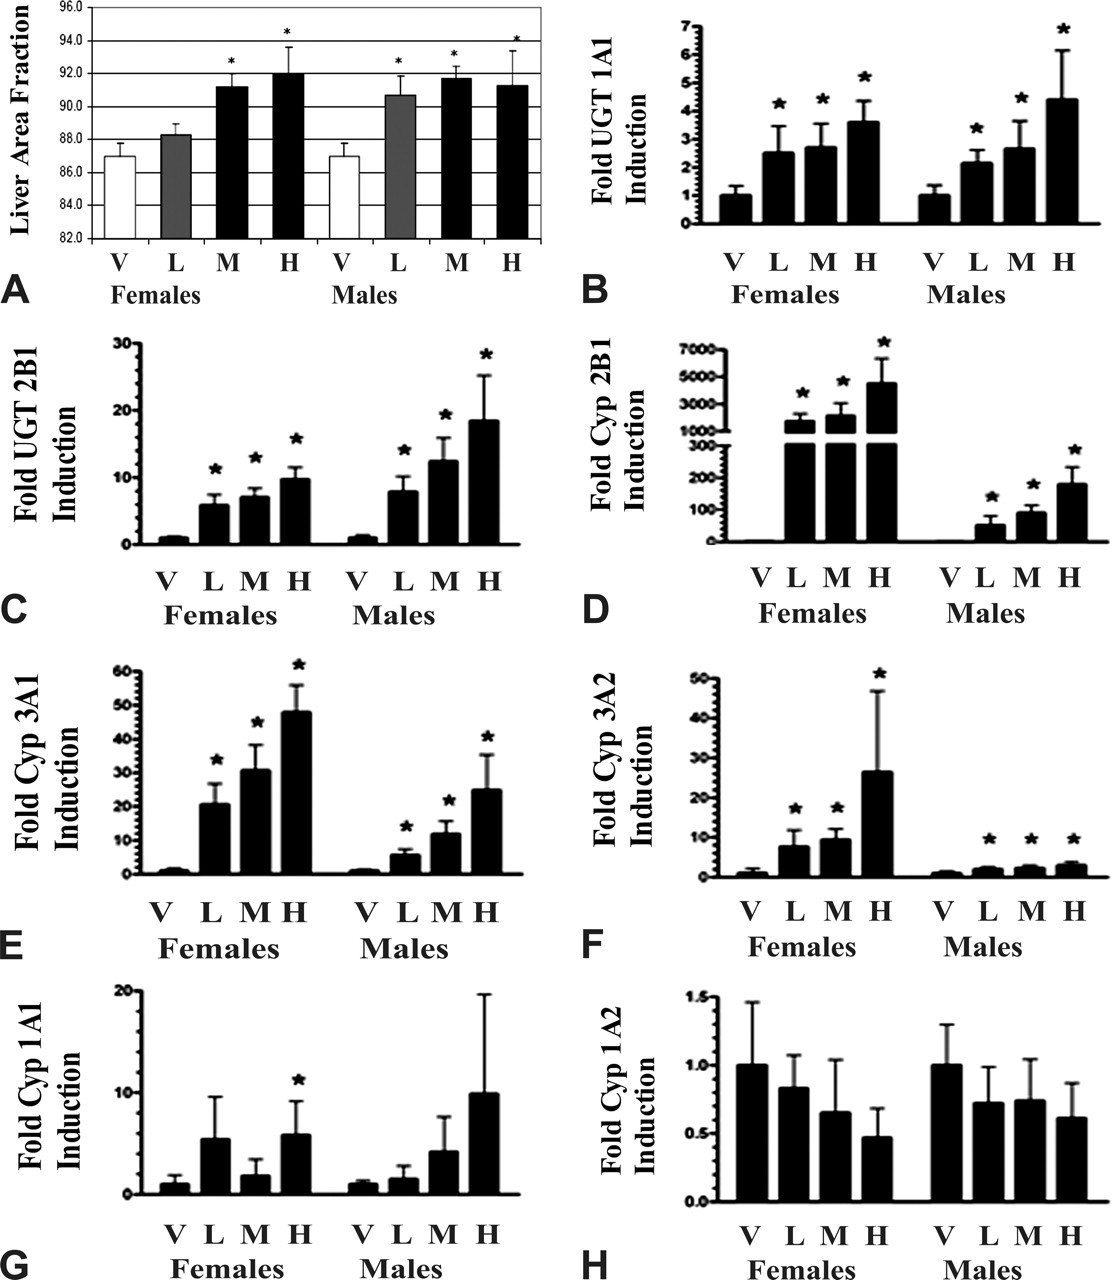
Quantitative image analysis of hematoxylin and eosin–stained sections of liver from vehicle control and treated rats confirmed the histopathology finding of centrilobular hepatocellular hypertrophy in treated rats and indicated a significant similar magnitude of response in all but the female low-dose group (A). Quantitative reverse transcriptase polymerase chain reaction for mRNA expression levels in rat liver demonstrated a significant dose-dependent increase in all treated groups for UGT 1A1 and 2B1 genes and CYP 2B1, 3A1, and 3A2 genes (B–F), but not for CYP 1A1 or 1A2 genes (G and H). The magnitude for induction was greater in females compared with males for CYP genes and slightly greater in males compared with females for UGT 2B1. Bars represent the mean and standard deviation, and asterisk indicates significant change relative to vehicle control at p < .05. Dose groups were as described in the materials and methods. Abbreviations: H, high-dose group; M, mid-dose group; L, low-dose group; V, vehicle.
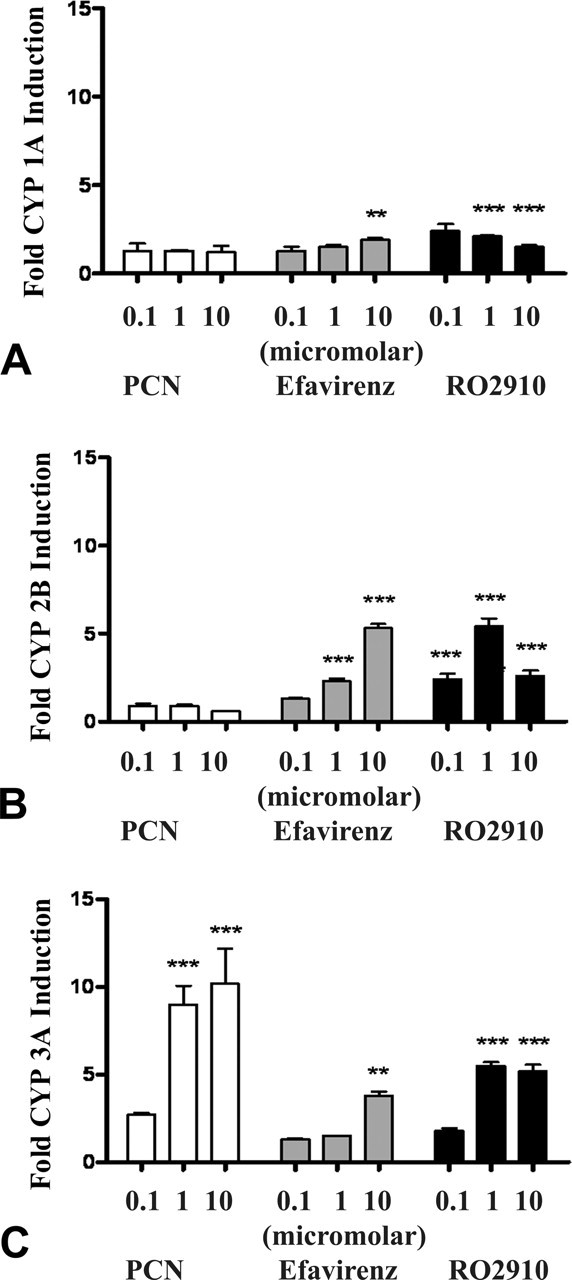
Enzymatic activity levels in cultured primary rat hepatocytes averaged from two independent experiments demonstrated increased CYP 1A, 2B, and 3A enzymatic activities (A–C, respectively) after exposure to increasing concentrations of the active metabolite of RO2910 for forty-eight hours. Further, the response was compared with that of well-studied P450 and UGT inducers, PCN and efavirenz, to gauge potency. The active metabolite of RO2910 induced CYP 2B more than PCN and efavirenz and induced CYP 3A more than efavirenz, but less than PCN. Bars represent the mean and standard deviation, and asterisk indicates significant change relative to vehicle control. ** p <.01 and *** p <.001.
In forty-eight–hour exposure of cultured primary culture rat hepatocytes, hepatic induction of CYP 1A, 2B, and 3A enzyme activities was observed at increasing concentrations of the active metabolite of RO2910 (RO8862). Further, hepatic induction was compared with that of the well-studied P450 and UGT inducers, PCN and efavirenz, to gauge relative potency (Figure 4). The active metabolite of RO2910 induced CYP 2B more than PCN and efavirenz and induced CYP 3A more than efavirenz, but less than PCN. As a note, the 1-µM dose of RO2910 compared with the 10-µM dose exhibited a marked decrease in CYB 2B activity. Although the mechanism is unknown, it was hypothesized to be an in vitro artifact at higher concentrations of this compound that led to a loss of cellular function. This effect also was observed with CYP 1A activity, where there was a decrease from the vehicle control group at the 1-µM and 10-µM doses, and with CYP 3A activity, where there was a small decrease at the 10-µM dose compared with the 1-µM dose.
Pituitary Gland
In the pituitary gland pars distalis, scattered individual cell hypertrophy was observed in individual male rats from all treated groups with a slight dose-response in incidence and also in severity in the high-dose group only (Table 2, Figure 5 ). Hypertrophied cells were immunoreactive for TSH and had less signal intensity (“light-staining cells”) compared with the immunoreactive cells from vehicle control rats (“dark-staining cells”) or non-hypertrophied cells from treated rats (Figure 5). By quantitative image analysis, there was a significant increase in light-staining thyrotrophs in all male RO2910-treated groups and in the high-dose female group only, with a greater effect in all male groups (Figure 6 ).
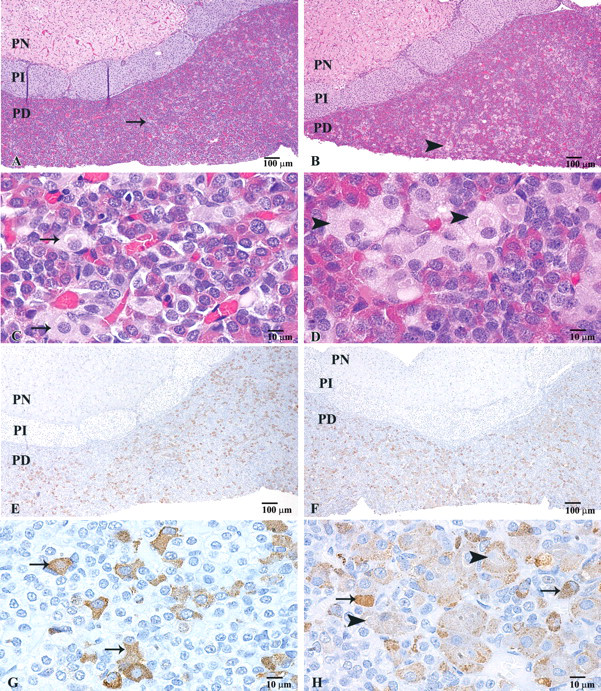
Pituitary gland at low magnification (4×, bar = 100 µm) and pars distalis at high magnification (40×, bar = 10 µm) from a male rat of the vehicle control group and high-dose group. Compared with similar cells in the vehicle control (A and C; arrow), the treated rat (B and D) had scattered individual cell hypertrophy in the pars distalis (arrowhead) on hematoxylin and eosin–stained sections. Hypertrophied cells were immunoreactive (brown staining) for thyroid-stimulating hormone antibody (thyrotrophs), and thyrotroph numbers were similar between the vehicle control (E) and treated rat (F). The signal intensity, however, changed from “dark-staining” non-hypertrophied thyrotrophs (arrow) in the vehicle control (G) or treated rat (H) to “light-staining” hypertrophied thyrotrophs (arrowhead) in the treated rat (H). Abbreviations: PD, pars distalis; PI, pars intermedia; PN, pars nervosa.
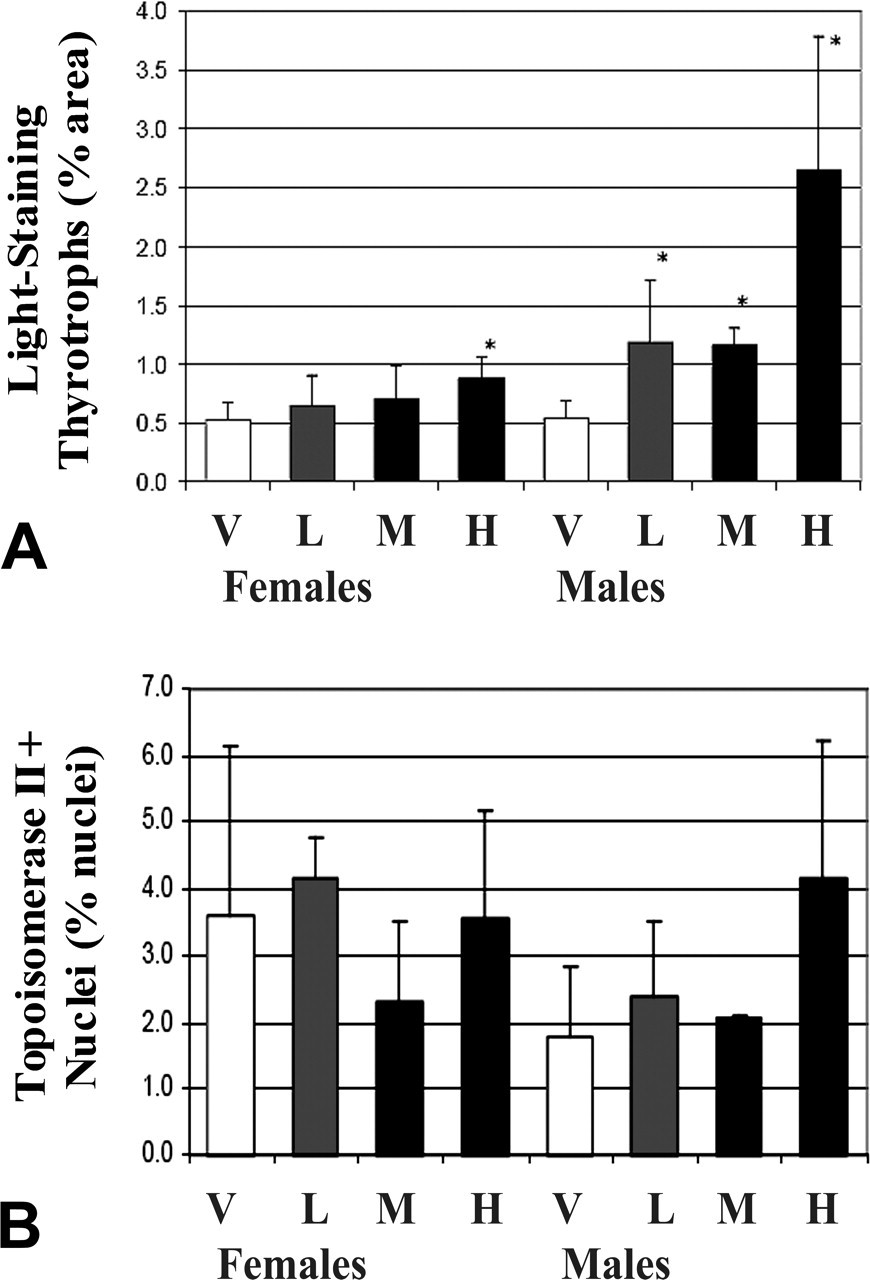
(A) Quantitative image analysis of sections of pituitary gland from vehicle control and treated rats with enumeration of the light-staining thyrotrophs (i.e., cells with immunoreactivity of lower signal intensity to thyroid-stimulating hormone antibody), which represent the hypertrophied thyrotrophs, expressed as the percentage area within the area of the pars distalis. All male and high-dose female groups had a significant increase in light-staining thyrotrophs, with a greater affect in all male groups and disproportionate increase in the high-dose male group. (B) Quantitative image analysis of topoisomerase IIa antibody–stained sections of pituitary gland from vehicle control and treated rats with enumeration of the immunoreactive cell nuclei expressed as a percentage of all cell nuclei in the pars distalis. There was no difference among vehicle control and treated groups. Bars represent the mean and standard deviation, and asterisk indicates significant change relative to vehicle control at p < .05. Dose groups were as described in the materials and methods. Abbreviations: H, high-dose group; L, low-dose group; M, mid-dose group; V, vehicle.
One or two female rats in each of the low- and mid-dose groups had a slight increase in light-staining thyrotrophs; however, the magnitude and incidence was too low for a group effect. The total number of TSH-positive cells, either light- and dark-staining combined or only of dark-staining cells, was not different between treated and vehicle control rats. Supporting a lack of an increase in the thyrotroph population, the number of mitotic cells, as detected by immunoreactivity for topoisomerase IIa antibody, was not changed among control and treated groups (Figure 6). Hypertrophied cells were not immunoreactive for other anterior pituitary hormones, including antibodies for LH, ACTH, FSH, or POMC.
Thyroid Gland
Bilateral diffuse thyroid follicular cell hypertrophy, sometimes associated with decreased colloid content, was observed in rats of both sexes from all treated groups (Table 2, Figure 7 ). There was a slightly increased incidence in males compared with females and a dose-dependent increased incidence in females. Follicular cells in affected thyroid glands also had increased mitotic activity, as detected by increased immunoreactivity for topoisomerase IIa antibody (Figure 7). Quantitative image analysis of H&E– and topoisomerase IIa antibody–stained sections confirmed the qualitative findings from histopathology and immunohistochemistry (Figure 8 ), indicating an increase in follicular cell cytoplasmic area and the number of topoisomerase IIa–immunoreactive cells in all treated groups. The change in cytoplasmic area corresponded in mid- and high-dose males to a dose-dependent decline in colloid area.
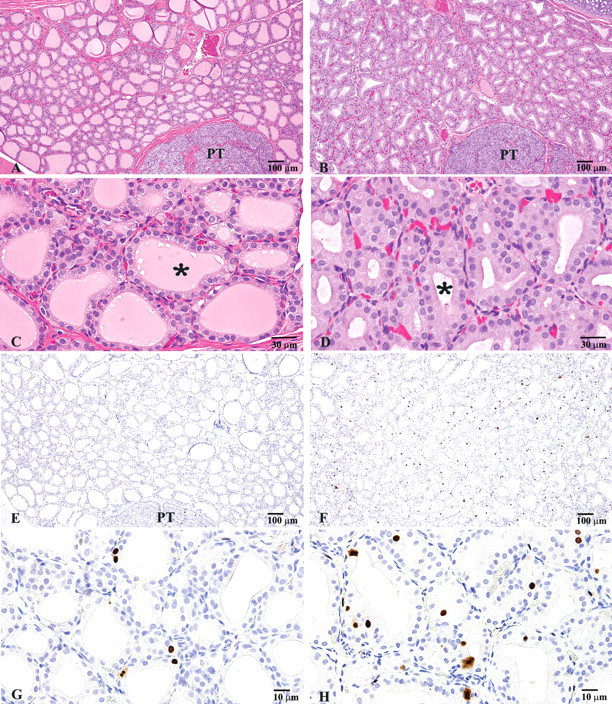
Thyroid gland at low magnification (4×, bar = 100 µm) and high magnification (20×, bar = 30µm) from a male rat of the vehicle control group and high-dose group. Compared with the vehicle control (A and C), the treated rat (B and D) had follicular cell hypertrophy and reduced colloid content (asterisk) on hematoxylin and eosin–stained sections. Compared with the vehicle control (E and G), the treated rat (F and G) had increased numbers of follicular cell nuclei that were immunoreactive (brown staining) for topoisomerase IIa antibody, indicating increased mitotic activity. Abbreviation: PT, parathyroid gland.
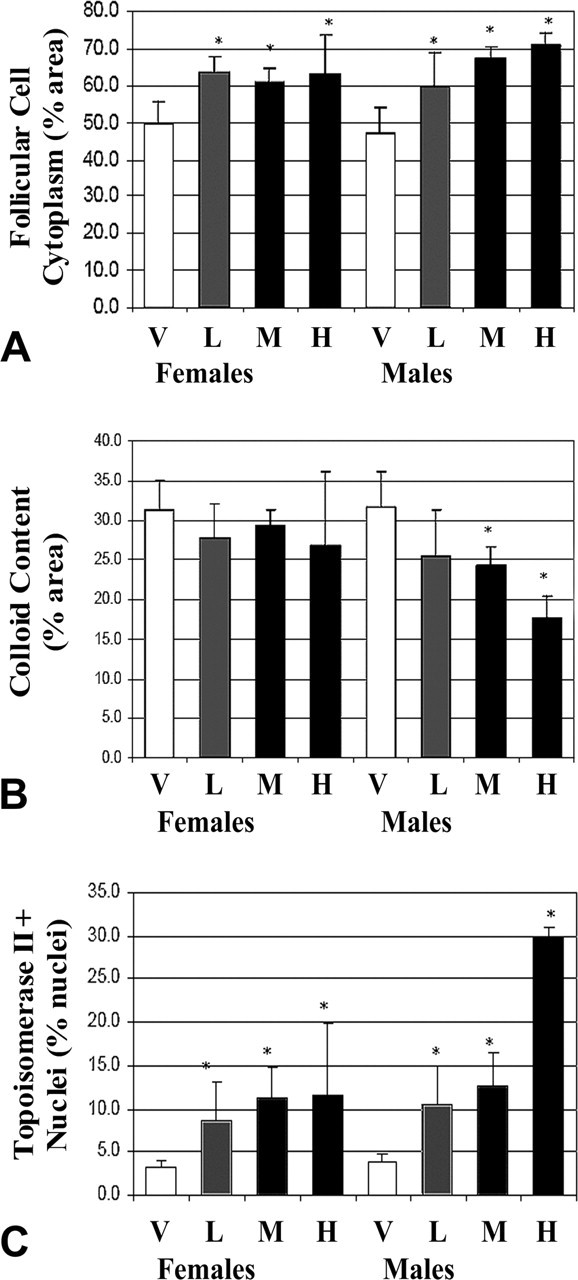
Quantitative image analysis of hematoxylin and eosin–stained sections of thyroid gland from vehicle control and treated rats with enumeration of follicular cell cytoplasm (A) and colloid content (B) expressed each as the percentage of area within the area of the follicular region. Follicular cytoplasmic area was increased in all treated groups and was slightly greater in males compared with females. This change corresponded only in mid- and high-dose males to a dose-dependent decline in colloid area. (C) Quantitative image analysis of topoisomerase IIa antibody–stained sections of thyroid gland from vehicle control and treated rats with enumeration of immunoreactive follicular cell nuclei expressed as the percentage of the total number of follicular cell nuclei. There was a dose-dependent increase in all treated groups with a slight male bias, and the increase was disproportionate in the male high-dose group. Bars represent the mean and standard deviation, and asterisk indicates significant change relative to vehicle control at p < .05. Dose groups were as described in the materials and methods. Abbreviations: H, high-dose group; L, low-dose group; M, mid-dose group; V, vehicle.
Discussion
A common pathogenesis is proposed to explain the histopathology findings in the pituitary gland pars distalis, thyroid gland, and liver as a result of oral administration of RO2910 for fourteen days to Wistar rats. Namely, the xenobiotic-induced hepatic enzymes increased metabolism of thyroid hormone (T4) and elevated TSH via negative feedback on the hypothalamic–pituitary–thyroid axis (Attia and Aref 1991; Ennulat et al. 2010; McClain 1989; McClain et al. 1989). This hypothesis is supported by results from other hepatic enzyme inducers reported in the literature (Burns-Naas et al. 2005; Dixit et al. 2007) and from our own findings in the pituitary gland (which were unique to the literature), thyroid gland, and liver.
This adaptive physiologic response of the thyroid gland to hepatic enzyme induction and stimulation of the hypothalamic–pituitary–thyroid axis observed in rats treated with RO2910 is a well understood and familiar response in rats, especially in males, treated with high doses of xenobiotics. Hepatic enzyme inducers disrupt serum thyroid–related hormone levels and activate a tightly regulated feedback loop involving the hypothalamus, anterior pituitary, and thyroid gland (Curran and DeGroot 1991; Ennulat et al. 2010; Silva and Larsen 1978). Hepatic enzyme induction, in particular UGT activity, increases the metabolic clearance of thyroid hormones (T4 and T3), an effect that is exacerbated by xenobiotic-induced increase in bile flow (Barter and Klaassen 1992; Curran and DeGroot 1991).
The lowered levels of serum thyroid hormone relieve their repressive effect on the hypothalamic release of thyroid-releasing hormone (TRH), thus causing an increase in TRH and concomitant stimulation of TSH secretion from thyrotrophs in the anterior pituitary. Thyroid-stimulating hormone acts on the thyroid gland to increase the synthesis and release of T4 and T3. Seminal studies in rats administered phenobarbital (PB) demonstrated that the perturbation of this initially adaptive feedback response system is the primary mechanism that leads to a higher propensity of thyroid tumors (McClain 1989; McClain et al. 1988; McClain et al. 1989). Subsequent studies in rats confirmed that PB induces UGT-mediated T4 and T3 metabolism, reduces serum T4 and T3 levels, increases serum TSH levels, and acts as a promoting stimulus for thyroid tumor growth to which Sprague-Dawley rats are most susceptible (DeSandro et al. 1991; Ennulat et al. 2010; Hiasa et al. 1982; Kolaja and Klaassen 1998; Kolaja et al. 1999; Kolaja et al. 2000).
In this study, changes in serum T4 and TSH levels were consistent with this pathogenesis; however, serum T3 levels were not changed, which is less expected in rats in contrast to humans (Ennulat et al. 2010). In addition, the increased mitotic activity in the thyroid gland after fourteen days of treatment with RO2910 supports a progression from hypertrophy to hyperplasia. Similarly, other molecules in the same pharmacologic class as RO2910, including darunavir, neviripine, and efavirenz, as well as a number of other inducers of hepatic enzymes, lead to thyroid hormone disruption and/or thyroid tumorigenesis (Burns-Naas et al. 2005; Dixit et al. 2007). The reason for the unexpected unchanged serum T3 levels in this study may be related to differences among rat strains in thyroid hormone (T4 and T3) response to elevated TRH and TSH, metabolism and inter-individual variability, as demonstrated in Sprague-Dawley and Fischer rats, or to the sampling time point, which was not appropriate to capture the T3 response in Wistar rats (Fail et al. 1999). Finally, the potential for a direct effect of RO2910 on thyroid peroxidase was unlikely or not pronounced, because RO2910 did not demonstrate the profile of a marked decline in serum levels of T3 and T4 with a concomitant sharp increase in TSH, as demonstrated with inhibitors of thyroid peroxidase such as propylthiouracil (Kolaja et al. 2000). Instead, as indicated, RO2910 induced a profile of thyroid hormone change that was similar to other potent hepatic enzyme inducers causing secondary effects on thyroid hormone economy.
The hepatic induction–mediated mechanism of thyroid tumor formation in rats demonstrates different susceptibility between different rat strains and animal species and is not considered a relevant risk to humans (Ennulat et al. 2010; Wu and Farrelly 2006). When humans are exposed to hepatic enzyme–inducing xenobiotics, changes in thyroid hormone and TSH generally are muted, as there is a decreased sensitivity to fluctuations in thyroid hormone homeostasis. This decreased sensitivity is attributed mostly to the difference in carrier proteins for thyroid hormones, as humans use thyroxine binding globulin (TBG) and albumin, whereas rats use thyroxine-binding prealbumin (transthyretin) and albumin. These latter two proteins have comparatively lower affinity than TBG by several orders of magnitude, and consequently, rats have substantially shorter half-lives of T3 and T4 and higher baseline levels of TSH (Wu and Farrelly 2006). Additionally, T3 is metabolized primarily through sulfation and deiodination in humans as compared with glucuronidation in rats (Ennulat et al. 2010). Accordingly, rats, unlike humans, are more sensitive to thyroid hormone depletion, as seen during hepatic enzyme induction, and have more chronic thyroid stimulation, higher thyroid follicular cell proliferation rates, and higher baseline thyroid tumor incidence (Kolaja and Klaassen 1998; Kolaja et al. 1999; Kolaja et al. 2000).
The consequences of treatment with RO2910 on thyroid and pituitary gland pathology were more pronounced in males than in females. Substantial induction of CYP 2B1, 3A1, and 3A2 and UGT 1A1 and 2B1 was noted in both sexes, which was consistent with the observed incidence and severity of hepatocellular hypertrophy. There was, however, a slightly greater induction of UGT 2B1 in males as compared with a greater induction of CYPs in females. This difference between sexes is likely explained by the higher basal level of mRNA expression of CYP 2B1, and similarly CYP 3A2, in male control rats, which limits the dynamic range for response, as the absolute level of normalized mRNA expression in male and female high-dose–treated rats was within two-fold of each other (data not shown). Further, the greater UGT induction in males concords with the more pronounced changes in the thyroid gland and pituitary gland and circulating TSH levels in males. The induction of UGT is integral to the pathogenesis of hepatic enzyme induction–mediated changes in thyroid hormone homeostasis and provides a substantive link to previous mechanistic studies describing drug-induced hepatic enzyme changes leading to histological changes in the thyroid gland (Curran and DeGroot 1991; Kolaja and Klaassen 1998).
Despite the slight male bias in UGT induction, TSH increase, and thyroid pathology, the decrease in T4 was similar between the sexes. This finding may be attributed to males being more sensitive to thyroid hormone depletion–mediated pituitary gland stimulation, as suggested by the more pronounced pituitary gland change discussed subsequently, which results in more pronounced TSH-induced thyroid gland hypertrophy. This difference in hypertrophy and the short half-life of T4 result in a more dynamic response to increased UGT metabolism and increased thyroid production, and ultimately is a hypothesis to explain the lack of a sex difference in T4 response at fourteen days.
Although xenobiotic-induced changes in the pituitary gland have not been described previously, severe depletion of thyroid hormones, such as after thyroidectomy, can lead to histological changes in the pituitary gland (Ozawa 1991). Physiologic stress, such as extreme heat or cold, also can lead to rapid changes (e.g., within thirty minutes) in the cellular phenotypes of the anterior pituitary in mice, and males are more sensitive to this change than females (Senovilla et al. 2008). Germaine to results from this study, direct-acting thyroid-disrupting agents that inhibit thyroid peroxidase, such as methimazole or propylthiouracil, lead to transdifferentiation of somatotrophs into thyrotrophs in a transient manner (Horvath et al. 1990; Radian et al. 2003). In rats, severe hypothyroidism induced by thyroidectomy does not cause proliferation of thyrotrophs, but rather a shift in the relative populations of somatotrophs and thyrotrophs toward thyrotrophs (Nolan et al. 2004; Ozawa 1991; Quintanar-Stephano et al. 1999). In dogs, prolonged primary hypothyroidism caused thyrotroph hypertrophy in a manner similar to what is described herein, although chronically, pituitary hyperplasia was observed (Diaz-Espineira et al. 2008).
Stressful stimuli can cause rapid changes in pituitary cellular phenotype, which suggests that adaptive physiologic changes may be the dominant response pathway, at least initially. After administration of RO2910 for fourteen days, there was thyrotroph hypertrophy in the pituitary gland in all male RO2910-treated groups and only the high-dose female group, which is consistent with the changes in TSH levels. The low- and mid-dose female groups had increased TSH levels that were not statistically significant because of the high standard deviation, which may reflect individuals that had a slight increase in light-staining thyrotrophs by image analysis for which the magnitude and incidence was too low for a group effect. Thyrotroph hypertrophy was not associated with increased mitotic activity or a change in the total number of thyrotrophs, suggesting there was no progression to hyperplasia at fourteen days. Thus, as demonstrated in this study, individual cells of the anterior pituitary demonstrate an inherent plasticity to adapt to physiologic demands to which males may be more sensitive than females (Senovilla et al. 2008; Vankelecom 2007; Villalobos et al. 2004), such as induction of hepatic enzymes and subsequent alterations in thyroid hormone homeostasis.
The results from this study reveal the mechanism by which RO2910 hepatic induction disrupted thyroid hormone homeostasis and caused secondary histological changes. Increased activity of hepatic enzymes, in particular (mRNA) UGT, increased the biliary clearance of thyroid hormone, initiating a feedback loop through the hypothalamic–pituitary–thyroid axis. The hypertrophy in the thyroid gland and pituitary gland were secondary to decreased levels of serum thyroxine. In the thyroid gland but not pituitary gland, there was a suggested progression to hyperplasia by fourteen days. Males were slightly more sensitive than females to the perturbation in the hypothalamic–pituitary–thyroid axis. The data presented herein provide the basis for the mechanistic understanding of the histopathology consequences of treatment with RO2910, which can be used to assess potential human risk.
Footnotes
Acknowledgments
The authors appreciate the second pathology review by Dr. Michael Irwin and support provided by Dr. Patrick Caplazi, Khanh Ngyuen, Pam Olson, and Denise Knapp.
The author(s) declared no potential conflicts of interest with respect to the research, authorship, and/or publication of this article.
The financial support from Roche pharmaceuticals for the program was that in which this finding occurred and not specifically for this research and publication.