
Abstract
Evaluation of ovarian toxicity requires an understanding of the physiological changes related to the estrous cycle in the ovary. The authors investigated the transitional gene expression profile of ovulatory follicles in rats that show normal estrous cyclicity. Ovaries were collected at 10:00 and 22:00 on the proestrus day and at 10:00 on the estrus day. Ovarian follicles or early corpora lutea were isolated using laser microdissection, and extracted total RNA was analyzed using microarray technology. Clustering analysis revealed four different expression patterns: transient up- or down-regulation only at 22:00 on the proestrus day (pattern 1), up- or down-regulation only at 10:00 on the estrus day (pattern 2), continuous increase at 22:00 on the proestrus day and at 10:00 on the estrus day (pattern 3), and up- or down-regulation at 22:00 on the proestrus day and level maintenance at 10:00 on the estrus day (pattern 4). In addition, these probe sets were functionally categorized in each pattern using the Ingenuity Pathways Analysis database. These data will aid in understanding the physiology of ovulation and may be useful in assessing ovarian toxicity and its mechanism, such as in investigations of chemical-induced ovulatory impairment.
Introduction
In toxicological assessment of pharmaceuticals, evaluation of the ovary is an important endpoint for detecting adverse effects on the female reproductive system (Regan et al. 2005; Sanbuissho et al. 2009). In 2009, International Conference on Harmonization of Technical Requirements for Registration of Pharmaceuticals for Human Use (ICH) M3 guidelines approved the enrollment of women of childbearing potential into phase 1 and 2 clinical trials, before conducting a female fertility study on the condition that a thorough standard histopathological examination of the ovaries be conducted in repeated-dose toxicity studies (ICH 2009). To correspond with the current situation, toxicological pathologists need to be more familiar with all morphologic changes in the ovary during the normal estrous cycle.
Ovulation is a complex process; after the mature follicle collapses, the oocyte is then released and reconstruction of tissue follows. In normal estrous cycling rats, the antrum of the follicle grows in size and becomes cystic rapidly as follicular fluid increases. Cumulus cells then gradually loosen on the proestrus day, and ovulatory follicles rupture early in the morning on the estrus day. The granulosa and theca cells in the postovulatory follicle are transformed into the luteal cells after ovulation (Richards and Espey 2006).
We previously reported that indomethacin induced formation of unruptured luteinized cysts in 2- and 4-week repeated-dose studies in female rats (Tsubota et al. 2009). Cyclooxygenase-2 (COX-2), the target molecule of indomethacin, is known to be expressed in granulosa cells for a short period after the lutenizing hormone (LH) surge (Sirois et al. 2004), and indomethacin exerts a direct effect on the ovary only during this small window of activity. While a number of compounds are known to induce ovarian toxicity, detection of toxicity may be difficult if the target molecule is expressed for only a short period, as with COX-2. Identification of molecules transiently expressed during ovulation is thought to be a significant hurdle to understanding cyclic changes in the ovary.
Transitional and cyclic changes during ovulation have been studied via polymerase chain reaction (PCR) analysis and gene expression profiling in granulosa cells isolated from immature rats primed with gonadotropin using the needle puncture method (Jo et al. 2004) as well as in several large animal species (Sayasith, Brown, and Sirois 2007). However, no studies have yet reported on transitional gene expression profiling in untreated rats with normal estrous cyclicity.
Laser microdissection (LMD) is a useful technique for isolating a fraction of the tissue of interest from histological sections and has already been used to examine ovarian follicles in rats in combination with PCR (Grosse et al. 2000; Sakurada et al. 2006), proving its worth as a powerful tool for examining these tissues. Gene expression profiling using high-density oligonucleotide microarrays is widely used to predict the toxicity of new drugs. In combination, these techniques have helped scientists to define the gene expression profile specific to the ovarian follicle without contamination from other cells.
Here, we used LMD to collect ovarian follicle samples from untreated estrous-cycling rats at 10:00 and 22:00 on the proestrus day and 10:00 on the estrus day and profiled the transitional changes in gene expression during ovulation in rats.
Materials and Methods
Animals
Nine female, 8-week-old Crl:CD(SD) rats were purchased from Charles River Japan (Yokohama, Japan). Three animals were housed in each metal cage in a barrier room in a specific pathogen-free environment, with a temperature of 22.4°C to 23.8°C, a relative humidity of 45% to 62%, and a 12-hour light-dark cycle. A standard commercial diet (CRF-1; Oriental Yeast Co., Ltd., Tokyo, Japan) and tap water were available ad libitum. After 1 week of acclimatization, estrous phases in each animal were determined from vaginal smears obtained for 5 consecutive days. During the study, animals were handled in accordance with the Guidelines for Animal Experimentation issued by Astellas Pharma Inc., which is based on the guidelines for animal experimentation issued by the Japanese Association for Laboratory Animal Science.
Sample Collection
Animals were sacrificed by exsanguination under anesthesia with ether at 10:00 on the proestrus day, 22:00 on the proestrus day, and 10:00 on the estrus day (three at each time point). The ovaries were removed and embedded in OCT (Tissue-Tek, Sakura Finetek, Torrance, CA), frozen in dry-ice–cold isopentane, and stored at –70°C until use.
Histopathology and LMD
To demonstrate transitional change histopathologically and to differentiate target ovulatory follicles from atresias, we used hematoxylin and eosin (HE) and immunohistochemical staining for the proliferative cell marker Ki-67 (anti-mouse, M7248; Dako Cytomation, Glostrup, Denmark), respectively. And to identify periovulatory follicles (PeFs), immunohistochemical staining for COX-2 (anti-goat, SC-1747; Santa Cruz Biotechnology, Santa Cruz, CA) was used. For immunohistochemical demonstration, tissue sections in citrate buffer (S2031; Dako Cytomation) were placed in a microwave oven for 10 minutes for antigen retrieval. Ki-67 was diluted at 1:50, COX-2 was diluted at 1:100, and they were incubated with tissue sections for 1 hour at room temperature. As second antibody, a mouse to mouse immunohistochemistry detection system kit (for Ki-67, CHEMICON International, Temecula, CA; and horseradish peroxidase–rabbit anti-goat IgG, Zymed, San Francisco, CA) was used. All of these stainings were conducted on three serial frozen sections 4-μm thick. Cystic and Ki-67(+)/Cox-2(–) follicles on ovaries removed at 10:00 on the proestrus day were targeted as Graafian follicles (GFs), cystic and Ki-67(+)/Cox-2(+) follicles on ovaries removed at 22:00 on the proestrus day were targeted as PeFs, and solid and Ki-67(+)/Cox-2(+) follicles on ovaries removed at 10:00 on the estrus day were targeted as postovulatory follicles (PoFs).
Photographs of HE and immunohistochemical stain samples were assumed to accurately indicate the position of each target follicle on the LMD system display screen. Frozen sections (8-μm thick) were mounted on the membrane slides (MMI, Glatteburg, Zurich, Switzerland) and stained using a Histogene LCM frozen section staining kit (Arcturus Engineering, Mountain View, CA). Fifteen follicles in each phase were then cut using a laser and picked up by the LMD system (CellCut Plus; MMI). The collected follicle sections were lysed using the RLT buffer in the collection tube supplied with the RNeasy Micro Kit (Qiagen, Hilden, Germany), and total RNA was extracted according to the manufacturer’s instructions.
Gene Chip Experiment
GeneChip Rat Genome 230 2.0 arrays (Affymetrix, Santa Clara, CA), containing 31,099 probe sets, were used. The procedure was conducted according to the manufacturer’s instructions using the Gene Chip 3′ IVT Express Kit (Affymetrix); 30 ng of total RNA was used to synthesize biotin-labeled cRNA, and 15 µg of fragmented cRNA was hybridized to a Rat Genome 230 2.0 Array for 18 hours at 45°C and 60 rpm. The array was then washed and stained with streptavidin-phycoerythrin using Fluidics Station (Affymetrix) and scanned with a Gene Array Scanner (Affymetrix). The digital image files were processed using Affymetrix Microarray Suite version 5.0, and the intensity value files were used in a later statistical analysis with Gene Spring GX 7.3 software (Agilent Technologies, Santa Clara, CA).
Statistical Analysis
To identify the probe sets used in statistical analysis, the probe sets that showed Affymetrix “absent” call in all samples were removed. Using the identified probe sets, we conducted clustering analysis (similarity measure: Pearson’s correlation coefficient) of microarray data and statistical analysis using a volcano plot (Welch t-test, p < 0.05 and two-fold change) to identify the probe sets with differentially regulated gene expression. The canonical pathway and biological functions analysis were generated with Ingenuity Pathways Analysis software (Ingenuity Systems, Redwood City, CA). With regard to biological functions, our analysis identified the biological functions and diseases that were most significant in the data set. Fisher’s exact test was used to calculate a p value determining the probability that each biological function or disease assigned to that data set occurred due to chance alone. With regard to canonical pathways, our analysis identified the pathways that were most significant to the data set using the Ingenuity Pathways Analysis library of canonical pathways. The significance of the association between the data set and the canonical pathway was measured in two ways: by dividing the number of molecules from the data set that map to the pathway by the total number of molecules that map to the canonical pathway, and by using Fisher’s exact test to calculate a p value determining the probability that the association between the genes in the data set and the canonical pathway can be explained by chance alone.
Results
Histologically, both GFs and PeFs were cystic, but PeFs were larger than GFs and PoFs were almost solid. Theca cells and granulosa cells of GFs and PoFs, and luteal cells of PoFs were positive for Ki-67, whereas only granulosa cells of PeFs and luteal cells of PoFs were positive for COX-2 (Figure 1 ). Referring to printed-out images of HE and immunohistochemical staining (Figure 2 ), target follicles were quickly identified on the LMD system display and removed, although the figures on the display were monotone and slightly blurry. Three to five serial 8-µm specimens were cut from a pair of ovaries to collect 15 sections of target follicle in each animal. The amount of isolated total RNA was more than 95 ng.
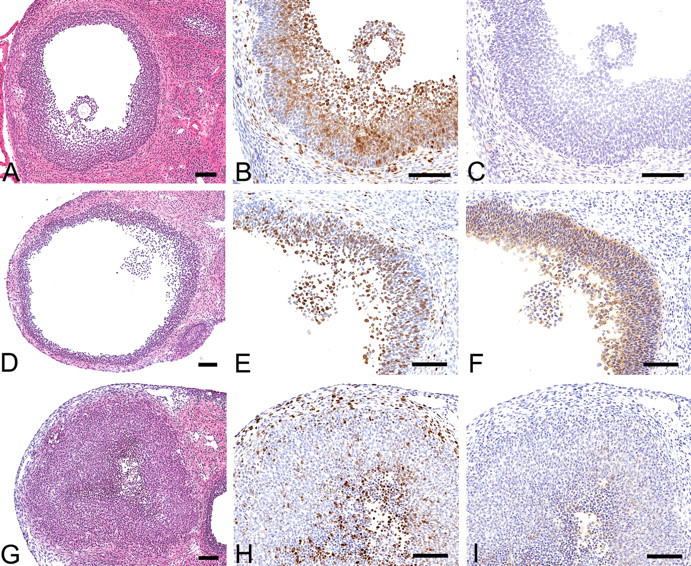
(A-C) Graafian follicle (GF) observed in the ovary removed at 10:00 on the proestrus day. (D-F) Periovulatory follicle (PeF) observed in the ovary removed at 22:00 on the proestrus day. (G-I) Postovulatory follicle (PoF) observed in the ovary removed at 10:00 on the estrus day. (A, D, G) Hematoxylin and eosin (HE) staining. (B, E, H) Ki-67 immunohistochemical staining. (C, F, I) cyclooxygenase-2 (COX-2) immunohistochemical staining. Theca cells and granulosa cells in GFs and PeFs and luteal cells in PoFs were positive for Ki-67, whereas only granulosa cells in PeFs and luteal cells in PoFs were positive for COX-2. Immmunoreactivity in PoFs was weak. Bar = 100 µm.
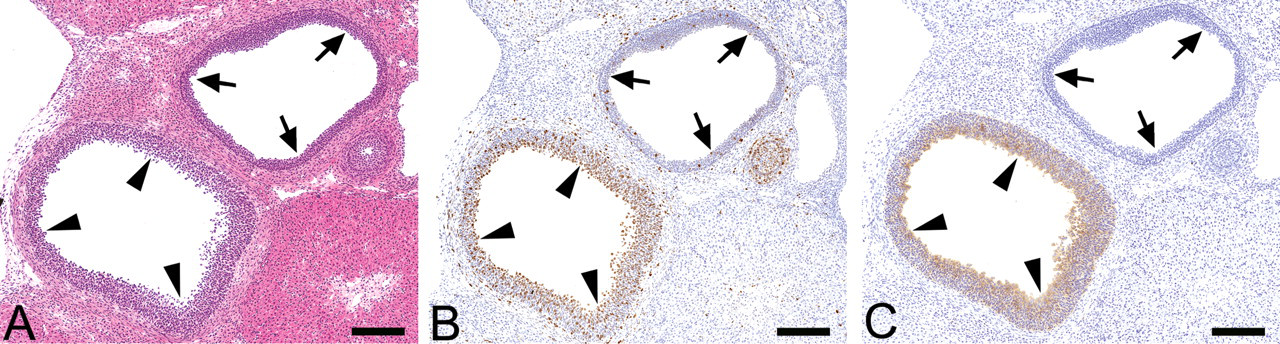
Images used to identify target follicles for laser microdissection (LMD). (A) Hematoxylin and eosin (HE) staining. (B) Ki-67 immunohistochemical staining. (C) Cyclooxygenase-2 (COX-2) immunohistochemical staining. Arrowheads indicate the target follicle, and arrow marks indicate the atretic follicle. Immunohistochemical staining is necessary for mapping target follicles, as both periovulatory follicles (PeFs) and atretic follicles are cystic. Bar = 1,000 µm.
After 13,692 probe sets that showed the Affymetrix “absent” call had been removed, the 17,407 probe sets remaining were subjected to clustering analysis, and four patterns of sequential expression of GF-PeF-PoF were described: pattern 1, up- or down-regulated only in PeFs transiently and at the base level in GFs and PoFs; pattern 2, at the base level in GFs and PeFs and up- or down-regulated in PoFs; pattern 3, always elevated in PeFs and PoFs; and pattern 4, up- or down-regulated in PeFs and maintained the same level in PoFs (Figure 3 ). Pattern 1 included 283 up-regulated and 790 down-regulated probe sets, pattern 2 included 624 up-regulated and 70 down-regulated sets, pattern 3 included 598 up-regulated sets, and pattern 4 included 251 up-regulated and 103 down-regulated sets. Patterns 1, 2, and 4 contained both up- and down-regulated probe sets, while down-regulated ones were not noted at all in pattern 3. The number of down-regulated sets exceeded up-regulated ones only in pattern 1. Raw data from hybridization and clustering analysis are available online (http://cibex.nig.ac.jp/index.jsp [CIBEX Accession: CBX137]).
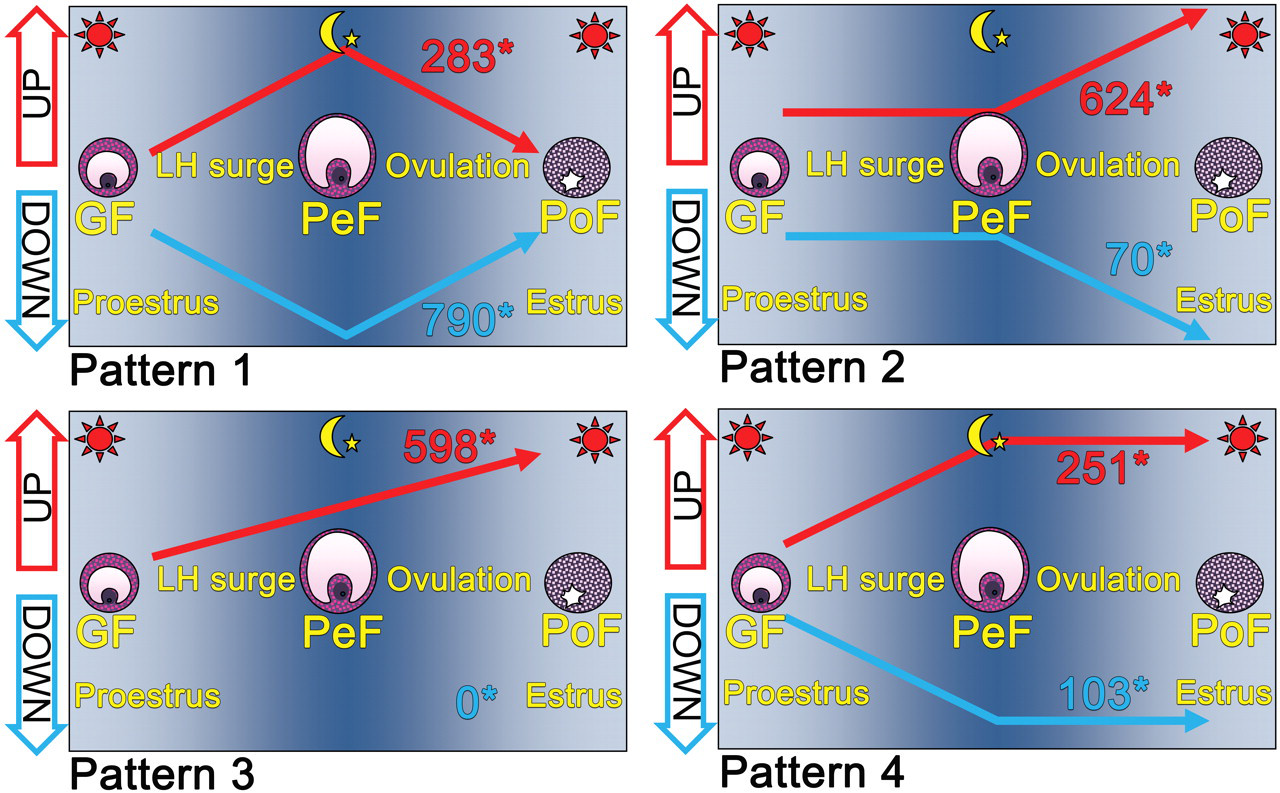
Schematic of sequential gene expression patterns for Graafian follicle (GF)–periovulatory follicle (PeF)–postovulatory follicle (PoF). Pattern 1, up- or down-regulated only in PeFs transiently and at the base level in GFs and PoFs; pattern 2, at the base level in GFs and PeFs and up- or down-regulated in PoFs; pattern 3, always elevated in PeFs and PoFs; and pattern 4, up- or down-regulated in PeF and maintained the same level in PoFs. Asterisk (*) indicates the number of up- or down-regulated probe sets.
Up-regulated probe sets in each pattern were arranged in order of increasing fold-up rate of PeFs to GFs (Tables 1, 2, 4, and 5 ) or PoFs to GFs (Table 3 ). We investigated the roles of each probe set in the ovulatory process and noted the appropriate references in Tables 1 through 5. Since a large number of probe sets in pattern 1 were reported to have roles in the ovulatory process, pattern 1 sets were split into two subcategories: Table 1 includes those sets functionally related to the ovulatory process, while Table 2 includes sets for which the function or relationship to the ovulatory process has not been reported.
Top 15 up-regulated probe sets of pattern 1 (functionally related to ovulation).
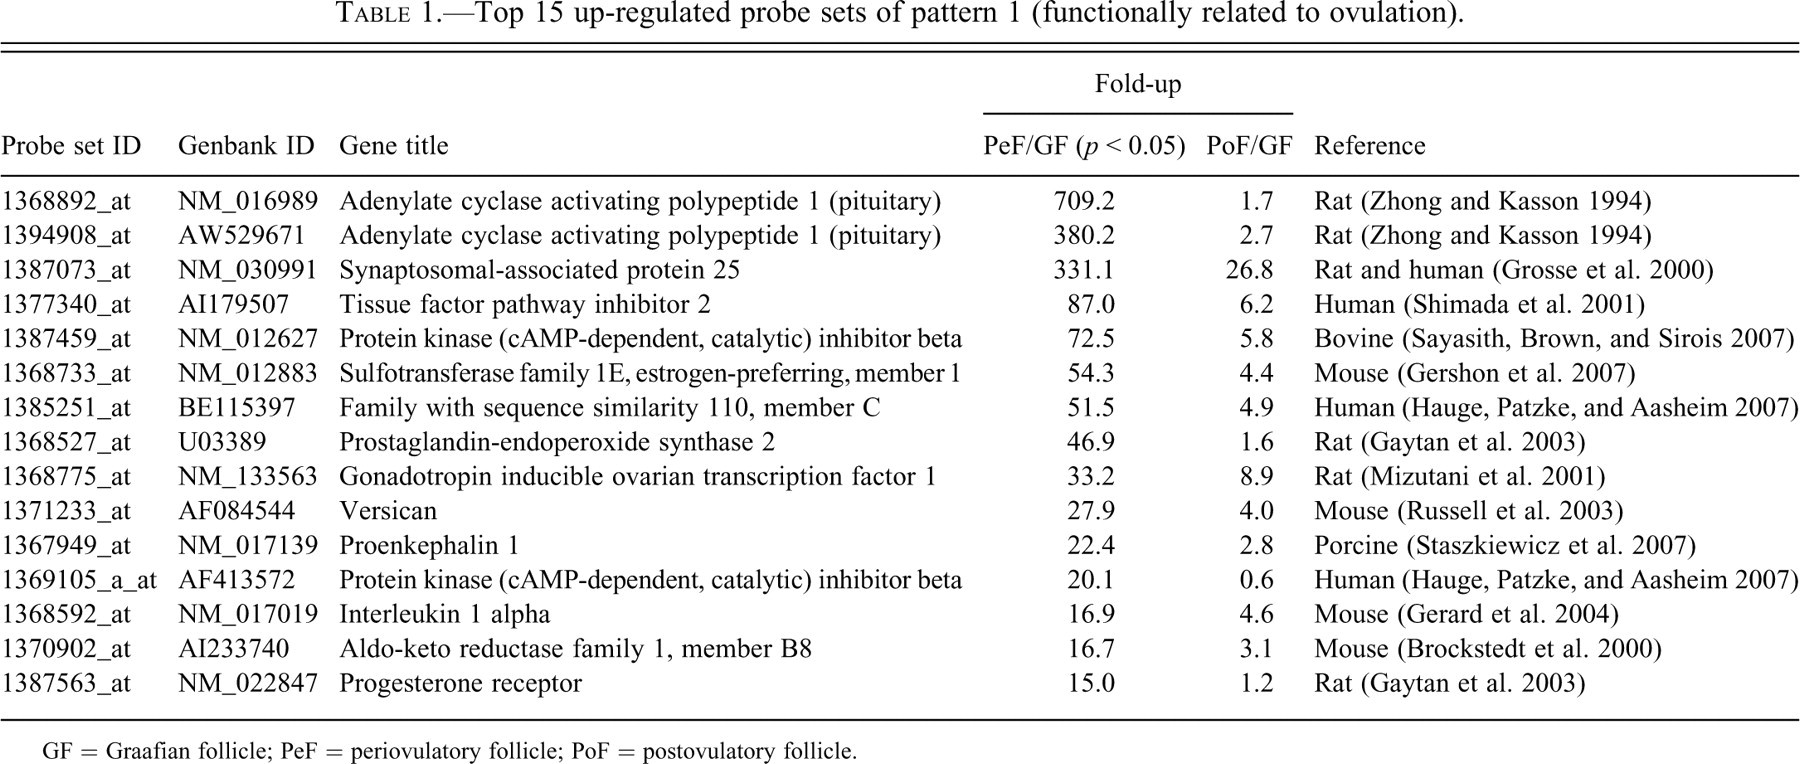
GF = Graafian follicle; PeF = periovulatory follicle; PoF = postovulatory follicle.
Top 15 up-regulated probe sets of pattern 1 (function in the ovary has not been reported).
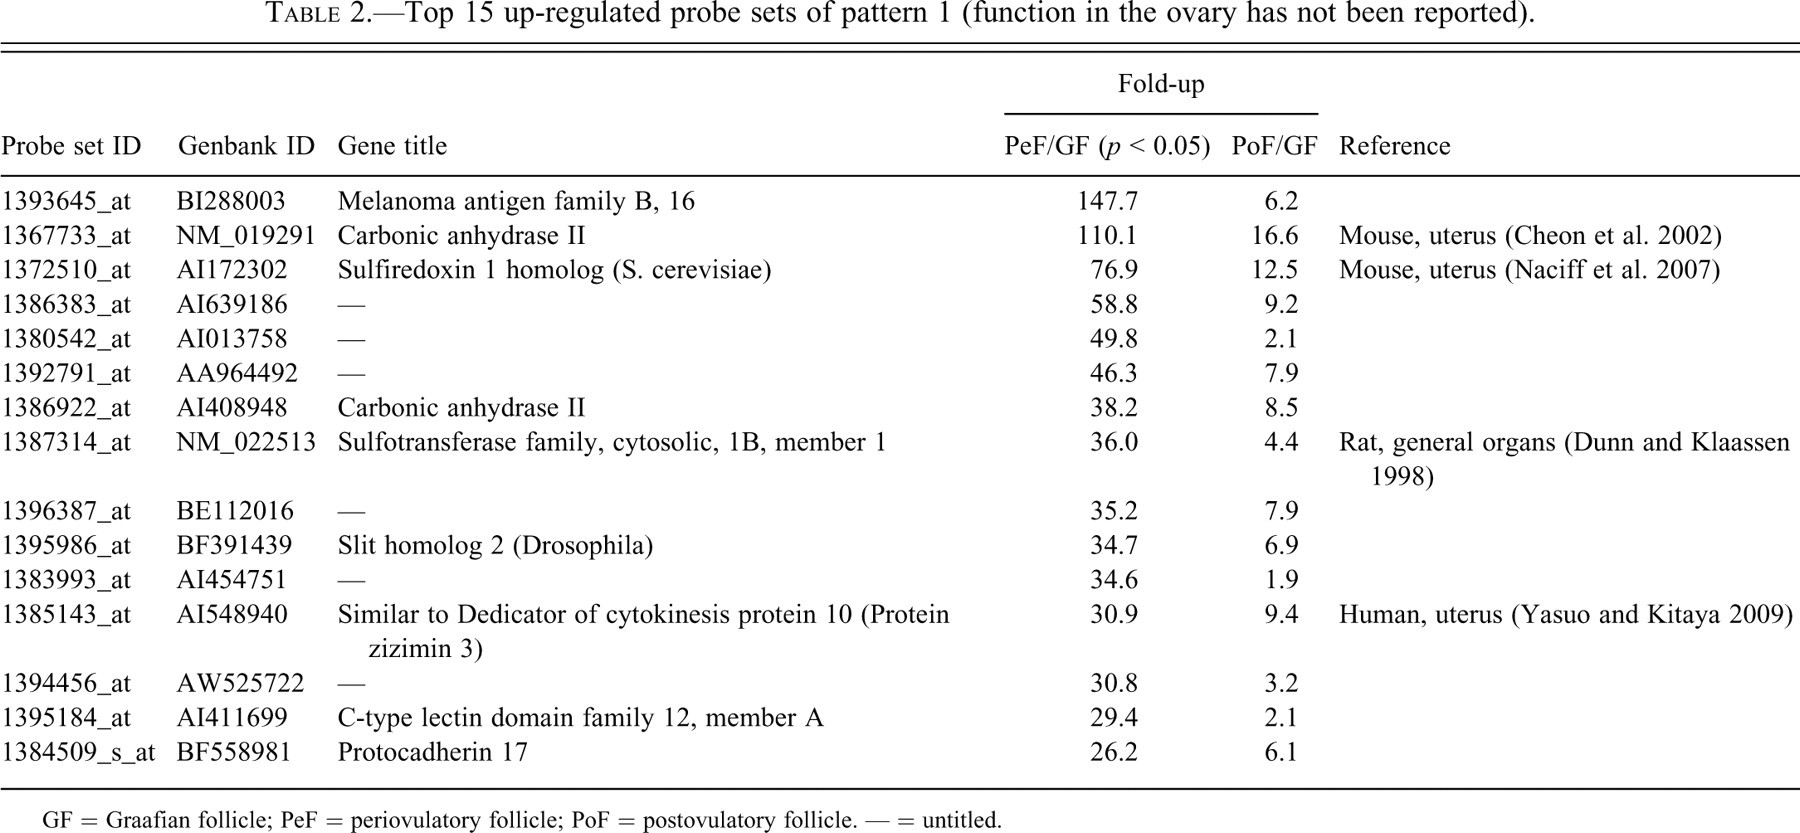
GF = Graafian follicle; PeF = periovulatory follicle; PoF = postovulatory follicle. — = untitled.
Top 10 up-regulated probe sets of pattern 3.
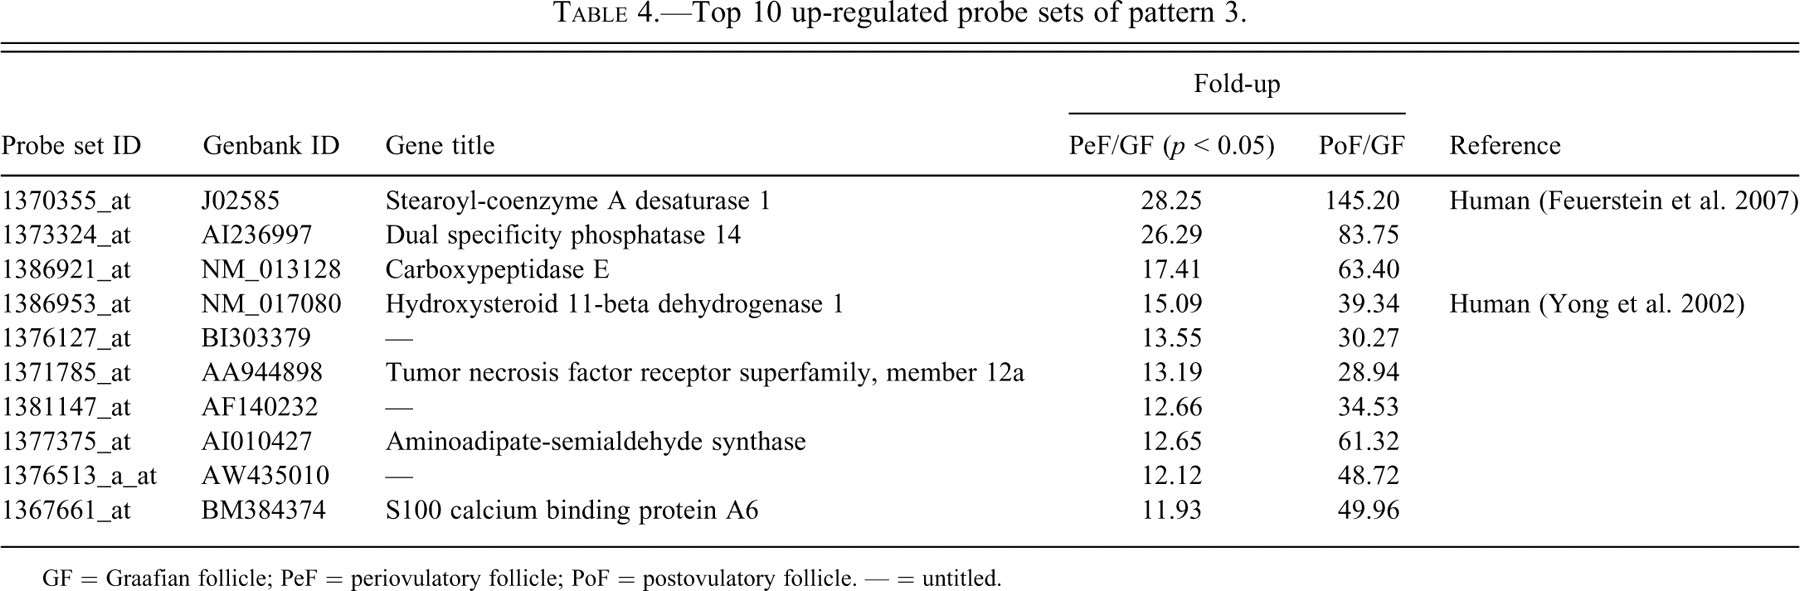
GF = Graafian follicle; PeF = periovulatory follicle; PoF = postovulatory follicle. — = untitled.
Top 10 up-regulated probe sets of pattern 4.
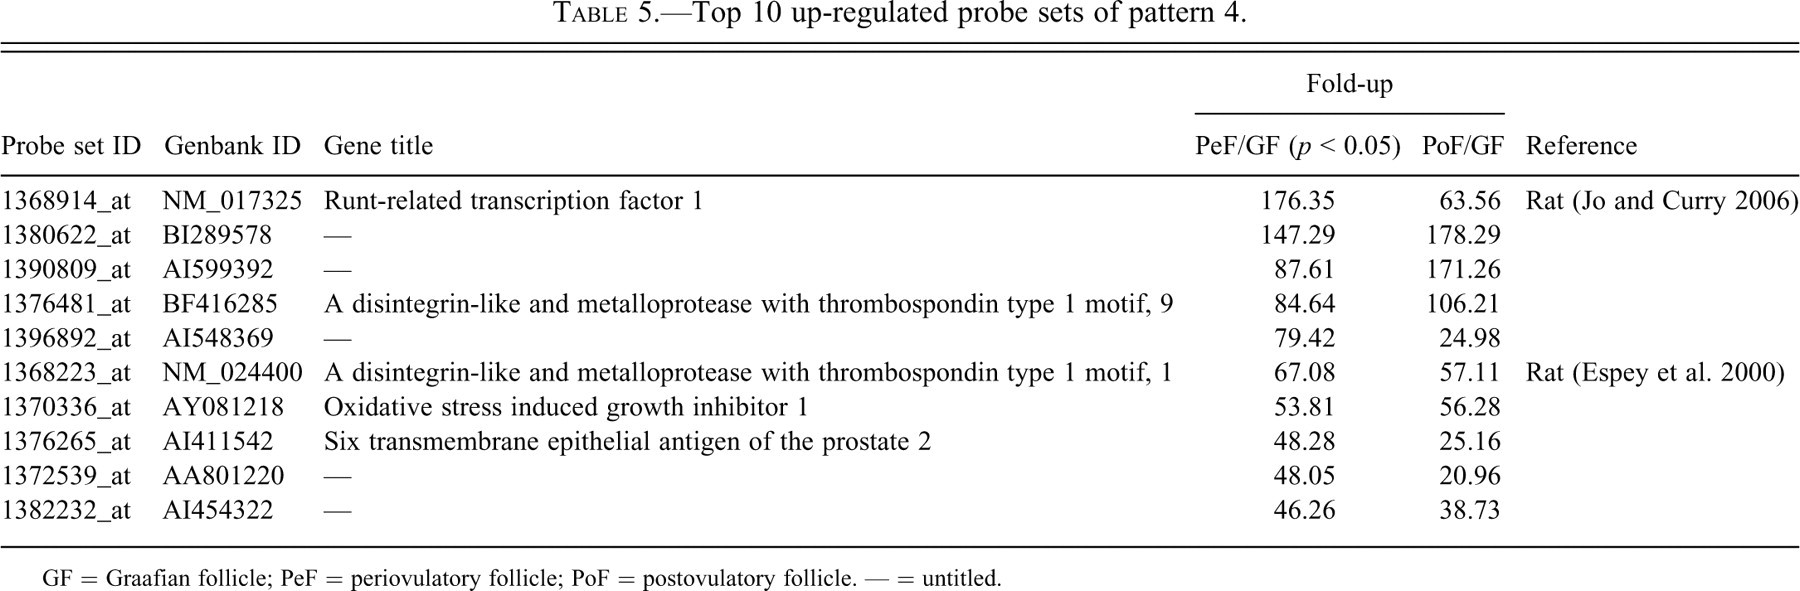
GF = Graafian follicle; PeF = periovulatory follicle; PoF = postovulatory follicle. — = untitled.
Top 10 up-regulated probe sets of pattern 2.
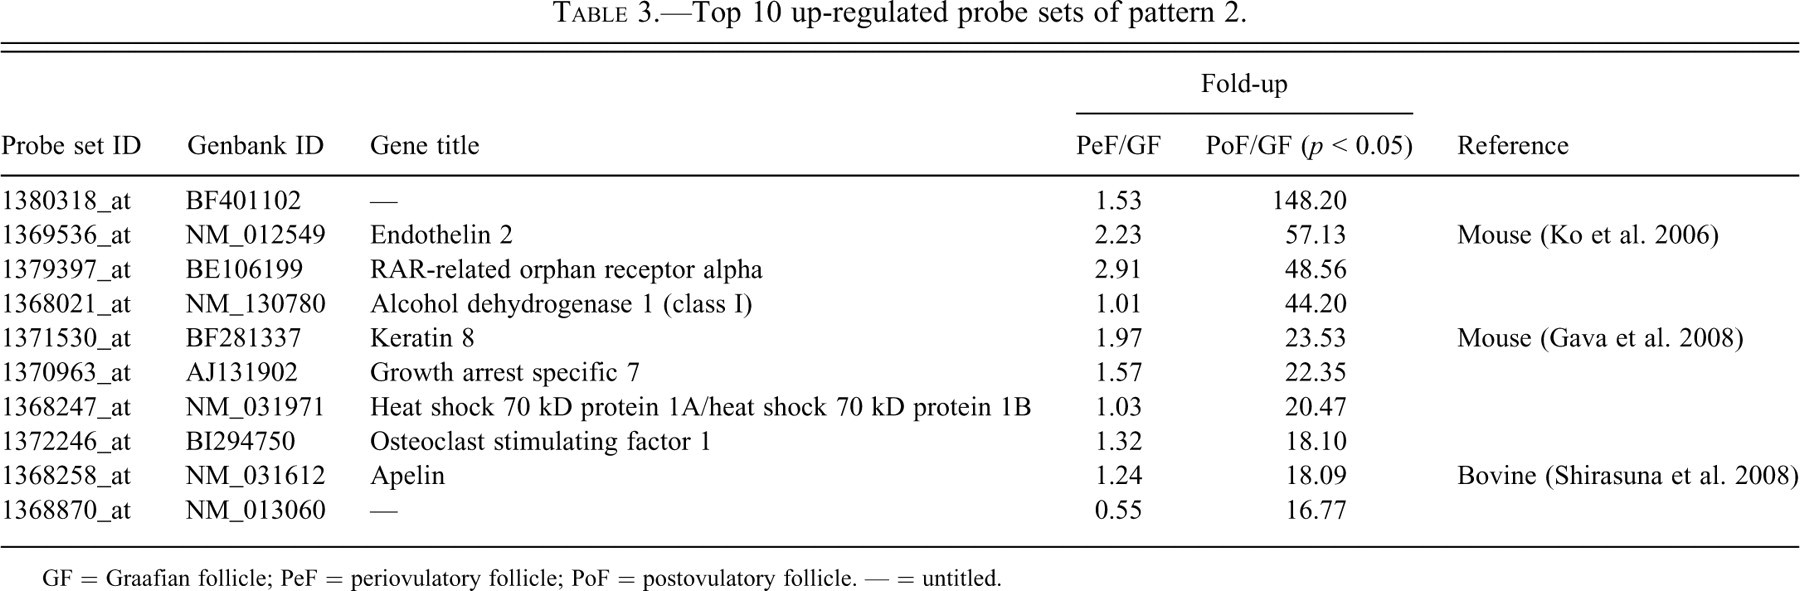
GF = Graafian follicle; PeF = periovulatory follicle; PoF = postovulatory follicle. — = untitled.
Canonical pathways analysis demonstrated the significance of a number of pathway categories (Tables 6-9 ). Probe sets in pathways such as glutathione metabolism, glycolysis/gluconeogenesis, pyruvate metabolism, and bile acid biosynthesis were involved in both patterns 1 and 2. Down-regulated probe sets were dominant in pattern 1 (Table 7), whereas up-regulated sets were dominant in pattern 2 (Table 8). Furthermore, up-regulated probe sets were dominant in almost all pathways in patterns 2 through 4, and many overlapping of pathway categories were observed, particularly in patterns 2 and 3, such as arginine and proline metabolism, Cdc42 signaling, ILK signaling, Fcγ receptor-mediated phagocytosis in macrophages and monocytes, fMLP signaling in neutrophils, polyamine regulation in colon cancer, glucocorticoid receptor signaling, PI3K/AKT signaling (also found in pattern 4), protein ubiquitination, Rac signaling, Rho A signaling, regulation of actin-based motility by Rho, actin cytoskeleton signaling, axonal guidance signaling, clathrin-mediated endocytosis signaling, and ephrin receptor signaling. These pathways were not evident in pattern 1.
Ingenuity pathway analysis of pattern 1.
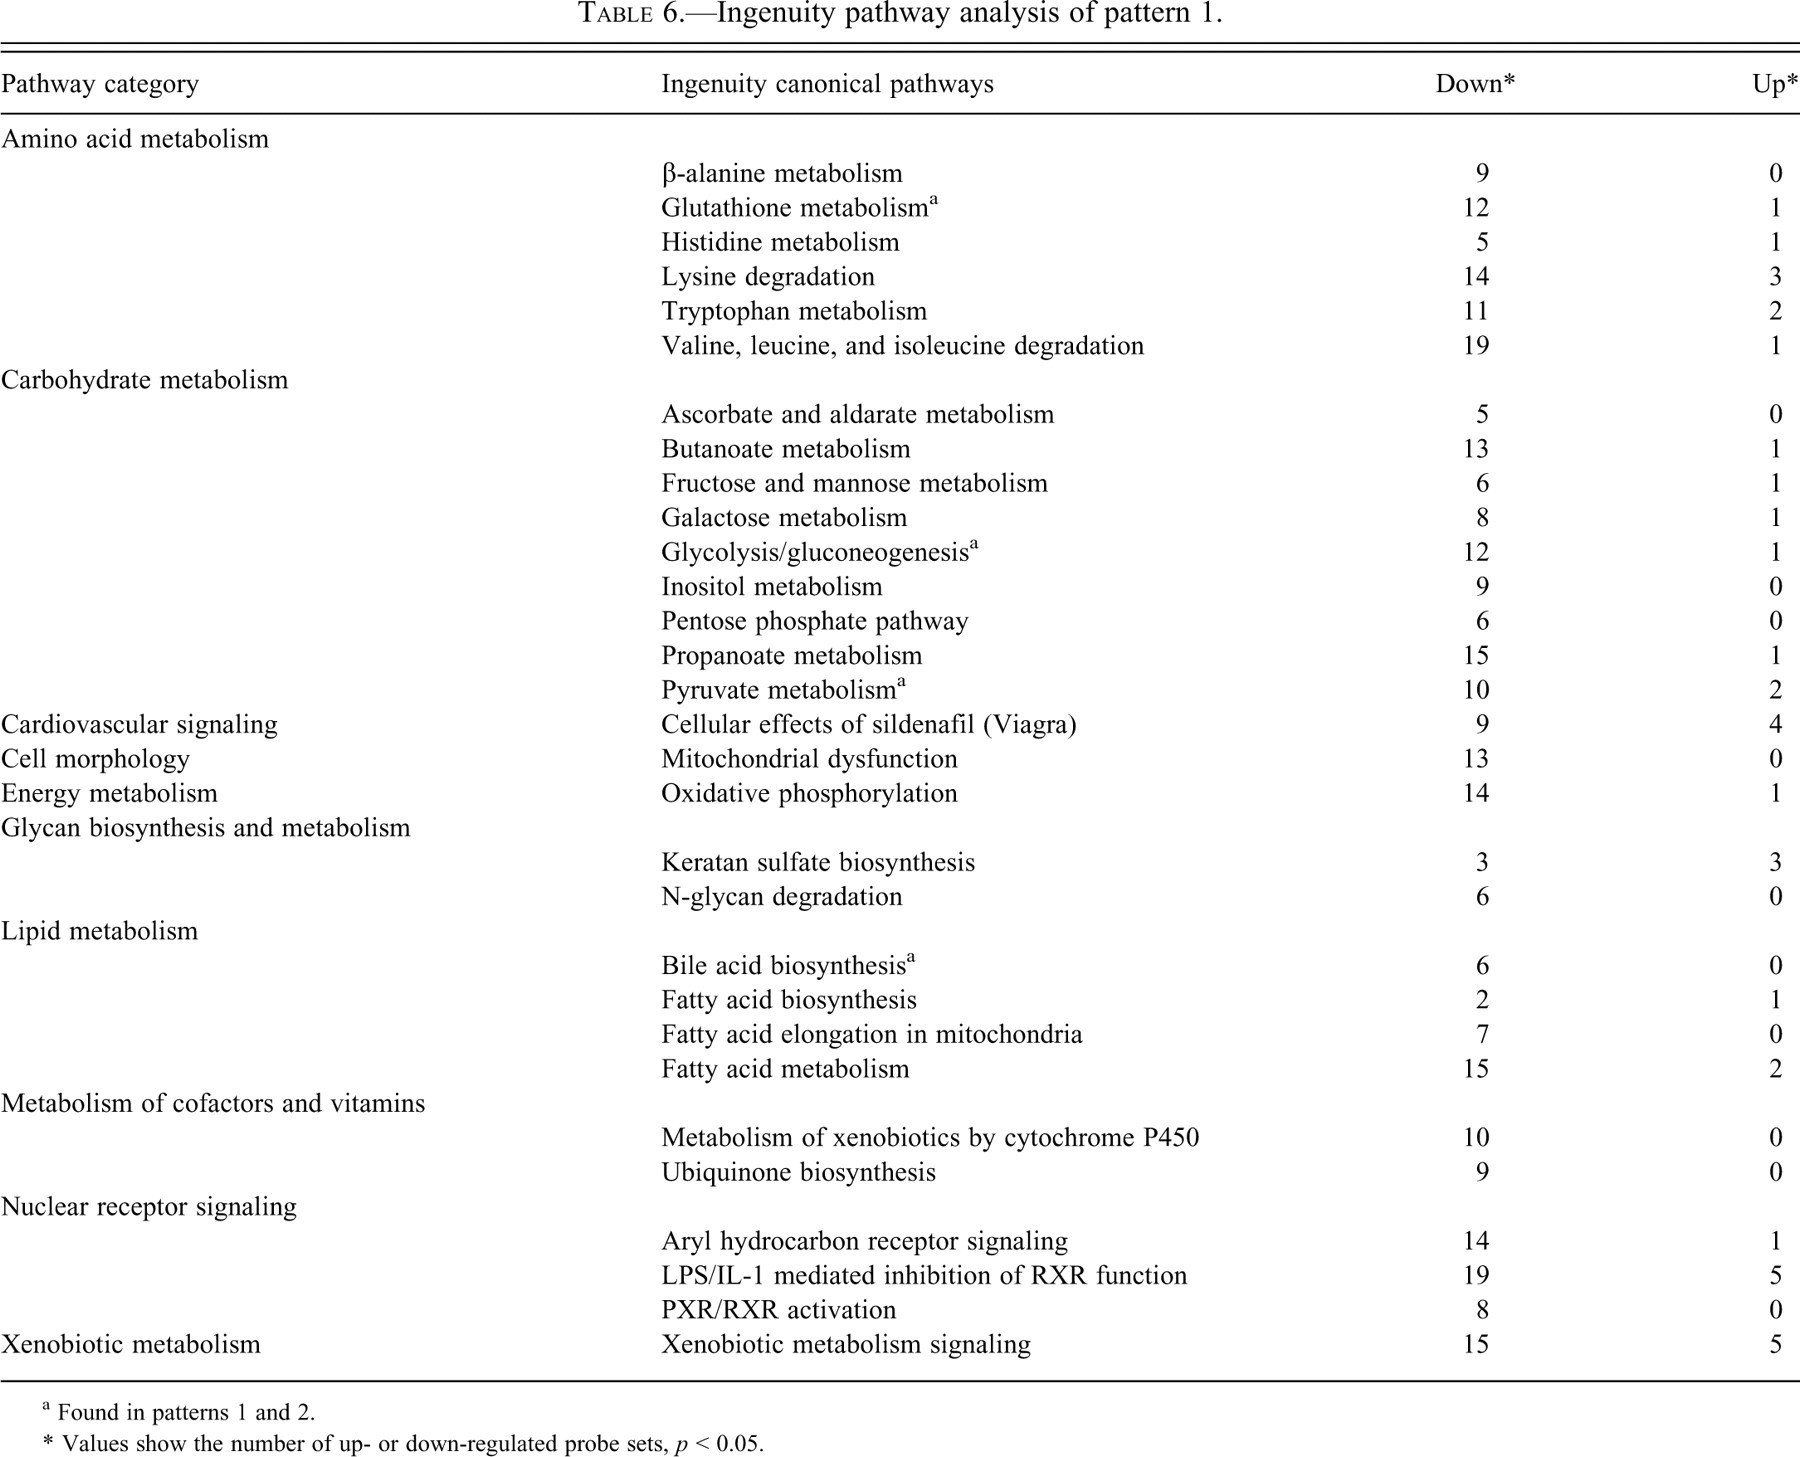
a Found in patterns 1 and 2.
* Values show the number of up- or down-regulated probe sets, p < 0.05.
Ingenuity pathway analysis of pattern 2.
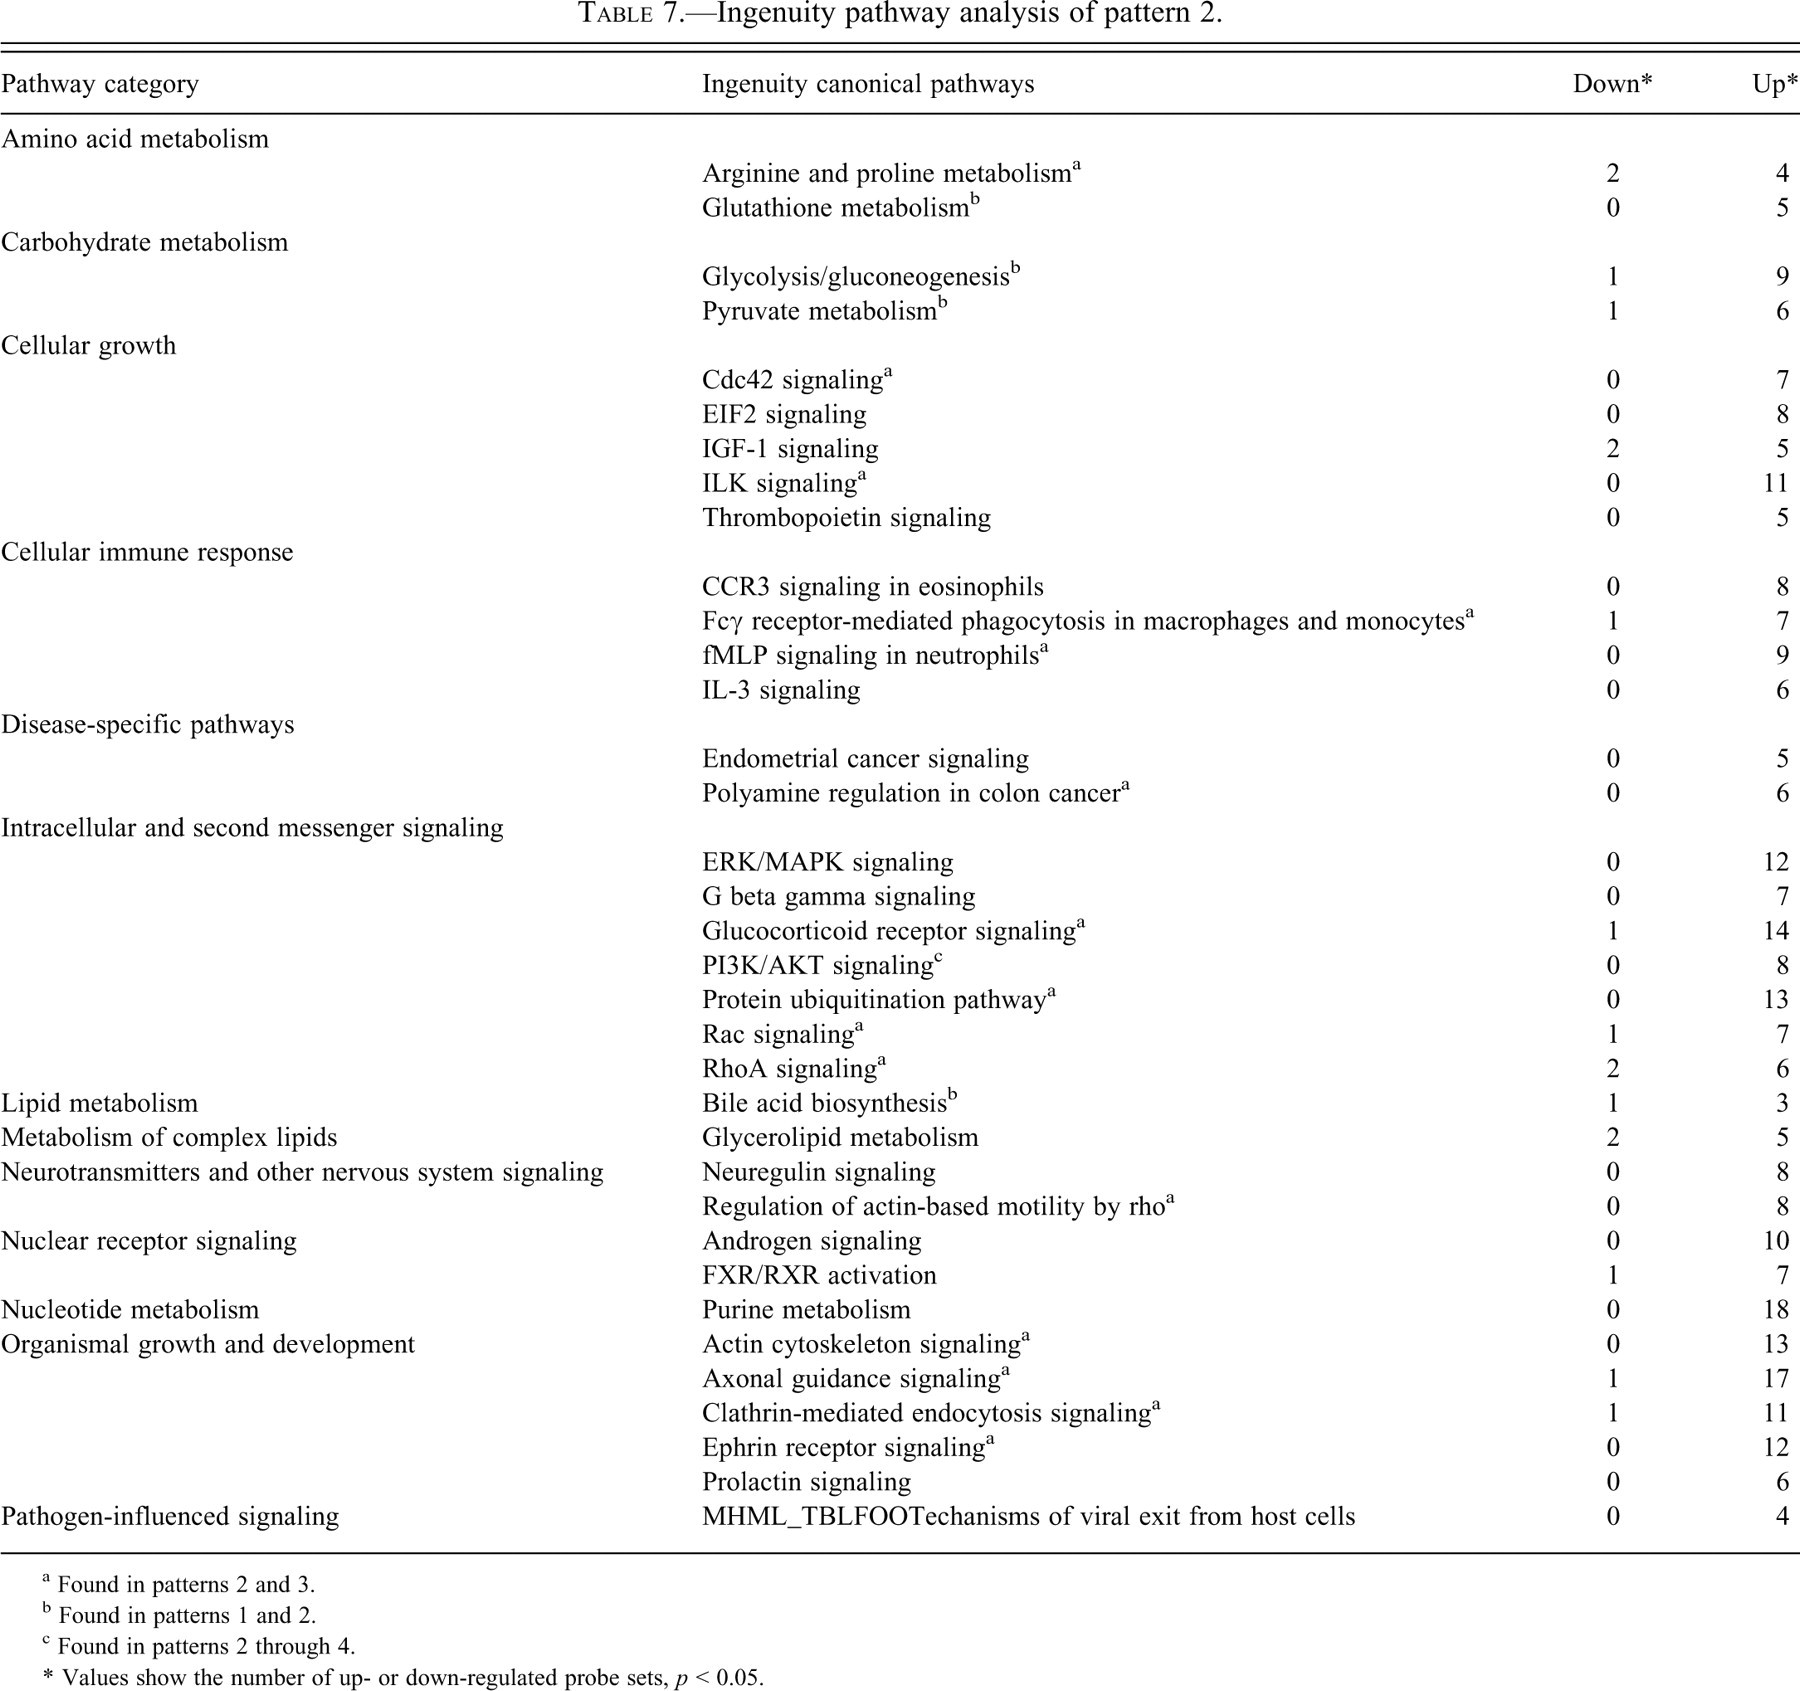
a Found in patterns 2 and 3.
b Found in patterns 1 and 2.
c Found in patterns 2 through 4.
* Values show the number of up- or down-regulated probe sets, p < 0.05.
Ingenuity pathway analysis of pattern 3.
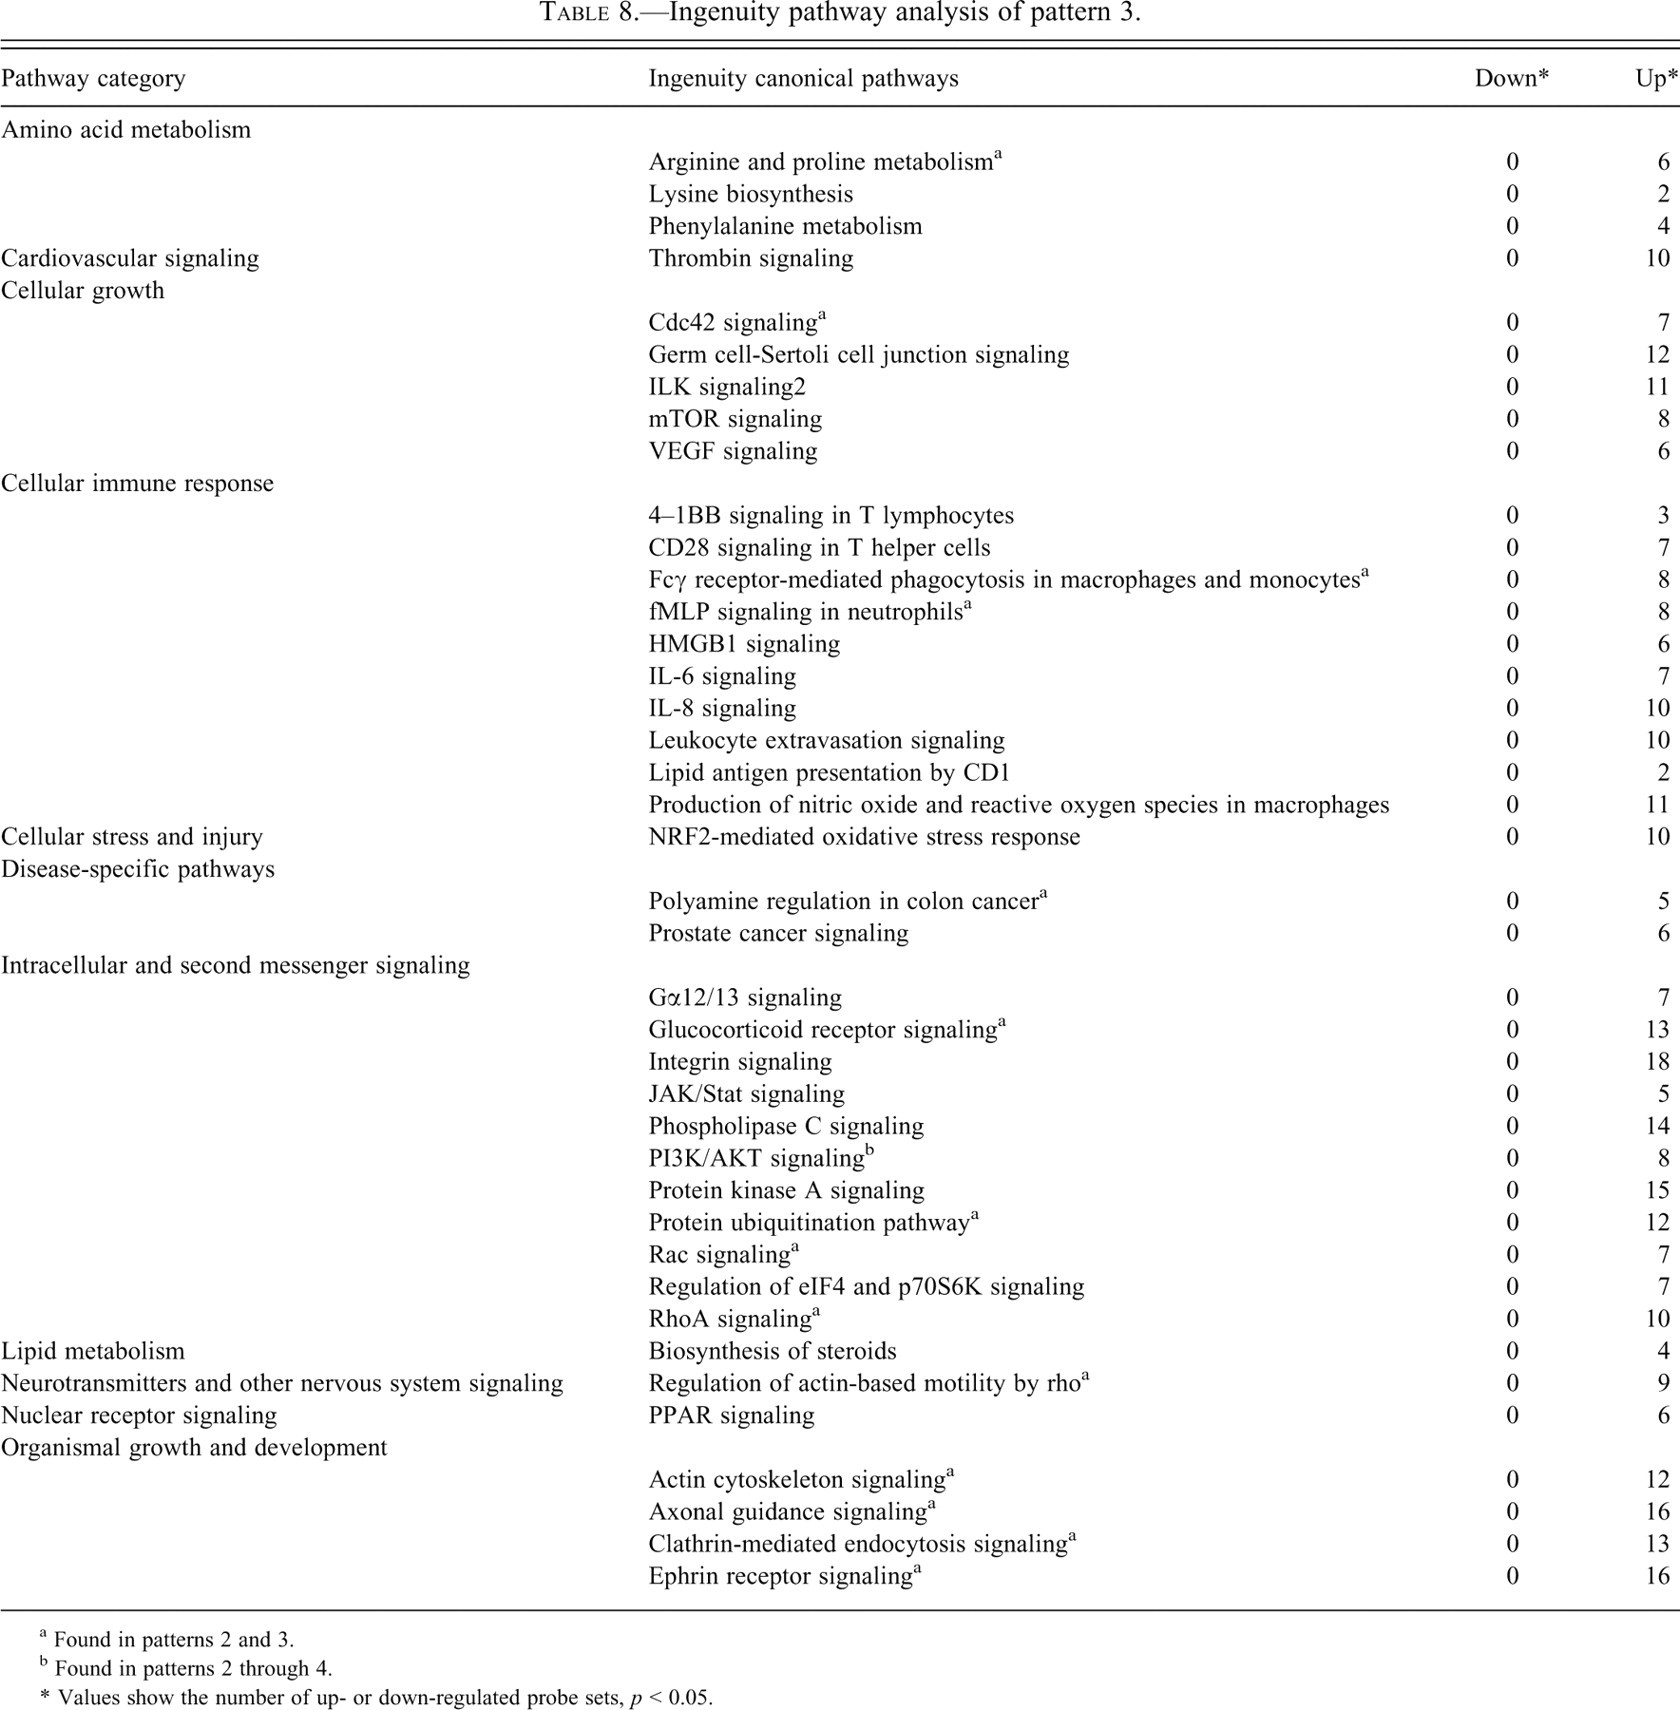
a Found in patterns 2 and 3.
b Found in patterns 2 through 4.
* Values show the number of up- or down-regulated probe sets, p < 0.05.
Ingenuity pathway analysis of pattern 4.
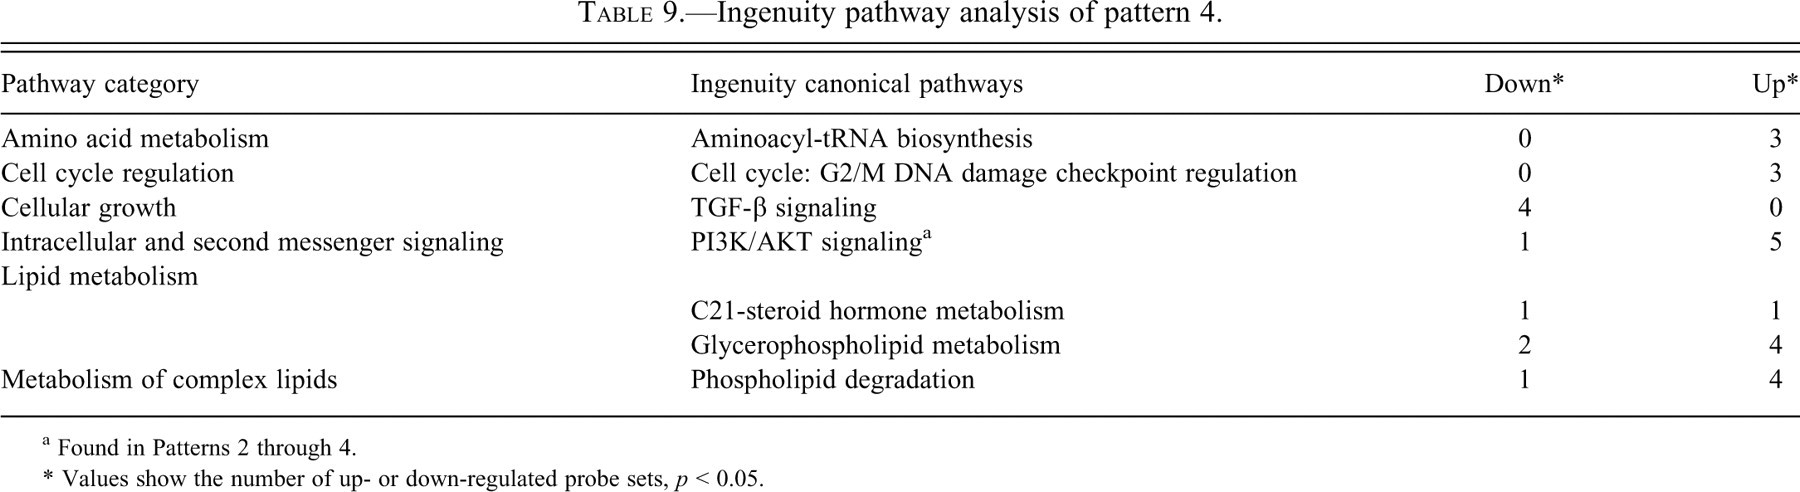
a Found in Patterns 2 through 4.
* Values show the number of up- or down-regulated probe sets, p < 0.05.
Discussion
In this study, we investigated the transitional gene expression profile during ovulation in rats. Ovaries were collected from rats showing normal estrous cyclicity at 10:00 and 22:00 on the proestrus day and 10:00 on the estrus day. Ovarian follicles or early corpora lutea were isolated using LMD, and extracted total RNA was analyzed using microarray technology. Clustering analysis revealed four different expression patterns, and we attempted two approaches for characterizing each pattern: arranging each pattern of up-regulated probe sets in order of ascending fold-up ratio and categorizing probe sets according to the Ingenuity Pathways Analysis.
Gene expression analysis was conducted using high-throughput methods. Rat Genome 230 2.0 Arrays (Affymetrix) contains 31,099 probe sets. A total of 17,407 of these probe sets showed significant changes in our experiment. Four patterns of transitional gene expression were observed in GF-PeF-PoF, with hundreds of probe sets found to be contained in each pattern. Given this large spread, we attempted two methods of characterizing the sets. With one approach, we arranged each pattern of up-regulated probe sets in order of ascending fold-up ratio of PeFs to GFs (Tables 1 and 2, 4, and 5) or PoFs to GFs (Table 3) and examined reports related to the probe sets ranked in the top 15 (Tables 1 and 2) or 10 (Tables 3-5). In the second approach, we categorized probe sets for which PeFs (Tables 1, 4, and 5) or PoFs (Table 3) showed a greater than two-fold significant change compared with GFs, according to the Ingenuity Pathways Analysis (Ingenuity Systems) database. We found that pattern 1 comprised a large proportion of probe sets reported to have roles in preovulatory or postovulatory physiological events (Table 1). Given that up-regulation in pattern 1 was noted after the LH surge and subsequently ceased after ovulation, this occurrence is believed to be natural, and the untitled or functionally unknown probe sets in pattern 1 may include probe sets with as-yet-undefined roles in the ovulatory process (Table 1).
However, only a small number of reports identified probe sets known to have roles in the ovulatory process (follicle rupture and corpora lutea formation) in patterns 2 through 4. Endothelin, which constricts the PeFs and induces follicle rupture, was found to follow pattern 2 (Ko et al. 2006), and a disintegrin and metalloproteinase with thrombospondin motifs, which disintegrate connective tissue adjacent to PeF during follicle rupture (Espey et al. 2000), were found to follow pattern 4. Their roles are related to follicle rupture, but these genes may have roles in corpora lutea formation since they were expressed in a high level even after follicle rupture.
Our pathway analysis found that down-regulated probe sets outnumbered up-regulated sets in all pathways in pattern 1 (Table 6). Many probe sets involved in the ovulatory process are thought to be contained in pattern 1; however, some up-regulation may not have been detected in our study design, which involved sampling every 12 hours. Some probe sets in pattern 1 may have been affected by factors unrelated to the estrous cycle, such as environmental differences between day and night, since GFs and PoFs were collected at 10:00 whereas PeFs were collected at 22:00 (Boden and Kennaway 2006).
On comparing the involved pathways among patterns, we noted overlapping of pathways between patterns 1 and 2 and among patterns 2 through 4. Overlapping pathway categories between patterns 1 and 2 were amino acid metabolism, carbohydrate metabolism, lipid metabolism, and nuclear receptor signaling. Almost all probe sets in these categories were down-regulated in pattern 1, whereas they were up-regulated in pattern 2 (Tables 1-3). Overlapping pathway categories among patterns 2 through 4 were amino acid metabolism, cellular growth, cellular immune response, disease-specific pathways, intracellular and second messenger signaling, neurotransmitters and other nervous system signaling, and organismal growth and development (Tables 7-9). Several similar features were noted among patterns 2 through 4. For example, patterns 2 through 4 all contained largely up-regulated probe sets with expression levels that changed in a similar manner, as with GF < PoF or GF > PoF, unlike the pattern 1, nonshift of GF = PoF. Many up-regulated probe sets in patterns 2 through 4 were thought to be related to corpora lutea formation or function since corpora lutea start to develop soon after follicle rupture, and probe sets in patterns 2 through 4 maintained high expression levels even in PoFs.
Ovulation is a multigene, multistep process, and many different genes and pathways have been reported to perform roles in follicular growth and rupture and corpora lutea formation. Histologically, the diameter of the follicle and the follicular antrum are enlarged as the time of follicle rupture draws near, and solid corpora lutea are formed after ovulation. In the follicular epithelium, vascularization associated with hyperemia is activated, and the production of hyaluronan-rich follicular fluid and prostaglandins increases. The ovarian surface epithelium adjacent to the ovulating follicle is disintegrated by collagenases before follicle rupture. Tissue reconstruction and corpora lutea formation start after follicle rupture early in the morning on the estrus day. This series of processes has been described as similar to an inflammatory response (Richards, Liu, and Shimada 2008). Theca cells, granulosa cells, and luteal cells are lipid metabolism activated and known to be important sources of steroids, which are indispensable for folliculogenesis (Drummond 2006). A number of published reports have examined transitional gene expression profiles during ovulation individually or comprehensively using PCR and GeneChip, and a variety of methods to isolate granulosa cells or theca cells have been presented. Liu, He, and Rosenwaks (2001) isolated preantral follicles mechanically from mice, matured them in vitro, and then isolated total RNA from cultured GF and profiled it by gene chip technology. This may be the first report to apply gene chip technology to evaluate the gene expression profile of preovulatory granulosa cells, but the number of arrayed genes was 588. Jo et al. (2004) isolated granulosa cells using the method of follicular puncture and constructed a rat ovarian gene expression database. In that report, they used immature rats and stimulated them with the injection of gonadotropin to induce ovulation. McRae et al. (2005) used immature mice, applied the follicular puncture method, and constructed a library of serial analysis of gene expression (SAGE). Tamba et al. (2010) applied the same method to wild-type mice and prostaglandin receptor EP2 (Ptger2)–/– mice and compared their gene expression profiles to investigate the role of Ptger2. Fayad et al. (2004) demonstrated the gene expression profile of bovine granulosa cells. As shown above, transitional gene expression profiling during ovulation has been of interest to endocrinologists and reproductive biologists, and follicular puncture methods or in vitro techniques were applied to isolate granulosa cells. However, Jo et al. (2004) suggested that this method is associated with the possibility of contamination of cells from surrounding tissue and suggested the necessity of verification of results in normal-cycling rats. It is difficult to compare our results with the other profiling results precisely because animal species or table format were different among these studies. But some of the probe sets presented as significant in these reports were not detected in our study. This difference may be caused by the choice of animal model and time points. The timing of ovulation is synchronized in immature animals stimulated by gonadotropin injection, whereas an individual difference exists in untreated rats. It is possible to select several time points from the same cell culture in vitro technique, whereas in our method, the number of animals used increased as time points increased. These points seemed to be disadvantages of our method, but to better reflect the physiological condition of animals in the control group in toxicity studies, the animals used in the present study were mature rats, and theca cells and granulosa cells were isolated close to an actual component ratio. The relationship between histological figure and gene expression profile is of interest to toxicologic pathologists. Our method, using LMD, is the solution to this request. Richards and Espey (2006) summarized an ovulation-specific gene and suggested three major problems of experimental design in identifying ovulation-related genes. First, genes have been identified in a variety of animals; second, the number of time points was limited; and third, some work has been conducted in in vitro, single, or mixed cell type. In the presented study, we could organize ovulation-related genes in a chronological order of expression in rats in vivo by the combined use of LMD and GeneChip technologies. LMD would help to isolate a single cell type to solve the third problem in a further study. Richards and Espey (2006) pointed out that 75% of the genes involved in ovulation might remain to be discovered. In the presented study, probe sets for which the function or relationship to the ovulatory process has not been reported were found and showed statistically significant change (Tables 2-5). These data will help to add information and integrate known pathways involved in the ovulatory process by further analysis.
In summary, we profiled transitional gene expression in normal estrous-cycling rats using a combination of LMD and GeneChip analysis. In our clustering analysis, we identified four patterns of transitional gene expression and noted up-regulation of a large proportion of genes reported to have a role in the ovulatory process in pattern 1. Pathway analysis revealed that patterns 2 through 4 mainly included up-regulation of pathways thought to be related to physiological or histological changes, related to corpora lutea formation or function. These data will help us understand the physiology of the ovulatory process and may be useful in assessing ovarian toxicity and its mechanism, such as in studies of chemical-induced ovulatory impairment.
Footnotes
Acknowledgements
The authors declared no potential conflicts of interest with respect to the research, authorship, and/or publication of this article. The authors received no financial support for the research, authorship, and/or publication of this article.
The author(s) declared no potential conflicts of interest with respect to the authorship and/or publication of this article. The author(s) received no financial support for the research and/or authorship of this article.