
Abstract
The molecular mechanisms underlying the development of hepatocellular carcinoma (HCC) are not yet fully understood. Preneoplastic foci of altered hepatocytes regularly precede HCC in various species. The predominant earliest type of foci of altered hepatocytes, the glycogen storage focus (GSF), shows an excess of glycogen (glycogenosis) in the cytoplasm. During progression from GSF to HCC, the stored glycogen is gradually reduced, resulting in complete loss in basophilic HCC. We have previously shown that in N-nitrosomorpholine–induced hepatocarcinogenesis, insulin receptor substrate (IRS-1) is strongly expressed in GSF and reduced during progression to HCC, thus correlating with the glycogen content. In the present study, we observed increased levels of insulin receptor, IGF-I receptor (IGF-IR), IRS-2, and mitogen-activated kinase/extracellular regulated kinase-1 in GSF, following the same pattern of expression as IRS-1. We conclude that the abundance of IRS-1, IRS-2, and mitogen-activated kinase/extracellular regulated kinase-1 coincides with a concerted upregulation of both IR and IGF-IR induced by the hepatocarcinogen. Our data suggest that in early hepatocellular preneoplasia, the upregulation of IR elicits glycogenosis through IRS-1 and/or IRS-2, whereas the increased level of the IGF-IR may lead to the increased cell proliferation previously reported in GSF. Therefore, the concerted upregulation of both IR and IGF-IR may represent initial events in hepatocarcinogenesis.
Keywords
Introduction
Hepatocellular carcinoma (HCC) is the fifth most frequent malignancy worldwide and the third most common cause for cancer mortality (Hsieh et al. 2009). It is usually a slowly developing tumor with long latency that is diagnosed only at an advanced stage. For this reason, it has a very poor prognosis, and most patients die within a year of the onset of symptoms. The available medical interventions include surgical resection, liver transplantation, and local ablation. Hepatocellular carcinoma is refractory to most available chemotherapeutic agents. For patients with locally advanced and/or metastatic disease, no conventional cytotoxic or hormonal systemic therapy has been able to improve patient survival beyond six months (Wörns and Galle 2010). Therefore, it is of utmost importance to better understand the evolution of HCC to improve early detection and prevention.
The risk factors of HCC have been well documented. Besides chemicals and radiation, viral infections with hepatitis B and C viruses (HBV and HCV) are the etiologic factors for about 80% of HCC cases (Llovet and Bruix 2008). Interestingly, patients with type 2 diabetes have a significantly increased risk to develop HCC (reviewed in Vigneri et al. 2009). The molecular mechanisms underlying hepatocarcinogenesis are not yet fully understood. On the cellular level, consistent sequences of morphological and biochemical changes occur in the hepatocytes, which lead to the malignant phenotype (Bannasch et al. 2001). Preneoplastic foci of altered hepatocytes (FAH) have been known as the earliest emerging distinct phenotypic parenchymal changes indicating carcinogenic response in chemical hepatocarcinogenesis (Bannasch 1968). Two main hepatocellular lineages have been distinguished during hepatocarcinogenesis in the rat: the glycogenotic/basophilic and the amphophilic cell lineage (Bannasch, Klimek et al. 1997). The amphophilic cell lineage has been observed mainly after exposure of rats to “nongenotoxic” peroxisome proliferators and will not be discussed in this paper. In the glycogenotic/basophilic sequence of neoplastic development, induced in different species by various oncogenic agents including “genotoxic” chemicals like N-nitrosomorpholine (NNM) used in the present study, the excessively glycogen-storing clear cell foci (CCF), alternatively classified as glycogen storage foci (GSF), gradually develop through intermediate cell foci (ICF) or mixed cell foci (MCF), composed of glycogenotic and basophilic cells, into focal populations exhibiting the poorly differentiated basophilic phenotype (BCF), corresponding to that of poorly differentiated HCC (Bannasch, Klimek et al. 1997).
Evidence of this sequence of cellular changes was originally provided by light- and electron-microscopic studies in rats orally exposed to NNM for lifetime or for limited time periods (stop model) (Bannasch 1968; Bannasch et al. 1980) and has since been substantiated by several additional approaches: A series of morphometric investigations has unanimously shown a dose and time dependence of the sequence, starting with the early emerging small glycogenotic FAH followed by an increase in the number and size of FAH, gradually changing their phenotypes from clear and acidophilic (glycogenotic) to intermediate, mixed, and basophilic cell populations, the development of which significantly correlates with the later appearance of hepatocellular adenomas (HCA) and HCC (Enzmann and Bannasch 1987; Moore et al. 1982; Weber and Bannasch 1994). A number of enzyme and immunohistochemical investigations strongly supported the previous finding of the time-dependent emergence and interdependent progression of the different morphological phenotypes of FAH, HCA, and HCC (Hacker et al. 1982; Nehrbass et al. 1998; for further references see Bannasch, Klimek et al. 1997; Bannasch, Zerban et al. 1997) and indicated a fundamental shift in carbohydrate metabolism during the gradual transition from preneoplastic FAH to hepatocellular neoplasms (reviewed in Bannasch 1996), a notion that was also supported by molecular biological studies in situ (Bannasch 1996; Stumpf and Bannasch 1994) and microbiochemical investigations on laser-dissected FAH, HCA, and HCC (Klimek et al. 1984; for further references see Bannasch, Klimek et al. 1997). Finally, it has been demonstrated by radioautography (using the incorporation of 3H-thymidine as a marker) that an ever increasing cell proliferation accompanies the progression from glycogenotic through mixed cell FAH to HCA and HCC, among which glycogen-poor lesions proliferate much faster than glycogen-rich forms (Zerban et al. 1994). Similar sequential cellular changes during hepatocarcinogenesis were observed not only in rats and additional species, including nonhuman primates after application of other chemicals (reviewed in Bannasch et al. 1980), but also in rats experimentally exposed to local intrahepatic hyperinsulinemia (Dombrowski et al. 1997), in some transgenic mouse models of hepatocarcinogenesis (Kim et al. 1991; Toshkov et al. 1994), and in hepadnaviral hepatocarcinogenesis in woodchucks (Radaeva et al. 2000). There is also circumstantial evidence for such a sequence of cellular changes in human hepatocarcinogenesis (for literature see Bannasch et al. 2001). Clear and acidophilic (glycogenotic) FAH as well as MCF, and in rare cases HCA and HCC indistinguishable from those developing after treatment with NNM, may also emerge in untreated control animals with increasing age and appear frequently in certain strains of animals that “spontaneously” develop a high incidence of HCA and HCC (reviewed in Bannasch, Zerban et al. 1997).
Excessive glycogen storage and related metabolic aberrations in preneoplastic GSFs have been suggested to result from an insulin-like effect of hepatocarcinogenic agents (Bannasch, Klimek et al. 1997; Bannasch et al. 2001). Dysregulation of the insulin– and insulin-like growth factor (IGF)–activated signaling pathways have also been implicated in the progression of HCC (Scharf et al. 2001). The insulin/IGF system includes three ligands (insulin, IGF-I, and IGF-II) and at least four receptors (insulin receptor, which exists in two subtypes IR-A and IR-B [Belfiore et al. 2009]; IGF-I receptor; IGF-II receptor; and the hybrid IR/IGF-IR). Whereas insulin binds preferentially to the insulin receptor (IR), IGF-I binds mainly to the IGF-IR and the hybrid receptor (Zhang et al. 2010). Insulin-like growth factor-II binds to the IGF receptors and IR-A. Insulin-like growth factor-IR, IR, and the hybrid receptor share similar downstream signaling adaptor molecules, such as insulin receptor substrate (IRS-1) and IRS-2. Signaling pathways activated by these receptors are the phosphatidylinositol 3-kinase (PI 3-kinase)/Akt and Ras/MEK/ERK pathways (Kaburagi et al. 1999; White 2002). In adult hepatocytes, IRS-2 is reported to be the main effector of the metabolic and proliferative signals triggered by IR, whereas IRS-1 mediates the mitogenic effects of IGF-IR (Kido et al. 2000; Valverde et al. 2003).
Dysregulation of the IGF axis is associated with the development of a large spectrum of malignancies including Wilm’s tumor, brain tumors, and breast, prostate, thyroid, lung, colon, and liver cancer (Bentov et al. 2003; Breuhahn et al. 2006; Khandwala et al. 2000; Liao et al. 2005; Samani et al. 2007; Scharf et al. 2000; Schnarr et al. 2000; Yu and Rohan 2000). Although IGF-IR has been clearly documented to play a critical role in neoplastic cell transformation (Baserga 2009; Gualberto and Pollak 2009, and references therein), relatively few studies describe the involvement of insulin and IR in cancer (reviewed in Frasca et al. 2008; Pollak 2008). Dombrowski et al. (1997) described an endocrine model of hepatocarcinogenesis, in which transplantation of low numbers of pancreatic islets into the livers of diabetic rats led to the development of HCC. This process was coupled with an increase in the expression of IR, IRS-1, Raf-1, and mitogen-activated kinase/extracellular regulated kinase (MEK-1) proteins in FAH and in hepatocellular neoplasms as compared with normal liver (Evert et al. 2004). Although this model involves the direct, local hypersecretion of pancreatic islet hormones in the liver, we have previously shown using a different straightforward murine model that IRS-1 is strongly expressed in GSF, MCF, and ICF induced with NNM (Nehrbass et al. 1998). Since only cells storing excessive amounts of glycogen, but not glycogen-poor basophilic cells, show abundant IRS-1, preneoplastic hepatic glycogenosis has been associated with IRS-1 overexpression (Nehrbass et al. 1998). Furthermore, IRS-1 has been shown to play an essential role in transformation and is considered a biomarker for cancers susceptible to IGF-IR targeting (Baserga 2009).
The aim of the present study was to further analyze the patterns of IR and IGF-IR and related signaling molecules such as IRS-2 and MEK-1 in different stages of NNM-induced hepatocarcinogenesis in the rat and to correlate the protein levels with different stages of tumor progression. Using immunohistochemistry, we identified upregulation of the IR/IGF-IR pathways as the earliest molecular events in NNM-induced hepatocarcinogenesis.
Materials and Methods
Animals and Tissue Sampling and Processing
Adult male Sprague-Dawley rats weighing approximately 200 g at the beginning of the experiment were obtained from the Zentralinstitut für Versuchstierzucht (Hannover, Germany) and kept on Altromin standard diet (Altromin, Lage/Lippe, Germany) and water ad libitum at 22°C (room temperature), 50% ± 10% humidity, and twelve-hour light/dark cycle. Foci of altered hepatocytes, HCA, and HCC were induced by limited exposure (stop model) to NNM at dose levels of 12 mg/kg body weight (b.w.)/day or 24 mg/kg b.w./day in the drinking water as described previously in detail (Nehrbass et al. 1998; Weber and Bannasch 1994). Between fifteen and twenty-six weeks after stopping NNM treatment, the animals were sacrificed under light ether anesthesia between 9 and 11 a.m. The livers were immediately excised, and tissue slices were snap-frozen at −150°C and stored at −80°C. Liver tissue from ten animals at the lower dose level of NNM and tissue from eleven rats at the higher dose level were analyzed as summarized in Table 1 . Liver tissue from ten concurrent untreated animals was used for control. Six-micrometer serial cryostat sections were stained with hematoxylin and eosin (H&E) or treated with periodic acid–Schiff reaction (PAS) for the demonstration of glycogen and counterstained with toluidine blue. Additional serial sections were used for immunohistochemistry (see below).
Experimental design and number of animals used in the present study to induce preneoplastic and neoplastic liver lesions in rats by limited exposure (stop model) to NNM.
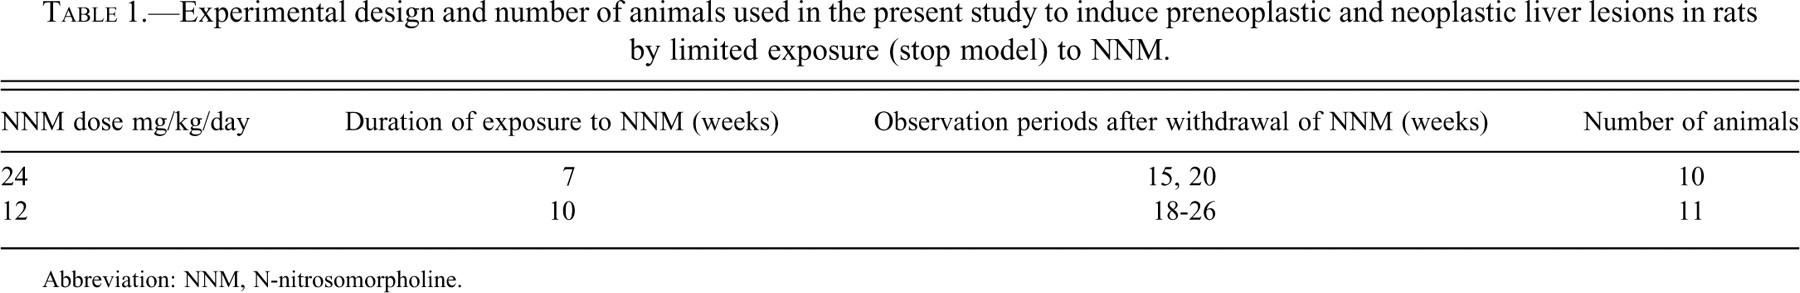
Abbreviation: NNM, N-nitrosomorpholine.
Foci of altered hepatocytes, HCA, and HCC were histopathologically classified according to Bannasch, Zerban et al. (1997). This classification largely corresponds to the nomenclature of liver lesions proposed by Goodman et al. (1994), which is applicable to H&E–stained paraffin sections but is not appropriate for frozen sections because it is difficult to identify the “clear and acidophilic (eosinophilic) cells” frequently seen in FAH appearing in H&E–stained paraffin sections (after elution of the glycogen by the tissue preparation). In contrast, these types of altered hepatocytes are clearly shown in frozen sections by the PAS reaction, which verifies the excessive storage of glycogen. Therefore, the respective type of FAH has been classified as glycogen storage focus (GSF). Only exceptionally has the term clear cell focus (CCF) been used for the same type of lesion when only H&E–stained frozen sections were available for comparison with certain immunohistochemical reactions. In addition, the classification introduced by Goodman et al. (1994) is less detailed than that proposed by Bannasch, Klimek et al. (1997) and does not include the intermediate cell focus (ICF), which is a frequently appearing entity in the glycogenotic/basophilic preneoplastic cell lineage. Housing and treatment of all animals conformed to the guidelines of animal experiments of the German Cancer Research Center and the German animal protection law.
Immunohistochemistry
For immunohistochemical analysis of the IR β subunit, IGF-IR α and β subunits, IRS-1, IRS-2, and MEK-1, 6-µm cryostat sections were mounted on poly-
Results
Foci of altered hepatocytes, HCA, and HCC induced by NNM in rats showed distinct patterns of components of the IR and IGF-IR signaling pathways. The results from the immunohistochemical reactions and from PAS and H&E staining of liver sections from untreated and NNM-treated rats are summarized in Tables 2 and 3, and in Figures 1 through 11 and supplementary Figure S1 (a supplemental appendix to this article is published electronically only at http://tpx.sagepub.com/supplemental).
Immunohistochemical staining of IR, IGF-IR, and MEK-1 in liver tissue from ten untreated control rats.
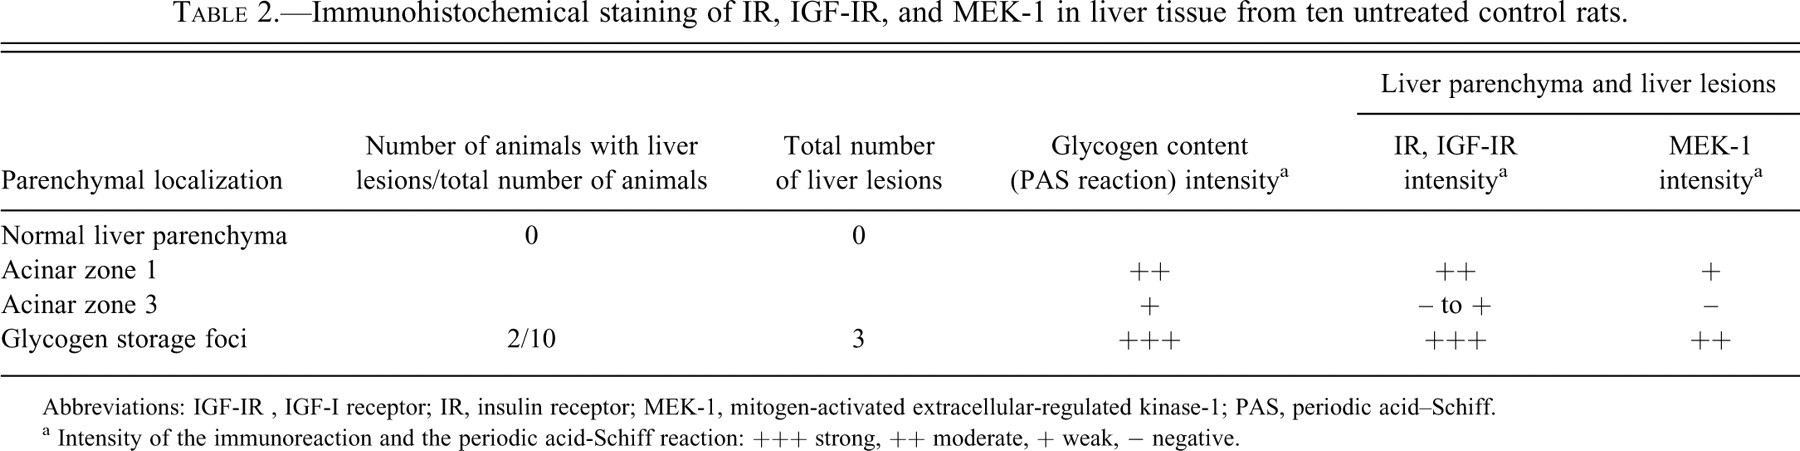
Abbreviations: IGF-IR , IGF-I receptor; IR, insulin receptor; MEK-1, mitogen-activated extracellular-regulated kinase-1; PAS, periodic acid–Schiff.
a Intensity of the immunoreaction and the periodic acid-Schiff reaction: +++ strong, ++ moderate, + weak, − negative.
Immunohistochemical staining of IR, IGF-IR, and MEK-1 in preneoplastic and neoplastic liver lesions induced in rats with N-nitrosomorpholine.
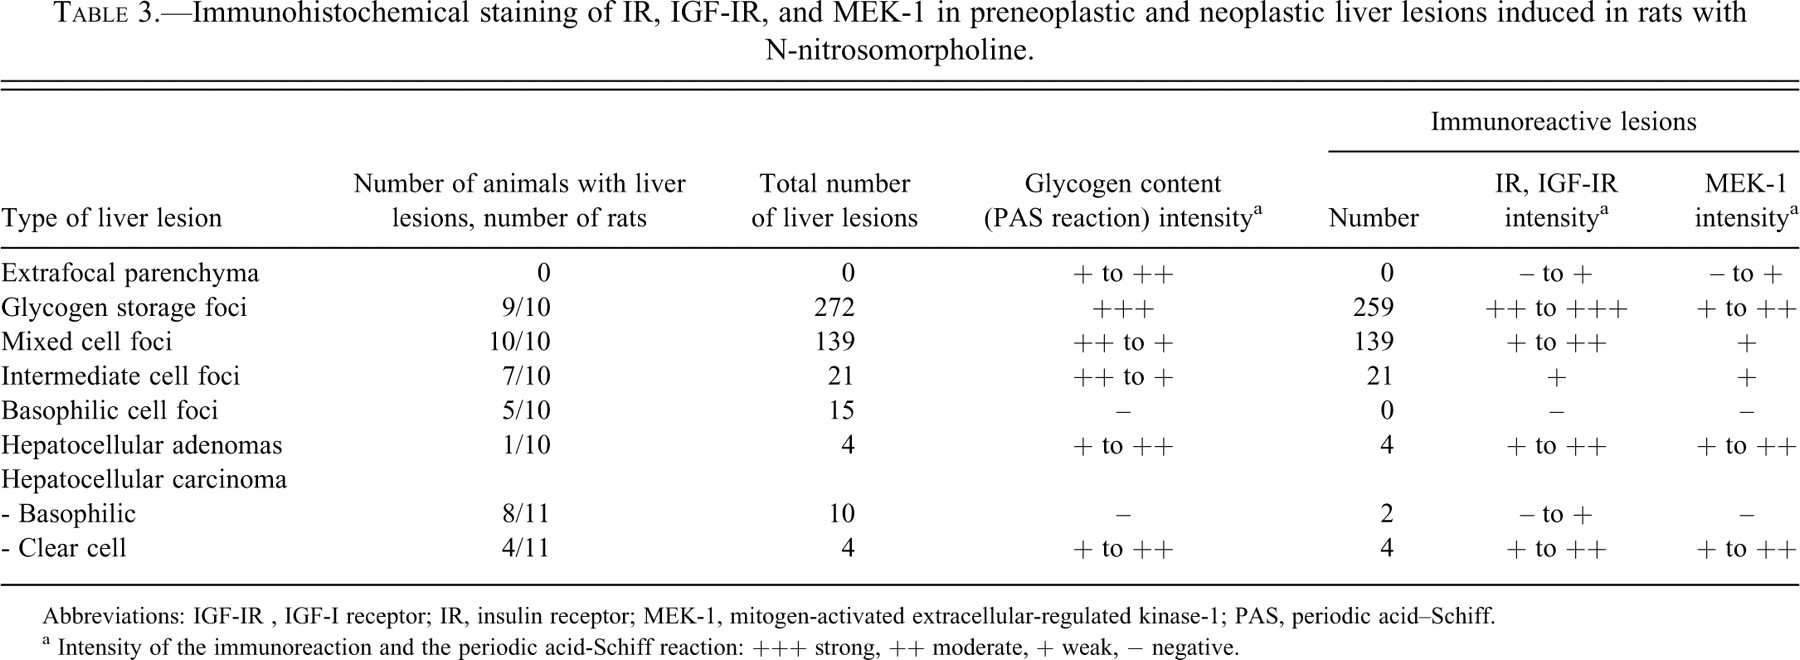
Abbreviations: IGF-IR , IGF-I receptor; IR, insulin receptor; MEK-1, mitogen-activated extracellular-regulated kinase-1; PAS, periodic acid–Schiff.
a Intensity of the immunoreaction and the periodic acid-Schiff reaction: +++ strong, ++ moderate, + weak, − negative.
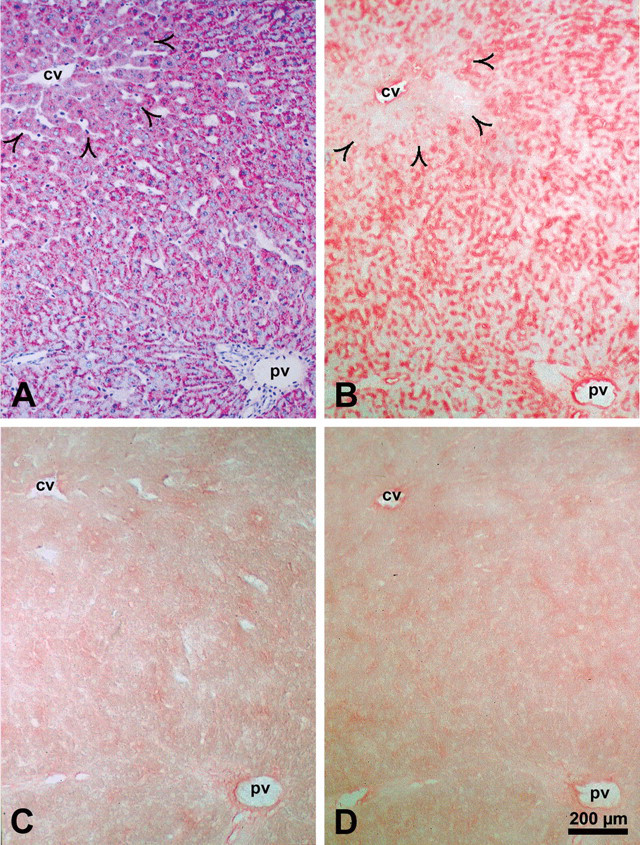
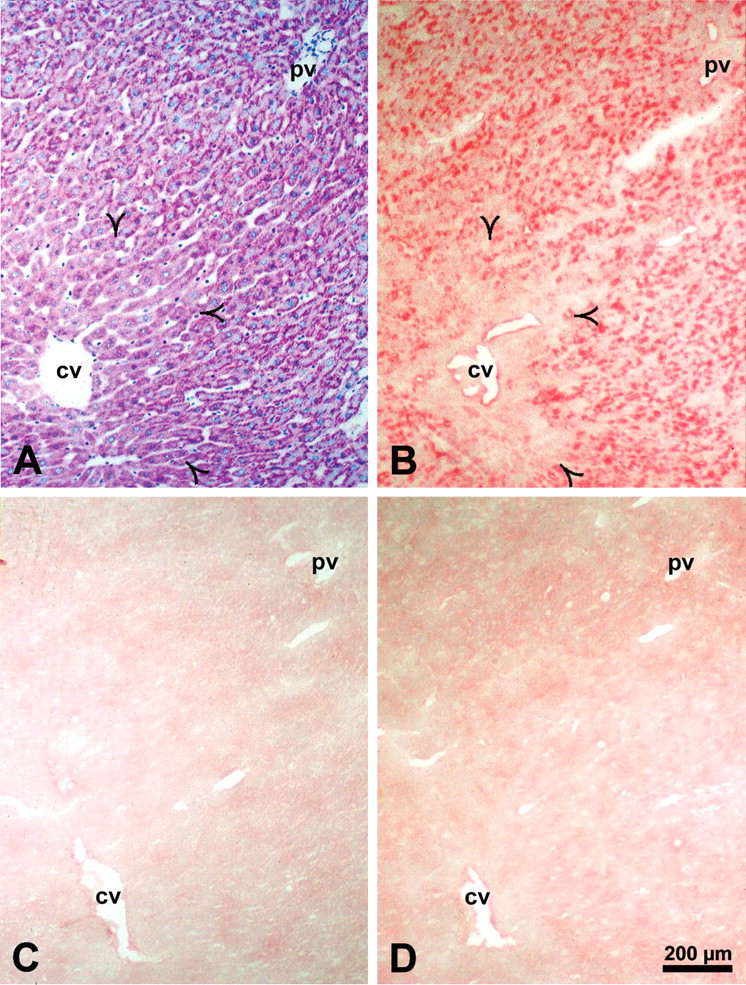
Correlation of glycogen content demonstrated by the periodic acid–Schiff reaction (A) with the protein level of the insulin receptor detected in a serial cryosection with an antibody against insulin receptor β subunit (B) in normal rat liver. The specificity of the immunoreaction (alkaline phosphatase–anti-alkaline phosphatase method) was verified by substitution (C) and liquid adsorption control (D) in serial cryostat sections. Insulin receptor is localized at the plasma membrane in zone 1 and zone 2 of the liver acinus but shows no signal in zone 3 (open arrowheads). Insulin receptor protein level correlates with the glycogen content of hepatocytes. Abbreviations: cv, central vein; pv, portal vein.
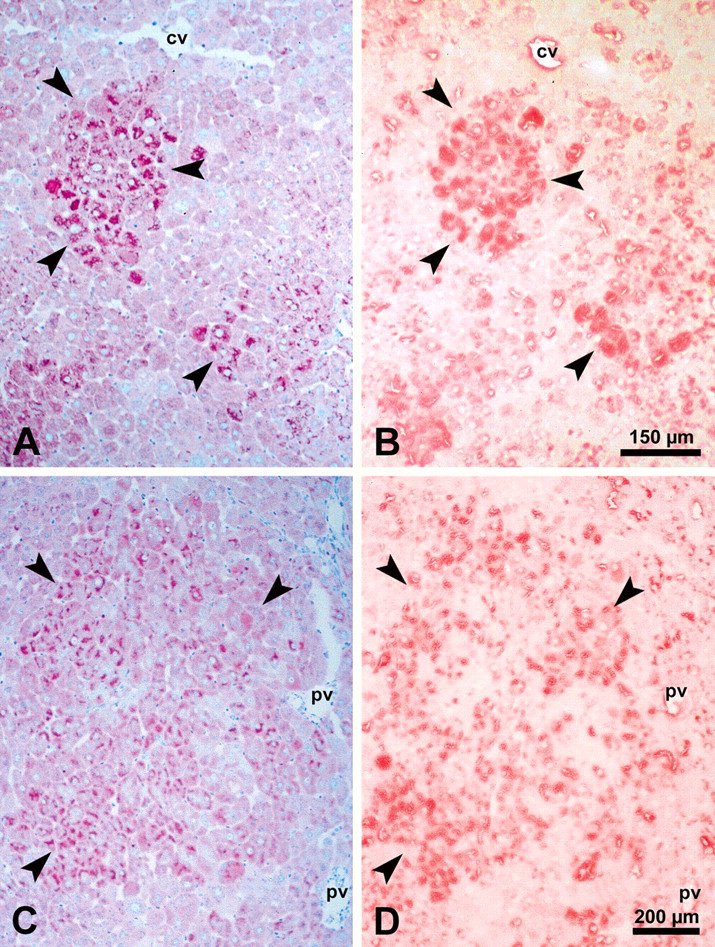
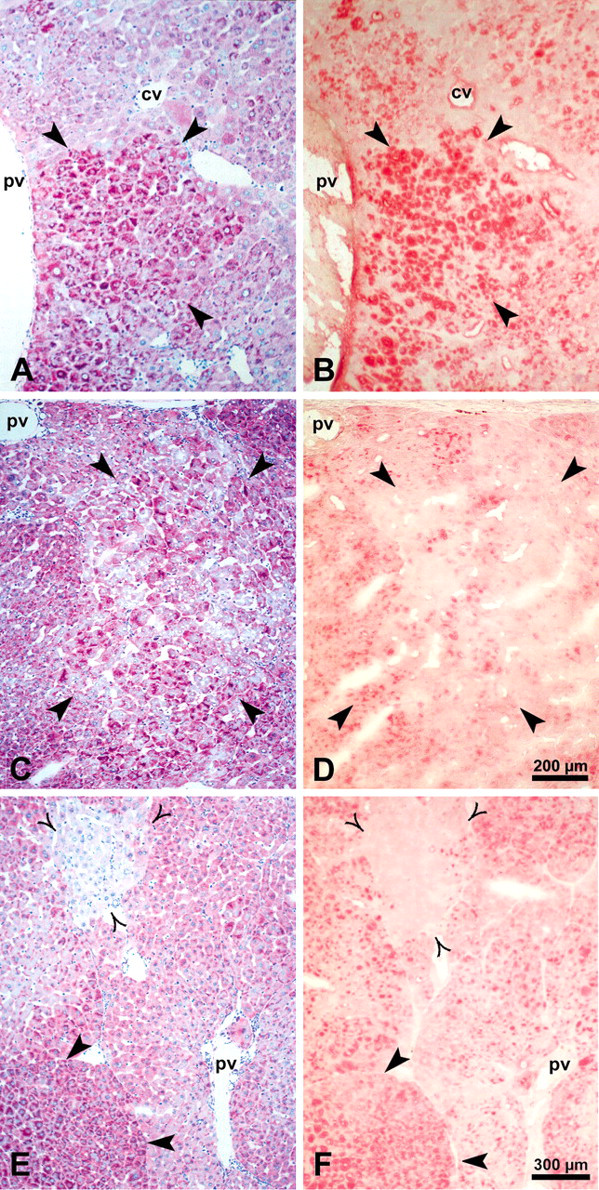
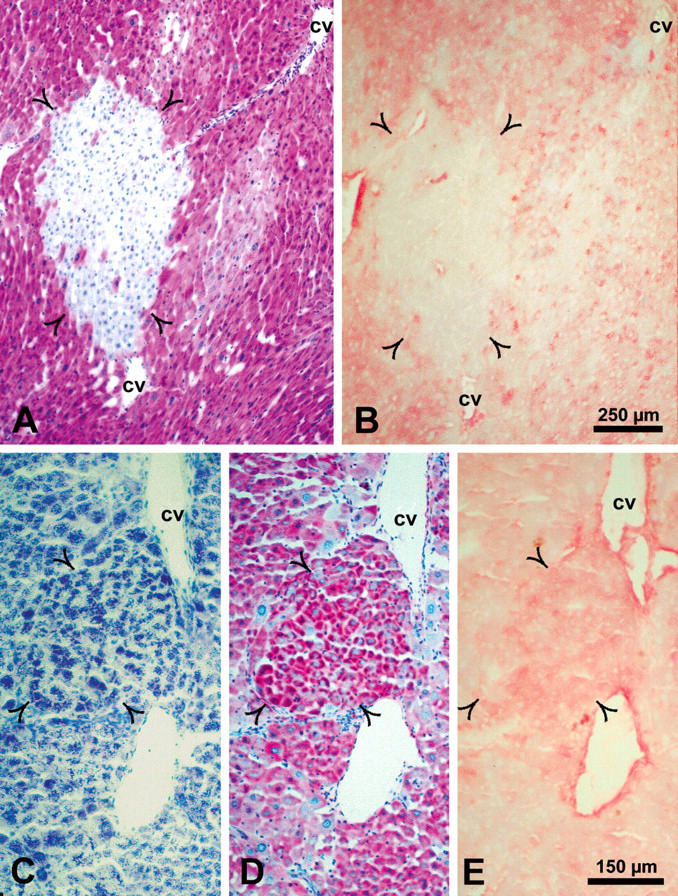
Correlation of glycogen content demonstrated by the periodic acid–Schiff reaction (A, C) with the insulin receptor protein level detected with an antibody against insulin receptor β subunit (B, D) in a glycogen storage focus (A, B) and a mixed cell focus (C, D). Insulin receptor is strongly increased in glycogen-rich cells of glycogen storage foci and mixed cell foci. Abbreviations: cv, central vein; pv, portal vein.
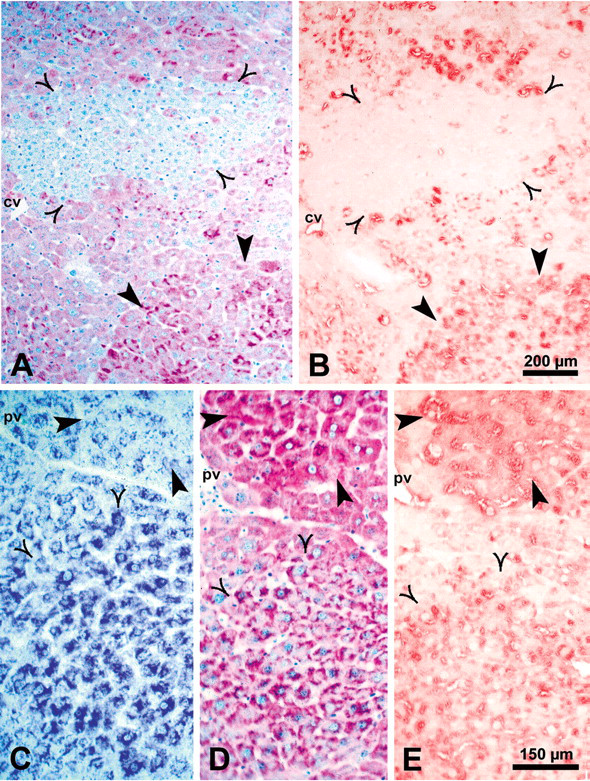
Correlation of glycogen content demonstrated by the periodic acid–Schiff reaction (A, D) with the insulin receptor protein level detected with an antibody against insulin receptor β subunit (B, E) in a basophilic cell focus (A, B, open arrowheads) and an intermediate cell focus (D, C, E, open arrowheads; C shows a toluidine-blue–stained section). Thick arrowheads in A and B point to a mixed cell focus, and in C, D, and E to a glycogen storage focus. Abbreviations: cv, central vein; pv, portal vein.
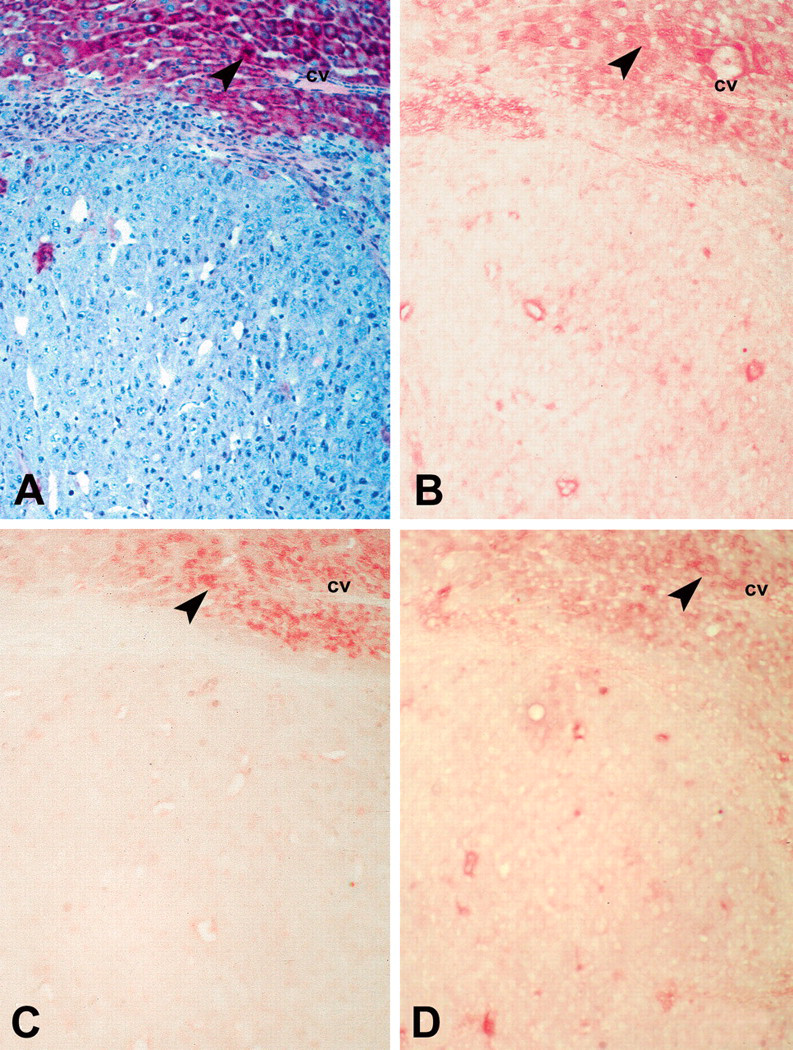
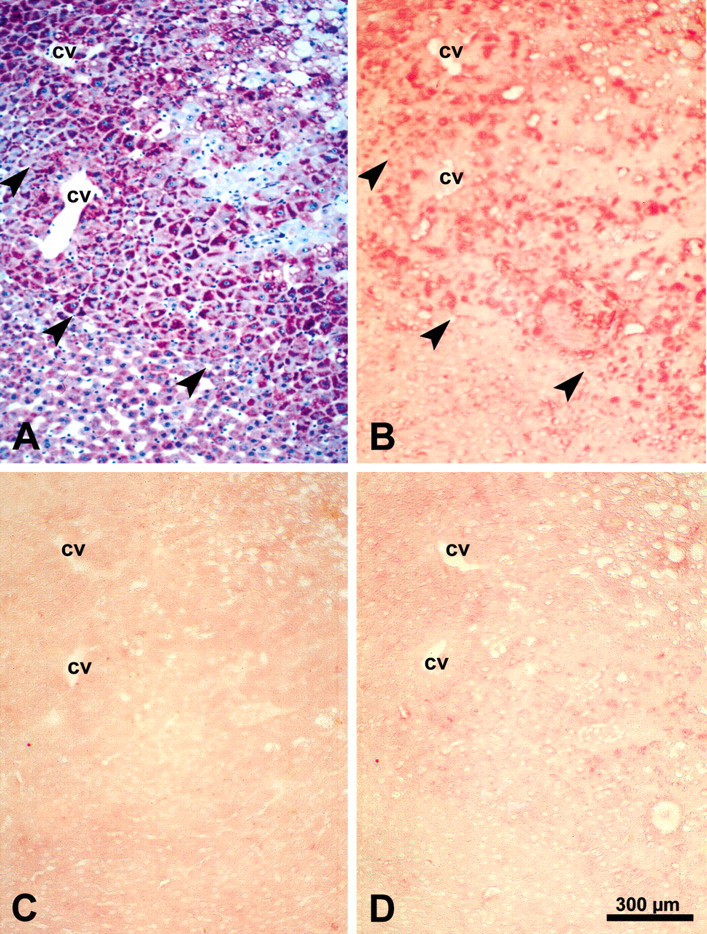
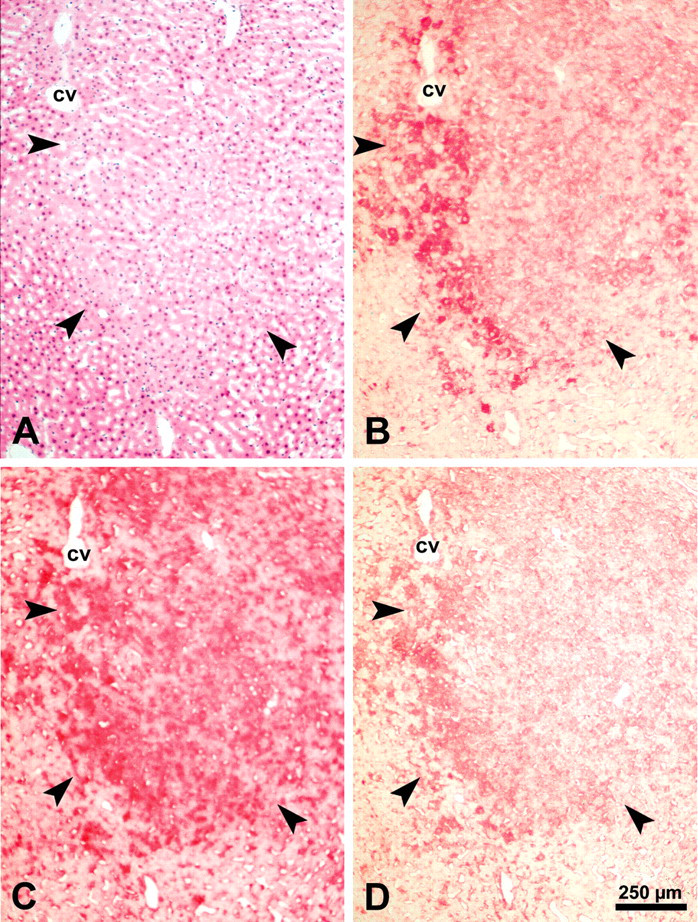
Dedifferentiated glycogen-poor basophilic hepatocellular carcinoma. Serial sections were stained with the periodic acid–Schiff reaction (A) or with antibodies against insulin receptor β (B), type 1 insulin-like growth factor receptor β (C), and mitogen-activated kinase/extracellular regulated kinase-1 (D). The three proteins show pronounced reduction in the hepatocellular carcinoma compared to adjacent tissue (arrowheads). Abbreviation: cv, central vein.
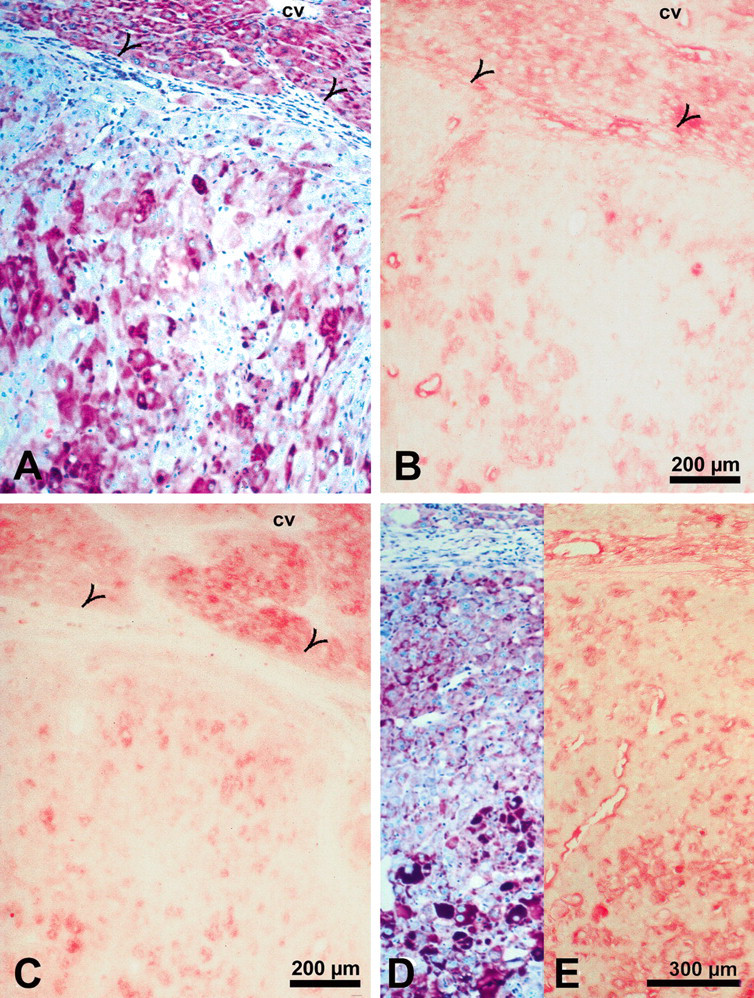
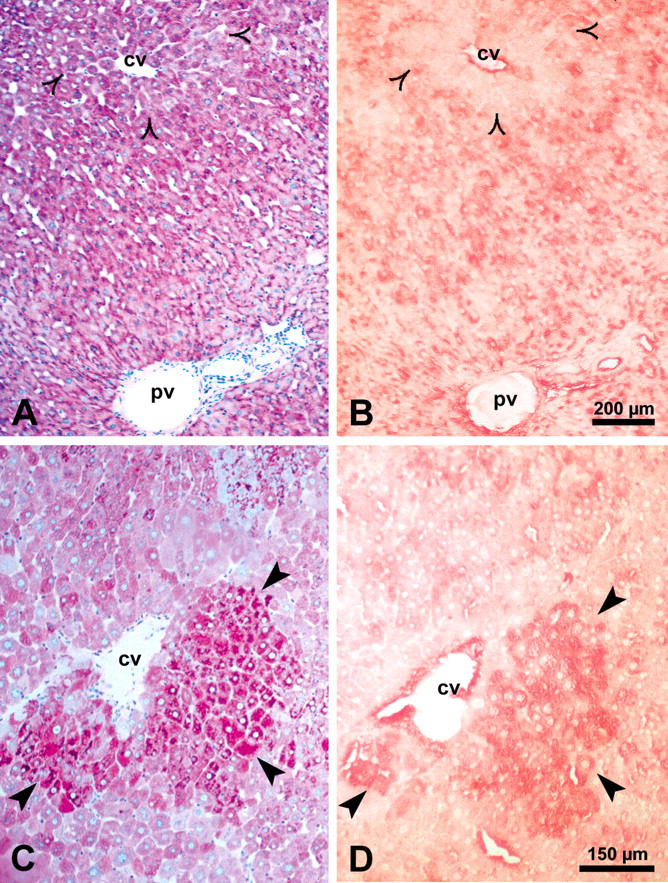
Well-differentiated glycogen-rich hepatocellular carcinoma. Sections stained with periodic acid–Schiff reagent (A, D) demonstrate glycogen-rich cells in two different areas of the same hepatocellular carcinoma. Insulin receptor (B), type 1 insulin-like growth factor receptor (C), and mitogen-activated kinase/extracellular regulated kinase-1 (E), detected by immunohistochemical staining in serial sections to A and D, respectively, are clearly visible in the glycogen-rich but not in glycogen-poor cells. Open arrowheads in A, B, and C indicate tumor margin. Abbreviation: cv, central vein.
Correlation of glycogen content demonstrated by the periodic acid–Schiff reaction (A) with the protein level of the type 1 insulin-like growth factor receptor detected in a serial section with an antibody against type 1 insulin-like growth factor receptor β subunit (B) in normal rat liver. The specificity of the immunoreaction (alkaline phosphatase–anti-alkaline phosphatase method) was verified by substitution (C) and liquid adsorption control (D) in serial cryostat sections. Type 1 insulin-like growth factor receptor is localized at the plasma membrane in zone 1 and zone 2 of the liver acinus but shows no signal in zone 3 (open arrowheads). Type 1 insulin-like growth factor receptor protein level correlates with the glycogen content of hepatocytes. Abbreviations: cv, central vein; pv, portal vein.
Correlation of glycogen content demonstrated by the periodic acid–Schiff reaction (A, C, E) with the type 1 insulin-like growth factor receptor protein level (B, D, F) detected with an antibody against type 1 insulin-like growth factor receptor β subunit in foci of altered hepatocytes. Glycogen storage focus (A, B) and mixed cell focus (MCF) (C, D) are depicted by thick arrowheads, and basophilic cell focus (E, F) is depicted by open arrowheads. Thick arrowheads in E and F point to an MCF. Type 1 insulin-like growth factor receptor is strongly increased in the glycogen-rich cells of glycogen storage focus (B) and MCF (D) but not detectable in glycogen-poor cells of MCF and basophilic cell foci. Abbreviations: cv, central vein; pv, portal vein.
Correlation of glycogen content demonstrated by the periodic acid–Schiff reaction and mitogen-activated kinase/extracellular regulated kinase-1 (MEK-1) protein level detected by immunohistochemical staining in serial sections of normal rat liver (A, B) and a glycogen storage focus (C, D). The MEK-1 signal is weak in normal liver; the reaction product is localized in the cytoplasm in zone 1 and zone 2 but is almost undetectable in zone 3 (open arrowheads). In glycogen storage foci (C, thick arrowheads), the MEK-1 protein level (D) is increased compared to adjacent tissue. Abbreviations: cv, central vein; pv, portal vein.
Correlation of glycogen content demonstrated by the periodic acid–Schiff reaction and mitogen-activated kinase/extracellular regulated kinase-1 protein level detected by immunohistochemical staining in serial sections of a mixed cell focus. The specificity of the immunoreaction (alkaline phosphatase–anti-alkaline phosphatase method) was verified by substitution (C) and liquid adsorption control (D) in serial cryostat sections. In the mixed cell focus (B, thick arrowheads), the mitogen-activated kinase/extracellular regulated kinase-1 level is increased in glycogen-rich cells. Abbreviation: cv, central vein.
Correlation of glycogen content demonstrated by the periodic acid–Schiff reaction with the mitogen-activated kinase/extracellular regulated kinase-1 protein level in a basophilic cell focus (A, B) and an intermediate cell focus (C [toluidine blue stained cryosection], D, E). Mitogen-activated kinase/extracellular regulated kinase-1 was not detected in the basophilic cell foci (B, open arrowheads) and weak in the intermediate cell foci (E, open arrowheads). Abbreviation: cv, central vein.
Immunohistochemical analysis of the insulin receptor substrate-2 protein level in a clear cell focus (CCF, corresponding to glycogen storage focus). The CCF is delineated with thick arrowheads in an H&E–stained cryosection (A). Insulin receptor substrate-2 is markedly increased in the CCF (B, thick arrowheads). Insulin receptor substrate-1 (C) and mitogen-activated kinase/extracellular regulated kinase-1 (D) staining is shown in serial sections. Abbreviation: cv, central vein.
Glycogen Content of NNM-induced FAH, HCA, and HCC (Tables 2 and 3)
Foci of altered hepatocytes identified were mainly GSF (n = 272), the most common early FAH appearing in the rat under the chosen experimental conditions. The GSF showed extensive glycogen storage (PAS positive; Figure 2A) and appeared as CCF in H&E–stained sections (Figure 11A). The MCF (n = 139) were composed of a heterogeneous population of cells storing glycogen in excess, glycogen-poor basophilic cells, and various intermediate cell types with mixed cytoplasm (Figure 2C). In contrast, ICF (n = 21) showed a rather homogeneous population of intermediate cells, the cytoplasm of which is partly glycogenotic and partly basophilic (Figure 3D). The glycogen appears in a pronounced patchy pattern. The glycogen content of these foci may look almost normal, but it may also be increased or decreased. The BCF were rare (n = 15) and were characterized by a PAS–negative cytoplasm owing to the loss of glycogen and an increase in basophilia (representing the increased number of ribosomes; Bannasch 1968; Figure 3A). The HCA (n = 4) were clearly demarcated, compressed the surrounding parenchyma, and were composed of glycogen-rich and glycogen-poor cells. Hepatocellular carcinomas (n = 14) were classified according to their glycogen content and their morphology into glycogen-poor, poorly differentiated HCCs (n = 10; Figure 4A) and glycogen-rich, well-differentiated HCCs (n = 4; Figures 5A and 5D). In two of ten untreated control animals, a few GSF appeared. None of the control animals developed HCA or HCC.
Insulin Receptor
Localization and Zonal Distribution of IR in Normal Liver Tissue (Table 2)
Immunohistochemical detection of the IR β subunit in normal liver tissue (Figure 1B) showed a clear signal in hepatocytes. In most animals, there was a zonal distribution of IR with a clear signal in zone 1 and zone 2 of the liver acinus, as defined by Rappaport (1973), and no signal in zone 3 (Figure 1B). The IR signal was localized at the plasma membrane, particularly in the sinusoidal part of the hepatocyte. The zonal distribution of IR correlated with the glycogen content and localization in normal liver, in which glycogen appeared in zones 1 and 2 as coarse particles and in zone 3 as fine particles (Figure 1A). Both controls used (substitution and adsorption controls, Figures 1C and 1D, respectively) were negative for IR, which confirmed the specificity of the immunohistochemical reaction.
Insulin Receptor in FAH, HCA, and HCC (Table 3)
The level of IR protein was markedly increased in 93% of a total of 272 GSF studied compared to the extrafocal liver parenchyma from the same sections, in which IR was barely detected. Increased IR level was also detected in the three GSF that had developed spontaneously in two of ten control animals. In contrast to the localization of IR in normal hepatocytes at the plasma membrane, in GSF (Figure 2A), the strong IR immunoreaction was localized mainly in the cytoplasm (Figure 2B). In 100% of the 139 MCF studied, a weak to moderate increase in IR was detected compared to the adjacent tissue. The increase in IR protein level corresponded with the pattern of glycogen accumulation as detected by PAS in serial sections (Figures 2C and 2D). During the progression to malignancy, the glycogen-storing cells developed to glycogen-poor basophilic cells (Figure 3A) and similarly, the level of IR decreased (Figure 3B) as the cells accumulated basophilic components and lost their glycogen. The fifteen detected BCF composed of only basophilic cells did not show visible amounts of IR. A typical BCF is shown in the upper part of Figures 3A and 3B (open arrowheads). The IR level in the twenty-one ICF was slightly increased in comparison to the extrafocal liver parenchyma. A typical ICF is shown in the lower part of Figures 3C through 3E (open arrowheads). The four HCAs displayed a general increase in IR level, which correlated with their glycogen content. Out of the fourteen detected HCC, 71% were glycogen poor (Figure 4A) and did not show an IR signal (Figure 4B). In highly differentiated glycogen-storing HCC (29%; Figures 5A and 5D), the IR protein was detected in all glycogen-rich cells (Figure 5B). In summary, the protein levels of IR in GSF, MCF, ICF, BCF, and HCC correlated with the glycogen content of these lesions as detected by PAS reaction.
Insulin-Like Growth Factor-I Receptor (Tables 2 and 3)
For immunohistochemical detection of IGF-IR in normal liver, FAH, and neoplasms (Figures 4–7), we first used a rabbit antibody against the β subunit of IGF-IR (Figures 4C, 5C, 6B, 7B, 7D, and 7F). The specificity of the antibody reaction was confirmed by substitution (Figure 6C) and liquid adsorption control (Figure 6D).
The localization and pattern of signal intensity of IGF-IR were similar to those of IR in normal liver and in the different FAH and HCC (Figures 4–7). Insulin-like growth factor-IR was weakly detectable in normal liver (Figure 6B) but was abundant in GSF (Figure 7B), and the signal agreed with the pattern of glycogen storage detected by PAS staining in serial sections (Figures 6A and 7A). With progression toward HCC, the IGF-IR protein level decreased gradually. The MCF depicted in Figure 7C shows a weak immunohistochemical reaction for IGF-IR (Figure 7D), however, some scattered cells in the focus demonstrate a stronger labeling. No IGF-IR signal was detected in glycogen-poor BCF (shown in the upper left corner of Figures 7E and 7F, open arrowheads; thick arrowheads in lower left corner of Figures 7E and 7F point to an MCF). In HCC, the IGF-IR signal correlated with the glycogen content of the tumor cells, as demonstrated in Figures 4A and 4C (glycogen-poor basophilic HCC) and Figures 5A, 5C, 5D, and 5E (glycogen-rich HCC).
To confirm the specificity of the IGF-IR immunoreaction, we also used an antibody from chickens against the α subunit of IGF-IR raised against a sequence that is not present at the IR. The results obtained were very similar to those observed with the antibody to the IGF-IR β subunit (Figure S1).
Mitogen-Activated Kinase/Extracellular Regulated Kinase-1 (Tables 2 and 3)
Activation of IGF-IR results in sequential activation of Ras, Raf, and mitogen-activated protein kinase isoforms ERK1/2, whose activation results in the transcription of genes that drive proliferation. In the present study, we investigated MEK-1, the protein downstream of Raf, using immunohistochemistry. In normal, untreated liver (Figure 8A), the MEK-1 protein level was weak in zones 1 and 2 and not detected in zone 3 of the liver acinus (Figure 8B). In GSF (Figures 8C and 8D) and MCF (Figures 9A and 9B), the MEK-1 signal was increased compared to that in the adjacent tissue. The specificity of the immunoreaction was verified by antibody substitution (Figure 9C) and liquid adsorption control (Figure 9D) using serial sections. Mitogen-activated kinase/extracellular regulated kinase-1 was not detectable in BCF (Figures 10A and 10B) and only weakly increased in ICF (Figures 10C-10E) as compared to the extrafocal tissue. In the poorly differentiated basophilic HCC (Figure 4A), the MEK-1 level was very low (Figure 4D), whereas it was increased in glycogen-rich cells of highly differentiated HCC (Figures 5D and 5E). Overall, the pattern of MEK-1 in the different FAH and in HCC was similar to that of IR and IGF-IR.
Insulin Receptor Substrate-2 Level in Early Stages of Hepatocellular Preneoplasia
Insulin receptor substrate-2 is an adapter protein downstream of IR. In the liver parenchyma of untreated control animals, the immunoreaction for IRS-2 was low and was localized largely in the cytoplasm (not shown). Figure 11A shows a CCF, corresponding to a GSF, labeled by thick arrowheads in a cryosection stained with H&E. Immunohistochemical reaction for IRS-2 showed a clear difference in signal intensity between the CCF and the surrounding parenchyma (Figure 11B). Insulin receptor substrate-2 was abundant in the cytoplasm. Out of eighteen GSF scored in livers of NNM–treated rats, fourteen GSF (78%) showed increased IRS-2 levels compared to adjacent tissue. The pattern of the IRS-2 signal was similar to that of IRS-1 (Figure 11C) and MEK-1 (Figure 11D) and agreed with the IR and IGF-IR patterns (data not shown).
Discussion
The stop model of hepatocarcinogenesis employed in this study has previously been used for cytomorphological, morphometric, enzyme- and immunohistochemical, microbiochemical, molecular biological, and radioautographic approaches, as described in the introduction. The main advantage of this model is that the development of FAH, HCA, and HCC can be analyzed after withdrawal of the carcinogen without any interference with ongoing unspecific toxic effects, permitting at the same time the recognition of persistent cellular changes and the follow-up of their self-contained biological behavior (Bannasch 1968). Under these conditions, the earliest emergence, persistence, and step-by-step progression from one type of focus to the other, and eventually to HCA and/or HCC, was investigated sequentially in numerous experimental series, providing compelling evidence of a consistent sequence of hepatocellular changes leading from the early glycogenotic FAH via various intermediate stages to glycogen-poor, basophilic (ribosome-rich) HCC, which is closely related to a fundamental shift in carbohydrate metabolism, as has been repeatedly reviewed (Bannasch et al. 1980; Bannasch, Klimek et al. 1997; Bannasch et al. 2001; Bannasch 1996).
Consistent changes in the energy metabolism of hepatocellular neoplasms are well known from extensive studies in transplantable hepatomas (Weber 1977), including the inverse relationship between glycogen content and growth rate (Lea et al. 1972; Reuber 1966), which is in keeping with the observation of a similar relationship in HCA and HCC induced in the stop model by NNM (Zerban et al. 1994). The possible presence of considerable amounts of glycogen in HCA, and even in HCC, shows that the sequence of cellular changes during the progression from GSF to undifferentiated, basophilic HCC is not completely synchronized with the appearance of certain pathomorphologic entities such as HCA and HCC endowed with various levels of cellular differentiation. There is general agreement, however, that highly differentiated neoplasms have the potential to further progress to less differentiated and faster proliferating forms with time. During the development of chemically induced hepatocellular neoplasms growing in situ, this potential can be inferred only from observations in a large number of animals sacrificed at different time points (Bannasch, Zerban et al. 1997), but it has also been demonstrated for chemically induced transplantable hepatomas that highly differentiated, slowly growing neoplasms rich in glycogen become less differentiated, lose their glycogen, and grow faster when they pass through several generations of transplantation (Reuber 1966). Thus, the presence of abundant glycogen in some of the HCA and HCC studied does not argue against the glycogenotic/basophilic sequence of cellular changes during hepatocarcinogenesis proposed. However, it provides an additional opportunity to unravel the biochemical and molecular events during this process.
Applying the stop model, we have previously shown that the IRS-1 expression level correlates with the glycogen content of hepatocytes during the process of chemical hepatocarcinogenesis in the rat. The IRS-1 protein level is strongly increased at early stages in GSF, and this overexpression is gradually lost with progression to the poorly differentiated basophilic HCCs (Nehrbass et al. 1998). In the present study, we investigated the level of proteins acting upstream and downstream of, and parallel to IRS-1. Here we found increased levels of IR, IGF-IR, IRS-2, and MEK-1 in GSF, representing the most common earliest stage of hepatocellular preneoplasia. Interestingly, a similar pattern of increased protein levels was also observed in GSF developing spontaneously in the liver of untreated animals (Table 2), and we conclude that the overexpression of both IRS-1 and IRS-2 coinciding with the combined upregulation of both the IR and the IGF-IR is a general characteristic of hepatocarcinogenesis. Similar to the IRS-1 expression pattern, IR, IGF-IR, and MEK-1 levels were initially increased in GSF. This increase was gradually reduced in later stages (MCF and BCF), and it was almost completely lost in basophilic HCC (Table 3). Although the intensity of the MEK-1 signal was generally low in the tissues analyzed, the strong reduction of MEK-1, a component of a proliferation-related signaling pathway, in HCC was unexpected. It is known that other receptors than IR and IGF-IR may also be associated with MAP kinases, including MEK-1. Therefore, it remains to be investigated whether such receptors are altered or not in FAH. Lack of altered expression of such receptors would support the hypothesis that the MEK-1 level correlates with IR/IGF-IR, and this correlation would explain the reduction of MEK-1 in lesions that do not show IR or IGF-IR.
Although immunohistochemistry detects only protein levels and does not permit analysis of the activity of the proteins, it may be speculated that the coordinated increase of IR, IGF-IR, IRS-1, IRS-2, and MEK-1 indicates increased activity of the IGF-IR and IR signaling pathways in the early stages of hepatocarcinogenesis, which may render the cells more sensitive to stimulation by IGF-I and insulin. Increased activation of the IR may result not only in altered energy metabolism including glycogenosis but, as insulin is a weak growth factor, also in increased proliferation. On the other hand, IGF-IR, the expression of which is low in normal liver, was described as a critical factor in malignant transformation and the growth of cancer (Baserga 2009; Pollak 2008). The correlation of the changes in the levels of both receptors with the glycogen content of the cells may reflect both the alteration in energy metabolism occurring during hepatocarcinogenesis (Bannasch, Klimek et al. 1997) and the shift toward increased proliferation the hepatocyte acquires while it progresses toward malignancy.
The finding that the increased level of IR, IGF-IR, and their downstream signaling proteins is downregulated in later stages of hepatocarcinogenesis suggests that the upregulation of these proteins is required for the induction of the preneoplastic glycogenotic phenotype, but once the process is switched to alternative pathways of carbohydrate metabolism, the cell may not need further stimulation when progressing to the malignant phenotype. In close agreement with this conclusion, Mazziotti et al. (2002) demonstrated that in patients with HCV–related cirrhosis, the development of HCC is accompanied by a significant reduction in serum IGF-I levels independent of the grade of impairment of liver functions and this reduction precedes the morphologic appearance of HCC by about 9.3 months, thus permitting early diagnosis of tumor development. Furthermore, the association between low levels of IGF-IR in breast cancer cells with a higher risk and a less favorable clinical prognosis has been reported by Papa et al. (1993). Further evidence supporting this finding has been provided by Pennisi et al. (2002), who observed a three-fold increase in migration capacity of breast cancer cells stably transfected with an antisense construct to IGF-IR, which reduced the expression of IGF-IR by 50%. These authors further reported that IGF-IR stabilizes the E-cadherin–catenin complex required for cell–cell adhesion (Pennisi et al. 2002).
In agreement with our findings, IGF-IR overexpression has been described in human cirrhotic liver (containing precursors to liver cancer), in liver cancers, and in human hepatoma cell lines when compared to that of normal adult liver (Caro et al. 1988; Scharf et al. 1998; Tsai et al. 1988; Verspohl et al. 1988). In contrast to these reports, other studies demonstrated that IGF-IR gene expression is increased in HCC and in hepatoma cell lines that express HBx (Kim et al. 1996). Scharf et al. (2000) reported low IGF-IR expression in preneoplastic foci (GSF) and adjacent liver tissue and an increased IGF-IR expression in HCC tissues, rendering them susceptible to the mitogenic effects of IGF. However, these authors used an endocrine model of hepatocarcinogenesis through transplanting pancreatic islets in the liver of streptozotocin-treated diabetic rats, and they concluded that the development from preneoplastic foci to HCC may be driven by insulin. This model places the liver tissue under local hyperinsulinemia, and for this reason, the insulin signaling pathway may be dominant over the IGF-IR pathway. The model described in the present study shows upregulation in components of the insulin signaling cascade without the requirement of direct exposure of hepatocytes to increased levels of insulin. Therefore, previous (Bannasch, Klimek et al. 1997; Dombrowski et al. 1997; Nehrbass et al. 1998) and present results strongly support an insulin-like effect on the development and progression of HCC, no matter whether this is a result of local hyperinsulinemia or increased expression of IR.
Another convincing line of evidence suggesting a role for insulin in the development of liver cancer is the well-documented increased liver cancer incidence in type 2 diabetes. Type 2 diabetic patients show a 2.5-fold increased risk of developing liver cancer (El-Serag et al. 2006), and it is assumed that this increased risk results mainly from hyperinsulinemia frequently observed in these patients. Earlier results showed that experimental animals made diabetic with streptozotocin or alloxan (hyperglycemic and insulin deficient) developed less aggressive tumors, as they display a longer latency period for cancer development, lower number of tumors, slower cancer progression, and smaller final tumor volume with respect to control animals. Insulin treatment reversed these phenotypes (Heuson and Legros 1972).
In the present animal model, both IRS-1 (Nehrbass et al. 1998) and IRS-2 protein levels were increased in GSF. Although IRS-1 and IRS-2 bear structural and functional similarities, they can mediate distinct cellular responses that are ligand dependent (Li et al. 2002; Tseng et al. 2002). Insulin receptor substrate-1 has been shown to inhibit differentiation and promote transformation of cells (D’Ambrosio et al. 1995; del Rincón et al. 2004), including the ability to form colonies in soft agar and tumors in mice (DeAngelis et al. 2006; Dearth et al. 2006). Interestingly, IRS-1 has been shown to translocate to the nucleus after stimulation with IGF-I in mouse embryo fibroblasts (Tu et al. 2002). Nuclear IRS-1 activates cell cycle genes such as c-myc, cyclin D1, and rDNA promoters, and this feature is IGF-I dependent but PI3-kinase independent (Wu et al. 2008). In agreement with our findings, Boissan et al. (2005) reported that IRS-2 is overexpressed in two murine models of hepatocarcinogenesis and in human HCC. This overexpression was detected in preneoplastic lesions and at higher levels in tumor nodules. Insulin receptor substrate-2 overexpression was associated with IGF-II and IRS-1 overexpression and with GSK3β inhibition, and it protected the cells from apoptosis. Similar to our results, Evert et al. (2004) reported strong increases of IRS-1, Raf-1, and MEK-1 in FAH and tumors as compared to unaltered liver tissue, and these increased expressions were closely linked to the clear-cell phenotype of preneoplastic and highly differentiated neoplastic hepatocytes, but not the poorly differentiated basophilic phenotype.
In conclusion, we envision the following scenario: the earliest events occurring in hepatocytes after administration of hepatocarcinogens involve an upregulation of both IR and IGF-IR, thus rendering the hepatocytes more sensitive to stimulation by circulatory insulin and IGF. Activation of the insulin/IGF signaling pathways would result in biochemical alterations manifested by glycogen accumulation and associated metabolic changes in GSF. Activation of the insulin/IGF signaling pathway may also result in increased proliferation observed in the GSF. As in later lesions like MCF and BCF the levels of components of the insulin/IGF signaling pathway are reduced, it may be assumed that tumor progression is a self-containing and irreversible process that does not require persisting upregulation of these pathways. Alternatively or in addition, in later stages of hepatocarcinogenesis, other growth factors such as TGFα (Dombrowski et al. 1997) may be expressed and may be responsible for the further progression to and the maintenance of the transformed phenotype.
Footnotes
Acknowledgments
The authors thank Elsbeth Schneider for excellent technical assistance and Joachim Hollatz for photographic preparation.
The authors declared that they have no conflicts of interests in their authorship and publication of this contribution. The author(s) received no financial support for the research and/or authorship of this article. Dr. Aleem and Dr. Nehrbass contributed equally to the work.