
Abstract
The preclinical efficacy and safety of GPi921, a glycogen phosphorylase inhibitor, was assessed following twenty-eight days of administration to Zucker Diabetic Fatty (ZDF) rats. The ZDF rat is an animal model of type 2 diabetes mellitus (TTDM) which develops severe hyperglycemia. Inhibition of glycogen phosphorylase throughout the duration of the study was demonstrated by reductions in twenty-four-hour glucose profiles and glycated hemoglobin levels. In addition, progression towards hyperglycemia was halted in treated but not control animals, which developed hyperglycemia over the twenty-eight days of the study. Biochemical and histopathological analysis revealed large increases in hepatic glycogen, which closely paralleled the development of hepatomegaly and ultimately resulted in increases in hepatic lipids. Furthermore, prolonged glycogen phosphorylase inhibition resulted in an increased incidence and severity of other adverse pathological findings in the liver, such as inflammation, fibrosis, hemorrhage, and necrosis. The observed biochemical and histopathological phenotype of the liver closely resembled that seen in severe cases of human glycogen storage diseases (GSD) and hepatic glycogenosis in poorly controlled diabetes mellitus. These findings revealed that although glycogen phosphorylase inhibitors are efficacious agents for the control of hyperglycemia, prolonged treatment might have the potential to cause significant clinical hepatic complications that resemble those seen in GSD and hepatic glycogenosis.
Keywords
Introduction
Pharmaceutical inhibition of glycogen phosphorylase, the key enzyme that drives glycogenolysis, has been an important cornerstone in the attempt to reduce postprandial glucose spikes by lowering hepatic glucose production through the trapping of excess glucose as relatively inert glycogen in the liver. Several glycogen phosphorylase inhibitors have been developed for the treatment of type 2 diabetes mellitus (TTDM), and their features have been reviewed elsewhere (Henke and Sparks 2006; Treadway et al. 2001).
Employment of glycogen phosphorylase inhibitors has demonstrated that pharmacological inhibition of hepatic glycogenolysis results in significant glucose lowering in diabetic rodents, supporting the hypothesis that glycogenolysis is a major contributor to high plasma glucose levels seen in diabetic patients (Martin et al. 1998). However, no clinical, morphological, or pathological consequences of prolonged inhibition of glycogen phosphorylase, which may result in extended periods of glycogen accumulation, have been described to date.
Glycogen storage diseases (GSDs) are defined as conditions in which the glycogen concentration of a tissue is abnormally increased. At least ten different GSDs have been identified and classified according to their clinical, morphological, biochemical, and genetic characteristics (Jevon and Finegold 1994; McAdams, Hug, and Bove 1974; Wolsdorf and Weinstein 2003). The most commonly affected organ of GSDs is the liver, such as in the most common type of GSD, type I or von Gierke’s disease, but other organs can be affected, such as the heart in type II or Pompe’s disease and striated muscle in type V or McArdle’s disease, type VII, and also in type III or Cori’s disease. In addition, in type VIII GSD, the central nervous system can be affected (McAdams, Hug, and Bove 1974; Özen 2007; Shin 2006; Wolsdorf and Weinstein 2003).
In the liver, glucose enters hepatocytes freely by insulin-independent facilitated diffusion and is converted to glucose-6-phosphate and then to glycogen. Hepatocellular glycogen may be converted back to glucose via the glycogenolytic pathway, a process that involves glycogen phosphorylase as a key enzyme. Defects in this glycogenolytic pathway may result in GSDs. Hepatomegaly is seen in most cases of GSDs, in which hepatic glycogen accumulation often leads to substantial distension of liver cells. In several GSDs, especially type I, in addition to hepatic glycogenoses, hepatosteatosis is common and is associated with fibrosis and, in severe cases, cirrhosis (Bandsma et al. 2002; Göğüş et al. 2002; Jevon and Dimmick 1998; Jevon and Finegold 1994). A marked increase in de novo lipogenesis has been observed in GSD type I patients, but elevated free fatty acid flux is also likely to be a contributor to the development of hepatic steatosis (Bandsma et al. 2002).
Instances of GSD-like conditions have also been described in animal species, including laboratory animals such as the rat and the dog (Walvoort 1983). Glycogen storage disease has been described in the phosphorylase β kinase-deficient (gsd/gsd) rat, in which hepatocytes contain more than twice as much free glycogen and visible lipid in comparison to controls, indicating that a mechanism may exist that diverts glucose into lipogenesis following an impediment to normal glycogenesis (Clark et al. 1980; Haynes, Hall, and Clark 1983; Holness, Palmer, and Sugden 1987).
In addition to GSD, hepatomegaly is also a consequence of diabetic hepatocellular glycogenosis in types 1 and 2 diabetes (Abaci et al. 2008; Chatila and West 1996; Goodman 1953; Munns et al. 2000), in which it occurs in up to 80% of patients (Creutzfeldt et al. 1970). Furthermore, glycogenosis, diabetic steatosis, and steatohepatitis are also encountered in obese patients with types 1 and 2 diabetes, in which fatty liver can be demonstrated histologically in up to 50% of patients (Chatila and West 1996; Creutzfeldt, Frerichs, and Sickinger 1970; Harrison 2006). Whereas excessive glycogen levels, as a direct result of glycogenosis, are unlikely to progress to fibrosis and cirrhosis, steatosis, which may be an indirect consequence of excessive glycogenosis, may do so (Chatila and West 1996).
Hepatic glucose output is elevated in type 2 diabetic patients, and it is believed that increased glycogenolysis is a major contributor to high liver glucose production, but diabetic patients who take excess insulin and treat the subsequent hypoglycemia with glucose administration, or patients with excessive diet-related glucose levels, may drive net glycogenesis further into the liver, upsetting the normal balance of glycogenesis and glycogenolysis (Consoli 1992; DeFronzo, Bonadonna, and Ferrannini 1992; Hudacko et al. 2008; Tappy 1995).
Here, we have used a potent and selective glycogen phosphorylase inhibitor to demonstrate that, as expected, prolonged inhibition of glycogen phosphorylase in the liver of the ZDF rat leads to inhibition of progression to hyperglycemia. However, upon prolonged inhibition of hepatic glycogen phosphorylase, histological features that resemble those seen in GSDs were found. These features resembled those observed in animals and humans, especially individuals with GSD type I and those with diabetic hepatocellular glycogenosis and steatosis. This observation revealed potentially significant clinical risks that may be associated with continuous inhibition of glycogen phosphorylase in the liver of TTDM patients.
Materials and Methods
Test Compound
GPi921 is a heterocyclic amide derivative (2,3-dichloro-N-[(1R,2R)-1-[(hydroxyacetyl)amino]-2,3-dihydro-1H-inden-2-yl]-4H-thieno[3,2-b]pyrrole-5-carboxamide) with glycogen phosphorylase inhibitory activity synthesized by AstraZeneca R&D, Alderley Park, UK (Whittamore, Bennett, and Simpson 2003). An in vitro recombinant rat enzyme assay demonstrated that this compound has an IC50 (rIC50) of approximately 17 nM against the glycogen phosphorylase enzyme. Dosing suspensions were formulated as 10.6 mg/mL suspensions in 0.25% polyvinylpyrrolidone (PVP, Sigma-Alrich, UK)/0.05% sodium dodecyl sulphate (SDS, Sigma-Alrich, UK) on the day prior to study start and then remade every 7 days. The suspension was stirred continuously from preparation throughout use and protected from light. For controls, the vehicle was formulated as 0.25% PVP/0.05% SDS.
Animals
Male ZDF (ZDF/Gmi-fa/fa) rats were obtained from Genetic Models, Inc., Belgium. Animals were allowed to acclimatise for 2 weeks in a 12-hour reversed light cycle, multiple housed, and given ad libitum access to water and food (SDS Rat and Mouse No. 1, 2.61 kcal/g of ration or 9.24% kcal of fat). Standard procedures and conditions were applied for animal care, feeding, housing, and environment. The studies were conducted in strict adherence to the UK Home Office regulations for animal welfare (1986 Animal Scientific Procedures Act).
Experimental Design
Animals were randomized into groups according to glucose profile (area under the curve values generated by four prestudy glucose values measured 6 days prior to the start of the dosing period). Rats from 7 to 11 weeks of age were dosed daily by gavage with GPi921 at a dose level of 53 mg/kg/day (125 μmol/kg/day) for 28 days (8 animals per treatment) at a dose volume of 5 mL/kg. Control animals received vehicle alone. Additional animals were dosed for 10 days with either vehicle or GPi921 at a dose level of 53 mg/kg/day (4 animals per treatment). A satellite group was employed to assess the exposure profiles of animals treated with GPi921 during a 24-hour period (1, 2, 4, 8 and 24 hours) on various days throughout the study.
Experimental Procedures
All animals were observed daily for clinical signs of toxicity. Body weight, food intake, and water intake measurements were taken daily prior to dosing. A 24-hour glucose profile was generated once a week using a needle tail prick blood sample and an AccuChek monitor (Roche Diagnostics GmbH, Mannheim, Germany). Prior to study commencement and every two weeks during dosing, blood was taken via the tail vein for analysis of glycated hemoglobin.
At the end of the dosing period, terminal narcosis was induced using CO2/O2 in all animals. A terminal blood sample was taken from the abdominal vena cava and the following serum biochemistry parameters were evaluated: albumin, alanine aminotransferase (ALT), alkaline phosphatase, aspartyl serine transferase (AST); total bilirubin, calcium, creatinine, creatine kinase, cholesterol, glucose, potassium, inorganic phosphate, sodium, total protein, triglyceride, urea, and lactate dehydrogenase.
Organ weights for the liver, heart, and soleus muscle were recorded. Representative samples of liver were taken and were either freeze-clamped and stored in liquid nitrogen, before being transferred to a −80°C freezer until analysis for glycogen, or they were placed in 10% buffered formalin and processed for histopathological analysis. Conventional processing into wax and hematoxylin and eosin staining of sections preceded their light microscopic examination. Oil Red O (ORO)-stained cryosections of fixed liver were also examined for assessment of hepatocellular lipid. A score for ORO staining intensity was obtained under blinded condition by averaging the scores of three manually assessed liver sections, where a score of 100 referred to the most intensely stained section.
Liver glycogen concentration was analyzed by KOH digestion of tissues at 70°C followed by amyloglucosidase conversion of glycogen to glucose. The liberated glucose was measured by the addition of hexokinase and measurement of the absorbance of the NADPH generated from the subsequent reaction at 340 nm. Glycogen concentration in tissues was calculated as μmol g-1 tissue (Freeman et al. 2006).
For pharmacokinetic analysis, tail vein blood samples were collected into lithium heparin tubes from satellite animals on days 1, 10, 21, and 28 of dosing at 1, 2, 4, 8, and 24 hours postdose. Plasma was separated by centrifugation at 4°C and stored for analysis at –20°C. Plasma concentrations of GPi921 were determined by liquid chromatography-mass spectrometry (LC-MS). Pharmacokinetic parameters of maximum plasma concentration (Cmax), concentration at dose interval (Clast), and area under the plasma concentration-time curve (AUC [0–24]) were calculated. Additionally, tissue drug concentrations in the liver, soleus muscle, and heart were measured on day 28.
Statistical Analysis
All values are quoted as means. Statistical analysis was undertaken using the Student 2-tailed t-test for paired data.
Results
Clinical Signs
No adverse clinical signs were noted throughout the study. Administration of GPi921 had no effect on body weight and no effect on daily food intake.
Pharmacokinetics
Exposures of animals to GPi921 reached levels approximately twenty-five-fold the rIC50 at Cmax and at least fifteen-fold throughout the prolonged exposure following a single dose, indicating that high levels of glycogen phosphorylase inhibition occurred throughout the dosing period (Figure 1A). Comparison of exposures of GPi921 in different tissues revealed that levels in liver were approximately twice those measured in plasma, soleus muscle or heart tissue (Figure 1B). Following 28 days of GPi921 administration, levels in the liver were still approximately fifteen-fold the rIC50, indicating that continuously high levels of glycogen phosporylase inhibition occurred in the liver throughout the duration of the study.
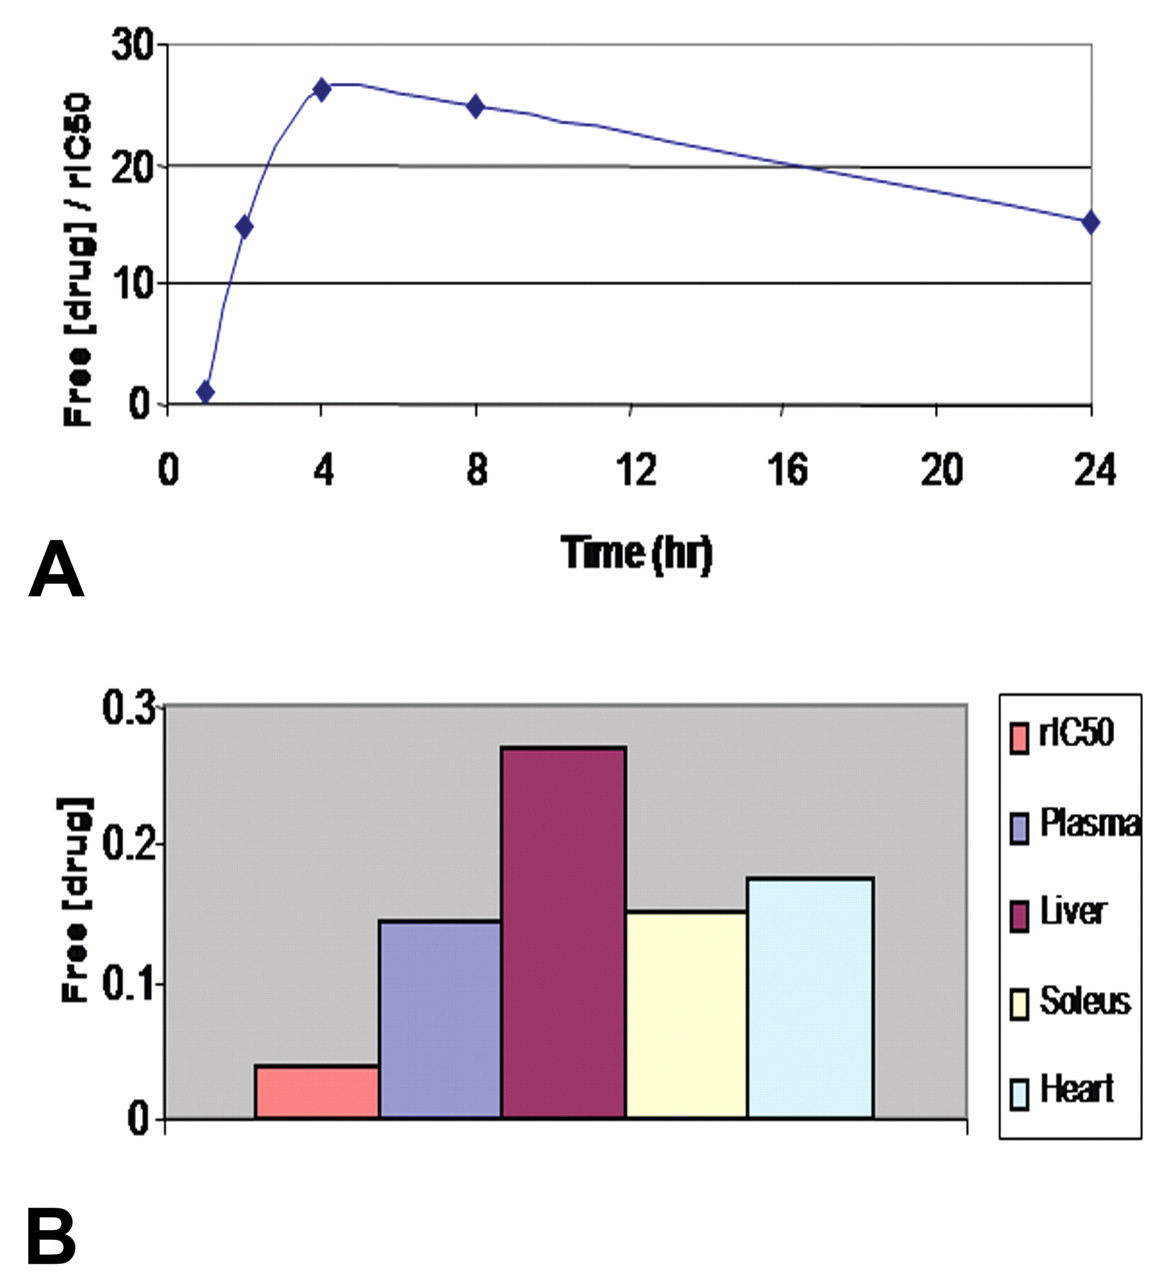
Twenty-four-hour plasma exposure profile of GPi921 following administration of the first dose (expressed as free plasma concentration in μM/rat enzyme IC50 [rIC50]) (A) and comparison between free tissue concentrations in μM and rat enzyme IC50 (rIC50) for GPi921 at Clast following administration of the final dose on day 28 (B).
Liver Glycogen, Glucose Profile, and Glycated Hemoglobin
A significant increase in glycogen levels, expressed as either hepatic glycogen concentration (μmol/g liver tissue) or total liver glycogen content (μmol/liver), was observed following twenty-eight days of administration of GPi921 when compared to vehicle-treated animals (p < .001). After administration of GPi921 for ten days, total liver glycogen content had doubled (mean of 6047 μmol in treated vs 3050 in control animals) and increased further after twenty-eight days of treatment to a mean total liver glycogen content of 9614 μmol in treated versus 4186 μmol in control animals (Figure 2A).
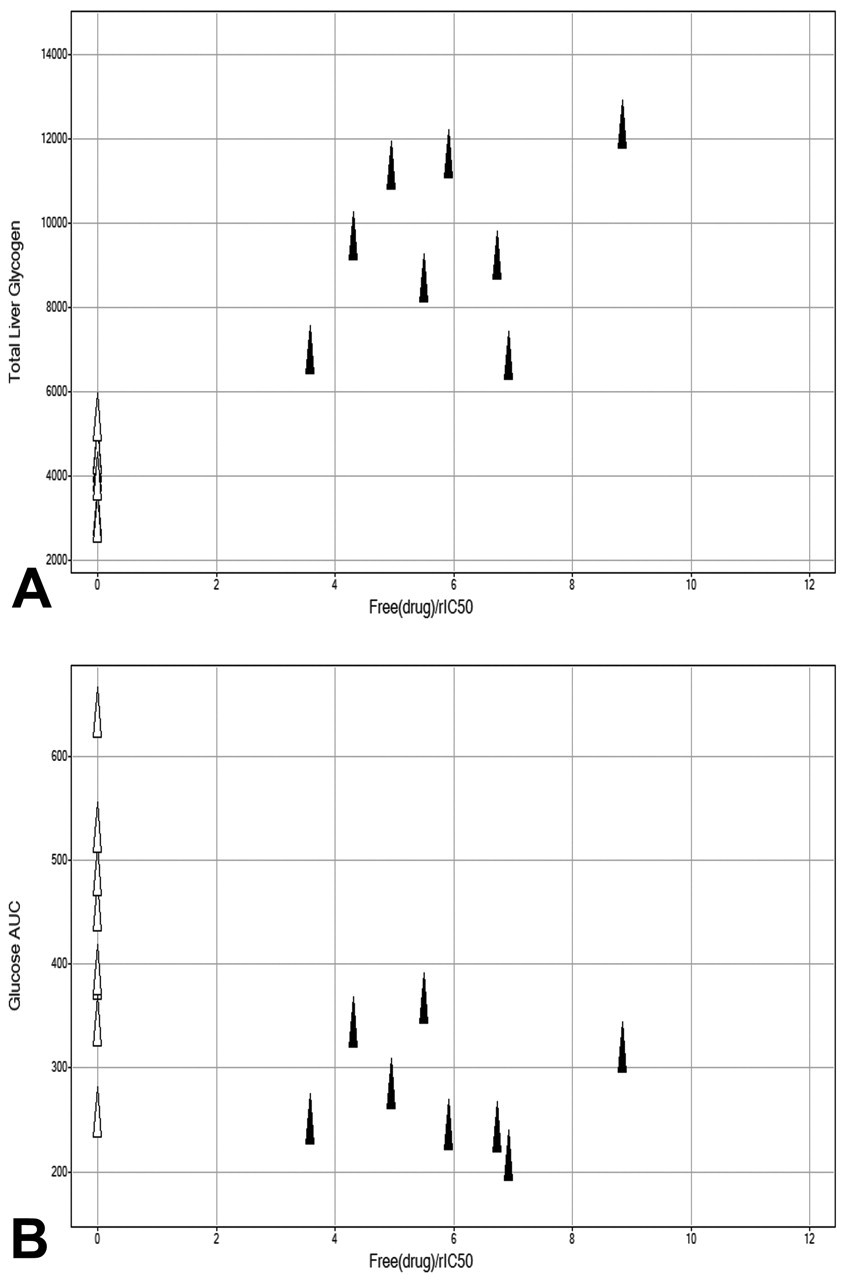
Total liver glycogen content (μmol) on day 28 for GPi921-treated animals (filled triangles) and control animals (open triangles) compared to compound exposure at Clast expressed as free plasma drug concentration over rat enzyme IC50 (rIC50) (A) and glucose AUC (μM*hr) on day 28 for GPi921-treated and control animals compared to compound exposure at Clast (B).
On day 1, following administration of the first dose of GPi921, individual plasma glucose AUCs for all animals, including vehicle-treated animals, were below 400 mM*hr (mean of 299 mM*hr). On day 28, the plasma glucose AUC of six of eight control animals was at or greater than 400 mM*hr and as high as 640 mM*hr (mean of 439 mM*hr). In comparison, GPi921-treated animals exhibited reduced glucose excursions during a twenty-four-hour glucose profile, with the plasma glucose AUC of all GPi921-treated animals remaining less than 400 mM*hr (mean of 284 mM*hr). This result clearly showed that the progression to hyperglycemia as seen in control animals was inhibited by GPi921, and that exposure levels of GPi921 were sufficient to significantly and continuously inhibit rat liver glycogen phosphorylase (Figure 2B).
In addition, administration of GPi921 for two weeks reduced the progression of glycated hemoglobin levels (p < .01). After twenty-eight days of treatment, glycated hemoglobin levels had increased in controls by 2.65% ± 0.26%, whereas those in GPi921-treated animals had increased by only 1.55% ± 0.12% (p < .01 cf vehicle) (data not shown).
Liver Weight
Following ten days of administration of GPi921, as a percentage of body weight, group mean liver weights had increased from a mean of 4.8% in controls to 6.0% in GPi921-treated animals (p < .05). Although a further increase in absolute liver weights was observed upon treatment with GPi921 for twenty-eight days (p < .01), additional increases in liver weights, as a percentage of body weight, after day 10 were small.
After twenty-eight days, as a percentage of body weight, individual liver weights in controls were between 4% and 5% (mean of 4.7%), whereas those in GPi921-treated animals had increased to 5.5% to 7% (mean of 6.2%), an increase of approximately 30%. A linear correlation between total glycogen levels in the liver of animals and increases in liver weight of individual animals was evident, indicating a direct link between inhibition of glycogen phosphorylase-mediated increases in glycogen storage and increased liver weight (Figure 3A).
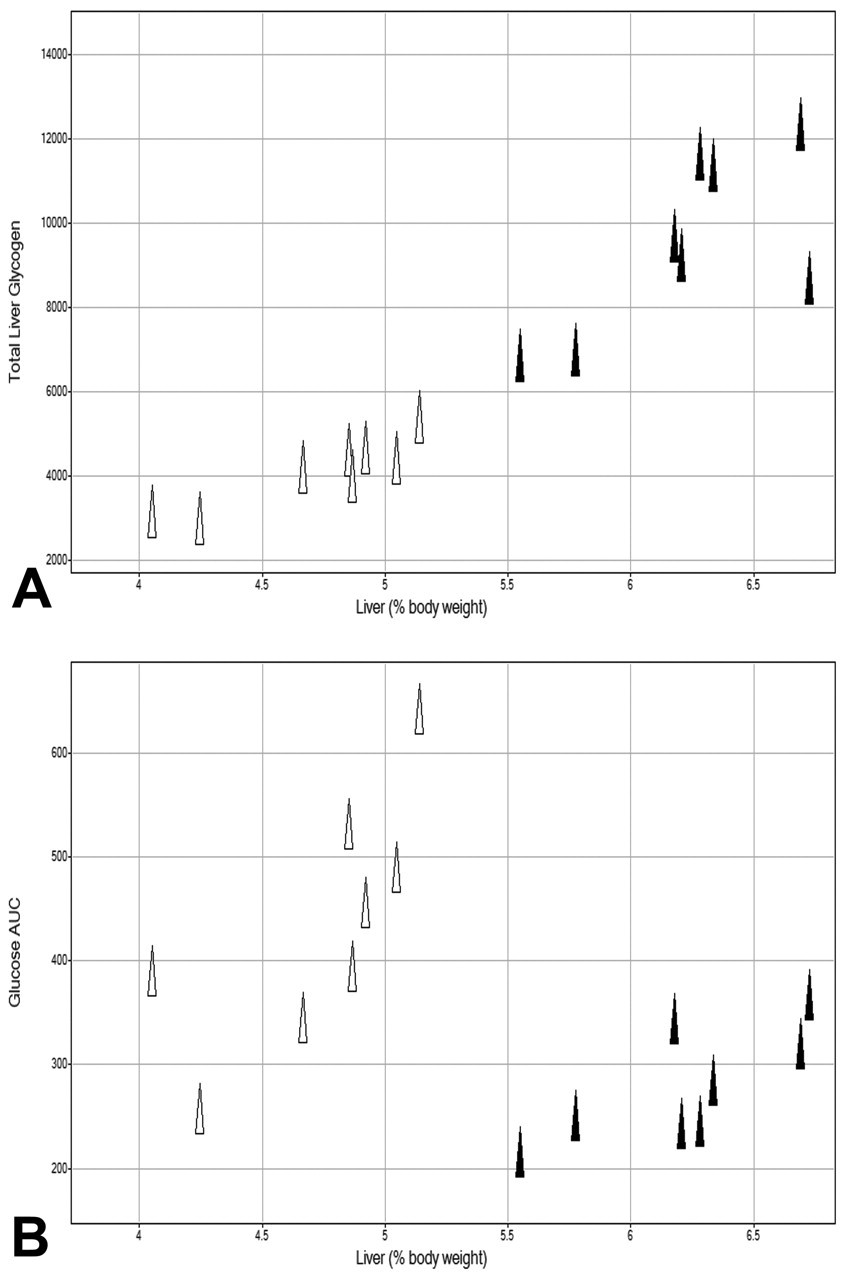
Total liver glycogen content (μmol) on day 28 for GPi921-treated animals (filled triangles) and control animals (open triangles) compared to liver weights expressed as a percentage of body weight (A) and glucose AUC (μM*hr) on day 28 compared to liver weights (B).
A similar correlation was observed on comparison of the plasma glucose AUC on day 28 with liver weights in controls and GPi921-treated animals, where GPi921-treated animals had significantly heavier livers but also lower glucose AUCs (Figure 3B).
Liver Histopathology
At ten days, a moderate hepatocyte vacuolation that was ORO negative was noted in all GPi921-treated animals and was considered to be a result of increased glycogen storage. No other histological changes were noted. However, at twenty-eight days, the severity of increased hepatocyte vacuolation had increased substantially to moderate or severe levels in GPi921-treated animals, whereas hepatocyte vacuolation in controls was normal. There was a clear correlation between severity of vacuolation and total liver glycogen content. Moderate and severe hepatocellular vacuolation correlated with total liver glycogen content of approximately 7,000 μmol and above 8,000 μmol, respectively, whereas normal livers had a total glycogen content of less than 6,000 μmol (Figure 4A).
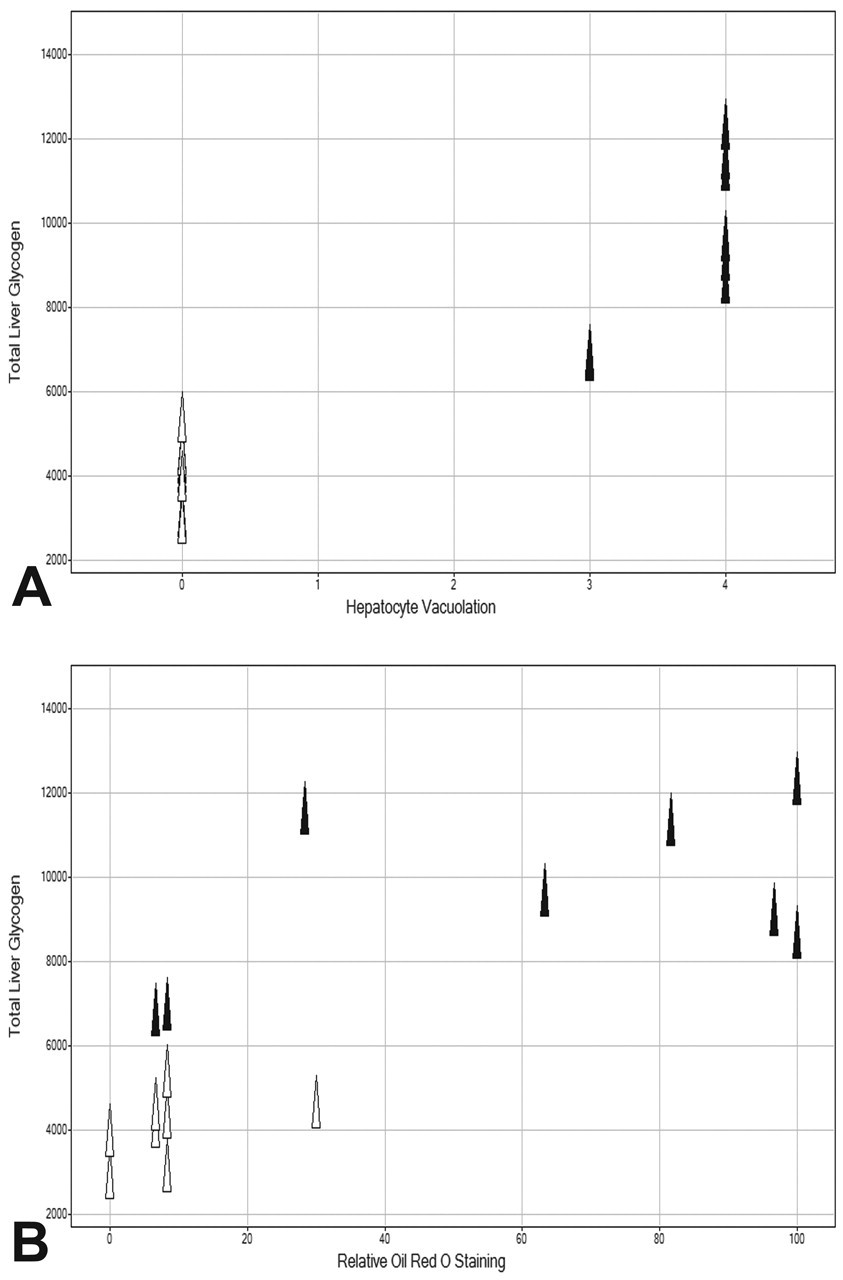
Total liver glycogen content (μmol) on day 28 for GPi921-treated animals (filled triangles) and control animals (open triangles) compared to the severity of hepatocyte vacuolation (0 = absent, 1 = minimal, 2 = mild, 3 = moderate, 4 = severe) (A) and compared to the relative intensity of liver Oil Red O staining (B).
At twenty-eight days, ORO staining indicated mild hepatocyte fat deposition in control animals, which was moderate to severe in GPi921-treated animals. In general, the GPi921-induced increase to moderate and severe hepatocyte fat deposition coincided with a change in the distribution of the ORO stain, from mainly centrilobular areas to a more diffuse staining across liver lobules. A clear correlation was present between ORO staining intensity and total liver glycogen content, where most animals with total liver glycogen contents above 8,000 μmol had strong ORO staining intensity (Figure 4B). Similarly, hepatocyte fat deposition correlated with ORO staining intensity (Figure 5). Some exceptions to this correlation were noted, namely, that in two of eight GPi921-treated animals with total glycogen levels of about 7,000 μmol, no hepatocyte ORO fat staining, above that seen in controls, was observed. Another GPi921-treated animal with very high total glycogen content (~11,500 μmol) showed slightly elevated ORO staining intensity, which did not exceed the highest staining intensity seen in one of the controls. The observed exceptions may be representative of a normal variation within the broader population.
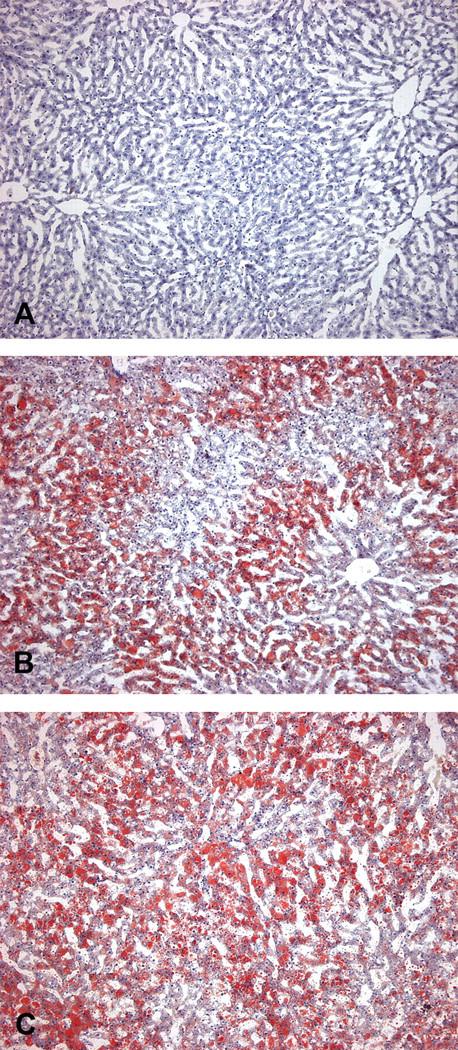
Liver sections from control animals (A) and animals treated with GPi921 for twenty-eight days (B and C) stained with Oil Red O (ORO). Sections B and C show moderate and severe ORO-positive hepatocyte vacuolation. (Original objective lens magnification: A, B, and C 40×)
In animals treated with GPi921 for twenty-eight days, microscopic examination of the livers revealed an increased incidence and severity of subcapsular hepatocyte degeneration, subacute or chronic inflammatory cell infiltration, granulomatous inflammation with fibrosis, and a significantly increased severity of multifocal hepatocyte necrosis. Taken together, the majority of GPi921-treated animals (six of eight animals examined) showed significant pathologies by day 28, all of which were absent in controls (Figure 6).
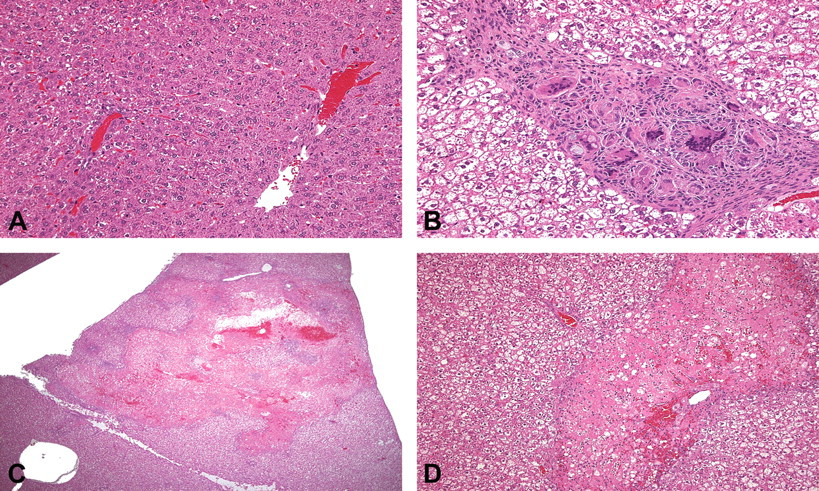
Liver sections from control animals (A) and those treated with GPi921 for twenty-eight days (B, C, and D) stained with hematoxylin and eosin stain. In section B, moderate granulomatous inflammation with some associated fibrosis is present, and in section C severe multifocal hepatocyte necrosis with associated congestion/hemorrhage and inflammation, which at higher magnification (D) shows polymorphonuclear leukocytes, some monocytes/macrophages, and no fibrosis. (Original objective lens magnification: A and B, 40×; C, 5×; D, 20×)
Histopathological findings in the liver were generally in line with elevation in AST and ALT in GPi921-treated versus control animals (mean ALT elevated from a group mean value of 122 IU/L to 215 IU/L and AST from a group mean value of 78 IU/L to 125 IU/L for control versus GPi921-treated animals, respectively). However, this correlation was less clear on an individual animal basis, where some GPi921-treated animals had significantly elevated plasma AST and ALT levels, but, with the exception of the previously described changes in glycogen and lipid, did not show major adverse liver pathology, whereas other GPi921-treated animals had major liver pathologies, but only small elevations in liver enzymes (data not shown). It is possible that at the time when blood was sampled on day 28, either liver enzyme levels had already declined, or, where elevation in enzyme levels was seen in the absence of major pathological changes, these were imminent but not yet histologically detectable.
Importantly, a clear correlation between high total liver glycogen content and/or relative ORO staining intensity and the incidence and severity of other pathological findings (i.e., inflammation, necrosis, and/or fibrosis) was observed (Figure 7). All GPi921-treated animals, which showed significant liver pathology, had a total liver glycogen content above 8,000 μmol.
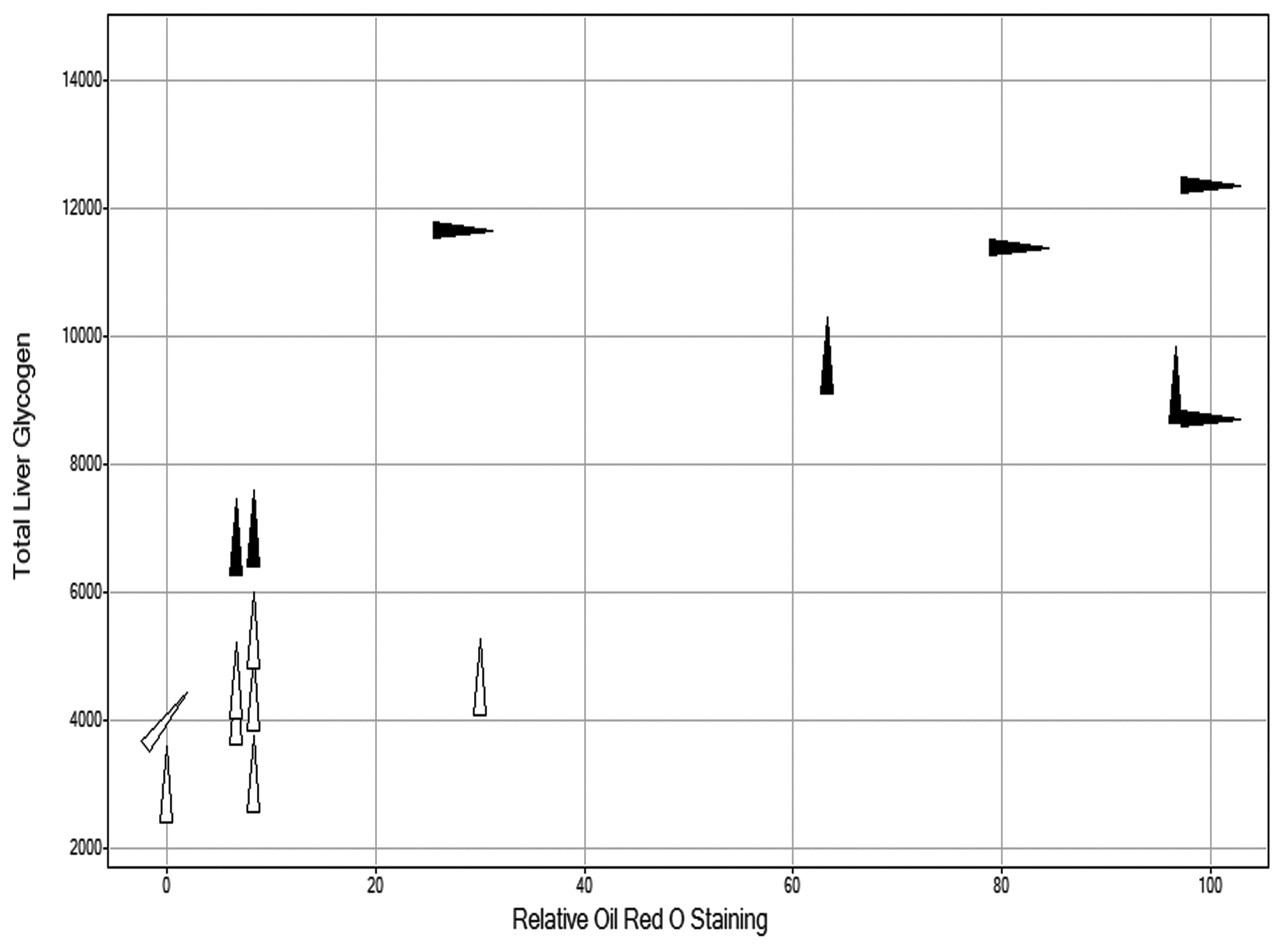
Total liver glycogen content (μmol) on day 28 for GPi921-treated animals (filled triangles) and control animals (open triangles) compared to relative intensity of liver Oil Red O staining. The angular rotation of the triangle indicates the severity of pathological findings in the liver of individual animals (i.e., inflammation, necrosis and/or fibrosis; 0°=no findings, 45°=minimal to mild, 90°=moderate to severe findings).
Discussion
As expected, control ZDF rats showed progression to hyperglycemia, and this progression was inhibited by GPi921, an inhibitor of glycogen phosphorylase. This finding was confirmed by a significant reduction in glucose AUC in GPi921-treated animals compared to control ZDF rats and by the relative reduction in glycated hemoglobin. The observed reduction in plasma glucose and in glycated hemoglobin clearly demonstrated the beneficial effects of GPi921-mediated glycogen phosphorylase inhibition in controlling plasma glucose, which suggests that glycogen phosphorylase inhibitors may be regarded as potential therapies of TTDM.
However, in addition to these beneficial effects, in this study, we also noted potentially adverse consequences of prolonged inhibition of hepatic glycogen phosphorylase. As demonstrated here, continuous exposure to GPi921 resulted in an initial rise in hepatic glycogen concentrations, which reached a maximum level and thereafter remained relatively stable. However, total liver glycogen content still increased in line with a continuous increase in liver weight in GPi921-treated animals. The observed increase in liver weight together with the substantial increase in liver glycogen and hepatic glycogen vacuolation are key features seen in GSD and indicated that the development of GSD is a tangible effect of prolonged exposures to glycogen phosphorylase inhibitors.
In addition to the glycogen-mediated development of hepatomegaly, a dramatic increase in hepatic lipid content was observed following twenty-eight days of continuous glycogen phosphorylase inhibition. Analysis of ORO staining intensities revealed a clear correlation between increased liver weight and the presence of lipids once livers had exceeded a threshold weight of about 5.5% of total body weight. A close correlation existed between liver weight and total liver glycogen, and also, with the presence of fat, where a significant increase in hepatic neutral lipids was present when total liver glycogen content exceeded 8,000 μmol.
Furthermore, although a low incidence and severity of inflammatory cell infiltration, necrosis, and fibrosis can be observed in untreated ZDF rats, in this study, once total hepatic glycogen content exceeded 8,000 μmol, the majority of animals treated with GPi921 showed a clear increase in the incidence and severity of these adverse histopathological findings. In some cases, focally severe necrosis, hemorrhage, and inflammation were observed, which may represent the pathological sequelae of locally diminished blood flow, and in some cases, infarction, caused by sustained, raised intrahepatic pressure against its relatively inelastic capsule, probably as a consequence of glycogen storage-mediated hepatomegaly and hepatic steatosis.
Thus, the data presented in this study support the hypothesis that in this animal model, continuous inhibition of glycogen mobilization led to a slowing of the progression of diabetic disease, as indicated by stable glucose profiles with no major changes in glycated hemoglobin. However, this finding also coincided with marked increases in hepatic glycogen and neutral lipid storage and correlated increases in liver weight. Therefore, once the glycogen storage capacity of the ZDF rat liver appeared to be saturated, storage of additional, glucose-derived energy appeared to be shifted from glycogenesis to de novo lipogenesis, resulting in hepatic steatosis and ultimately in pathological liver damage.
Similar findings to the ones described above were made following administration of a glycogen phosphorylase inhibitor from a chemically different class (data not shown), indicating that these observations were indeed caused by prolonged inhibition of glycogen phosphorylase, rather than off-target effects. Similarly, the severity and incidence of these observations were reduced in a dose-dependent manner, indicating a direct correlation between the described observations and a reduction in glycogen phosphorylase inhibition.
Interestingly, in this drug-induced glycogen accumulation, hepatomegaly and hepatic steatosis paralleled the hepatic phenotype described in some of the GSDs seen in man and animals (McAdams, Hug, and Bove 1974; Wolsdorf and Weinstein 2003; Özen, 2007; Walvoort, 1983).
Thus, the observed phenotype resembled that described in the phosphorylase β kinase-deficient (gsd/gsd) rat in which hepatocytes contain more than twice as much free glycogen as in wild-type littermates. The resultant hepatomegaly in this rat is also associated with increased hepatic lipids, illustrative of the diversion of glucose into lipogenesis in the event of impeded glycogenesis (Clark et al. 1980; Haynes, Hall, and Clark 1983; Holness, Palmer, and Sugden 1987). Furthermore, a similar phenotype has also been reported in rats administered with the organophosphate malathion, the prolonged administration of which results in hepatomegaly linked to increased hepatic glycogen and decreased hepatic glycogen phosphorylase activity (Rezg et al. 2006). In man, the observed phenotype is seen infrequently, but has been reported in some types of GSD, especially type I (Göğüş et al. 2002; Jevon and Finegold 1994; McAdams, Hug, and Bove 1974; Wolfsdorf and Weinstein 2003), which highlights the potential consequences of sustained inhibition of glycogen phosphorylase in the human liver. Whereas in man increased hepatic glycogen storage itself may be seen as a benign consequence of glycogen phosphorylase inhibition, the resulting hepatomegaly and steatosis leading to an adverse pathological phenotype would question the risk/benefit of hepatic glycogen phosphorylase inhibitors for the treatment of TTDM.
Furthermore, since hepatic glycogenosis and glycogenic hepatopathy can be a feature in patients with long-standing, poorly controlled TTDM (Abaci et al. 2008; Hudacko et al. 2008; Munns et al. 2000), a real risk of its exacerbation upon treatment with a glycogen phosphorylase inhibitor exists, indicating that careful clinical management and hepatic monitoring would be essential.
In conclusion, our data suggest that glycogen phosphorylase inhibitors show potential in the treatment of hyperglycemic diseases. Short-term glycogen phosphorylase inhibition resulted in increased glycogen storage, leading to hepatomegaly, but this process itself did not lead to significant adverse pathological findings. However, after prolonged inhibition, an efficacy-related increase in hepatic steatosis and an increase in the incidence and severity of adverse histopathological findings were observed in the liver, indicating that continuous chronic treatment with glycogen phosphorylase inhibitors may have the potential to induce severe hepatic features similar to those seen in GSD. Thus, if glycogen phosphorylase inhibitors are to be used safely in the treatment of TTDM, there may be a necessity for “drug holidays” to allow the glycogen, accumulated in the liver, to be hydrolyzed rather than to be continuously accumulated until the balance of excessive energy storage is shifted from glycogenesis to de novo lipogenesis. Alternatively, an exposure profile, restricting efficacy to less than twenty-four hours to avoid long-term hepatic glycogen accumulation, may be required. Whether or not such a dosing regimen or exposure profile can be efficacious would require substantial assessment.
Footnotes
This research received no specific grant from any funding agency in the public, commercial, or not-for-profit sectors.
Acknowledgments
The authors would like to acknowledge all their colleagues within AstraZeneca who have contributed to this research.