
Abstract
Social capital generated by relationships within families has a greater impact on inter-generational mobility in the United States than other forms, though community capital plays a secondary role, and student achievement and school and adult friendships serve as moderators. County-level mobility rates are regressed on county-level indexes of the four forms of social capital, student achievement, demographic controls, and state fixed effects. Estimates are based upon unweighted observations from 1333 to 1818 counties, depending on model. Inter-generational mobility rates are largely a function of county’s density of family capital (marriage rates and two-parent households), followed by community capital (community organizations, religious congregations, and volunteering). Student achievement in grades 3–8, together with cross-class friendships in school and adulthood, moderate relationships. To enhance mobility, public policy needs to enhance the lives of disadvantaged young people at home, in school, and in communities, not simply by modifying friendship patterns.
In America, “no Man continues long a Labourer for others, but gets a Plantation of his own,” said Benjamin Franklin (1751), giving rise to the idea that the United States was a “land of opportunity.” In the centuries since, scholars have debated the ways in which and the extent to which the next generation could move up the social ladder. Recently, research has suggested that mobility in the United States may be fostered by the following forms of social capital: family (Coleman, 1988); community (Putnam, 2016), political (Rupasingha et al., 2006; U. S. Congress, Joint Economic Committee, 2017, hereinafter JEC); and friendship (Chetty et al., 2022). To measure the relative importance of each kind of capital, respectively, the following county-level indexes have been constructed: density of marriage and dual-parent households; density of volunteering and community and religious organization; levels of political trust, participation and civic engagement, and density of cross-class friendships in school and as an adult. However, scholars have yet to reach consensus on the relative importance for inter-generational mobility of each form of social capital. This paper shows that county density of family capital has the most robust relationship with inter-generational mobility, though density of community capital plays a secondary role. Student achievement and friendship patterns serve as moderators.
Inter-Generational Mobility
Inter-generational mobility is a distinctive mark of an industrial democracy. Rigid structures of social stratification, defining the place of individuals and groups across multiple generations, characterize not only the Indian caste system but also the social structures of medieval Europe, Russian serfdom, Japanese feudalism, apartheid regimes in Rhodesia and South Africa, and relationships between nobility and commoners in the Pacific Islands. Over the past two centuries, the rigidity of these structures has been shaken, though vestiges of the past persist in even the most democratic of modern societies.
Inter-generational mobility can be defined in either absolute or relative terms. When defined absolutely, most indicators show high rates of mobility in socio-economic status (SES) in the United States. College graduation rates have increased from 8% in 1960 to 38% in 2020 (Statista, 2022). After adjusting for inflation, 84% of all adult children earned more income between 2000 and 2008 than their parents had by a similar age. For those born into the lowest quintile of all households, that percentage was 93% (Gramm et al., 2022, pp. 119–164; Urahn et al., 2012).
There is less consensus with respect to relative mobility. Zhou (2019, p. 459) finds that increasing college graduation rates “is unlikely to boost inter-generational mobility among college graduates.” Beller and Hout (2006) find less mobility in the United States than in other democracies, while others report roughly equivalent rates across Europe and the United States (Breen & Müller, 2020; Winship, 2018). Relative mobility, it is to be noted, is a zero-sum game. For every step upward in SES ranking one person takes, another person must take a step downward. Unlike absolute mobility, where in principle everyone in the current generation can be better off than their ancestors, there must always be both winners and losers on a scale that measures relative mobility.
Relative mobility can vary from none to completely random shifts in the SES distribution from one generation to the next. Few in modern societies would prefer either extreme. If SES distributions changes randomly from one generation to the next, society would under-invest in human capital, as parents would have less incentive to attend to the development of their children’s human capital. But if inter-generational mobility were zero, then all children would hold the same SES rank as their parents, and that rigid caste system would leave a nation unable to make full use of citizen talents. That raises the question as to whether social capital—and what forms of social capital—foster inter-generational mobility in a modern, industrialized, democratic society, especially one that defines itself as a “land of opportunity.”
Social Capital Theory
Social capital emerges out of the “obligations and expectations” that arise from relationships among individuals. It is a function of the “trustworthiness of the social environment, information-flow capability of the social structure, and norms accompanied by sanctions” (Coleman, 1988, p. S119, as quoted by Jackman & Miller, 1998, pp. 48–49). It is a type of human capital, which Becker defines as “activities that influence future monetary and psychic income by increasing resources in people” (Becker, 1964, p. 11; Rees, 1965; Solow, 1965). Social capital is widely regarded as a vital resource that can generate trust needed to solve common problems (Ostrom, 1990), enhance human flourishing (VanderWeele, 2017), stimulates economic and political modernization (Fukuyama, 1995; Inglehart, 1997; Putnam, 1993), and, of special interest here, facilitate inter-generational mobility (Chetty et al., 2022).
Drawing upon the literature, this paper offers a model linking social capital to inter-generational mobility. In the proposed model, four types of social capital—family, community, political relationships, and cross-class friendships—are explored as potential predictors of inter-generational mobility. Student achievement and cross-class friendships in school and adulthood are potential moderators that link family, community and political capital to mobility. Relationships among these variables are observed at the county level in the United States.
Family Capital
Even after controls for household income and parental education have been introduced, family social capital, proxied by incidence of two-parent households, predicts student achievement and reduced drop-out rates prior to high school graduation (Duncan & Murnane, 2011; McPherson et al., 2013; Coleman, 1988, pp. S109–S113). Positive interactions within the home are, on average, more frequent when two parents share child-rearing responsibilities, and the benefits of dual parenting have been shown to spill over to others in the community (Kearney, 2023, pp. 139–143; Teachman & Paasch, 1998). The connection to rates of mobility within counties has been discerned by Chetty et al. (2014, p. 1616; also see Chetty & Hendren, 2018; Chetty et al., 2020), who find “the fraction of children living in single-parent households is the single strongest correlate of upward income mobility among all the variables we explored.”
Community Capital
Community capital can boost inter-generational mobility by enhancing government institutions and informal relationships within neighborhoods. Wilson (1987) discusses the ways in which male unemployment, racial barriers, and concentrated poverty in urban neighborhoods contribute to persistent inter-generational impoverishment by isolating young people from appropriate adult role models and supportive community institutions. Putnam (1993) argues that higher levels of community capital in northern Italy—its choirs, sports leagues, and other voluntary organizations—propelled higher levels of economic and political development than in southern Italy, which had a more isolative communal life. Putnam and Campbell (2012; also see Putnam, 1995a, 2000) track a decline in the number, size, and density of local voluntary associations and other forms of social engagement, which adversely affects governmental performance. Putnam (2016) says the departure of the middle class from urban neighborhoods to socially exclusive settings leaves once healthy neighborhoods with fewer voluntary associations and widening achievement gaps. However, more recent research has not been able to show a consistent pattern of community capital effects on student achievement (Gamoran et al., 2021; Shriner et al., 2009).
Political Capital
The level of citizen trust and political participation is said to be critical for effective functioning of governmental institutions, which helps to explain differences in the rate of political development across nations and regions (Putnam, 1993, 1995a, 1995b, 2000, 2016). Because government functioning and community relationships are seen as inter-dependent, discussions of political capital and community capital are often intertwined (Fukuyama, 1995; Inglehart, 1997). But political trust and participation in a region or county can have its own effect on the functioning of those governmental institutions needed to sustain higher rates of inter-generational mobility (U. S. Congress, JEC, 2017). Following Rupasingha et al. (2006), this study maintains a distinction between community and political capital.
Friendships
Granovetter (1973, 1974, 1985, 1992) and Lizardo (2006) theorize that “weak” ties within a social network offer a better bridge to the outside world than “strong” ties that bind individuals together within a cohesive but closed social network. Such bridges are especially important for young people as they transition from school to higher education and to the workplace. In The Adolescent Society, Coleman (1961) found that high school students care more about peers than about teachers, grades, and coursework. Later, Coleman et al. (1966) found that the achievement of black students was positively affected by the presence of white peers. This finding provided the scholarly underpinning for the school desegregation movement during the subsequent decade (Rivkin & Welch, 2006). However, some studies of friendship patterns in high school that find high-performing students from disadvantaged backgrounds struggling socially when attending schools in communities with high concentrations of disadvantaged students (Ferguson et al., 2001; Fryer, 2006). Chetty et al. (2022) estimate the relationship between cross-class friendship capital and mobility both among high school students and among adults. They label cross-class friendship capital Economic Connectedness (EC), “the extent to which different types of people (e.g.,, high income vs. low income) are friends with each other” (p. 109). They find that county density of cross-class friendships, both at school and as an adult are correlated with county inter-generational mobility rates.
Student Achievement
A deep literature finds strong relationships between student achievement and attainment and adult outcomes. The number of years of schooling, the completion of high school, college enrollment and degree attainment all predict future earnings, employment rates, household wealth, and other socio-economic outcomes (Becker, 1964; Becker & Chiswick 1966; Jencks, 1979; Mincer, 1975). Student performance on standardized tests in math and reading in eighth grade predicts high school graduation, college attainment, future earnings, teenage pregnancy rates, physical and mental health, and political participation (Borghans et al., 2016; Chetty, Friedman, & Rockoff, 2014). Also, nations that show higher average levels of student achievement enjoy faster rates of economic growth (Hanushek & Woessmann, 2008, 2012). The subsequent analysis treats student achievement as a moderator that links various forms of social capital to inter-generational mobility.
Data and Measurement
Inter-generational mobility, the four forms of social capital, student achievement, and several control variables that capture the existing system of social stratification are measured at the county level.
Inter-generational Mobility
Chetty et al.’s (2022) estimates of inter-generational mobility, taken from U. S. tax records, is the best available county-level indicator of relative inter-generational mobility in the United States. It estimates the percentile of the income distribution of those born into households at or below the 25th percentile of the income distribution. Notice that the index captures the mobility of the disadvantaged segment of the population, not the mobility of the county’s total population. The index tells us what kinds of counties provide the greatest opportunity for those born into low-income households to achieve higher relative income levels.
Family Capital
Following JEC, an index of county-level family capital is constructed by extracting the first principal component from a matrix of the following county-level variables: (a) share of births in 1982 to women who were married, (b) 1980 share of households with a married couple, and (c) share of own children living in a single parent home (Table A1). The weights of the three variables load on the first principal component at 0.56, 0.59, and −0.58, respectively. The first principal component captures 93% of the variance.
Community Capital
Most measures of community capital are available only at the national level (Alesina & La Ferrara, 2000; Lee & Kim, 2013; Legatum Institute Foundation, 2017; National Conference on Citizenship, 2006), but JEC (2017) has compiled several county-level indices. This study uses a date-appropriate version (see timing discussion below) of JEC’s community health index. The index includes indicators of a county’s density of religious congregations and its density of secular non-profit organizations. See Table A1 for details.
Political Capital
A group of scholars at Pennsylvania State University, has constructed a political trust index for counties within the United States, which is referred to as the Penn State index. (Rupasingha et al., 2006). This county-level index is based upon county-level measures of electoral participation rates and responsiveness of citizens to requests from the U. S. Bureau of the Census to mail in household demographic information. Chetty et al. (2022, Extended Data Table 2) shows a 0.06sd bivariate correlation between the Penn State index and inter-generational mobility. This study constructs a similar index for the period when the relevant cohorts were in high school and transitioning from adolescence to adulthood. See Table A1.
Cross-Class Friendships
Chetty et al. provide county-level measures of adult and school-age cross-class friendships. They measure adult friendships by doubling the average percentage of friendships of a Facebook user from below median socioeconomic (SES) backgrounds in the county who are friends with users from above median SES backgrounds. The measure makes use of 2022 “data on the social networks of 72.2 million users of Facebook aged between 25 and 44 years to construct . . . new measures of social capital for each [county and] ZIP code in the United States (p. 108).” Chetty et al. report a bivariate relationship between county density of cross-class friendships and county-level inter-generational mobility rates for both adults and high school students. Their student friendship indicator is constructed from recollections reported on Facebook of friendships that extend back to high school.
Student Achievement
Data on student achievement is from the Stanford Education Data Archive (SEDA) which contains mean county-level student test performances in math and reading in grades 3 through 8 on a common scale for the school years between 2008/2009 and 2017/2018 (Reardon et al., 2021). This paper’s preferred model uses math rather than reading scores, as prior research suggests the economic returns to math skills are larger (Hanushek & Woessmann, 2008, 2012), but similar results are observed for reading. Specifications either report county mean performance of all students or mean performance of students from disadvantaged backgrounds, as indicated by eligibility for participation in the federal free- and reduced-price lunch program. Results remain much the same regardless of the indicator used. Using math achievement for all years 2009 through 2018 provides a preferred, long-term achievement indicator; other specifications use achievement just from 2009, the year most proximate to the time when the cohort of interest was in school. Results do not depend on this analytical decision.
County-Level Control Variables and State Fixed Effects
This study controls at the county level for variables that are major components of the existing social stratification system: median income, parental education, racial composition, racial segregation, and the Gini index of inequality.
Inclusion of state fixed effects holds constant unobserved social, cultural, institutional and other differences among the states that could account variation for differences in mobility among states. This greatly reduces the likelihood of attributing variation in mobility to social capital that could be due to unobserved factors. However, the amount of observed variation is limited to the one-third of total variation in mobility that is observed within states. As a robustness check, one specification excludes state fixed effects.
Relationships are estimated using county-level data. Although relationships are usually best estimated at the individual-level, data limitations preclude that option, and, when estimating social capital effects, there are substantive reasons to choose the county as the level of analysis. Social capital spills across adjacent spaces, making larger units more appropriate for analyses than zip codes or census tracts or individuals abstracted from their social environments (Durlauf & Fafchamps, 2005).
The number of available county observations is limited to those Chetty et al. (2022) made available data for measuring inter-generational mobility and friendship patterns. That study includes information for the 1818 (of 3148) counties in the United States that have two or more census tracts and a population of more than 20,000. Smaller counties are excluded because racial and income segregation cannot be reliably estimated in these areas. The 1333 counties included in the preferred Model (Table 3, Model 1) are identical to those used by Chetty et al. (2022) except that adding the community index drops 341 counties, the political index 138 observations, the family capital index three observations, the school friendship variable one observation, and including achievement for disadvantaged students drops three observations. Results do not change significantly when alternative models include additional counties.
Timing
Researchers presume a degree of stickiness of a decade or more in social capital. Both JEC and Penn State indices are built with variables that span nearly a decade. The JEC social capital index and Putnam’s index correlate across states at the 0.81 level, even though Putnam’s data comes from the second half of 1970s through the first half of 1990s and the JEC index comes from 21st century data (JEC, 2017, Table 4, p. 32). Chetty et al. (2022) assemble indicators of friendship capital in 2022 from a generation of Facebook users (those aged 25–44) to predict mobility measured in 2015. The study uses them to explain the mobility of those born from 1978 to 1983.
Subject to data availability, each kind of social capital is estimated with data obtained at the time most proximate to the point in the life cycle when those born between 1978 and 1983 are especially likely to benefit from it. Data on family capital is for 1980 to 1982, when the cohort was no more than four years of age, a period when parenting is especially crucial for the formation of human capital (Heckman, 2006). Community capital is measured around 1990, when the cohort, aged 7 to 12, reaches the cusp of adolescence when religious and secular community institutions can be expected to play a role in the life of a maturing child. Political capital index is constructed from data obtained for the years 1988–1996, when the cohort is as young as 5 and as old as 18, again a period when trust and engagement in political institutions might be of special significance to a young person. Data availability precludes a measure of student achievement before 2009, when even the youngest members of the cohort have finished school. That requires the assumption that county levels of achievement do not vary by much over the course of decades. In a robustness check, math achievement in 2018 predicts inter-generational mobility nearly as well as math achievement in 2009. School friendships capital, drawn from Chetty et al. (2022), is based on recollections in adulthood of friendships in high school.
Summary Statistics and Matrix of Inter-Correlations
Summary Statistics of County-Level Measures in the Sample of 1333 Counties.
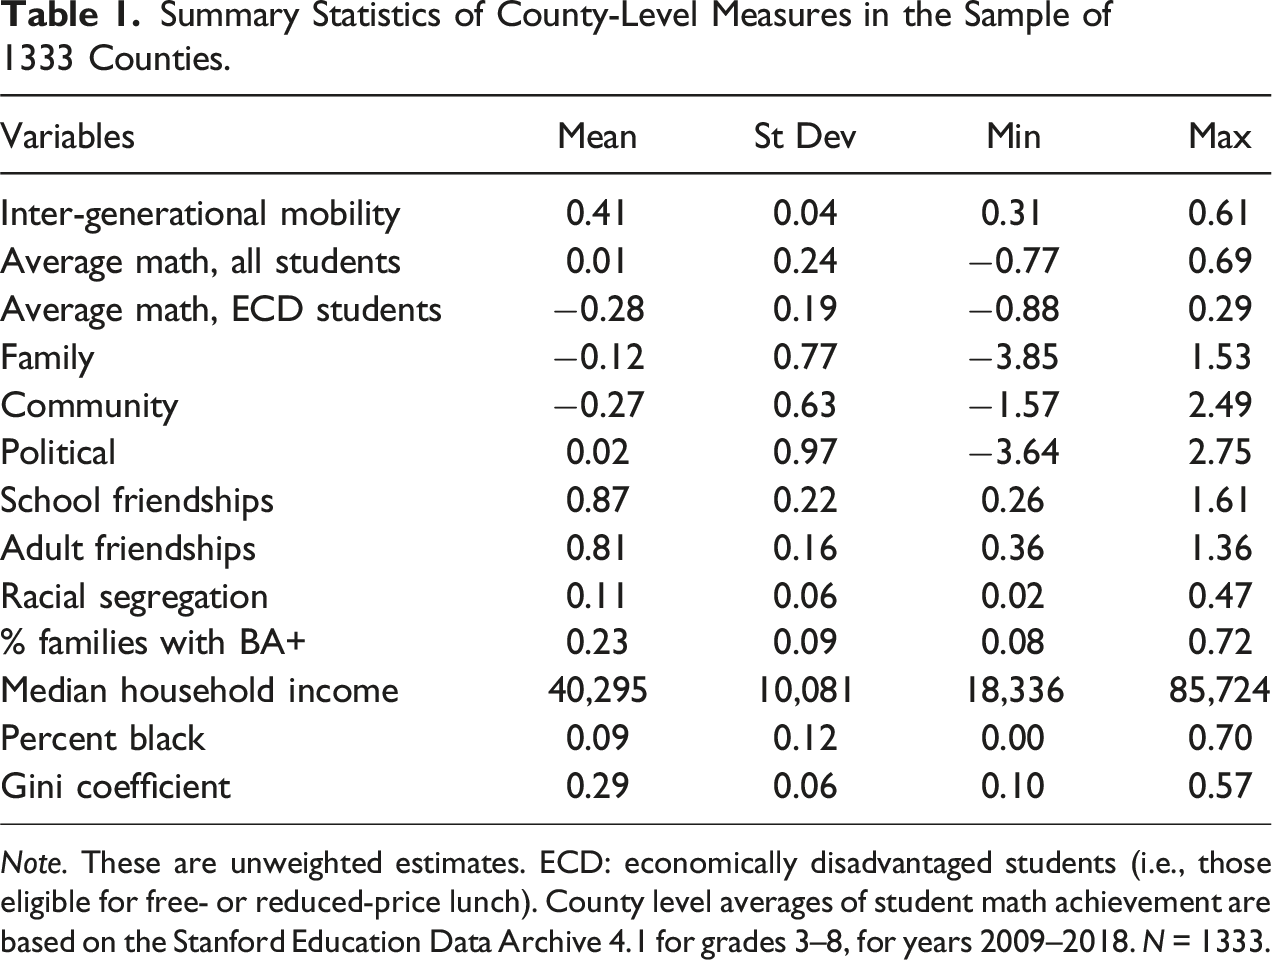
Note. These are unweighted estimates. ECD: economically disadvantaged students (i.e., those eligible for free- or reduced-price lunch). County level averages of student math achievement are based on the Stanford Education Data Archive 4.1 for grades 3–8, for years 2009–2018. N = 1333.
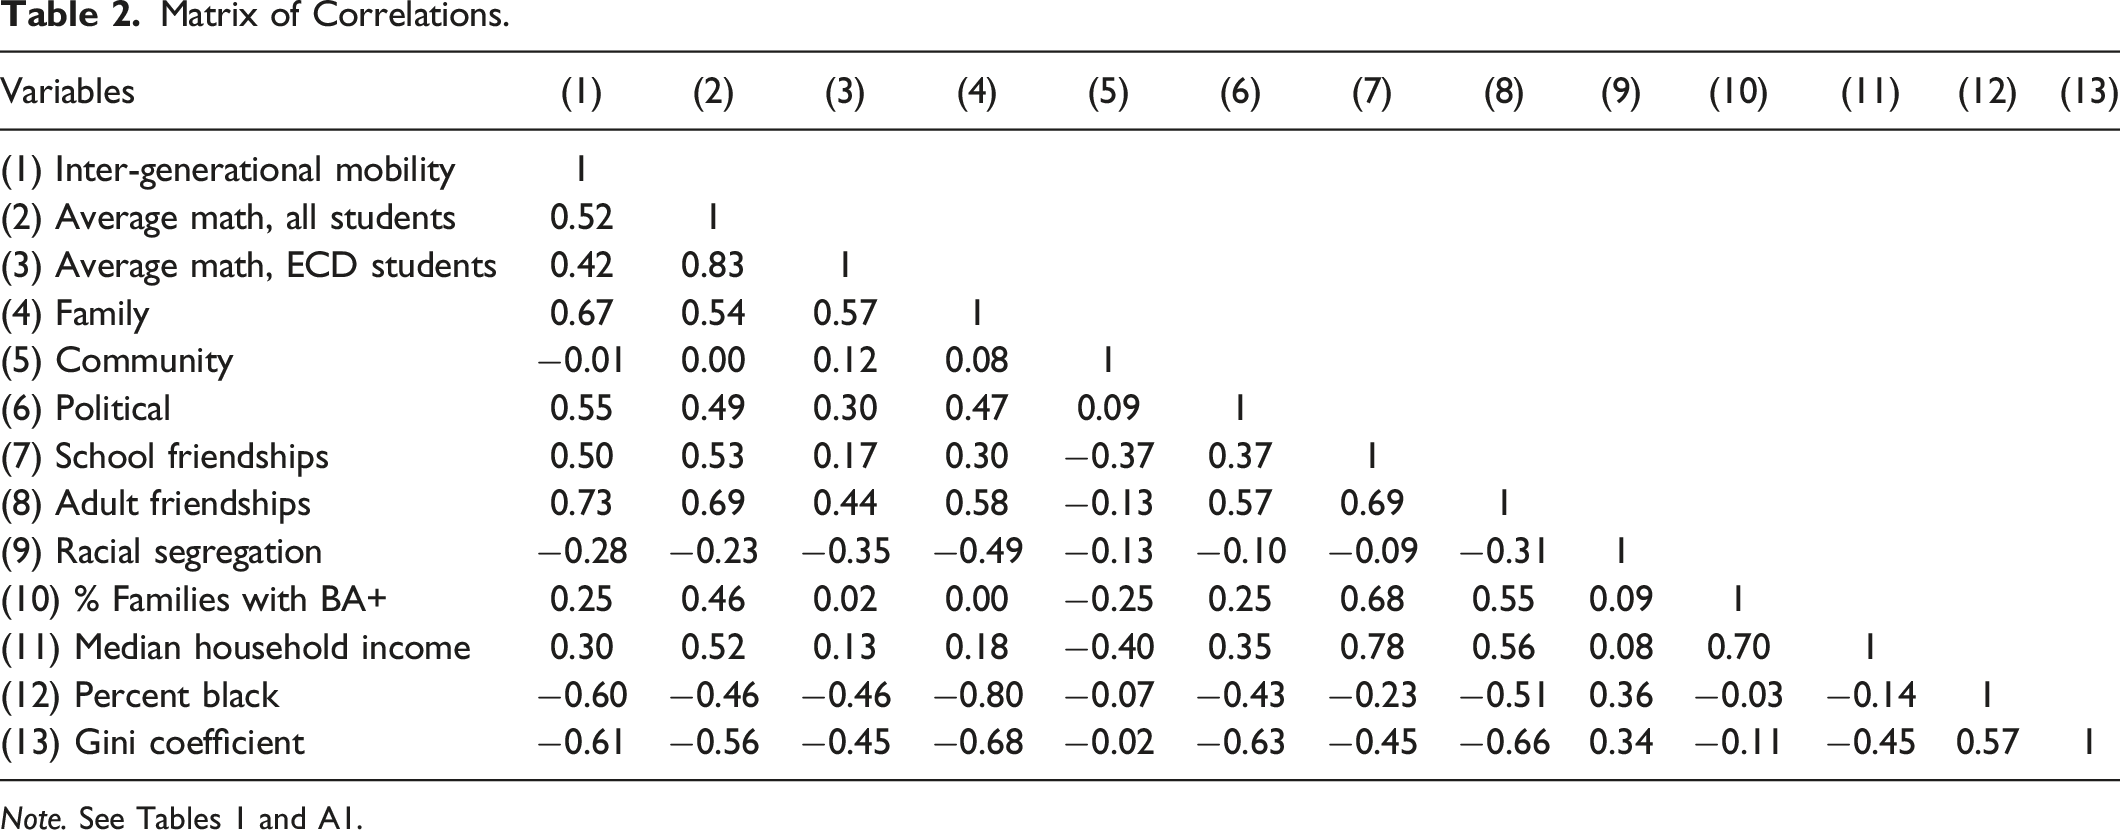
Matrix of Correlations.
Analytic Models
In the preferred estimate of the determinants of inter-generational mobility (Table 3, Column 1) this outcome is regressed on county-level indices of the four forms of social capital, math student achievement, and the control variables that capture the social stratification system, as identified above. Preferred estimates are unweighted and include state fixed effects, cs. Standard errors are clustered by state. Table 3, Column 1 displays results from the following equation
In one specificiation, the achievement variable is for economically disadvantaged students. In Table 4, the regression equations add the moderator adult-friendships variable to Equation 1. In subsequent tables, the regression equations for the determinants of adult-friendships, school friendships, and student achievement are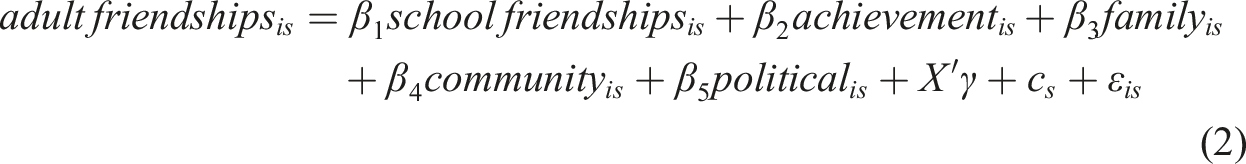


Results
Predictors of Inter-generational Mobility.
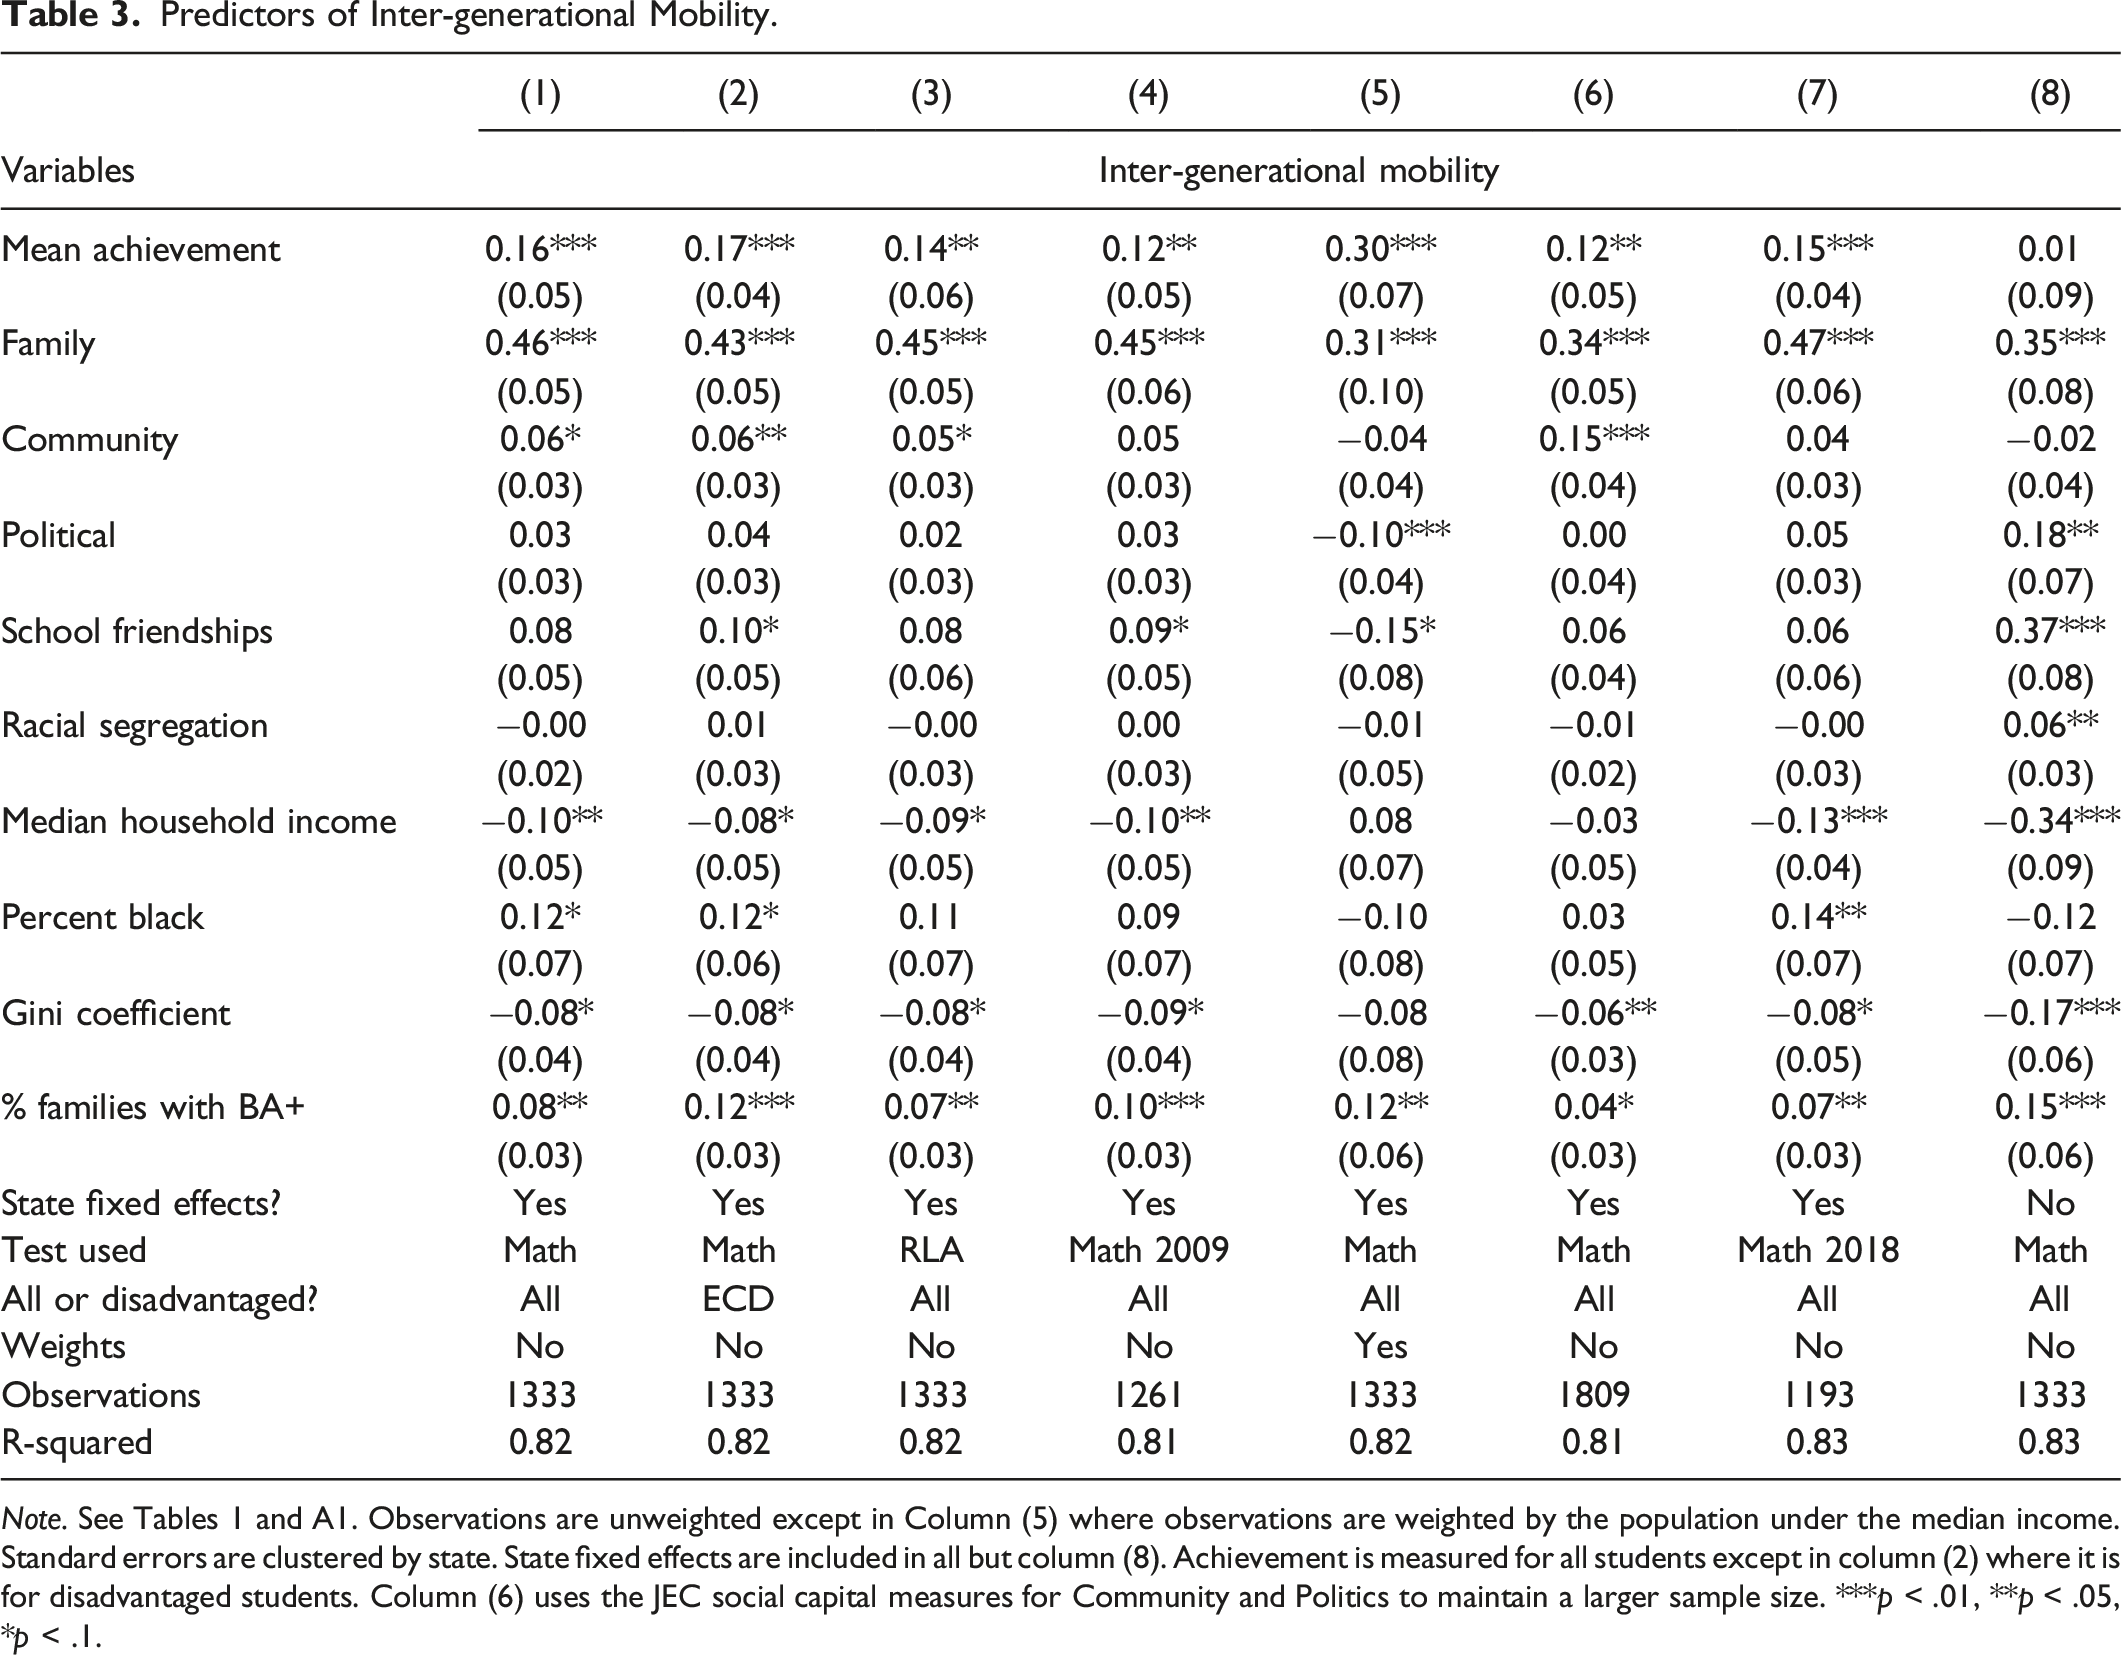
Note. See Tables 1 and A1. Observations are unweighted except in Column (5) where observations are weighted by the population under the median income. Standard errors are clustered by state. State fixed effects are included in all but column (8). Achievement is measured for all students except in column (2) where it is for disadvantaged students. Column (6) uses the JEC social capital measures for Community and Politics to maintain a larger sample size. ***p < .01, **p < .05, *p < .1.
Predictors of Inter-generational Mobility, Including Adult Friendships.
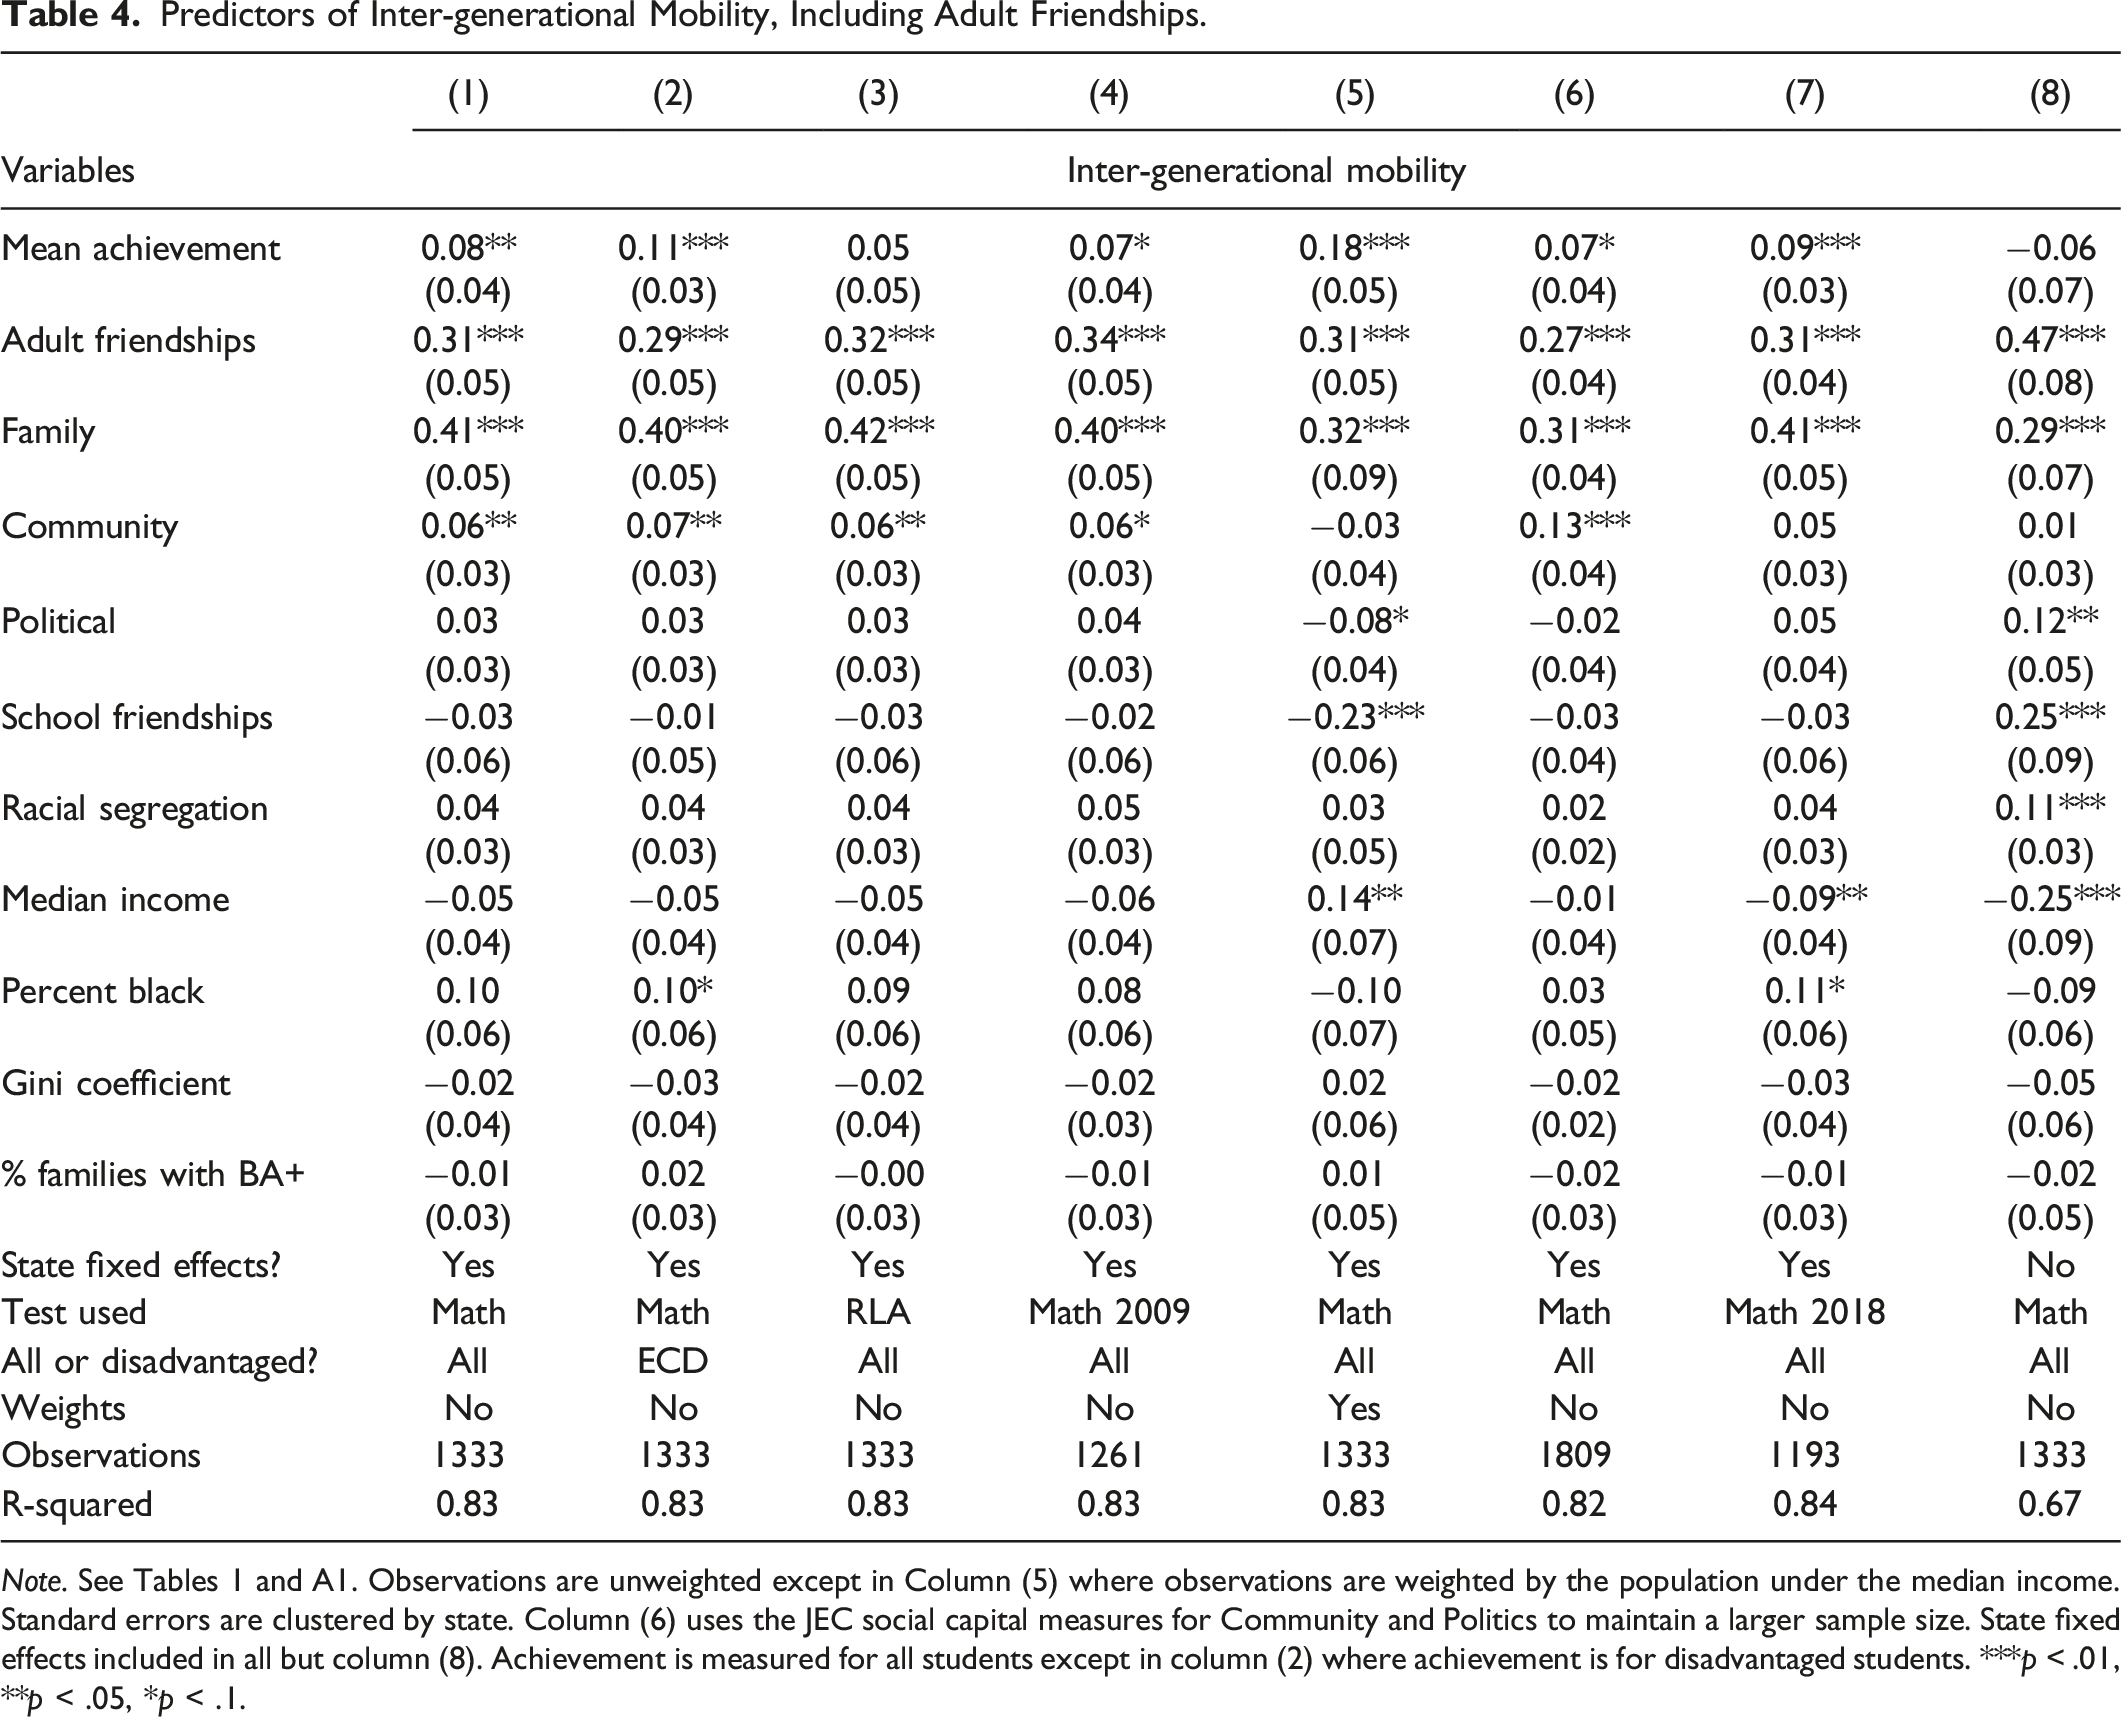
Note. See Tables 1 and A1. Observations are unweighted except in Column (5) where observations are weighted by the population under the median income. Standard errors are clustered by state. Column (6) uses the JEC social capital measures for Community and Politics to maintain a larger sample size. State fixed effects included in all but column (8). Achievement is measured for all students except in column (2) where achievement is for disadvantaged students. ***p < .01, **p < .05, *p < .1.
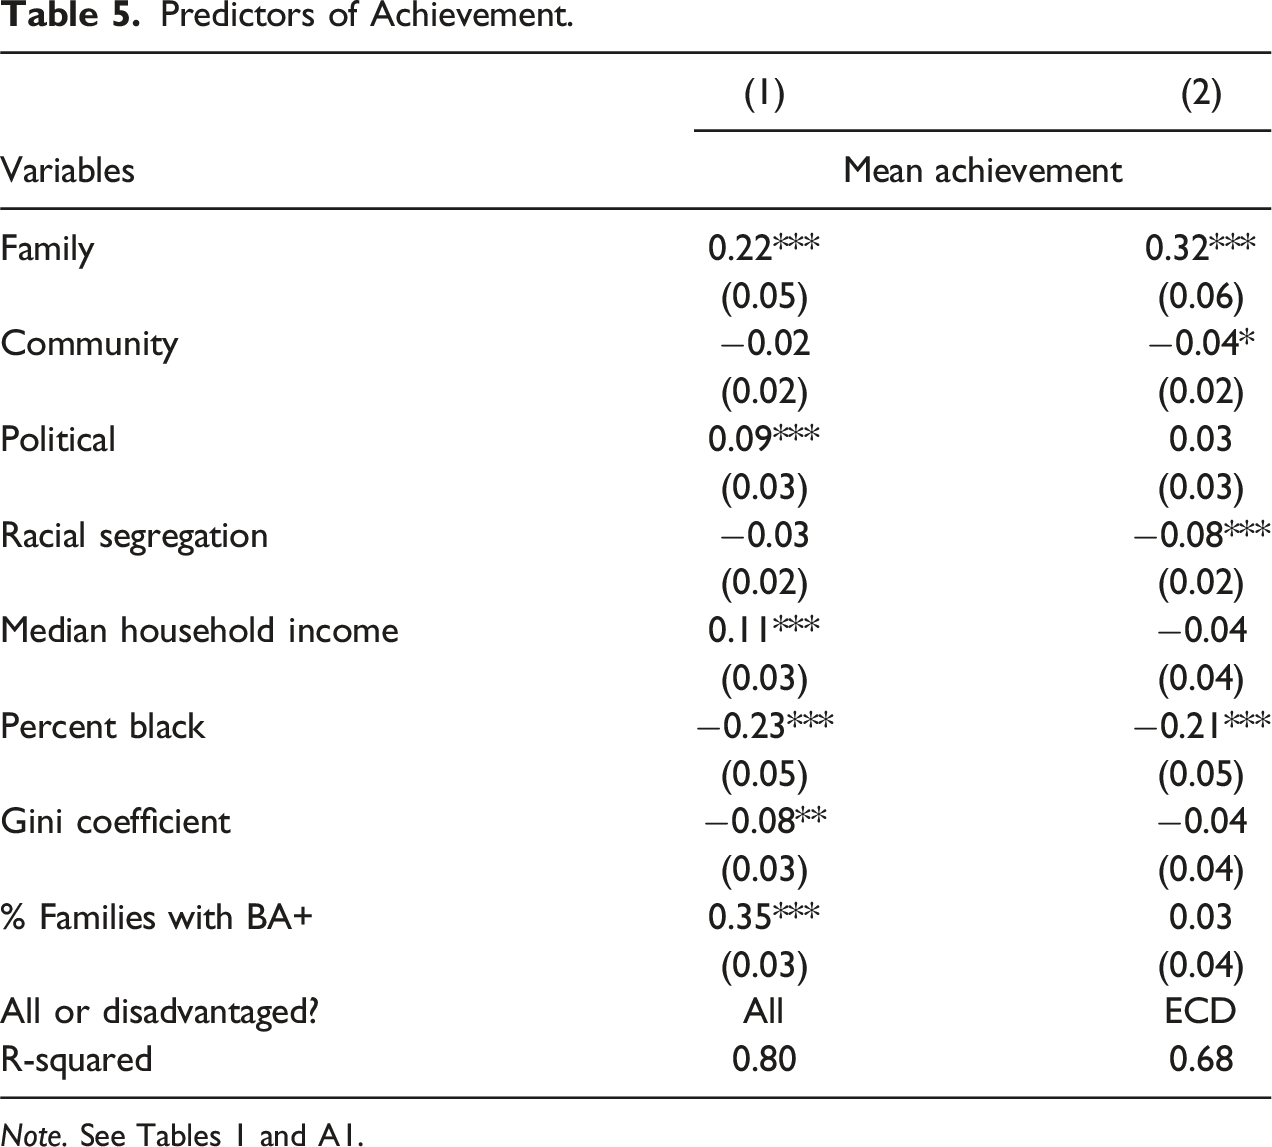
Predictors of Achievement.
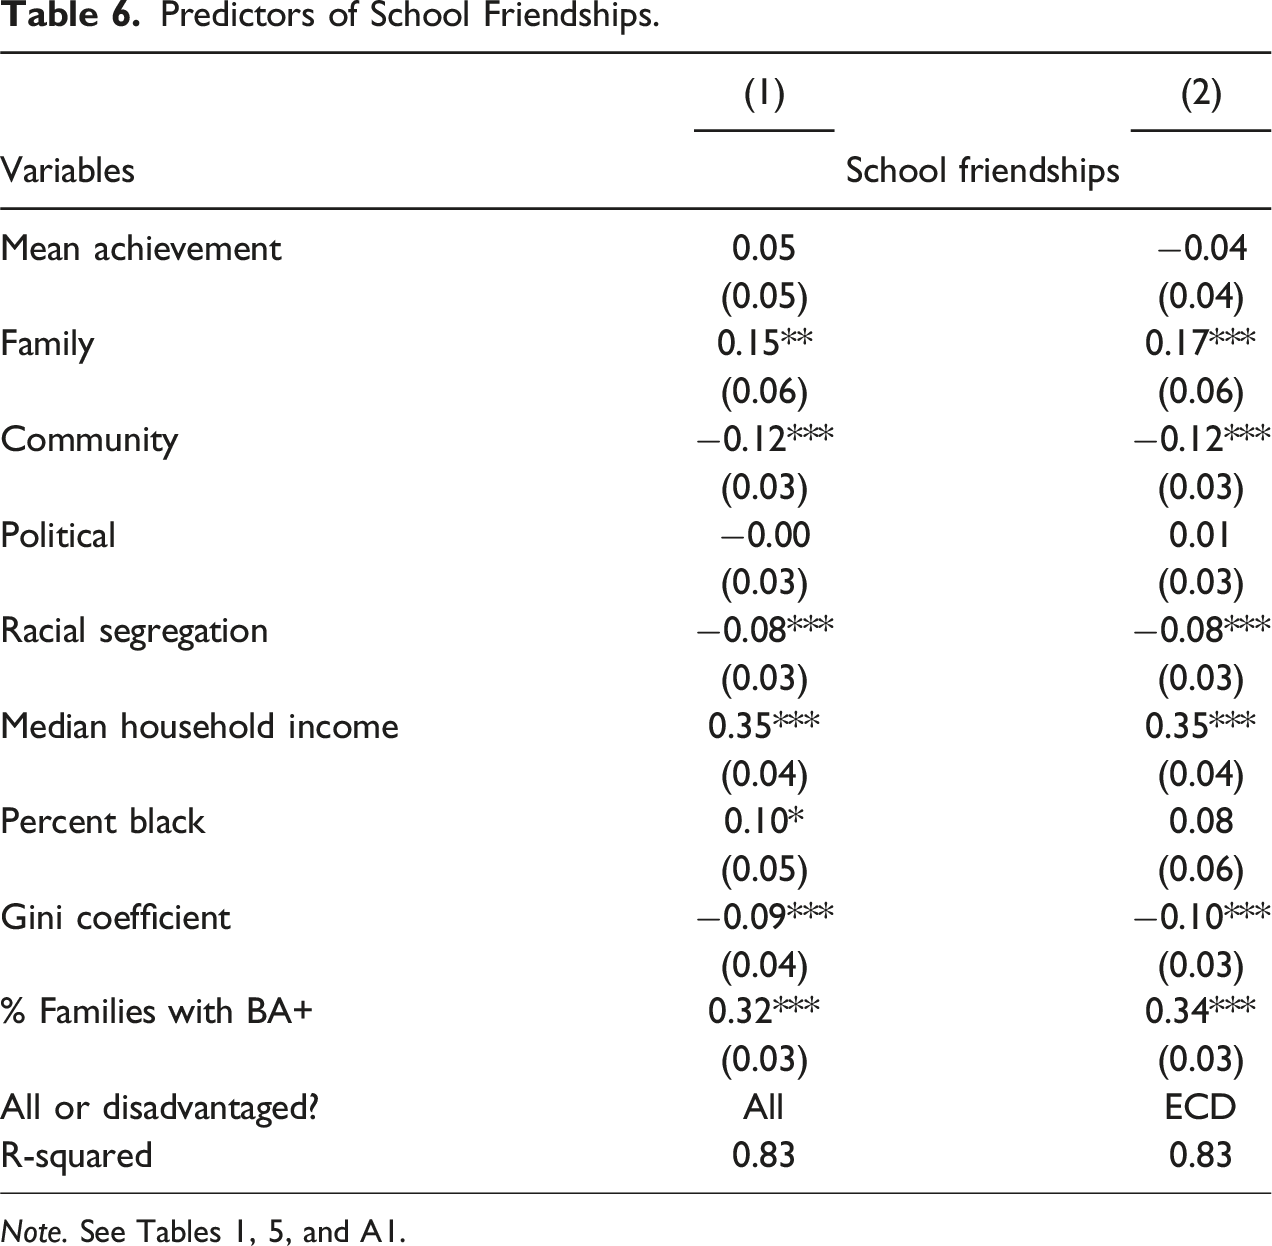
Predictors of School Friendships.
Determinants of Inter-generational Mobility
Table 3 reports results that estimate the relationship between various forms of social capital and inter-generational mobility. Column 1, the preferred model, estimates achievement for all students. Results show a strong connection relationship between family capital and inter-generational mobility (0.46). Student achievement (0.16) and community capital (0.06) are also statistically significant. Political capital and school friendships are not. Results remain essentially the same when reading achievement is estimated (column 3) and when achievement levels of disadvantaged students are substituted for math achievement of all students (column 2).
So as not to privilege achievement results for any one year, the preferred analysis estimates mobility with the mean math achievement of all students for years between 2009 and 2018. Results do not change significantly when 2009 math results are used (column 4) and, separately, when those for 2018 are employed (column 7). These are the years most and least proximate to when subjects were in elementary and middle school; the stability of the estimates implies that the county-level achievement-mobility correlation may be sticky across decades.
Each county is assumed to provide an independent observation, so counties are not weighed in the preferred analysis. However, Chetty et al. (2022) weight their estimates by the size of the population below the national median income. Column 5 reports results from a similarly weighted model. It shows family capital and achievement to be the only significantly positive predictors, each correlated at the 0.3 level. Political capital has a significantly negative sign.
As another robustness check, the community and political capital indices constructed by JEC (2017) are used in column 6 to measure relationships for 1809 counties, not 1,133, as in the preferred model. The downside to this model is that it requires the assumption that community and political capital measured two to three decades after subjects were adolescents did not change in the meantime. When the additional counties are included (column 6), family capital (0.34), achievement (0.12) and community capital (0.15) all remain significant predictors, though the size of the correlation shifts somewhat. Two inferences may be made: (1) results are not substantively affected by variation in county sample size; and (2) community capital is sticky across these decades.
When state fixed effects are dropped from the estimation (column 8), a number of estimates shift. Family capital remains a strong predictor (0.35), but neither community capital nor achievement are significant. Meanwhile, political capital (0.18) and school friendships (0.37) emerge as statistically significant predictors. The coefficients for several control variables—household income, parental education, the Gini coefficient, and racial segregation—also increase in value and become statistically significant. Very likely, both the social stratification system and unobserved factors vary more between states than within them. Similarly, political capital and cross-class school friendships vary more across than within states. The impact of unobserved inter-state characteristics likely clouds the role played by communities and student achievement in model 8. However, the importance of family capital remains durable.
Adult Cross-Class Friendships
Adult cross-class friendships may be moderators or they could be a consequence of mobility, or both. The models in Table 4 assume adult friendships serve as a moderator—at least in part. Otherwise, all models are identical to those in Table 3. The five key take-aways to be gleaned from Table 4 are as follows: 1) Family social capital remains as robust a
predictor of mobility as in Table 3, which suggests that adult friendships do not moderate its relationship with inter-generational mobility. (2) Coefficients for cross-class friendships in adulthood are both statistically significant and sizeable in all models, but they do not add much to the amount of variance explained (see R-squared in Tables 3 and 4). This suggests that the friendship patterns may be moderators, but they are unlikely to be causal variables that act independently from what has preceded them in the life cycle. (3) The relationship between achievement and mobility attenuates by about one-half, which implies that higher levels of achievement facilitate adult cross-class friendships, which then may contribute to inter-generational mobility. (4) The correlation between community capital and mobility does not change significantly from that shown in Table 3, which implies adult friendships are not a bridge that links community effects to mobility. (5) The relationship between high school friendships and mobility attenuates, implying that cross-class friendships in high school facilitate adult ones, which then facilitate mobility.
Achievement
Achievement may also be interpreted as a mediating variable that helps to link family and community capital to mobility. As can be seen in Table 5, the density of family capital predicts county math achievement for all (0.22) students and, especially, for disadvantaged (0.32) ones. Community capital has little effect, a surprise for scholars, like Putnam (2016), who attribute widening achievement gaps to a decline in community organizations. However, the achievement measured here is for students in elementary and middle school, not high school when community organizations—whether they be scouts, sports teams, choirs, or religious activities—may be more important for outcomes. Political capital, though shown to have no significant connection to mobility or to school friendships, has a significant (0.09) relationship with the achievement of all students, though not with that of disadvantaged ones. A politically trustful community seems to enhance school quality, though the county residents may be more trusting of institutions when schools are more effective.
School Friendships Capital
School friendships capital may also serve as a moderator. Family capital (0.15) predicts cross-class friendships in high school (Table 6), which may imply that bridges across class lines are facilitated by the social and emotional learning that takes place within the family. Achievement has no effect on high school friendship patterns (Column 2), a result that supports findings of earlier studies of friendship patterns in high school, which found no consistent relationship between achievement and friendship patterns (Coleman et al., 1966; Ferguson et al., 2001; Fryer, 2006). Unexpectedly, community (−0.12) capital, far from facilitating friendships in high school, displays a significant negative relationship. The minus sign persists whether one measures achievement of all students or just disadvantaged ones.
Diagram of Relationships
The model displayed in Figure 1 is presented for didactic purposes, not to make a claim that a causal model has been described. It assumes that family, community, and political capital are independent of one another, but all affect inter-generational mobility, and the relationship is potentially moderated by student achievement and high-school friendships. In other words, relationships flow from left to right. A tabular summary of the direct, indirect and total effects displayed in the figure is given in Table 7. Total Social Capital and Achievement Relationships With Inter-Generational Mobility (Excluding and Including Adult Friendships). Note. See Figure 1. Estimates of direct effects are the coefficients directly linking variables to mobility. Indirect estimates are the sum of the interactions between variables in the other pathways (e.g., in column 2 based on Figure 1 the indirect effect of family on mobility 0.04 = (0.22*0.16). Figure 1 shows pathways when adult friendships capital is excluded. Pathways including adult friendships are not shown but can be calculated from results reported in Tables 3–6.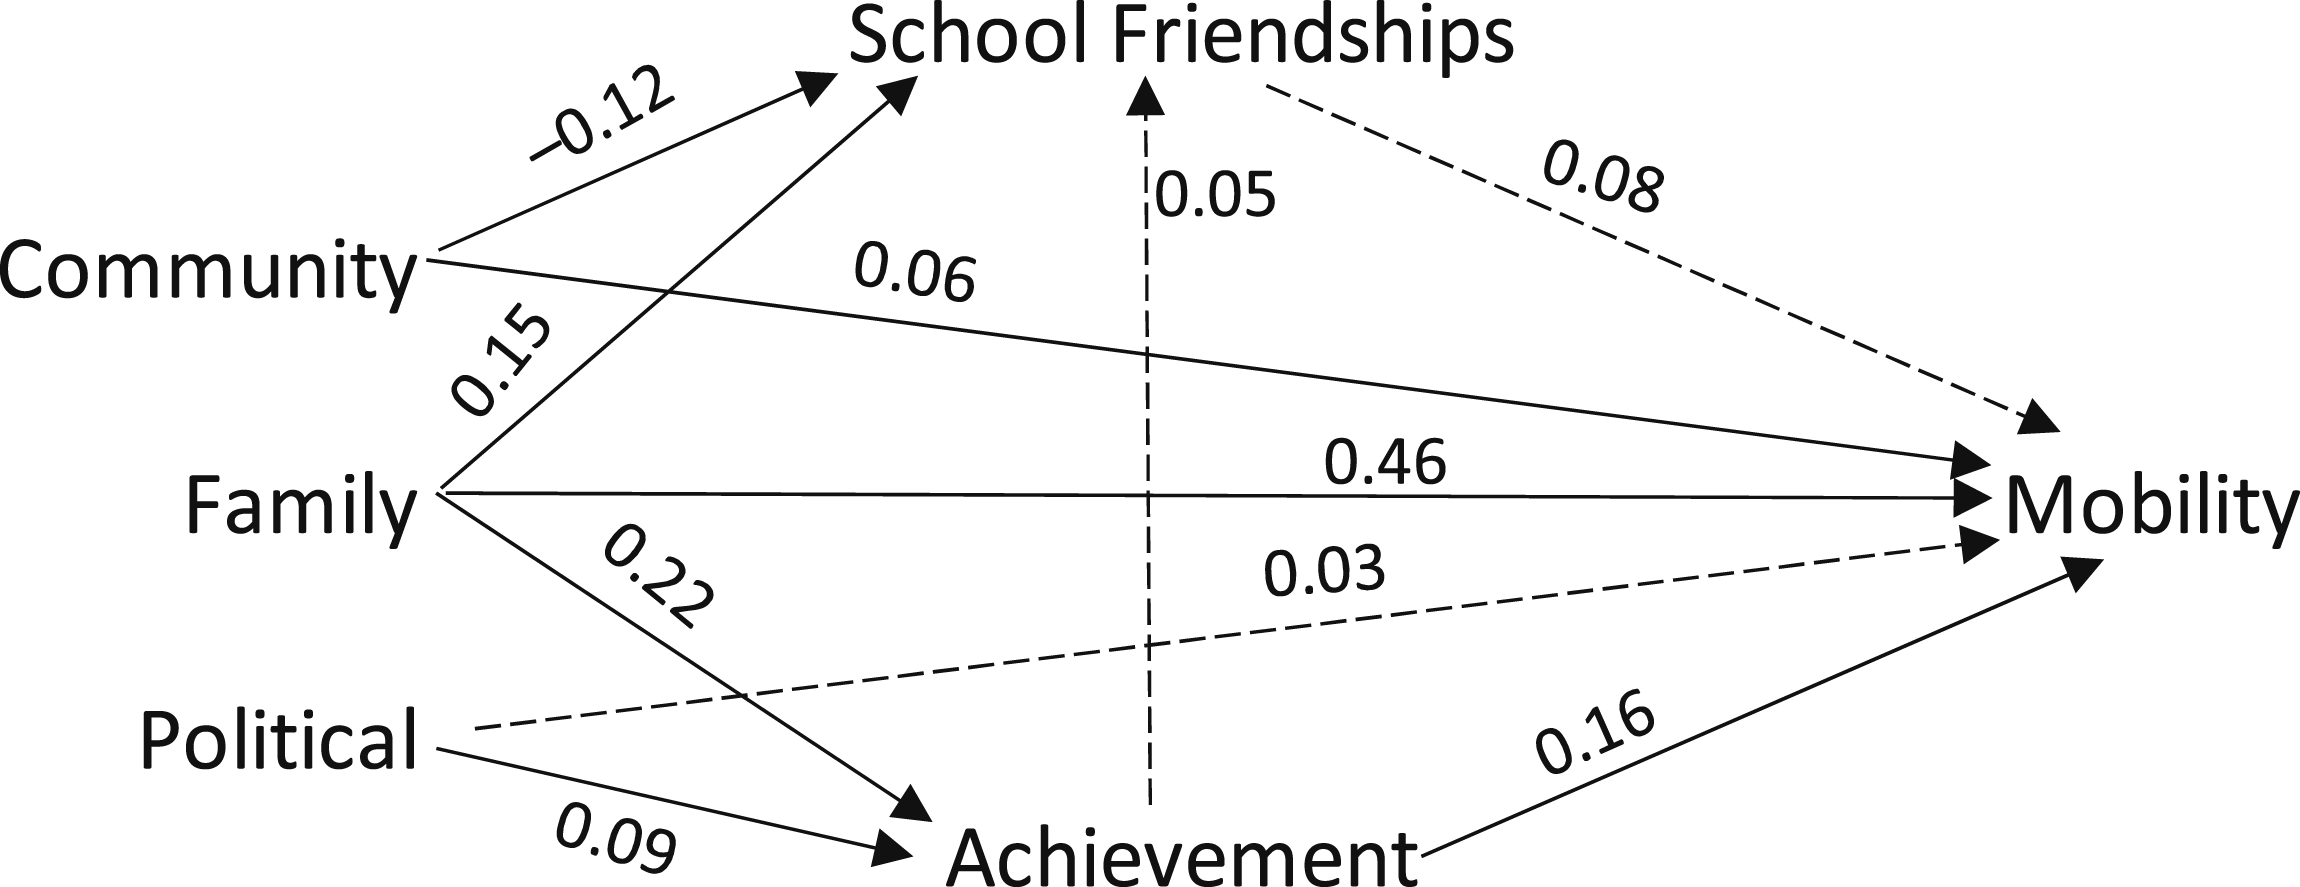
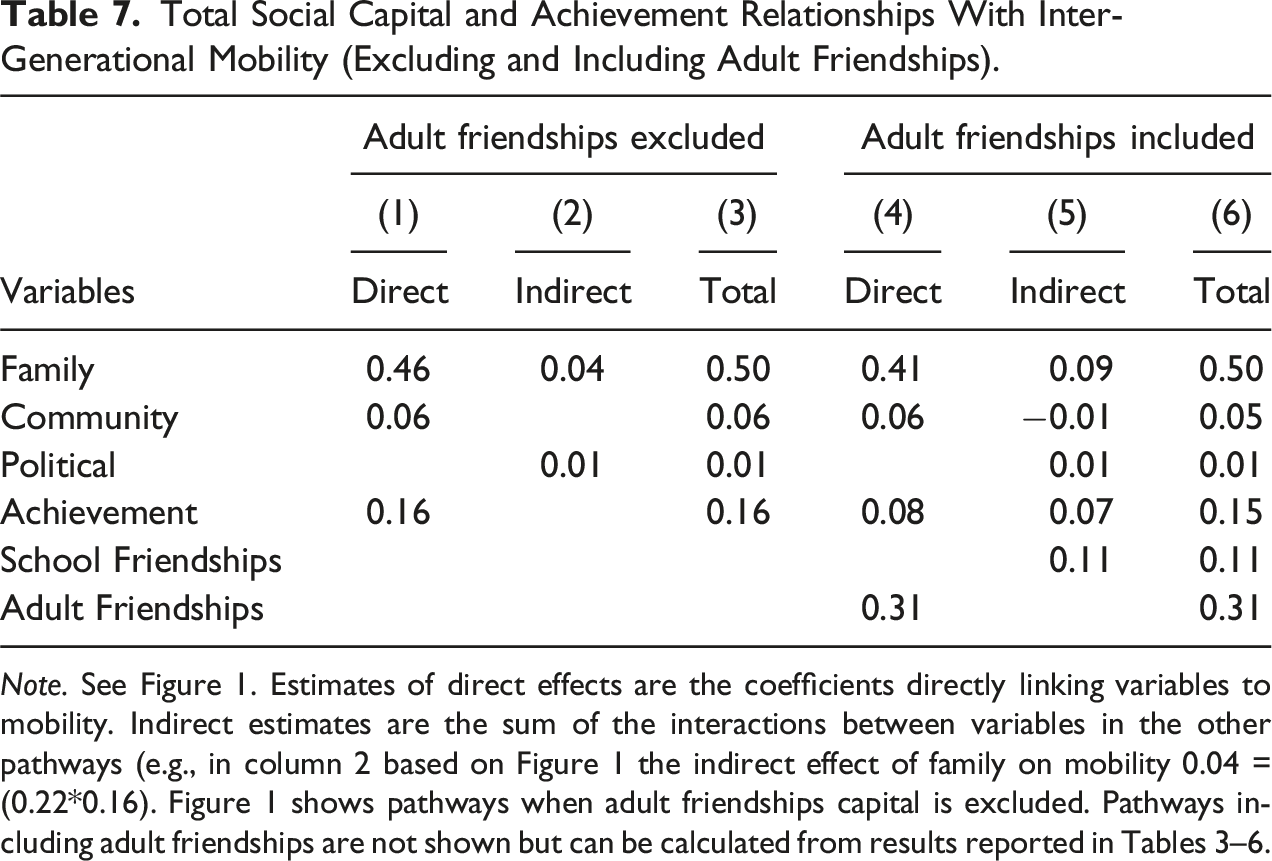
The diagram in Figure 1 suggests that counties which encourage marriage and the formation and persistence of dual-parent households are places that foster inter-generational mobility. The combined direct and indirect relationship between families and mobility is 0.50 (Table 7), by far the largest and robust relationship observed. Where marriages and two-parent families thrive, disadvantaged young people may be more likely to obtain the skills and develop the capacities that give them the opportunity to climb the opportunity ladder. Community capital has a total 0.06 relationship to mobility. This effect is not mediated by either student achievement or school friendships capital. Instead, community organizations seem to create some opportunities for mobility as a young person emerges from school and enters the broader community. The relationship between student achievement and income mobility (0.16) is direct. If one acquires the needed skills in school, one is better equipped for a college or a career. Political capital has a minor impact on mobility. No significant effects are observed for high school friendships.
Table 7 includes estimations of the direct and indirect effects of the forms of social capital both when adult friendships are and are not assumed to be a moderating variable (0.31). Its inclusion as a moderator does not materially alter the total contributions of other forms of capital. When it is included, total (direct and indirect), effects are the same for family capital (0.5), slightly smaller for achievement (0.15), modest for school friendships capital (0.11), slightly smaller for community capital (0.05), and still insignificant for political capital (0.01).
Adult Friendships: Moderator or a Consequence?
Chetty et al. (2022) find a fairly high correlation between inter-generational mobility and adult cross-class friendships. They interpret the correlation as showing a causal relationship, but it is more likely to be either a byproduct of mobility or a moderator that links mobility to factors that appear earlier in the life cycle—family, community, and student achievement. Or it could be both, partially moderating other relationships and partially a consequence of mobility. However, neither school nor adult friendships appear to moderate the relationship between family capital and mobility (Table 7). Nor does the indicator of adult friendships enhance the amount of variance explained beyond what can be explained by its life-cycle antecedents. Adult friendships are at best a moderator, not a factor that operates independently of events taking place earlier in the life cycle.
Conclusions
County density of family capital, as proxied by an index of marriage and dual-parent household rates, has a strong, durable relationship with county rates of inter-generational mobility. Community capital, as indicated by density of civic and religious organizations, plays a comparatively modest role and political capital (proxied by an index of political trust and civic engagement) is quite unimportant. County-density of cross-class friendships in high school predict the density of similar type of adult friendships. Student achievement mediates the relationship between family and mobility. All these relationships may or may not be mediated by cross-class friendships formed as one becomes an adult. Whether or not these friendship patterns moderate or are a byproduct of more durable institutions—family, community and schools—does not alter the paper’s central findings.
The evidence supporting these conclusions is descriptive, not experimental. Finding a definitive causal answer to the ways in which social capital and mobility are connected is no easy task—especially when data on county inter-generational mobility rates are available for only one year, 2015. More could be learned were individual-level data available, though social capital is inherently a product of social exchanges that take place in spatial settings.
At the aggregate level, traction might be obtained by exploiting the variation in inter-generational mobility across states. For example, a geographical discontinuity analysis might identify counties at boundaries of some states that differ significantly in inter-generational mobility but are otherwise similar. One might also attempt to find events (disease, disasters, economic collapse) in some counties but not in others, which would facilitate an event study analysis that might allow for causal estimates. If inter-generational mobility trends prior to the event in the treated and control counties are moving in parallel directions, then a marked shift subsequent to a significant event could provide clues to the causal roles of various forms of social capital. Given the findings from this study, an event study analysis should probably look first for events likely to impact the amount of family capital. The COVID-19 shock might be exploited for this purpose, as the event seems to have had major but uneven effects on social and psychological well-being as well as academic performance. Other potential sources of exogenous variation include the following: changes in public welfare policy (welfare and medical provision), child-care benefits, taxation policy), economic shifts (tariff policy, foreign competition, automation), and family laws and practices (abortion).
Chetty’s et al. (2022) conclude that cross-class friendships in school and as an adult are the predominant causes of inter-generational mobility. If so, elite high schools and colleges, advanced placement courses, examination schools, tracking within school, zoning and other land-use policies would be arenas ripe for reconsideration. But it is more likely that friendship patterns are either byproducts of mobility or serve as moderators that link to mobility enduring forces rooted in families, communities, and schools. School libraries, honors assemblies, scouting programs and engaged parents are more valuable, probably, than socially diverse playgrounds and basketball courts. Social, economic, and political elites and others who rank high in social prestige should publicly celebrate, not denigrate, marriage and dual-parent family life styles they themselves typically practice (Kearney, 2023). Status and wealth should be put to the service of community institutions, both secular and religious. Welfare and health care policy should reinforce, not undermine, marriage ties. School boards and state legislatures should design schools that address the needs of the most disadvantaged students. Strong families and cross-class friendships are both desirable but their impacts on mobility are probably not equivalent.
Capacities, habits, and character formed in the home, community institutions, and the school influence inter-generational mobility. Working at different paces and having impacts at various times, these institutions and spaces create ladders of opportunity in a society. Cross-class connections may play a role as well, but this form of social capital hardly dominates the others. Very likely, it is not whom you know, but who you have come to be, that counts most of all.
Footnotes
Acknowledgments
A prior version of this paper was presented before the 80th Annual Midwest Political Science Association conference, April 13–16, 2023, Chicago, and the 45th Annual Association for Public Policy Analysis & Management conference, November 9–11, Atlanta. Michael Boskin, Raj Chetty, David Campbell, William Howell, David McMillon, Robert Putnam, David Sikkink, Martin West, and Scott Winship commented on earlier drafts of this paper. Michael Poor and Antonio Wendland provided administrative assistance. We own any remaining errors.
Author Contributions
Author order is in terms of their contribution to the paper. Each author participated in all stages of the research and preparation of the manuscript.
Declaration of Conflicting Interests
The author(s) declared no potential conflicts of interest with respect to the research, authorship, and/or publication of this article.
Funding
The author(s) disclosed receipt of the following financial support for the research, authorship, and/or publication of this article: The Program on Education Policy and Governance at Harvard University supported the project through Walton Family Foundation grant #00107915.
Ethical Statement
Data Availability Statement
Data and code for this article is held by the authors of the study. Queries can be made by sending an email to the corresponding author.
Appendix
Definitions of Variables Used in Analysis.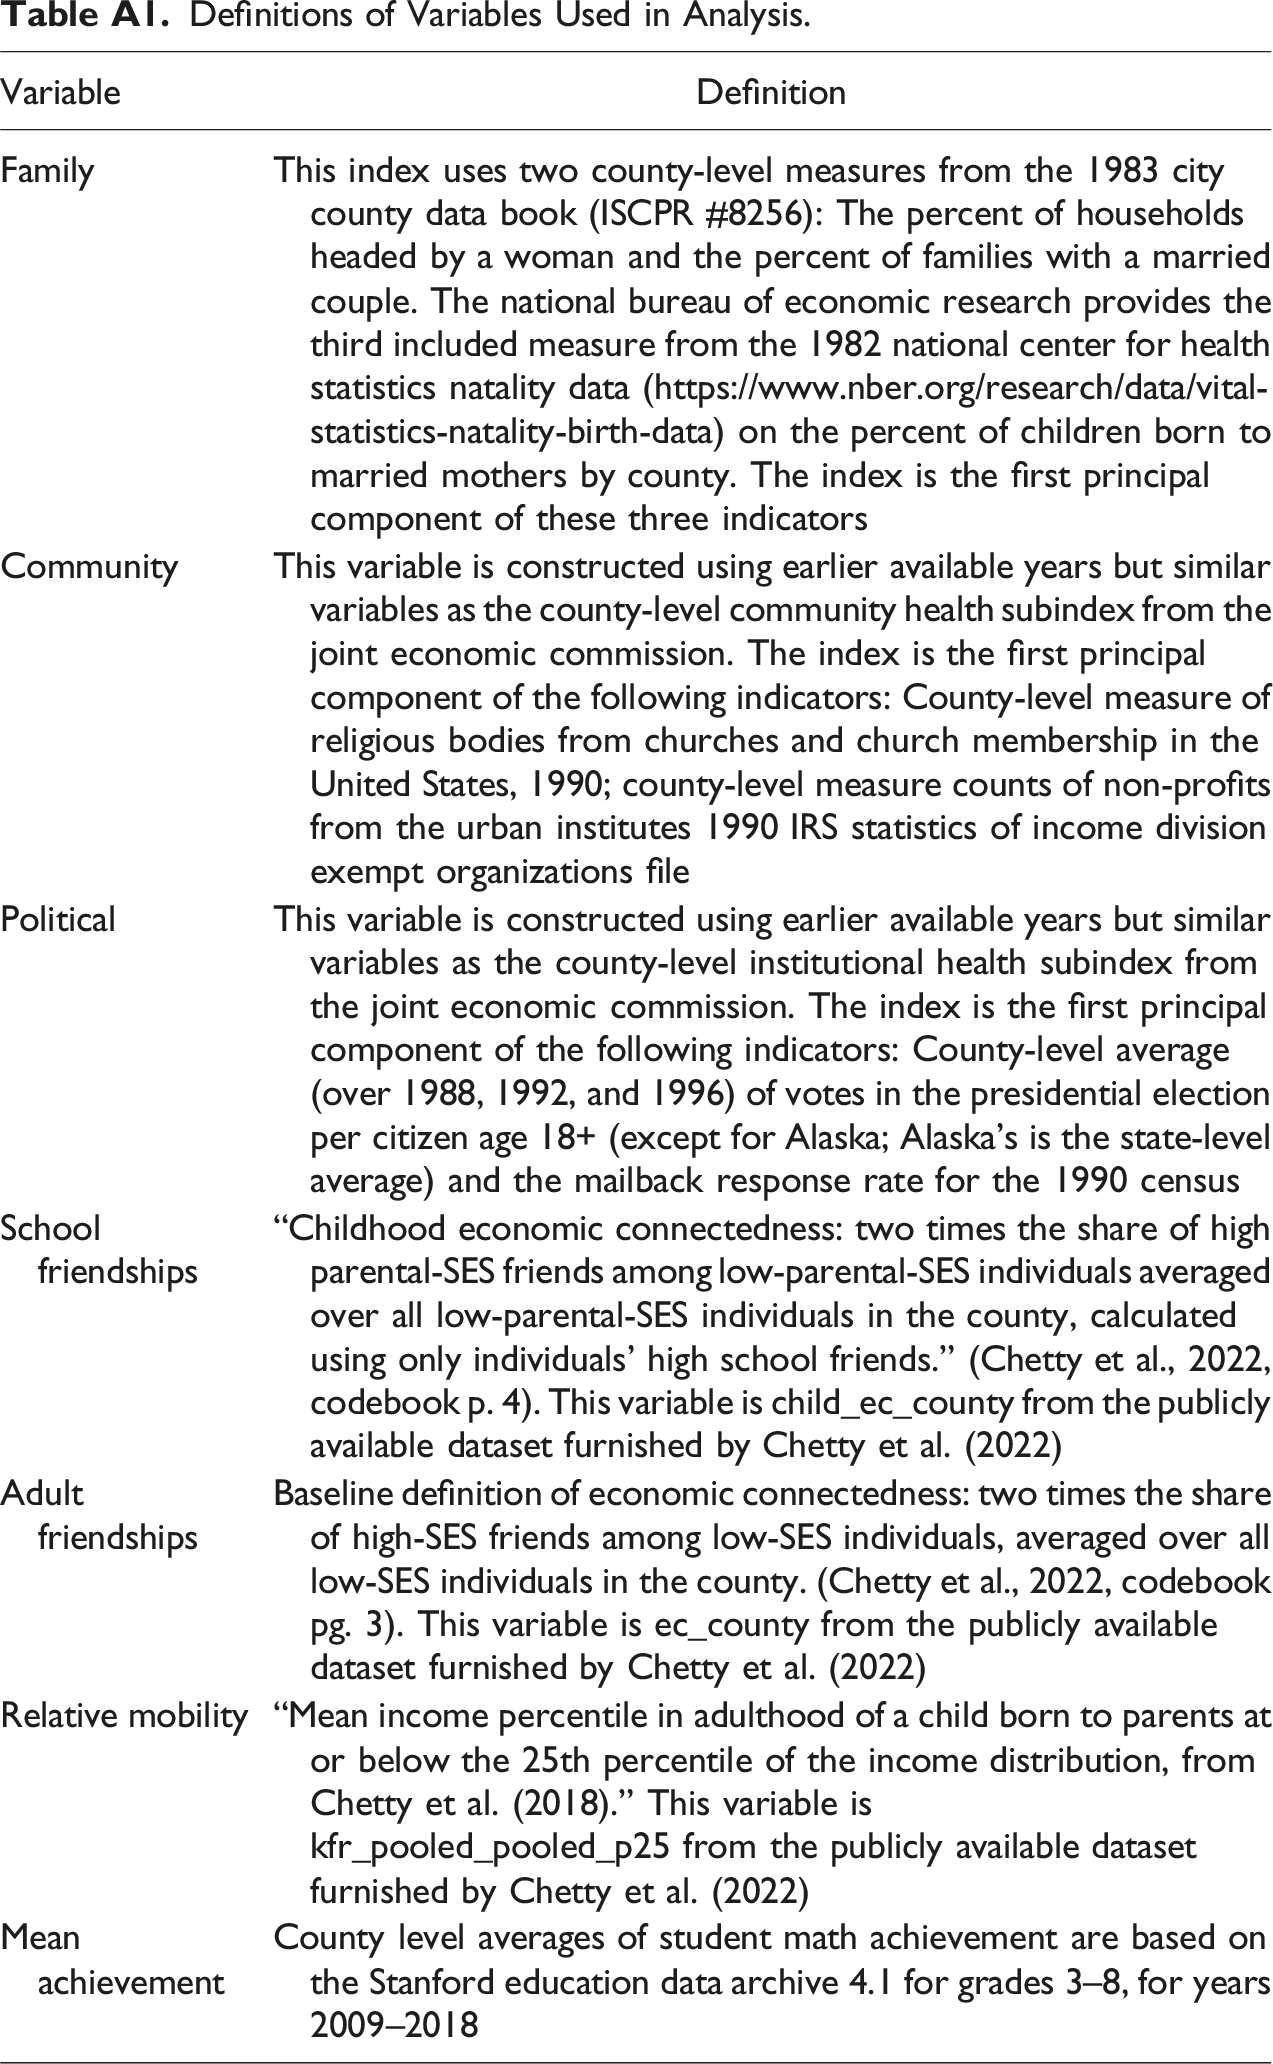
Variable
Definition
Family
This index uses two county-level measures from the 1983 city county data book (ISCPR #8256): The percent of households headed by a woman and the percent of families with a married couple. The national bureau of economic research provides the third included measure from the 1982 national center for health statistics natality data (https://www.nber.org/research/data/vital-statistics-natality-birth-data) on the percent of children born to married mothers by county. The index is the first principal component of these three indicators
Community
This variable is constructed using earlier available years but similar variables as the county-level community health subindex from the joint economic commission. The index is the first principal component of the following indicators: County-level measure of religious bodies from churches and church membership in the United States, 1990; county-level measure counts of non-profits from the urban institutes 1990 IRS statistics of income division exempt organizations file
Political
This variable is constructed using earlier available years but similar variables as the county-level institutional health subindex from the joint economic commission. The index is the first principal component of the following indicators: County-level average (over 1988, 1992, and 1996) of votes in the presidential election per citizen age 18+ (except for Alaska; Alaska’s is the state-level average) and the mailback response rate for the 1990 census
School friendships
“Childhood economic connectedness: two times the share of high parental-SES friends among low-parental-SES individuals averaged over all low-parental-SES individuals in the county, calculated using only individuals’ high school friends.” (Chetty et al., 2022, codebook p. 4). This variable is child_ec_county from the publicly available dataset furnished by Chetty et al. (2022)
Adult friendships
Baseline definition of economic connectedness: two times the share of high-SES friends among low-SES individuals, averaged over all low-SES individuals in the county. (Chetty et al., 2022, codebook pg. 3). This variable is ec_county from the publicly available dataset furnished by Chetty et al. (2022)
Relative mobility
“Mean income percentile in adulthood of a child born to parents at or below the 25th percentile of the income distribution, from Chetty et al. (2018).” This variable is kfr_pooled_pooled_p25 from the publicly available dataset furnished by Chetty et al. (2022)
Mean achievement
County level averages of student math achievement are based on the Stanford education data archive 4.1 for grades 3–8, for years 2009–2018