
Abstract
In contemporary armed conflict, the spatiality of violence and the constellation of actors involved in it change frequently, but how these changes affect one another remains poorly understood. What explains the spatial shift of areas affected by violence in multi-actor conflicts? We argue that the emergence of a new dominant conflict actor facilitates a shift in conflict-related violence. We theorize the causal mechanism as ‘low-risk/high-opportunity attraction’. It exists in territories where these actors can draw on a local support base and enhance capacities to engage in violence. To demonstrate our theory’s validity, we conduct two plausibility probes: on the conflict in Colombia paired with the conflict in the Lake Chad region, and on the conflict in the Afghan–Pakistani borderlands paired with the conflict in Iraq/Syria. We adopt a mixed-methods approach integrating visualizations, spatial analysis, network analysis and process tracing, drawing, inter alia, on interviews from remote regions of war-torn Colombia and Iraq.
Introduction
Just as territories affected by violence change frequently in contemporary armed conflicts, so do the actors involved in them. The armed conflict in the Lake Chad region started with the Boko Haram insurgency in northeastern Nigeria, expanded to central Nigeria, contracted, then shifted back to the northeast and crossed the borders to Chad, Niger and Cameroon. In Afghanistan, Islamist violence shifted from Afghanistan to the (former) Federally Administered Tribal Area (FATA) and then expanded into wider Pakistan. These are just two examples of many from the past 15 years. In the same period, more armed groups have formed than in the past six decades together (Maurer, 2018). Accessible technology, social media and communication devices decreased the cost for groups to form and engage in conflicts, allowing new and splinter groups to enter conflicts (Mironova, 2019: 5). Boko Haram, for instance, used social media strategies, including private messages, closed groups and videos, to communicate and spread propaganda (Nnam et al., 2020). In Afghanistan, the Islamic State-Khorasan (IS-K) recruited foreign militants relocating from Central Asia and the Middle East via novel media technologies after the Islamic State of Iraq and Syria (ISIS)’s fall in 2019 (Stepanova and Ahmad, 2020).
Although the dynamic spatiality of conflict-related violence and the multi-actor character of armed conflict have received considerable scholarly attention, how these two phenomena interlink remains understudied. We lack knowledge on how the change in constellations of conflict actors and the spatiality of violence affect one another. This is puzzling, given how important such insights might be for mitigating human suffering.
The ‘humanitarian footprint’ (Beardsley and Gleditsch, 2015: 69) of spatial shift in conflict-related violence makes enhancing understanding of it to better prepare for and prevent it a pressing concern for scholars and practitioners alike. By shift we mean that conflict events that occur in one moment overlap geographically only to a limited extent or not at all with those of a previous one. 1 In areas affected by shifting conflict-related violence, civilians often cannot prepare for protecting themselves from newly arriving armed actors; humanitarian agencies arrive too late. Understanding when and how areas affected by conflict-related violence shift can enable agencies to tailor their responses and target resources to the regions most in need.
It is therefore important to explain the spatial shift of areas affected by conflict-related violence and the dynamic multi-actor character of armed conflicts as interrelated factors. We argue that the emergence of a new dominant actor in armed multi-actor conflict is conducive to a spatial shift in conflict-related violence. We theorize the causal mechanism that connects changing conflict actor constellations and spatial shifts in conflict-related violence as ‘low-risk/high-opportunity attraction’. The new dominant actor typically focuses fighting in territory with a low risk of being attacked or defeated by another conflict actor, yet a high opportunity for enhancing capacities to engage violently with others by growing a support base, recruiting fighters and gaining income. We define dominant actors as those in a conflict with the highest or second-highest number of violent engagements with other actors. These dominant actors influence conflict dynamics regardless of whether they fight a state or non-state actor.
To demonstrate our theory’s plausibility, we conduct two paired comparisons including four cases: we compare the Afghan–Pakistani borderlands with Syria/Iraq; and the Lake Chad region with Colombia. All cases manifest spatial change during the study periods but, as we show, only those where new dominant actors emerge manifest the specific form of spatial change: shift. We adopt a mixed-methods approach that integrates visualizations (encouraging visual thinking), spatial analysis, network analysis and process tracing, drawing, inter alia, on the Uppsala Conflict Data Program (UCDP) dataset (Croicu and Sundberg, 2018; Sundberg and Melander, 2013) and original data that we collected during fieldwork in remote areas of two of the world’s most war-torn regions: Colombia and Iraq. 2 Combining these qualitative and quantitative approaches facilitates capturing the historically, economically and socially embedded causal processes that influence the spatial shift of conflict-related violence. Integrating visual thinking is not only beneficial to enhance theoretical understanding of such violence, but also helps tailor humanitarian responses to the locations most in need.
Our study contributes to two debates: first, sociological, historical and ethnographically informed debates on changing actor constellations in multi-actor conflicts and other unstable settings (see e.g. Idler, 2019) that have not measured the evolving spatiality of violence resulting from these changes; second, primarily quantitative scholarship on the spatiality of violence that has overlooked the relevance of new dominant actors but that focuses on, for example, conflict diffusion (see e.g. Ito and Hinkkainen Elliott, 2020; Polo, 2020), predicting conflict locations (Schutte, 2017), or mapping it (Beardsley et al., 2015; see e.g. Kikuta, 2022; Zhou and Shaver, 2021). We demonstrate the added value of embracing epistemological and methodological pluralism in political science. More broadly, our findings help advance the research agenda on change in armed conflict proposed by this Special Issue as a whole. We show how two of the five dimensions in the conceptual framework on change in armed conflict connect (Idler, 2023): the dimensions of change in actors involved in conflict, and in the environments, or places, where conflict occurs. By accounting for the dynamism of conflict-related violence, we join other Special Issue contributions that embrace ‘gray zones’ (Rugo, 2023).
First, we theorize how changes in dominant conflict actors influence spatial shift in conflict-related violence. Second, we conduct two plausibility probes comprising (a) the conflicts in Colombia and in the Lake Chad region, and (b) the conflicts in Syria/Iraq and in the Afghan–Pakistani borderlands. Finally, we conclude by highlighting how our methodologically pluralistic approach provides avenues for future research and policy that benefit from visual thinking. This article’s appendix provides more information on our data analysis and data sources, the case descriptions, robustness checks and data availability. We include details on the dataset and relevant code scripts online and in the extended appendix. 3
A theory of shift of areas affected by conflict-related violence
Contemporary conflicts typically involve more than one state and one non-state actor. Actor constellations evolve over time, including via shifting alliances and clashes among actors (Arias and Barnes, 2017; Idler, 2019; Staniland, 2012). Multiple types of state forces engage in conflicts to varying degrees. Furthermore, conflict actors are heterogeneous and not all non-state conflict actors aim to defeat the government (Gates, 2002). Some fight alongside the government, such as the Yan Gora militias in Nigeria. Others fight only other non-state actors, such as clan militias in the Afghan–Pakistani borderlands. Building on Goldstein’s (2003: 3) broad definition of war as ‘lethal intergroup violence’ (see also Idler, 2023), we therefore conceptualize armed conflict as a dynamic multi-actor setting of organized violence with one or more contested issues between two or more conflict actors resulting in deaths. 4 We specify our theory, applicable to settings of armed multi-actor conflicts, through the following scope condition: the original contested issue involves at least one state actor and at least one non-state actor.
We use the term ‘conflict shape’ to refer to the area directly affected by conflict-related violence. The contested issue(s) and actors involved can change over time. Likewise, the conflict shape can change, e.g. when the relative strength of rebels vis-à-vis state actors changes, yielding, for instance, an expansion or shift in the area where armed groups operate (see e.g. Beardsley et al., 2015; Brenner, 2019; Buhaug, 2010; Schutte, 2017; Scorgie, 2022).
The proliferation of interconnected conflict actors facilitates the emergence of new dominant state or non-state actors, with distinct spatial signatures. We define conflict actors as organized state or non-state groups that use lethal violence to advance their position in relation to a conflict’s contested issue. In multi-actor conflicts, conflict actors vary in their relative strength vis-à-vis other state and non-state armed actors. This relative strength can evolve over time. Often, new actors become entangled in a conflict when they have a stake in its evolving contested issue or profit opportunities. Both existing and new actors may become dominant. Research on armed groups in Colombia (Idler, 2019: 86, 105), eastern Democratic Republic of Congo (Suluhu, 2020) and Syria (Syria Conflict Mapping team, 2022) suggests that the core of the territory initially controlled by the conflict actors who later become dominant differs from the territorial core controlled by already established dominant actors, even if it overlaps to some extent. With more potential partners and challengers available, it is harder for a single group to dominate a given territory; new ones can easily replace them, for example, if they are better at attracting recruits (Idler, 2020: 357; Mironova, 2019). Groups become more easily drawn into conflicts that originate in locations outside their strongholds.
When a conflict actor pivots its fighting to new territory upon becoming dominant, we expect the conflict shape to change. Building on previous research (Beardsley et al., 2015; Buhaug, 2010; Ito and Hinkkainen Elliott, 2020), we conceptualize such change in the spatiality of conflict-related violence along two dimensions: the location of the area affected by such violence – shift and no shift – and its size – expansion and contraction (the conflict shape expands or shrinks). Theoretically, the area can shift without changing size; empirically, the size usually changes. We thus refer to shifting contraction and shifting expansion: conflict events in one moment overlap geographically only to a limited extent or not at all with those in a previous moment and, simultaneously, the conflict shape shrinks or expands.
Integrating the points on conceptualizing armed multi-actor conflict as a dynamic social phenomenon and the role of new dominant actors for the spatiality of conflict-related violence yields the following proposition:
New dominant conflict actors contribute to a shift in the conflict shape
This shift can occur alongside the conflict shape’s expansion or contraction. The causal mechanism ‘low-risk/high-opportunity attraction’ helps explain the shift. We expect a conflict actor that changes its position from nondominant to dominant during the observed period to pivot its fighting to territory with low-risk/high-opportunity attraction once it becomes dominant and thus ‘nudge’ conflict-related violence toward those territories. In such territories, the new dominant actor can enhance violent capabilities thanks to opportunities including training and attracting recruits or easily accessing a profitable income source such as the illicit economy (rather than attacks on civilians) without immediate threat from other actors.
In many cases, low-risk/high-opportunity attraction exists in territories where new dominant actors have been preponderant and exerted social control historically without resorting to much violence (Idler, 2019). This is because of at least three reasons. First, the actors draw on ties with the local population – their support base – to attract recruits (O’Neill, 2005). They often have a mutually reinforcing relationship with communities, fostered by non-state actors’ state-building activities in return for consent, or perceived legitimacy by the communities (Arjona et al., 2015; Mampilly and Stewart, 2021). In the case of state actors, they are recognized as legitimate authority. Second, they better know the terrain and infrastructure, an advantage when fighting the enemy (Salehyan, 2009: 53). When armed non-state actors engage in fighting in remote areas distant from the state capital or where resources are present, conflicts typically last longer; the state has difficulties in defeating them (Buhaug et al., 2009). When state actors fight close to formal power centres, it typically is harder for non-state actors to challenge them. Third, in the case of non-state actors, given ties with the local population, they can more easily bribe and infiltrate local state actors whom they typically fight (Idler, 2019: 272).
In brief, the causal mechanism ‘low-risk/high-opportunity attraction’ links changing actor constellations in multi-actor conflicts with the dynamic spatiality of conflict-related violence.
Research design
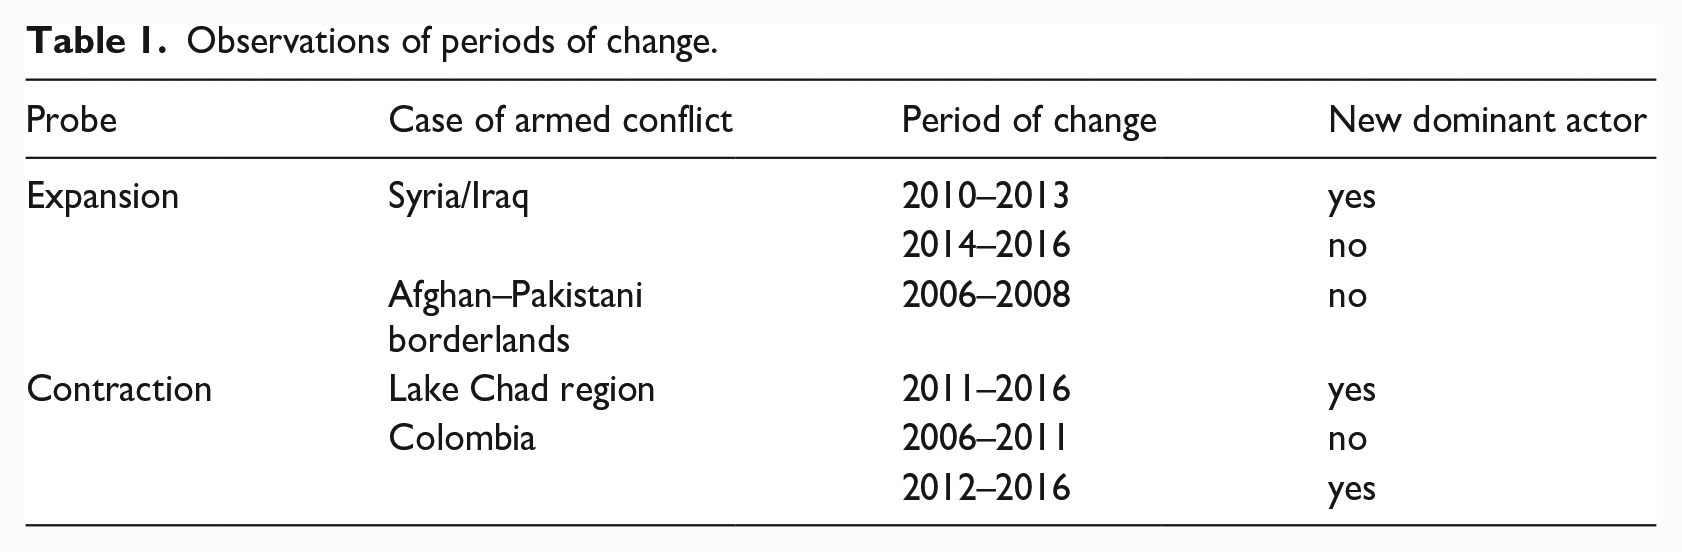
To assess how our theory explains spatial shift in conflict-related violence, we conduct two plausibility probes, 5 each consisting of a pair of cases of multi-actor conflict in which the original contested issue involves at least one state and one non-state actor. For each pair we selected three observations of periods of change, balancing periods with and without the emergence of new dominant actors (see Table 1). We expect the conflict shape to shift in those periods in which new dominant actors emerge. Embracing methodological pluralism (Tarrow, 2010: 252), we conduct within-case analyses in both probes combining visual thinking, quantitative methods (network analysis and spatial analysis) and process tracing. This approach permits us to operationalize and identify changes in the dominant actors and spatial shifts, and to examine if the ‘low-risk/high-opportunity attraction’ causal mechanism exists in each probe.
Observations of periods of change.
The first probe comprises spatially expanding conflicts in the Afghan–Pakistani borderlands and in Syria/Iraq. Both cases are protracted conflicts, that is, they ‘typically involve a tangled history of several different and sometimes simultaneous conflicts’ (ICRC, 2016: 9). Both cases are cross-border conflicts with many conflict actors (45 for Afghanistan/Pakistan and 122 for Syria/Iraq) and similar contested issues (broadly defined as religion, territorial autonomy and state control). The second probe comprises spatially contracting conflicts in Colombia and in the Lake Chad region. These conflicts differ in their protractedness and contested issues. Colombia is one of the world’s oldest conflicts, having started in the late 1940s and continuing to date. The Lake Chad region is more recent, having started in 2009 yet potentially becoming protracted.
Operationalization
We build on the UCDP’s conflict definition, but update it to reflect the entangled and dynamic character of conflict actors’ constellations. The UCDP’s datasets define conflict as ‘a contested incompatibility that concerns government and/or territory where the use of armed force between two parties, of which at least one is the government of a state, results in at least 25 battle-related deaths in one calendar year’ (Gleditsch et al., 2002: 619). Based on this definition, most armed conflicts counted as such are dyadic. Against this, we use the UCDP Georeferenced Event Dataset (GED) conflict dyads as building blocks that together form one umbrella conflict instead of considering each dyad an individual conflict. For instance, we consider the ‘Boko Haram-Nigerian government’ and ‘Islamic State’s West Africa Province (ISWAP)-Nigerian government’ dyads part of the same conflict. This operationalization thus benefits from tested and proven data collection efforts while accounting for the dynamic multi-actor character of contemporary conflicts. 6
We operationalize conflict shapes as time-variant concave hull polygons based on the conflict event location. To build conflict shapes, we first identify all relevant conflict events for a given armed conflict. Then we calculate the concave hull and add a 50 km buffer to obtain the final polygon that represents the conflict shape. We consider polygons based on conflict event location to reasonably approximate the areas directly affected by conflict-related violence because they represent a geographical summary of the conflict events’ spatial distribution in each period. Conflict shapes capture spatial and temporal macro-trends of violence, allowing researchers to compare areas affected and not affected by conflict events over time. To gain insights at the meso- and micro-level, we identify hotspots (high-density conflict event areas within a conflict shape), using the Getis-Ord algorithm (Getis and Ord, 1992), and analyse fieldwork evidence.
To operationalize a shift in the conflict shape, we measure the conflict shape’s geographical area and the hotspot overlap. A conflict shape shifts when the overlap between hotspots and conflict shape is, on average, below 50%. We summate the percentage overlap of the hotspots and conflict shapes and divide them by two. We determine that a conflict shape contracts or expands if the polygon area decreases or increases, respectively, by at least 20%. Since the conflict shapes’ peripheral parts typically have a lower event density, a relatively low event number can significantly change the shape and affect the overlap calculations’ result. With a hotspot overlap measure, a change in the major battleground location is necessary. Accounting for the armed conflict’s heterogeneity across space, operationalizing the conflict shape’s shift this way thus captures a substantial and meaningful change in the conflict event locations. We assume that the shift’s pace varies across the conflict shape, given factors such as population density, infrastructure, or terrain type. Thus, we do not restrict the analysis to a fixed period. When we identify a shift that lasts longer than one year, we assess intermediate and final conflict shapes and hotspot locations to ensure the observed shift results from a trend. We use conflict shapes rather than individual events to determine shifts in conflict-related violence because studying areas provides a more holistic image than studying individual events. Events themselves do not shift. An event occurs in one moment, then a new event occurs in another moment. However, events impact the areas, that is, the events’ social environment, and people’s deaths affect those who remain in that area.
Our approach to constructing conflict shapes builds on work that engages in similar efforts (e.g. Zhou and Shaver, 2021), yet it is more suited to analysing shifts in areas affected by conflict-related violence. Contrary to geographical units of analysis that equate conflict events with conflict (e.g. Kikuta, 2022), we acknowledge that georeferenced conflict events provide information on violence only. Armed conflict manifests itself not only in physical violence but also in nonviolent ways, for example, via territories controlled by armed groups, or where people fear forced recruitment, kidnapping, or extortion. Our approach thus permits analytically isolating the causal mechanism ‘low-risk/high-opportunity attraction’: it exists in territory affected by armed conflict where armed groups have been present, but only becomes territory affected by conflict-related violence once fighting pivots there. Also, contrary to work based on quantitative methods only (e.g. Lis et al., 2021), our approach includes gathering fieldwork evidence in war-torn regions, necessary to identify the causal mechanisms that facilitate shifts and to review the polygons’ scope. Furthermore, our approach to constructing the conflict shape is less prone to data loss than others such as Kikuta (2022). His Wzone dataset has conflict zones that are conflict event summaries built through an unsupervised machine-learning algorithm. It requires more conflict events than the concave algorithm used for conflict shapes. Creating Kikuta’s conflict zones for multi-actor conflicts requires constructing zones for each conflict dyad first, and then combining them to form the final polygon. Dyads with few conflict events do not have their own zones and are not included in the final zone. For instance, there are no conflict zones for the AUC–FARC and the Government of Colombia–EPL Megateo dyads in 2006. Also, Kikuta gives more weight to conflict events with higher fatalities when estimating conflict zones. Such an approach does not capture some instances in which a change in dominant actors facilitates spatial shift (see appendix).
Data and empirical strategy
For two of our cases, Syria/Iraq and Colombia, we draw on data obtained via 12 and 95 in-depth semi-structured interviews respectively, with stakeholders including ex-combatants, civil society leaders, youth (above 18 years), peasants, refugees, clerics, international organization staff, police and military officers, government officials, and others embedded in or with expert knowledge on conflict actors. We conducted these interviews during ongoing armed conflict in 2011, 2016 and 2022 in remote, hard-to-access, war-torn regions. For all four conflicts, we interviewed experts with fieldwork experience in the respective regions. To build the conflict shape and identify dominant actors, we obtained data from the UCDP GED 18.1 (Croicu and Sundberg, 2018; Sundberg and Melander, 2013). We also use ACLED (Raleigh et al., 2010) data for the conflict in the Lake Chad region to test our results’ robustness. 7 Reviewing the literature on individual cases yielded further data.
Our empirical strategy has four steps:
Identify conflict shapes. We conduct network and spatial analyses using UCDP and interview data, along with visualizations, to identify the actors involved in the conflict and the locations of their violent engagements to construct the conflict shape for various points in time. 8
Identify change in dominant actor. We analyse the actor network, complemented by interview data, to identify conflict actors and how their position may change from nondominant to dominant and vice versa. For each actor per year, we calculate the degree centrality – a network centrality measure representing the total number of connections (involvement in conflict events) of a given actor with other actors.
Show shift. We conduct spatial analysis, including hotspot analysis, to determine whether the area affected by conflict-related violence shifts and review it based on interviews.
Show causal mechanism. We engage in process tracing, drawing on interview data from Iraq and Colombia and from secondary literature, to examine whether a low-risk/high-opportunity attraction is a plausible causal mechanism.
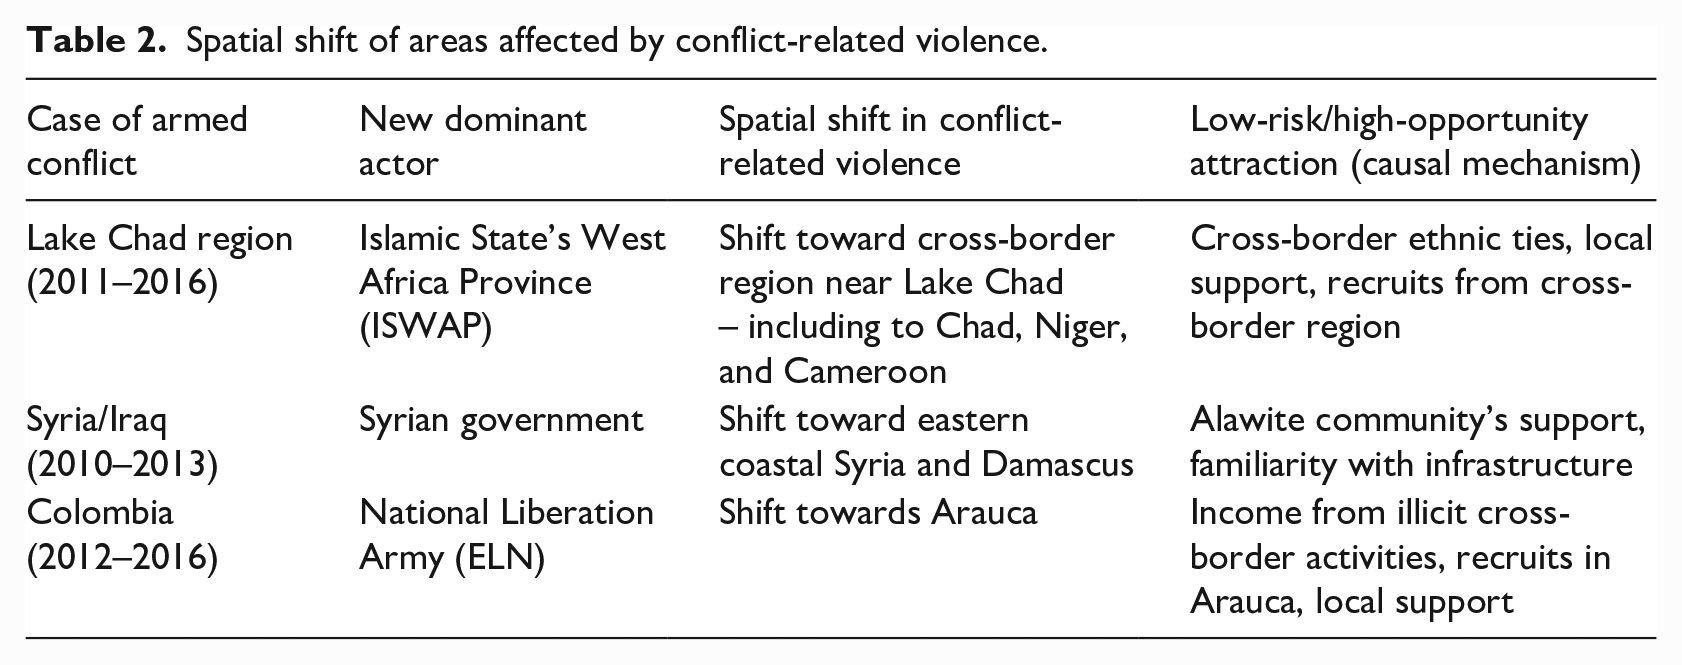
Through this strategy, we find that the three periods of change that feature new dominant actors manifest shift and trace it back to low-risk/high-opportunity attraction (see Table 2). Pairing the cases as expansion and contraction probes suggests that shift occurs regardless of whether the conflict-affected area expands or contracts.
Spatial shift of areas affected by conflict-related violence.
Evidence
Shifting expansion and expansion
We compare Syria/Iraq’s (2010–2013) and the Afghan–Pakistani borderlands’ (2006–2008) expanding conflict shapes. The dominant actors remained the same in the Afghan–Pakistani case (Afghan government; Taliban) but changed in the Syria/Iraq case (Syria’s government replaced Iraq’s government as dominant actor; ISIS remained dominant). The Syria/Iraq conflict shape expanded while shifting. The Afghan–Pakistani borderlands conflict shape expanded without shifting.
Armed conflict in Syria/Iraq
Conflict shapes and dominant actors
Iraq’s contemporary armed conflict started in 2003 after the US-led invasion. The United States defeated the Iraqi military, but tensions among religious and ethnic groups persisted and arguably intensified in Iraq’s fragmented society. Opposition groups formed and fought against Iraq’s government and the US military. The new Iraqi government formally recognized the Kurdish region’s autonomy, but intra-Kurdistan tensions gradually increased, followed by a worsening of Iraqi–Kurdish relations in 2014. Syria’s ongoing armed conflict started in 2011, after Syrian president Bashar al-Assad crushed protests. Many non-state armed groups with various allegiances subsequently joined the conflict.
We focus on the Islamic State (IS) Islamist insurgency from 2010 (one year before the anti-Assad protests in Syria) to 2013 (when IS intensified its offensive in Iraq and gained prominence in Syria). We consider conflict events in Iraq and Syria as part of one conflict shape. 9 In 2011, the Arab Spring in Syria, the subsequent anti-Assad uprising, and the US withdrawal from Iraq destabilized the region, enabling al-Qaeda in Iraq (AQI) to intensify pressure on Iraqi forces and penetrate Syria (Kaválek, 2015). AQI’s leader Abu Bakr al-Bagdadi targeted al-Assad’s secular regime. In December 2012, protests erupted in Sunni-dominated areas in Iraq (mainly Mosul, Tikrit, Ramadi and Falluja) against Iraqi Prime Minister Nouri al-Maliki’s regime. The regime’s de-Ba’athification campaign against Sunni politicians during Iraq’s provincial 2013 elections intensified sectarian tensions across Iraq (Isakhan et al., 2017). In 2013, the AQI leaders established ISIS to mark the group’s expansion into Syria (Hashim, 2014). ISIS gained strongholds in Syria and consolidated itself in Iraq, where it benefited from Sunni grievances strengthened by al-Maliki’s authoritarian tendencies. ISIS and Iraq’s government were dominant conflict actors in 2010 (see Figure 1.1). According to UCDP data, they were both involved in 241 conflict events. In 2013, UCDP GED counted 412 violent engagements with ISIS involvement: 309 between ISIS and Iraq’s government, 75 between ISIS and Syria’s government (see Figure 1.2). ISIS and Syrian rebels increasingly pressured Syria’s government. ISIS continued to be dominant; Syria’s government replaced Iraq’s government as a new dominant actor.
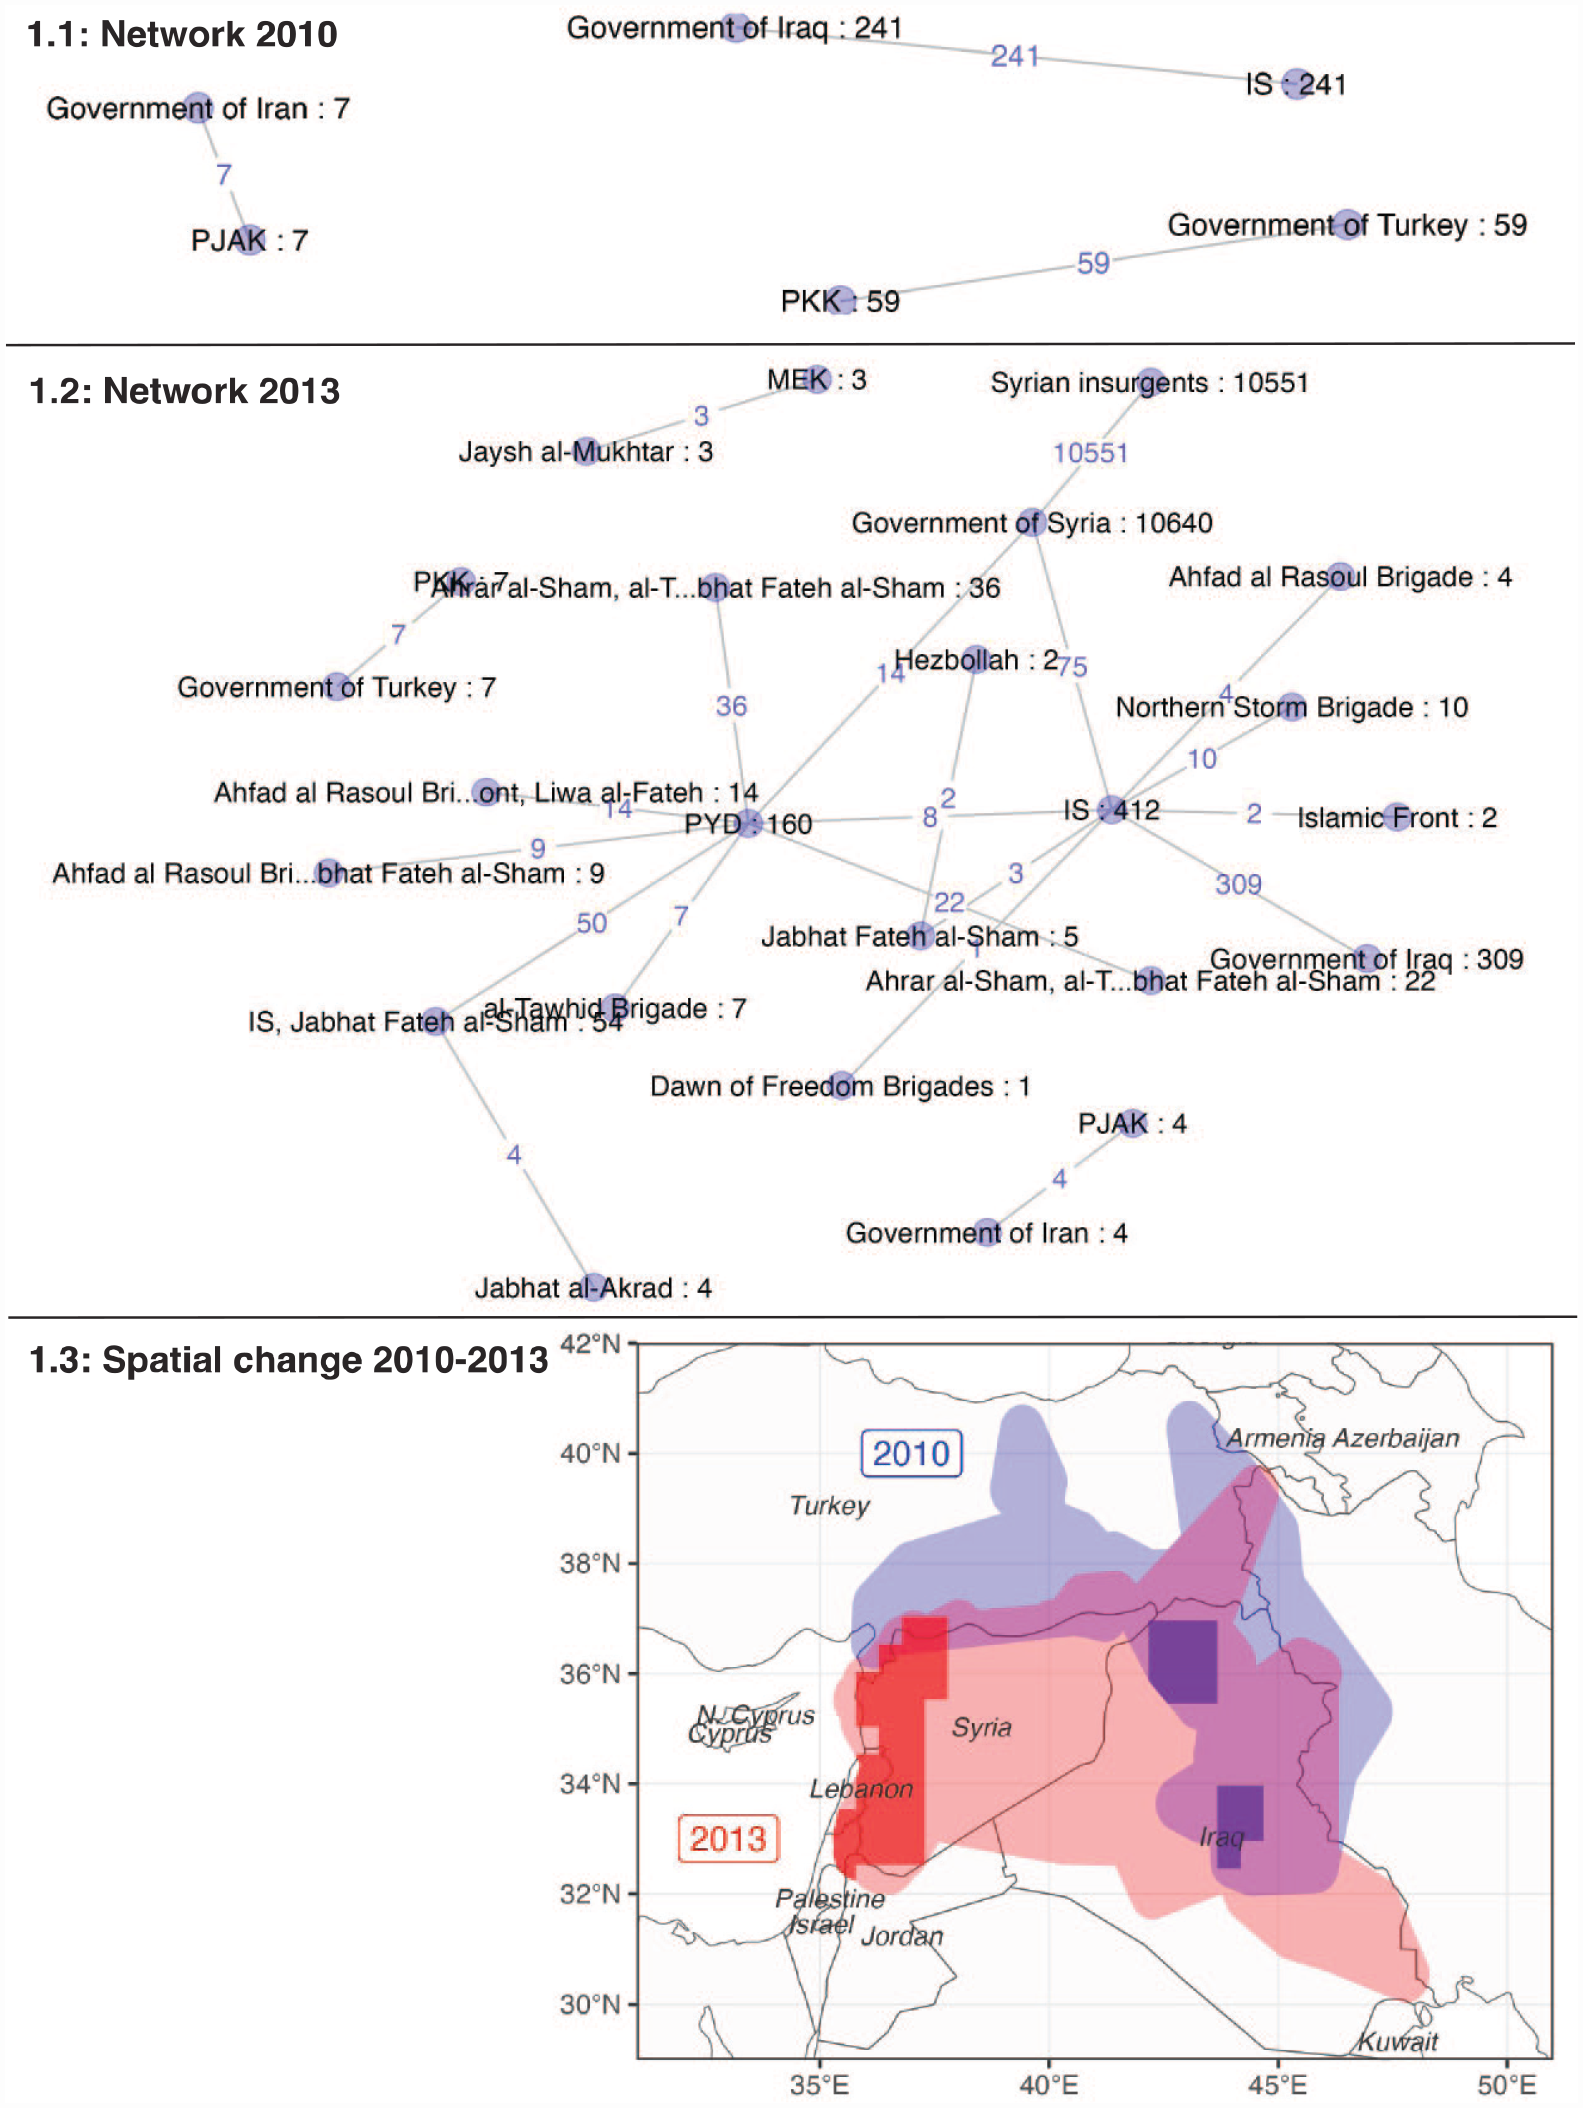
1.1. and 1.2: Violent engagements in the Syria/Iraq conflict shape, 2010 and 2013. Black numbers: overall engagements of a conflict actor. Blue numbers: mutual engagements between two conflict actors. 1.2: Shifting expansion of the Syria/Iraq conflict shape, 2010–2013. Conflict shape overlap 58.9%, hotspot overlap 0%.
Spatial change
Between 2010 and 2013, the conflict shape expanded, with violence erupting in Syria and returning to central and southern Iraq. The hotspots and conflict shifted to eastern Syria (see Figure 1.3). Tracing the processes between the new dominant actor – Syria’s government – and the conflict shape’s shifting expansion confirms the causal mechanism: a low-risk/high-opportunity attraction arose from the new dominant actor’s access to a support base and their knowledge of the terrain and infrastructure. Syria’s government drew on the Alawite community’s support, concentrated in eastern coastal Syria and Damascus (Kerr and Larkin, 2015: 125), where it could easily recruit and control the city and nearby territory. 10 Familiarity with the infrastructure provided Syria’s military a strategic advantage vis-à-vis other actors. Reinforcing military operations in the state’s stronghold against ISIS expanded the conflict onto Syrian territory and shifted its centre of gravity, given Syria’s government’s relative strength vis-à-vis ISIS. 11
To further examine whether low-risk/high-opportunity attraction facilitates spatial shift, we analyse the subsequent period (2014–2016): the conflict shape expanded without shift. In 2014, as an Iraqi student we interviewed stated, ‘ISIS happened’: ISIS marched across the Syrian–Iraqi border into northern Iraq. Author interviews with a women’s organization leader, an Iraqi security expert, an international organization staff member based in Baghdad, and others support this observation. 12 Mosul, Tikrit, Falluja and other towns fell to ISIS (followed by towns such as Ramadi in 2015). The conflict shape comprised large parts of Iraq, except from the south and a small fringe in the north (see Figure 2). Interviews reflected this expansion: a resident of Duhok in northern Iraq stated that his hometown was just a short distance away from the ‘100 km border with ISIS’ back then. 13 Another resident, who supported displaced Mosul residents arriving in nearby Duhok, recounted how ISIS expanded its presence and violent activities across Iraq. During the Peshmerga’s (Iraqi Kurdistan’s armed forces) efforts to liberate Sinjar in 2016, close to the Syrian border, his father, a Peshmerga member, was killed in one of these ‘violent engagements’ between ISIS and the armed forces, leaving him, his three siblings and their mother behind. 14 Fighting in Syria continued: Syria’s government continued to be involved in more violent engagements with ISIS than Iraq’s government.
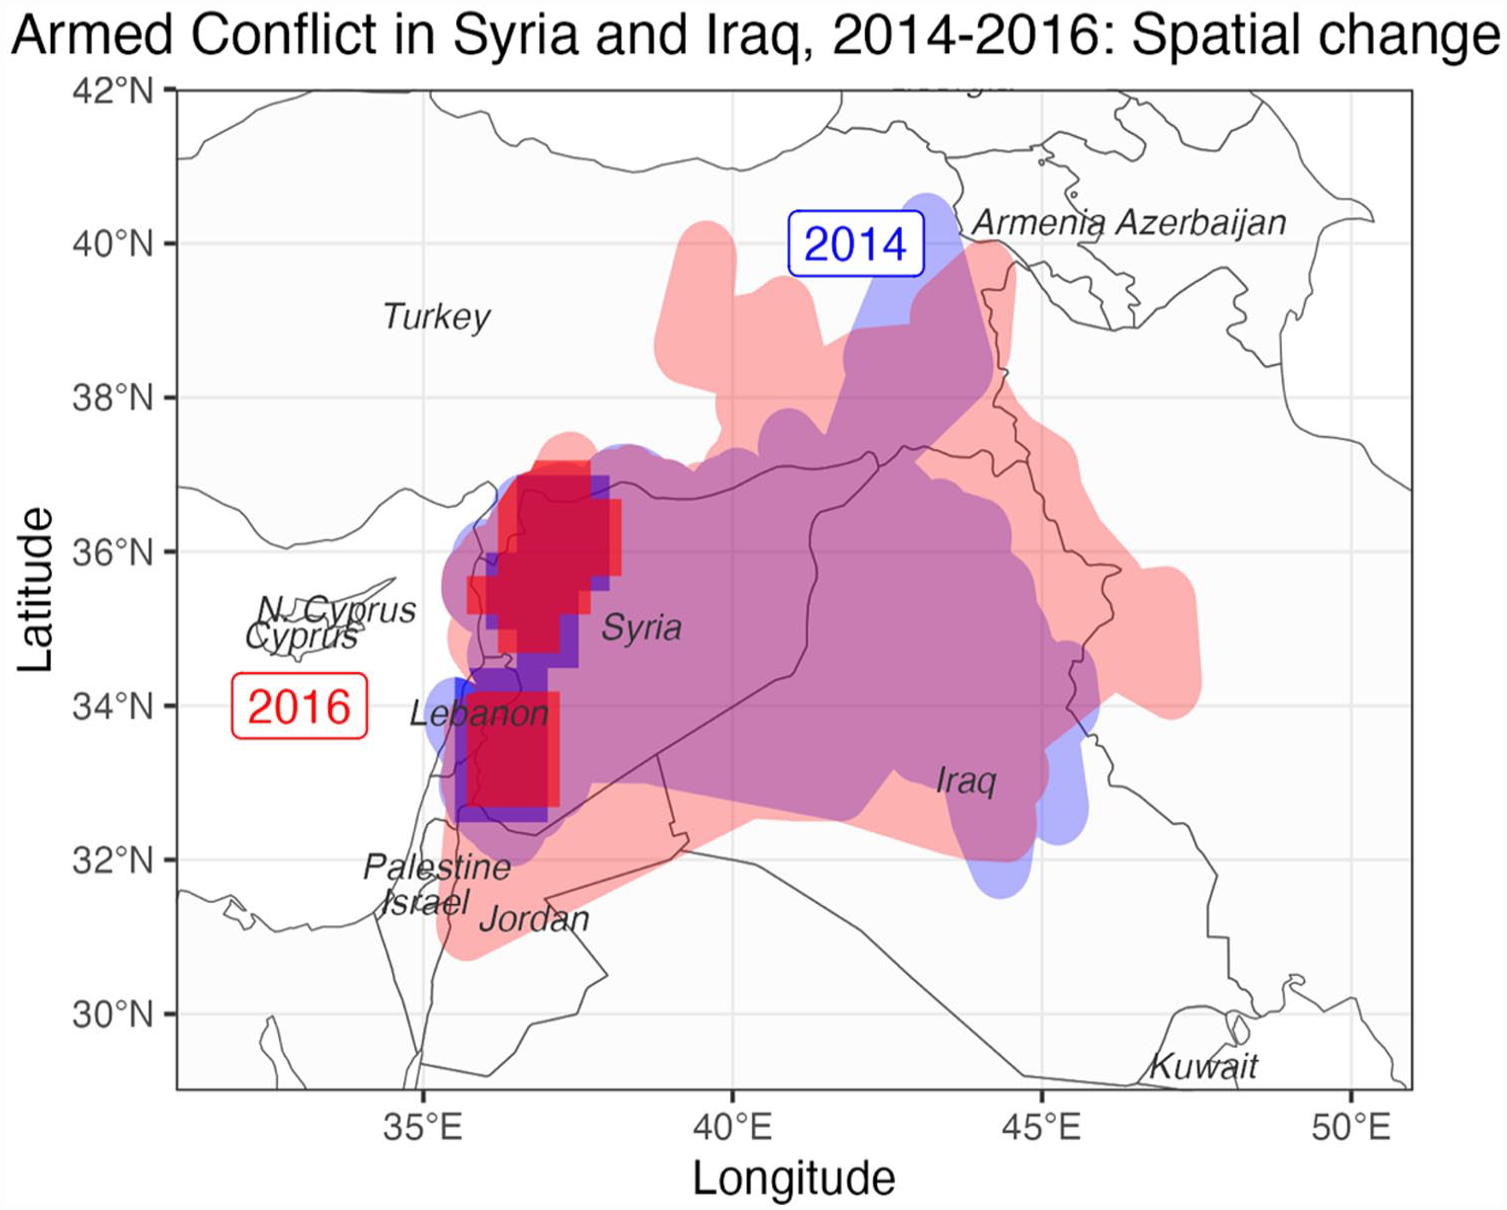
Expansion of the Syria/Iraq conflict shape, 2014–2016. Conflict shape overlap 93.1% hotspot overlap 74.2%.
Armed conflict in the Afghan–Pakistani borderlands
Conflict shapes and dominant actors
After the US-led invasion of Afghanistan in 2001, high-ranking Taliban and al-Qaeda members in the country fled to the former FATA. 15 US drone strikes targeted them beyond the Afghan border, causing civilian casualties (Aslam, 2011). These strikes and the presence of Afghan Islamists and foreign fighters contributed to militarizing and radicalizing the region (Rais, 2019). Local Islamists formed the Taliban Movement of Pakistan (TTP) in 2007 (Aslam, 2011). The TTP enforced Sharia law and attacked targets presumably related to Pakistan’s government as revenge for US support (Ali, 2018). They attacked tribal leaders, Pakistani politicians and military infrastructure, clashing over territorial control with local tribes, militias and splinter groups (Mapping Militant Organizations, 2022).
We focus on the period 2006–2008 (one year prior to and one after the TTP formed), when violence escalated and spread to northern Afghanistan, and later from the former FATA to wider Pakistan, including around Lahore. The Taliban and Afghanistan’s government remained the dominant actors in this period (see Figure 3.1 and 3.2). Although the TTP became an important conflict actor, it was involved in fewer violent engagements than those that took place between the Taliban and Afghanistan’s government in 2008.
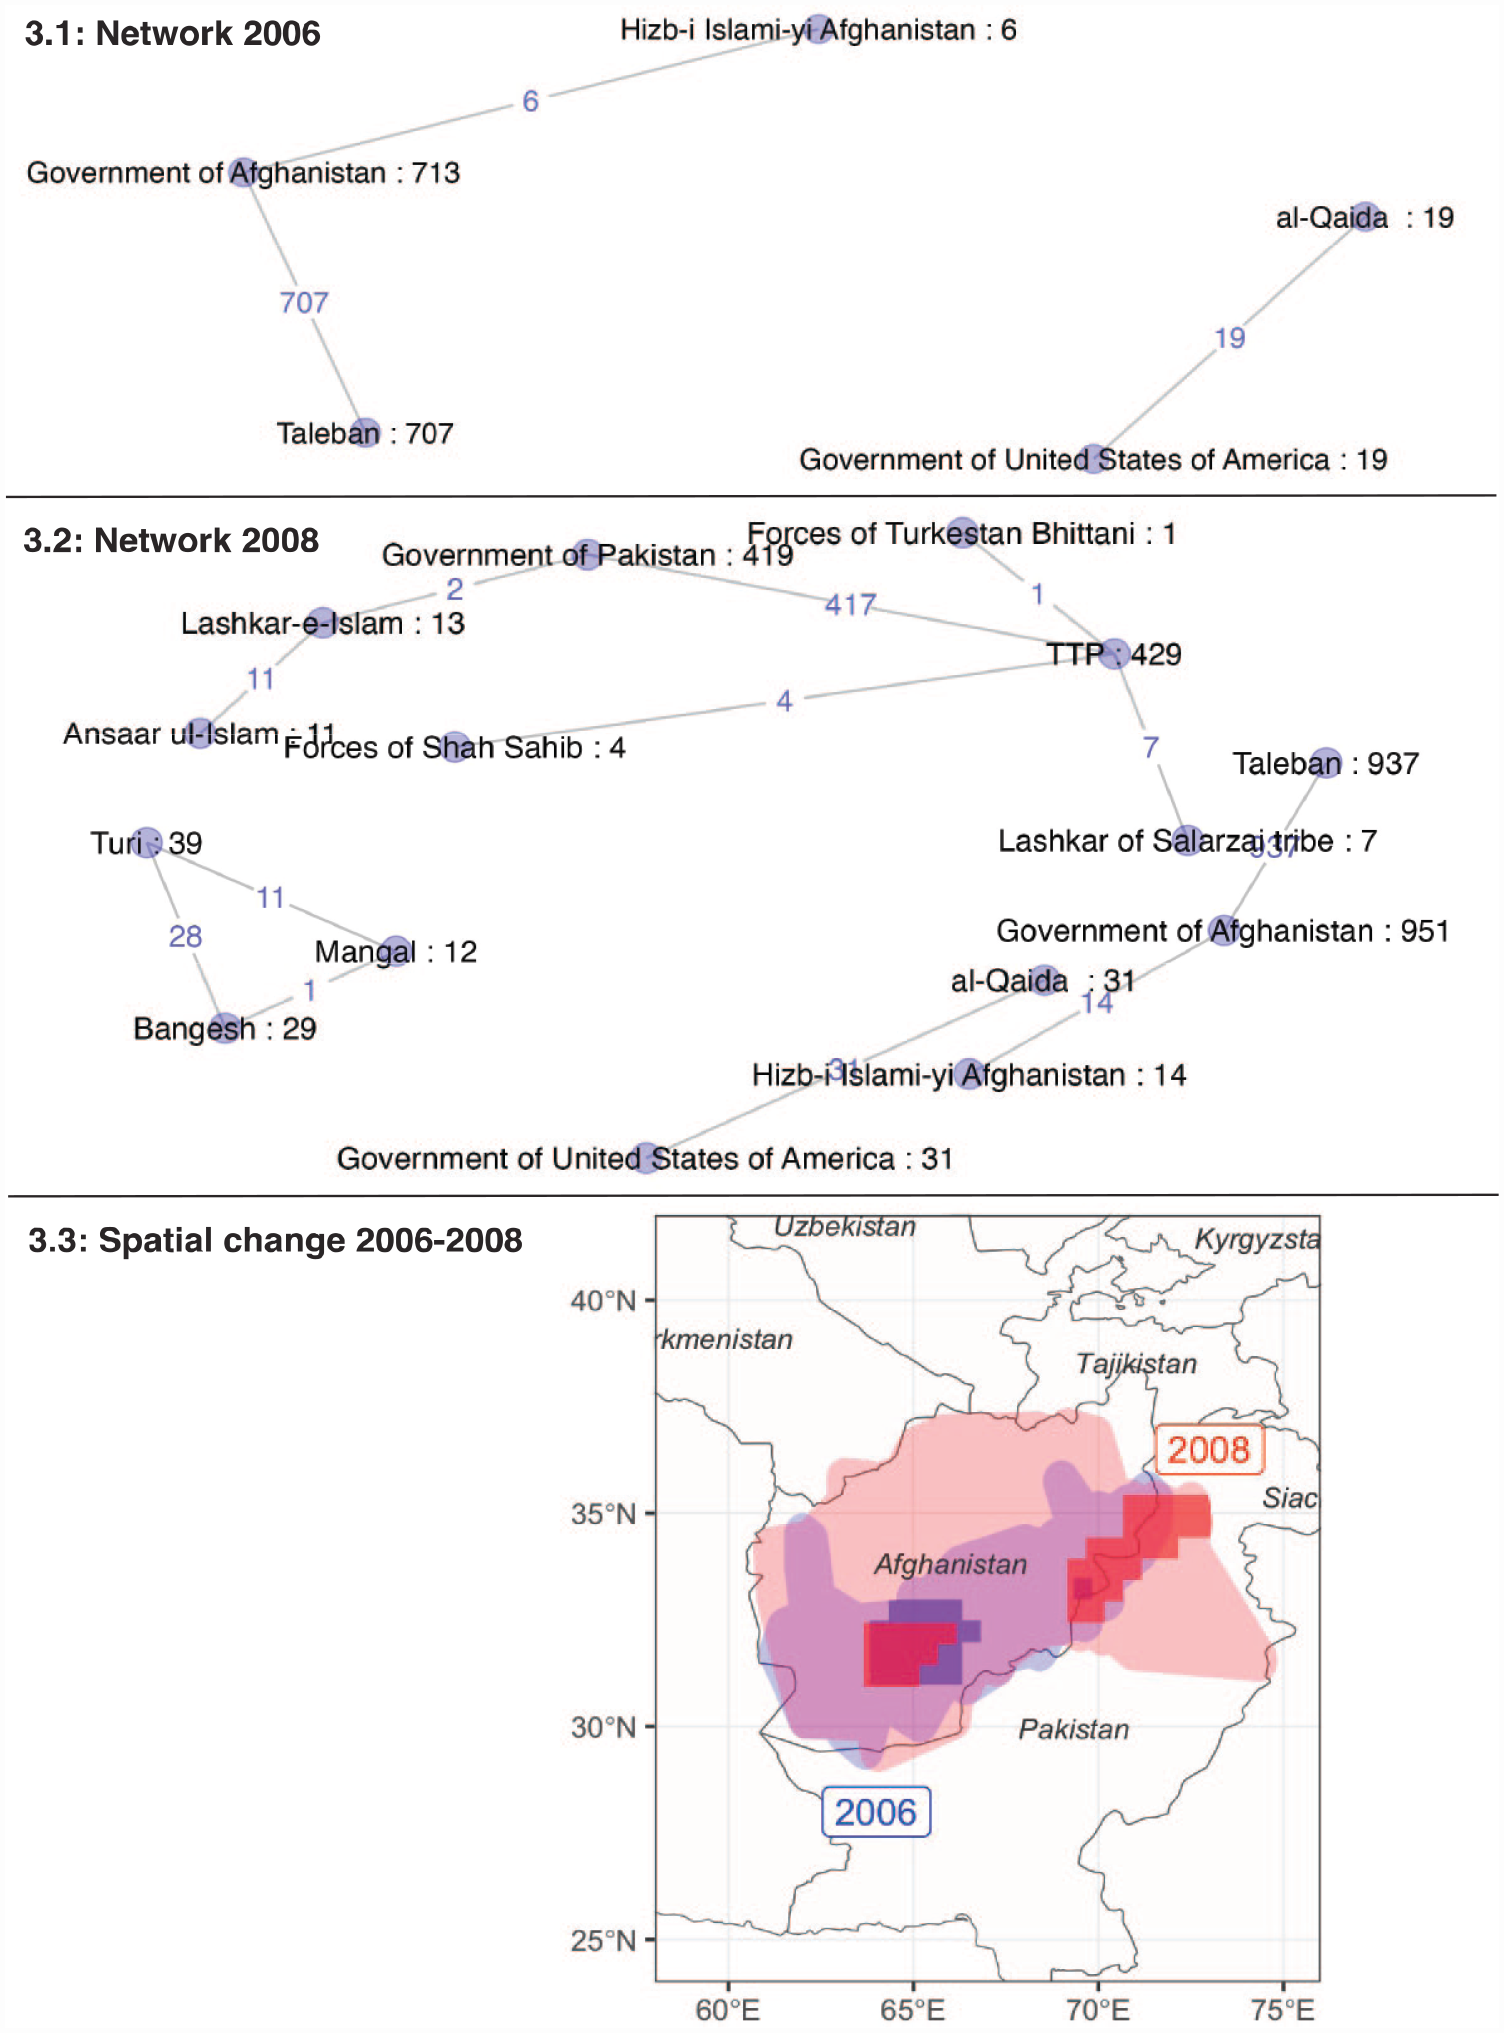
3.1. and 3.2: Violent engagements in the Afghan–Pakistani conflict shape 2006 and 2008. Black numbers: overall engagements of a conflict actor. Blue numbers: mutual engagements between two conflict actors. 3.2: Expansion of the Afghan–Pakistani conflict shape 2006–2008. Conflict shape overlap 96.4%, hotspot overlap 56.1%.
Spatial change
From 2006 to 2008, the conflict shape expanded. Two hotspots featured in 2006: a larger one in Kandahar and Helmand, a smaller one in the Afghan–Pakistani borderlands. In 2008, both provinces in southern Afghanistan remained key battlegrounds while the hotspot in the borderlands expanded. The conflict shapes and hotspots in 2006 and 2008 overlapped (see Figure 3.3). The conflict shape expanded (rather than shifted) because the same dominant actors, the Afghan government and the Taliban, continued to have recruitment and income opportunities in their territories, and expanded their fighting to new territories owing to their renewed insurgency in Afghanistan. No new dominant actor intervened that may have tried to ‘nudge’ fighting elsewhere.
Shifting contraction versus contraction
In the second probe, we pair the Islamist insurgency in the Lake Chad region during 2011–2016 with Colombia’s conflict during 2006–2011. In the Lake Chad region, the conflict shape shifted while contracting; in Colombia, it only contracted. As in the first probe, the conflict shape shifted where a new dominant actor emerged, facilitated by low-risk/high-opportunity attraction. In the Lake Chad region, ISWAP replaced Boko Haram as the dominant actor. In Colombia, the dominant actors remained the same during 2006–2011, and no shift occurred.
The armed conflict in the Lake Chad region (2011–2016)
Conflict shapes and dominant actors
Boko Haram began its insurgency against Nigeria’s government around 2009 (Osumah, 2013). Between 2011 and 2016 it evolved from a dyadic conflict concentrated in northeast Nigeria into a multi-actor and cross-border conflict involving militias, IS, and the neighbouring countries’ armies. In 2011, Boko Haram and Nigeria’s government were dominant actors; Boko Haram expanded to central and northern Nigeria. In 2013, the community-based group Yan Gora formed to protect civilians from Boko Haram (Agbiboa, 2015). Nigerian troops, supported by Yan Gora, forced Boko Haram to move toward Lake Chad, a region bordering Chad, Cameroon and Niger. The conflict gained prominence in March 2015 when Boko Haram’s leader, Abubakar Shekau pledged allegiance to IS, who aimed to establish an IS province in West Africa. Boko Haram then transformed into ISWAP. Months later, disagreement around ISWAP’s leadership and goals led it, in 2016, to splinter into Shekau-led Boko Haram and Abu Musab al-Barnawi-led ISWAP. Al-Barnawi’s ISWAP became a new dominant actor.
Spatial change
From 2011 to 2016, the conflict shape shifted while contracting. The yearly spatial changes were relatively small, but the overall trend shows a shift in the conflict shape and hotspots, and the conflict shape contracting (see Figure 4.3).
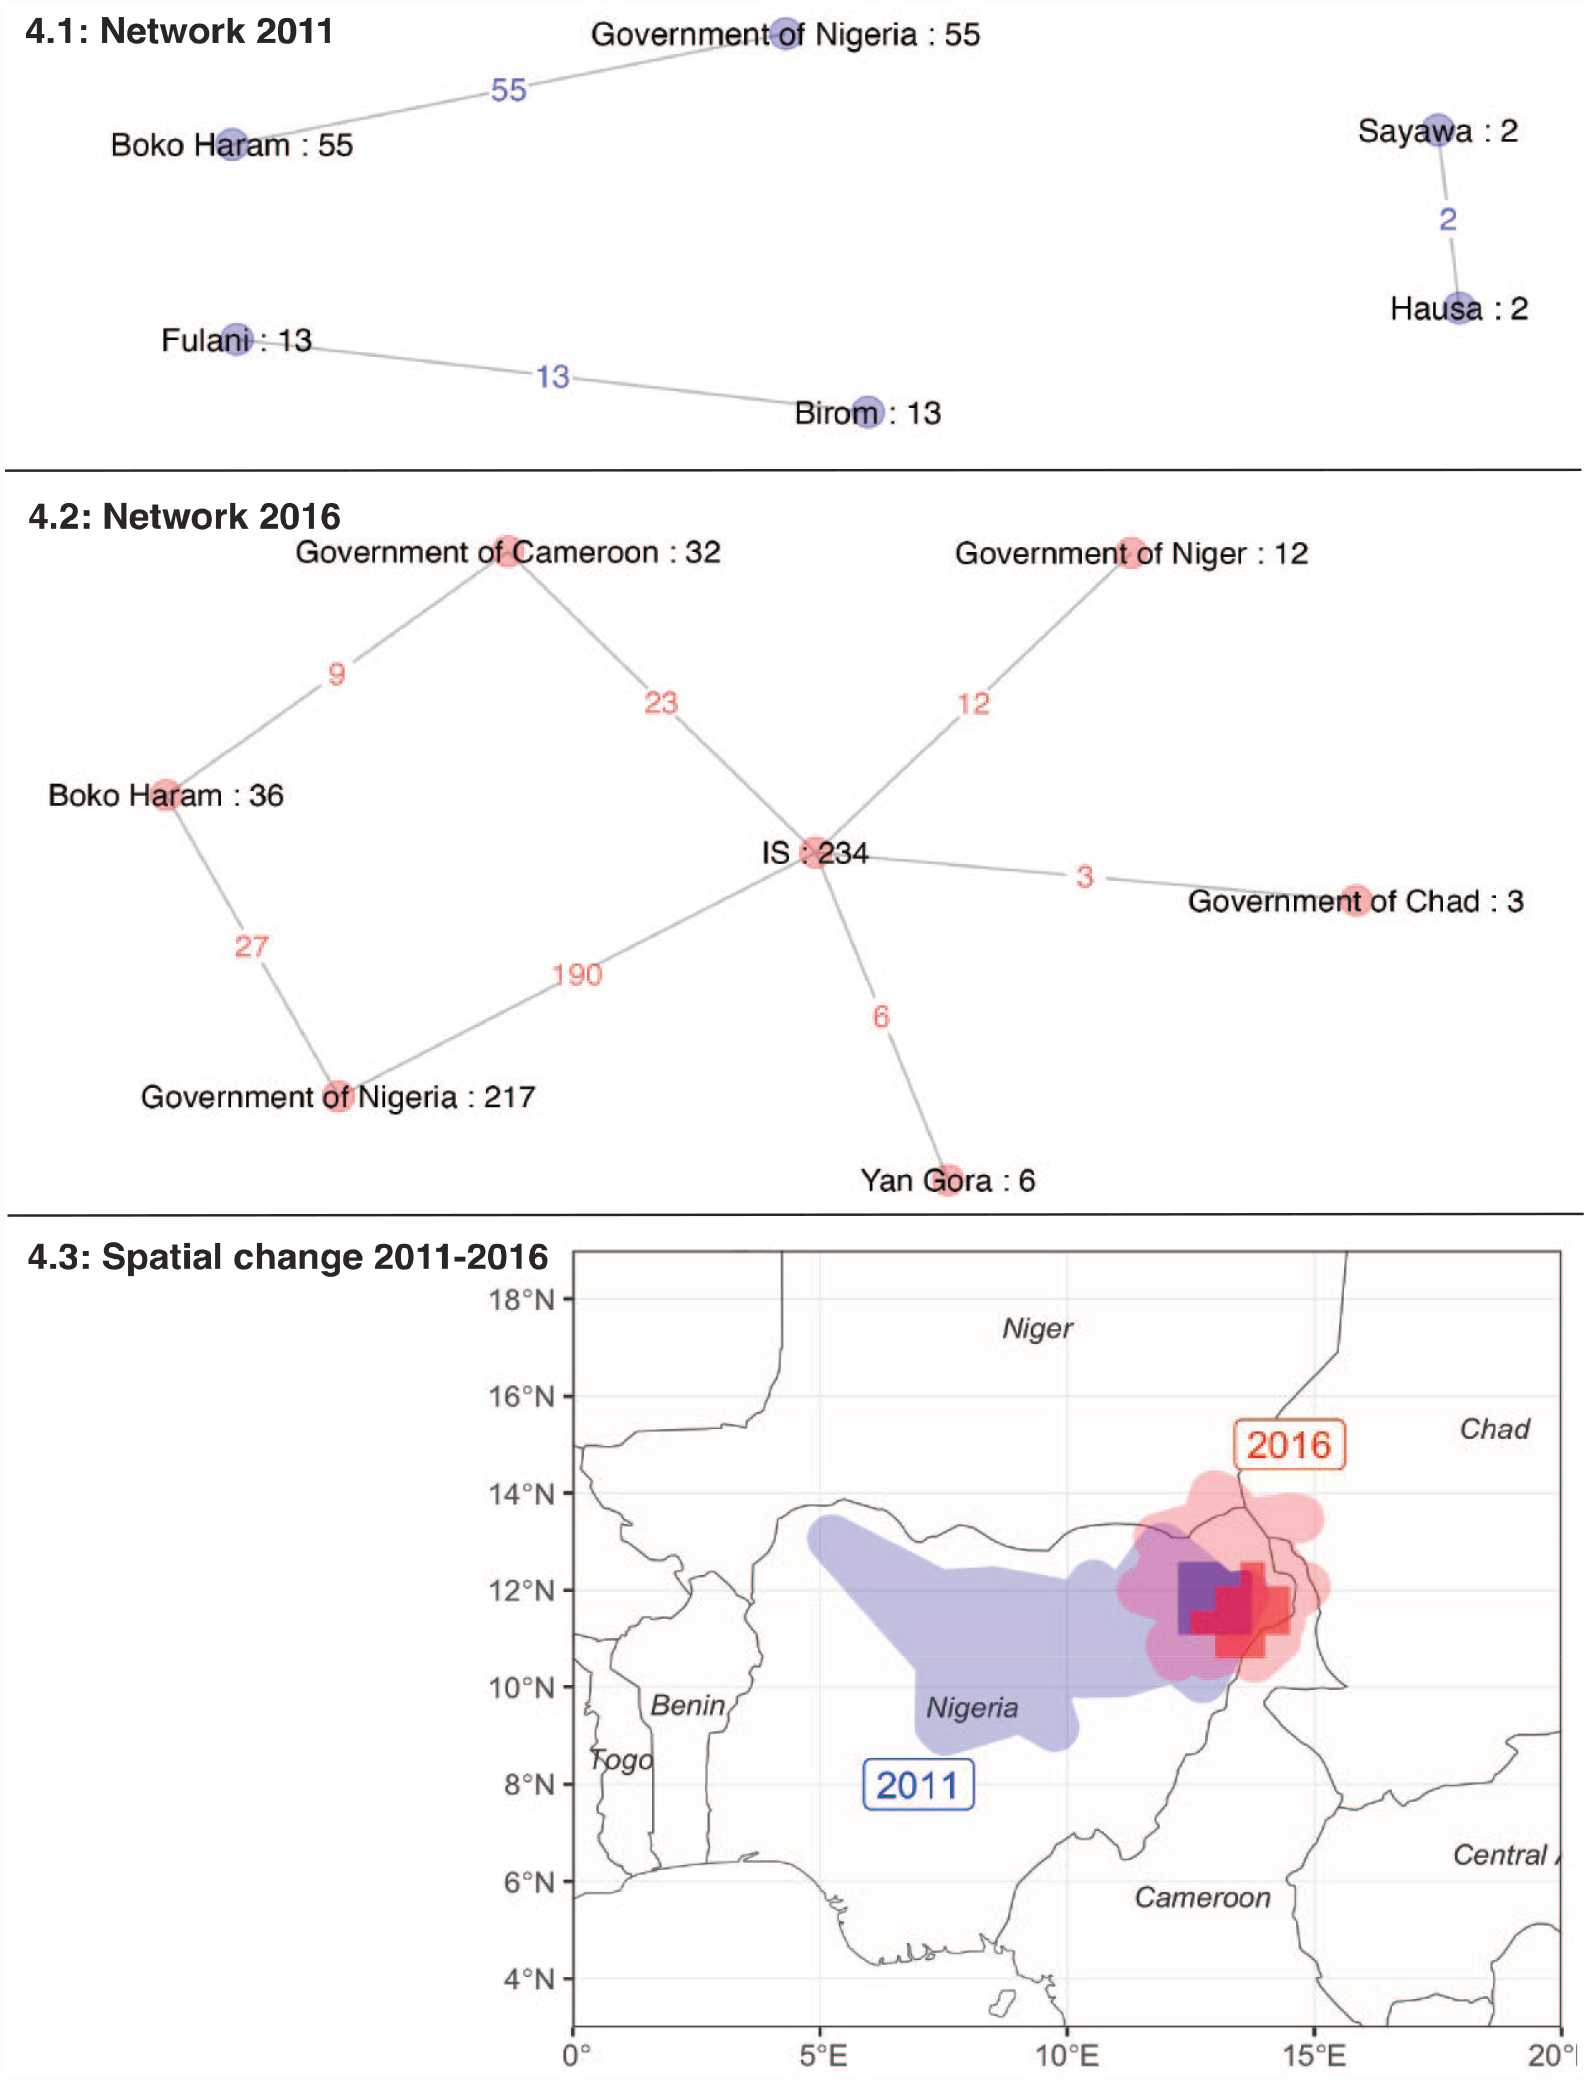
4.1.and 4.2: Violent engagements in the Lake Chad region conflict shape, 2011 and 2016. Black numbers: overall engagements of a conflict actor. Blue/red numbers: mutual engagements between two conflict actors. 4.3: Shifting contraction of the Lake Chad region conflict shape, 2011–2016. Conflict shape overlap 48.3%, hotspot overlap 42.7%.
After 2011, Boko Haram and ISWAP operated increasingly in Lake Chad’s cross-border region, prompting Niger, Cameroon and Chad to join Nigeria in fighting them (Weeraratne, 2017). Their combined military pressure and Yan Gora’s support weakened both groups. The conflict shape contracted to northeastern Nigeria. However, by 2016, ISWAP, a new dominant actor, concentrated its fighting in northern Nigeria near Nigeria’s borders with Chad. Islamist-related conflict events concentrated in Lake Chad’s cross-border region; the conflict shape shifted eastward, including to Chad, Niger and Cameroon.
Low risks and high opportunities attracted ISWAP to focus fighting in the Chad Basin, contributing to the conflict shape’s shift, while contracting. Benefiting from the border’s porosity near Lake Chad and cross-border ethnic ties (Osumah, 2013), al-Barnawi’s group used locals more than Boko Haram to consolidate power. ISWAP remained committed to IS, engaged in state-building activities, and garnered the communities’ support (Ladbury et al., 2016). Due to his dual heritage, Mamman Nur became a significant commander with many Islamist fighters from Cameroon and Chad pledging allegiance to him. Nur joining ISWAP and al-Barnawi’s ties to IS attracted many non-Nigerian recruits. One may argue that ISWAP’s goal to expand the caliphate in West Africa was more regional than Boko Haram’s goal. However, most of ISWAP’s violent engagements with state actors concerned Nigeria’s government, not neighbouring governments (see 2016 network graphs, Figure 4.1 and 4.2), 16 hence the primary target and setting can still be considered Nigeria.
Armed conflict in Colombia (2006–2011)
Conflict shapes and dominant actors
Colombia’s conflict started as left-wing insurgency in 1964, following bipartisan violence from 1948 to 1958. Later, paramilitary groups formed to confront the insurgents, including the Revolutionary Armed Forces of Colombia (FARC), the National Liberation Army (ELN) and the Popular Liberation Army (EPL). The paramilitary groups, which merged under the umbrella organization United Self-Defense Forces of Colombia (AUC) (Pécaut, 2001), fuelled violence in Colombia. Insurgents, paramilitaries and newly formed drug cartels benefited from the cocaine business that grew exponentially in Colombia in the 1970s (Idler, 2019). In 2000, Colombian president Andrés Pastrana and US president Bill Clinton signed Plan Colombia, an initiative aimed at tackling the illegal drug trade and the insurgency. Its implementation entailed eradicating coca cultivation and increasing military pressure on the guerrillas.
Our analysis focuses on 2006–2011, roughly the second half of Plan Colombia’s implementation. Colombia’s government and FARC remained the dominant actors (see Figure 5.1 and 5.2). During this period, the conflict shape contracted; hotspots of high-density violence scattered across Colombia gradually disappeared (apart from one hotspot near Cali). The conflict shapes and hotspots between 2006 and 2011 largely overlapped, at least partly because Colombia’s government grew stronger vis-à-vis FARC and other guerrillas (see Figure 5.3).
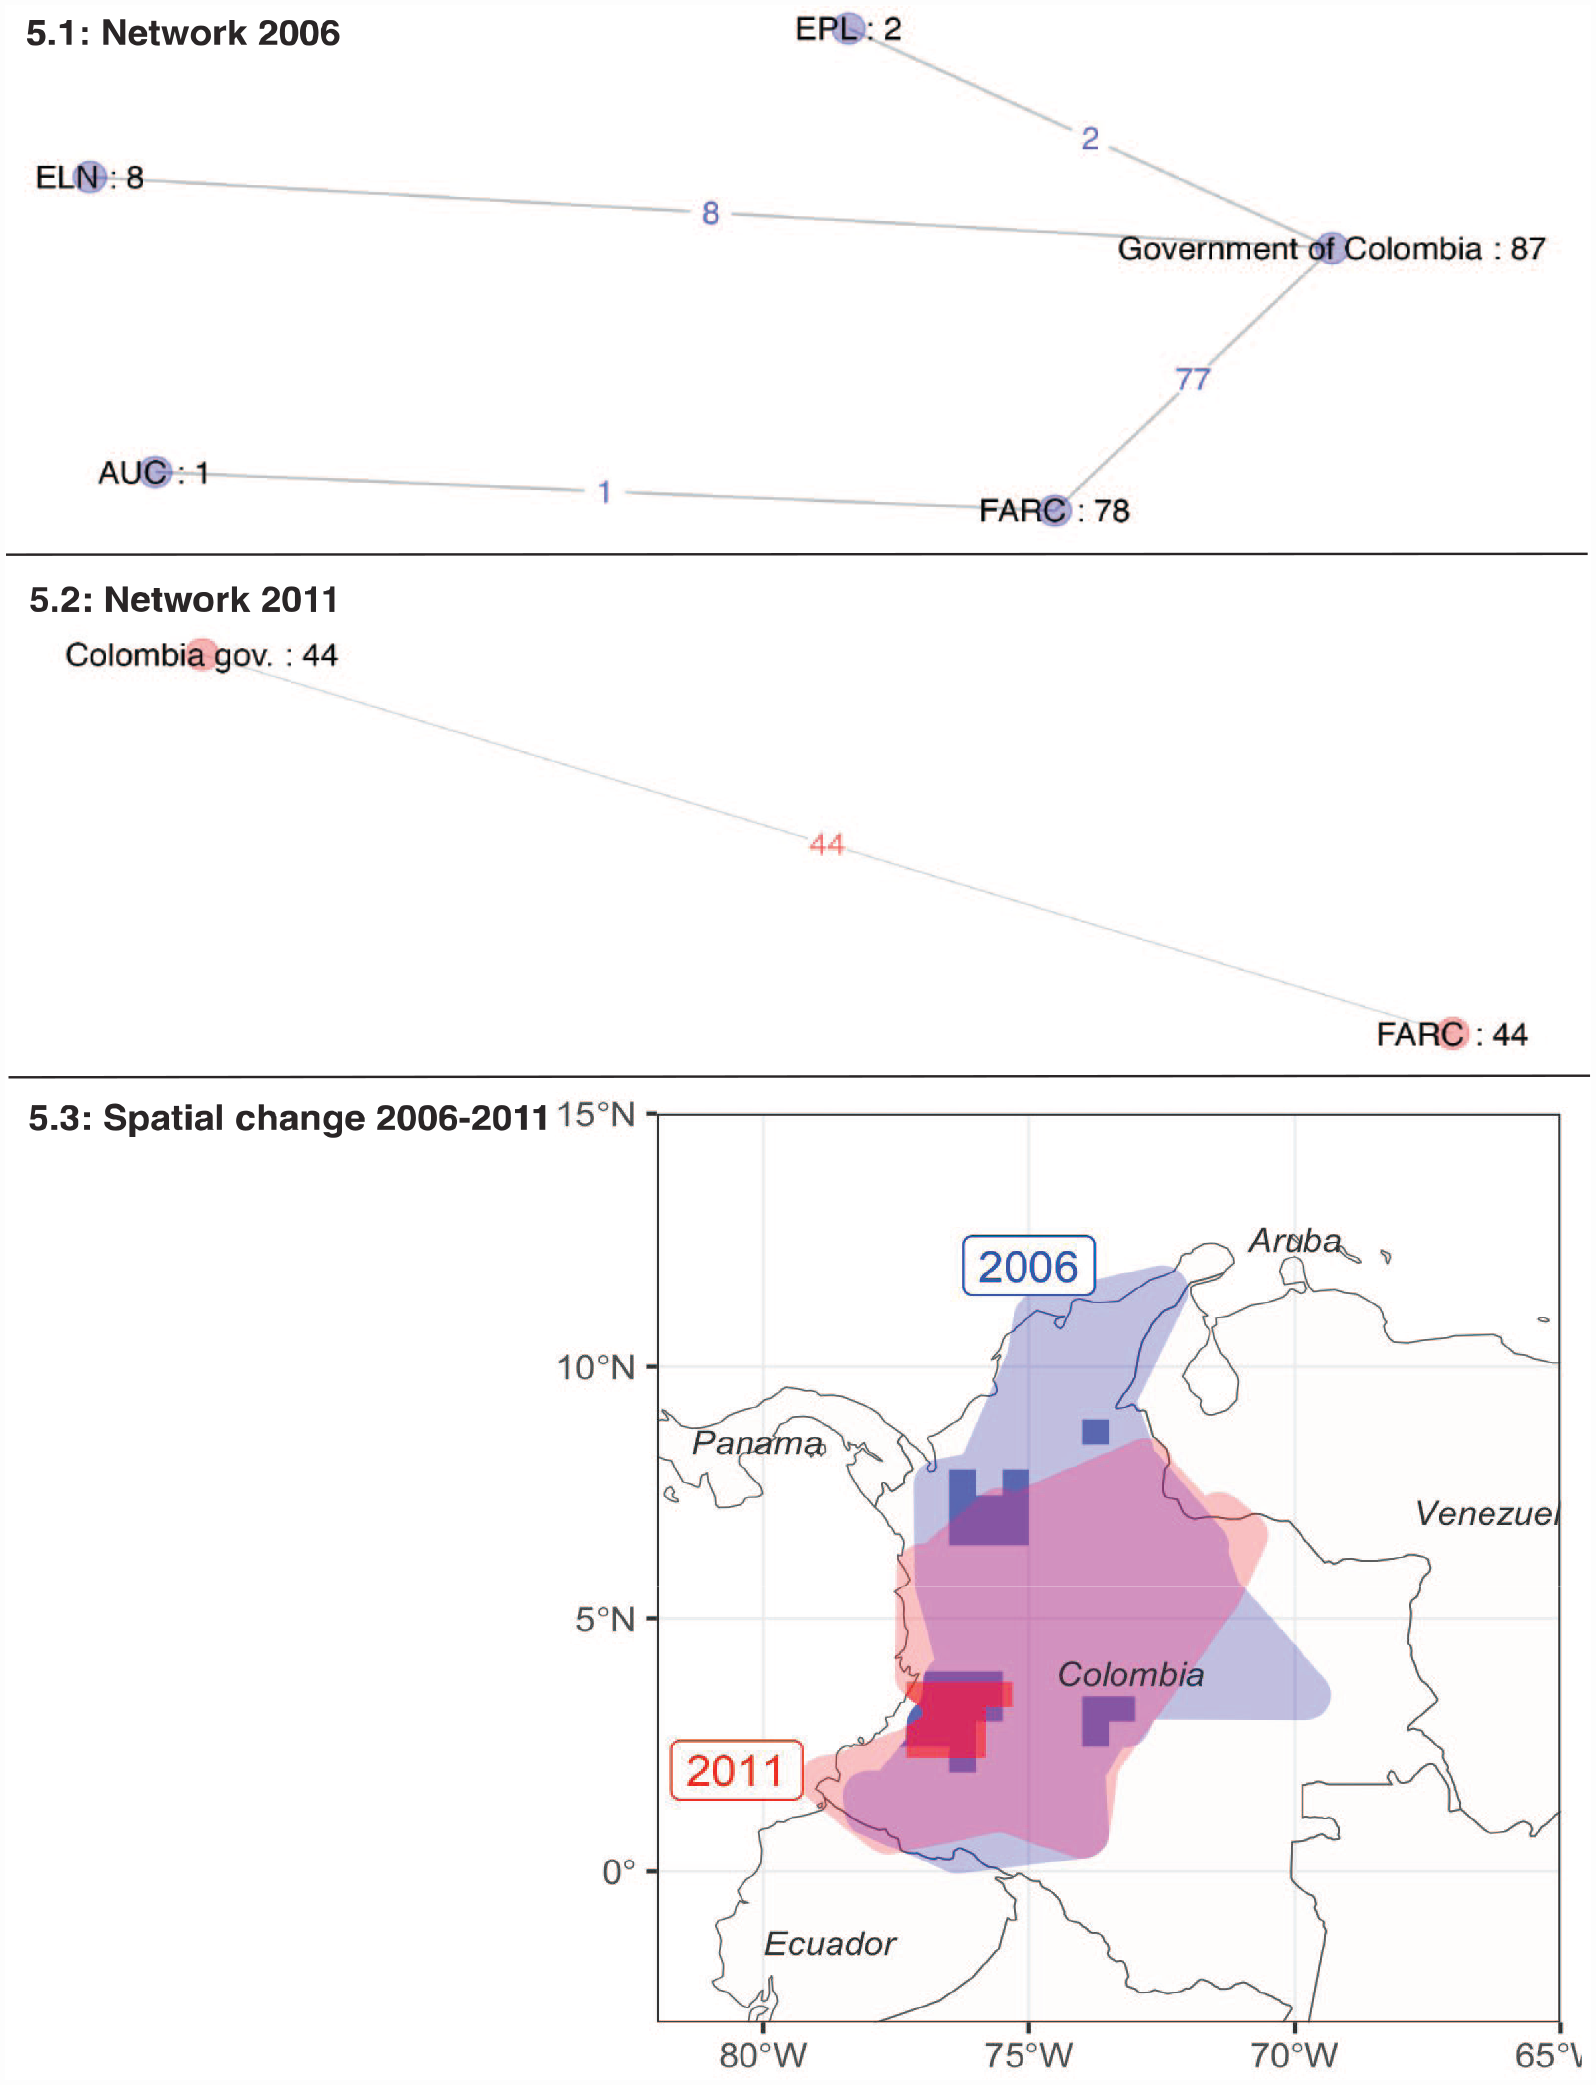
5.1. and 5.2: Violent engagements in the Colombia conflict shape in 2006 and 2011. Black numbers: overall engagements of a conflict actor. Blue/red numbers: mutual engagements between two conflict actors. 5.3: Contraction: Colombia conflict shape 2006–2011. Conflict shape overlap 88.8%, hotspot overlap 78.7%.
Both actors had opportunities and reduced risks in the regions where they were already fighting; the conflict shape did not shift to new territory. 17 After 2006, the size of the area affected by conflict-related violence fluctuated, yet the trend from 2006 to 2011 suggests contraction, concentrating more on the southwest and central-eastern parts of Colombia, especially the Catatumbo region that borders Venezuela. Author interviews in 2011 with farmers in the remote Colombian Putumayo department, bordering Ecuador, suggest that the war persisted as in previous years. 18 Other author interviews in 2011 with farmers, displaced people and human rights defenders in the war-torn Catatumbo region likewise indicate the war’s persistence. 19
To further probe our theory, we study a subsequent period (2012–2016). In 2016, FARC and Colombia’s government signed a ceasefire and then a peace deal that led FARC to demobilize in 2017. The ELN continued to fight Colombia’s government, replacing FARC as dominant actor. The conflict shape contracted because the ELN had fewer troop members and was less militarily active in vast rural areas than FARC, and it shifted toward the Arauca Department and parts of the Norte de Santander Department because these were ELN strongholds (see Figure 6). These regions provided the ELN with high opportunities and low risks. In Arauca, the local authorities supported or were infiltrated by the ELN. Residents stated in author interviews in Arauca in January 2016 that war continued for them, regardless of the anticipated FARC peace deal. 20 The ELN benefited from opportunities to manipulate local politics and garner local support. It also profited from illicit cross-border activities including cocaine trafficking, gasoline smuggling and cattle smuggling, for example by levying taxes on smugglers. 21
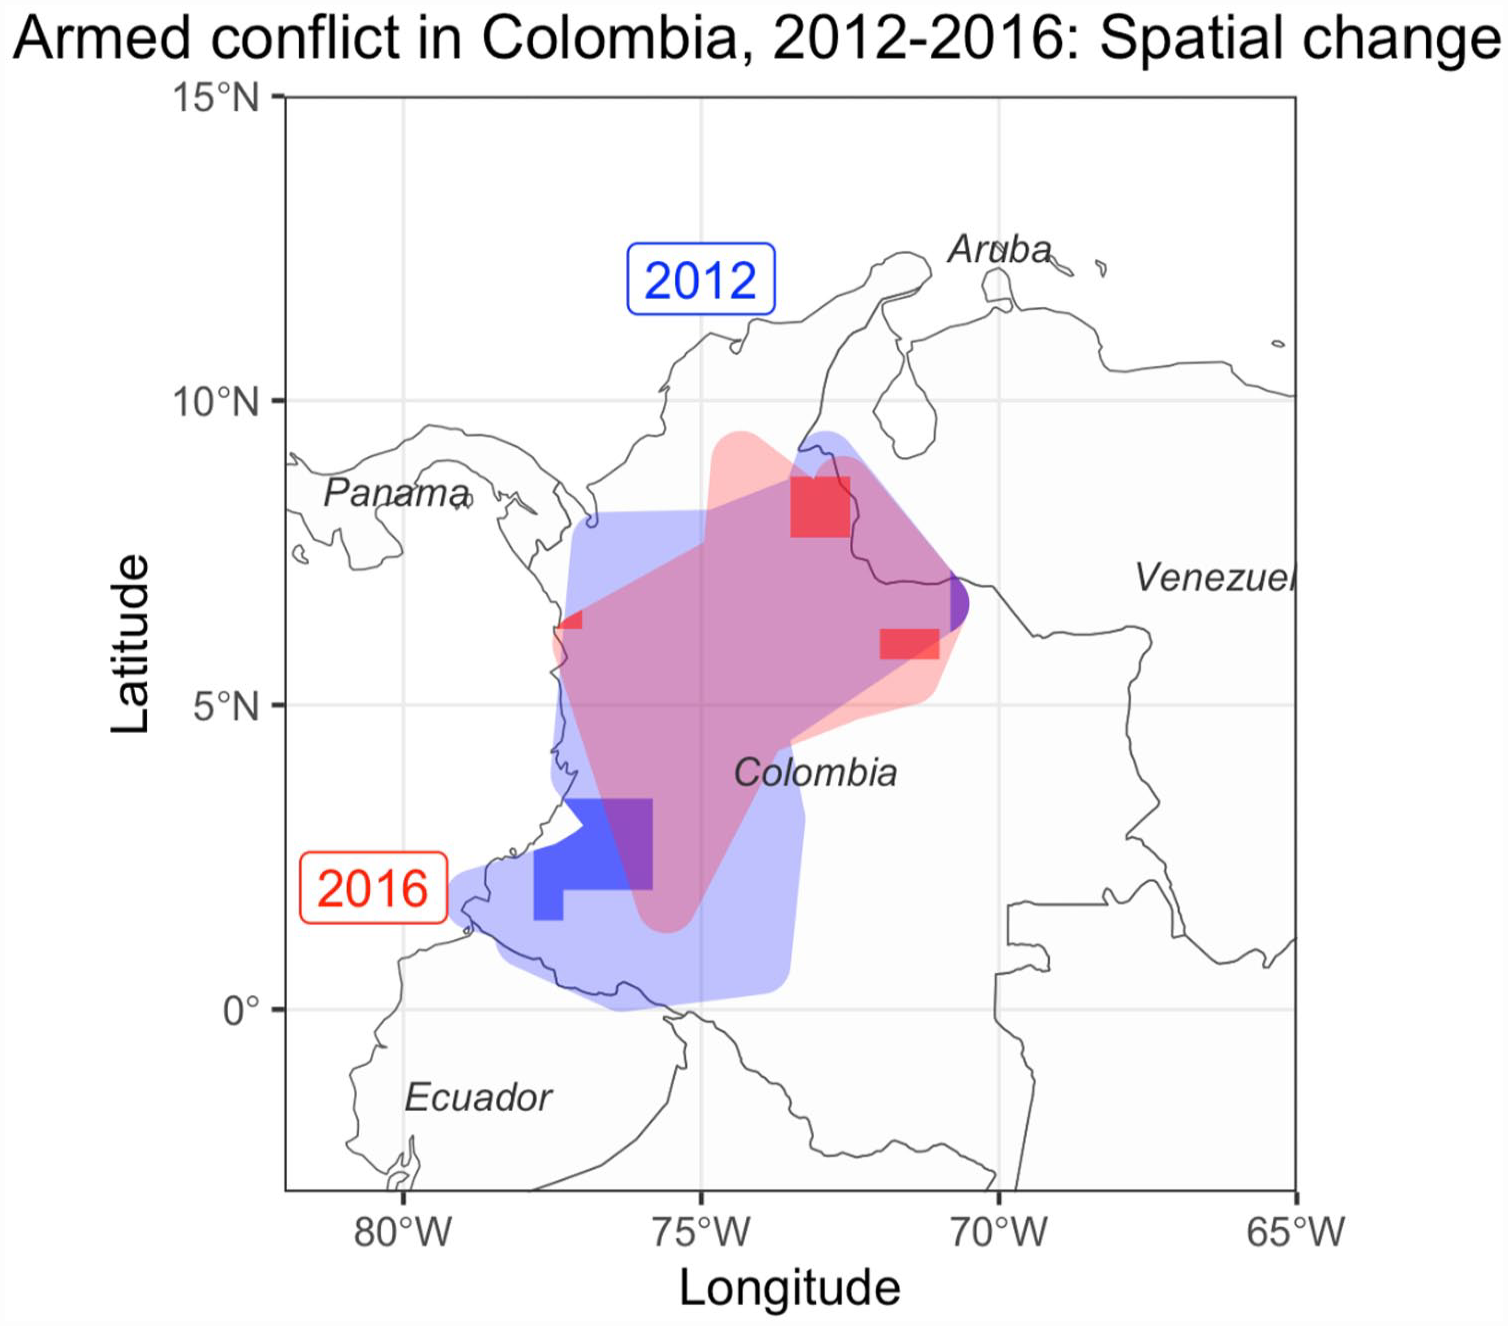
Shifting contraction: Colombia conflict shape 2012–2016. Conflict shape overlap 91.3%, hotspot overlap 0%.
Conclusion
We have theorized how two (actors, environments) of the five dimensions of the framework on change in armed conflict connect (Idler, 2023), and developed a methodology to apply this theory to armed multi-actor conflicts. Through the cases of conflict in the Afghan–Pakistani borderlands, Syria/Iraq, the Lake Chad region and Colombia, we have shown how the emergence of new dominant conflict actors facilitates a spatial shift in conflict-related violence. We have further shown the importance of critically reassessing categories and operationalizations of armed conflict: distinguishing between ‘conflict’ and ‘conflict-related violence’ rather than conflating the two has allowed us to identify the causal mechanism ‘low-risk/high-opportunity attraction’ that helps explain the link between changing actor constellations and the dynamic spatiality of conflict-related violence. Finally, we have shown the value of incorporating visual thinking into our mixed-methods approach: it captures the dynamism of armed conflict across time and space.
Our findings open avenues for future research on the dynamic spatiality of conflict-related violence. First, our approach to constructing the conflict shape draws on UCDP GED data, yet we innovated its use to account for changing actor constellations. Many studies do not fully account for multi-actor engagement in contemporary conflicts due to problematic data availability and use, for example, aggregating data in dyads. Our approach employs existing data but acknowledges the conflict environments’ complexity by accounting for the involvement of actors in conflicts who would not necessarily pass the threshold for inclusion in other methods. By introducing a method that identifies changes in dominant actors, we add nuances that have so far been missing from academic studies. This study has focused on the two most dominant actors for empirical and substantive reasons. The evidence showed that these two matter for shifts of conflict-related violence and we obtained sufficiently rich data to trace this back to low-risk/high-opportunity attraction. Substantively, these two actors together cause a significant number of deaths. Future studies may examine the role of the third most dominant or further conflict actors for the spatiality of conflict-related violence. Also, while our study focuses on the impact of dominant actors and hence we select only those that do become dominant, future research should clarify why and how some actors become dominant while others do not. As we show with robustness checks (see appendix), other event datasets such as ACLED also serve to build conflict shapes. Additionally, conflict shapes are compatible with grid-based data sources, such as PRIO-GRID (Tollefsen et al., 2012). Future research can draw on these and other datasets to test and refine our theory on a larger sample of conflicts and periods, providing a comprehensive picture of multi-actor engagement.
Second, using a similar mixed-methods approach, future studies could compare and systematize contemporary or historical analyses of shifting territorialities. Such research can explore whether additional factors, including the actor type, affect shifts in conflict-related violence. For example, we do not differentiate between state or non-state actors analytically as we focus on detecting shift and causal mechanisms. Future work could systematically compare new dominant state and non-state actors in their influence on violence spatiality. Deepening the process tracing of low-risk/high-opportunity attraction and of the new dominant actors’ role through ethnographic methods could elucidate how religion, ideology and ethnicity influence spatial shift. Third, adding data layers related to conflict event density to conflict shapes allows researchers measuring changing areas of violence-affected territories to compare socioeconomic characteristics of conflict shapes with those of areas not impacted by conflict events.
The theory of spatial shift in conflict-related violence has implications for conflict prevention, peacebuilding, peacekeeping and humanitarian efforts. Knowing when and where a conflict shape and hotspots might shift can help humanitarian agencies mitigate the impact of violence on civilians and their staff. For example, after the Taliban took over Afghanistan in 2021, IS-K violently opposed the Taliban-run government. Compared with the pre-2021 period when the Taliban were a non-state actor fighting Afghanistan’s government, it is likely that IS-K became a new dominant actor facing the Taliban-led government. Based on our theory, the conflict shape is likely to shift, with hotspots in Nangarhar province and near Afghanistan’s borders with the former FATA where IS-K originated and recruited fighters (Osman, 2016).
Policymakers and practitioners benefit from this dynamic understanding of armed multi-actor conflict that demonstrates why and how they need to regularly update their approaches to keep up with complex security landscapes. This need for updating concerns, first, the actors involved in armed conflict: addressing individual conflict actors in silo is likely to fail because it ignores how new actors connect to the original ones. The network graphs in Figure 3.1 and 3.2 for example demonstrate how the conflict shape in the Afghan–Pakistani borderlands comprised a more complex web of conflict actors in 2008 compared to 2006. Using network graphs to display the total number of engagements in conflict events for each actor instead of tables thus helps convey information about changing actor constellations.
The need to regularly update policy approaches in line with changing conflict dynamics further concerns spatial shift. This becomes clear when drawing maps such as Figure 1.3 that displays the shifting expansion of the Syria/Iraq conflict shape. While maps with dot clouds showing individual conflict events or other commonly used maps serve to obtain momentary snapshots of conflict situations, our approach of overlaying polygons that summarize conflict-related violence show trends in spatial change. The resulting graphs not only visualize how the overall area of conflict-affected violence shifts over time but also indicate the location of areas most in need of humanitarian relief: the hotspots. These areas are often located close to border areas such as northern Iraq in 2010. Drawing on visual thinking as in our research is thus not only an effective way to support scholarly analysis and present results to an academic audience but can also guide the community of practice in adequately tailoring their responses.
By tracing how low-risk/high-opportunity territories attract new dominant conflict actors, policymakers can mitigate further shifts of conflict-related violence. Measures include heightening risks for non-state conflict actors through more legitimate state presence to drain these actors’ support base and investing in the legal economy to curb illicit economic activities as the conflict actors’ income source. Ultimately, understanding why and how conflict shapes shift helps tailor responses to the economic, social and historical context of the regions affected by conflict-related violence, thus saving more human lives.
Supplemental Material
sj-docx-1-ips-10.1177_01925121231177445 – Supplemental material for Conflict shapes in flux: Explaining spatial shift in conflict-related violence
Supplemental material, sj-docx-1-ips-10.1177_01925121231177445 for Conflict shapes in flux: Explaining spatial shift in conflict-related violence by Annette Idler and Katerina Tkacova in International Political Science Review
Footnotes
Acknowledgements
We are grateful for the helpful comments by John Alderdice, Giovanni Capoccia, Diane Davis, Markus Hochmüller, Stathis Kalyvas, Keith Krause, Dáire McGill, Ricardo Nogales, Christian Oldiges, Amanda Pearson, Costantino Pischedda, Andrea Ruggeri, Daniele Rugo, and the two anonymous reviewers for the International Political Science Review. We also thank our colleagues at Oxford University’s T. E. Lawrence Programme on the Study of Conflict; our co-panellists and the participants at the International Studies Association Annual Convention 2021 and 2022; the participants at the Politics Colloquium at the Department of Politics and International Relations, University of Oxford; and colleagues at Harvard University’s Weatherhead Center for International Affairs for their valuable feedback.
Funding
The author(s) disclosed receipt of the following financial support for the research, authorship, and/or publication of this article: This research was funded by the Arts & Humanities Research Council and the Economic & Social Research Council through the Partnership for Conflict, Crime & Security Research, awarded for the project ‘The Changing Character of Conflict Platform: Understanding, Tracing, and Forecasting Change across Time, Space, and Cultures’ (Grant Ref: AH/P005446/1) and by the Arts & Humanities Research Council that supported the project ‘Network for Change: Building on the Changing Character of Conflict Platform’ (Grant Ref: AH/V011375/1).
Supplemental Material
Supplemental material for this article is available online.
Notes
Dr Annette Idler is Associate Professor in Global Security at the University of Oxford’s Blavatnik School of Government and the Director of the Global Security Programme at Oxford’s Pembroke College. Her research focuses on global security at the interface of armed conflict and the illicit economy. Presses including Oxford University Press and journals including World Politics and the Journal of Global Security Studies have published her work.
References
Supplementary Material
Please find the following supplemental material available below.
For Open Access articles published under a Creative Commons License, all supplemental material carries the same license as the article it is associated with.
For non-Open Access articles published, all supplemental material carries a non-exclusive license, and permission requests for re-use of supplemental material or any part of supplemental material shall be sent directly to the copyright owner as specified in the copyright notice associated with the article.