
Abstract
We analyse the relationship between multidimensional poverty trends and changing dynamics of conflict in Nigeria in 2008–2018. We take a wide notion of poverty going beyond purely monetary hardships and considering simultaneously experienced non-monetary deprivations. Focusing on poverty experienced by people living in conflict affected areas, post conflict-areas and peaceful areas helps us understand how well-being changes with conflict, and how conflict may alter previous trends of poverty reduction. We pay particular attention to address the changing nature of conflict within zones and across neighbouring states. For this, we compare the poverty–conflict nexus across bordering regions in a spatial regression framework. We find that conflict arises not necessarily in the poorest Nigerian states, but in some of the relatively better-off states. Furthermore, we find that although levels of the Multidimensional Poverty Index decreased between 2008 and 2013, conflict may have played a major role in halting these trends, if not reverting them.
The Igbo culture says no condition is permanent. There is constant change in the world. (Achebe, 2012, p. 38)
Introduction
Our article contributes to the Special Issue by presenting a novel approach to studying the concurrent changes in conflict and poverty. We recognize that patterns of violent conflict are constantly changing and evolving over time and across space while, at the same time, progress in poverty alleviation is varying significantly as well. Furthermore, advances in the latter and increases in the former are by no means constant and interact differently across time and space. We study possible linkages between these two phenomena by explaining the relationship between poverty trends and changing dynamics of conflict in Nigeria. Recognizing Chinua Achebe’s introductory quote, our study helps to understand the poverty–conflict nexus better by acknowledging that no condition of poverty or conflict is permanent. Observing 10 years of constantly changing and spatially evolving types of conflict, our study juxtaposes and connects these to significant gains as well as standstills in poverty reduction in Africa’s most populous country.
In the early 2000s, Crost et al. (2014) posited that ‘not a single low-income conflict-affected country has yet achieved the Millennium Development Goals’ (p. 1833)’. Furthermore, they assert that compared to people living without conflict, ‘the estimated one-and-a-half billion people living in conflict-affected countries are substantially more likely to be undernourished, less likely to have access to clean water and education and face higher rates of childhood mortality (p. 1833).’ On the relationship between monetary poverty (as measured by the $1.90 per day poverty line) and conflict, the World Bank (2020) notes a positive relationship between poverty and past conflict at the sub-national level: ‘poverty rates tend to be higher, on average, in areas with higher levels of conflict debt, although this correlation is not strong (p. 134).’
We address two gaps within the puzzle of conflict and poverty. First, we investigate how the concurrent changes in conflict events and poverty interact over time at the sub-national level and across state boundaries in Nigeria. By conflict events we mean any type of event recorded by the Armed Conflict Location Event Data Project (ACLED), which includes battles, explosions, remote violence, violence against civilians, protests, riots and strategic developments. Second, we use a novel yet widely established concept of poverty in a broad sense – namely, multidimensional poverty – which encompasses several forms of poverty. The latter allows us to study the intensity as well as the incidence of multidimensional poverty over time.
We focus on Nigerian states between 2008 and 2018, since Nigeria makes for a particularly relevant case study. Nigeria has witnessed a sharp rise in violent conflict events during the period of our study, especially via Boko Haram-related events in the north of the country, and in herder-farmer and oil-related conflict events in other parts of the country. These events have increased in number and intensity (fatalities). Furthermore, despite being Africa’s second-largest economy, Nigeria is home to the largest number of multidimensionally poor people in Africa (Jennings and Oldiges, 2020), and second-largest globally (Alkire et al., 2020a). Simultaneously, levels and intensity of poverty vary substantially across states, especially between the northern – some of which are among the world’s poorest regions – and the southern states. Although conflict events have been increasing unevenly and in different patterns across the country over the years, trends in levels and intensity of poverty have been heterogenous as well.
Methodologically, and similar to other contributions to this Special Issue (see especially Rugo, 2023; Alderdice, 2023), we emphasize people’s experiences in addition to observed phenomena and thus promote dialogue among differing epistemologies and methodologies as a means to enhance understanding of changing conflict dynamics (Della Porta and Keating, 2008).
Even though we rely in our data collection on observed conflict events, as Idler and Tkacova (2023) do elsewhere in this Special Issue, our approach towards the experience of conflict is people-centred in so far as we consider multiple, simultaneously experienced deprivations, building on Amartya Sen’s (2001) capability approach. According to the latter, income is considered as a means to an end, whereas achievements in various ‘functionings’, such as leading a healthy and long life or being educated, capture people’s lived experience of their quality of life. We build on this, using a counting methodology (Alkire and Foster, 2011) that helps quantify people’s lived achievements or the lack thereof – deprivations – in various dimensions. We use household-level data for three rounds of the regionally representative Demographic and Health Surveys (DHS) of 2008, 2013 and 2018, and compute individual deprivation profiles, following the routines used for the global Multidimensional Poverty Index (MPI) (United Nations Development Programme (UNDP) and Oxford Poverty and Human Development Initiative (OPHI), 2020). Counting the simultaneous deprivations of people living in conflict affected areas, post conflict-areas and peaceful areas helps us understand how well-being changes with conflict, and how conflict may halt or reverse previous trends of poverty reduction.
Our measure of conflict events is an accumulated sum of conflict events as recorded by ACLED at the regional level for 2003 to 2018, and for different time intervals in between. As per the ACLED definition: The fundamental unit of observation in ACLED is the event. Events involve designated actors e.g., a named rebel group, a militia or state forces. They occur at a specific named location (identified by name and geographic coordinates) and on a specific day. (ACLED, 2021)
Aggregating events of conflict by broader groups at the regional level, we generate a regional panel of conflict events which accounts for the different types of conflict.
To estimate the relationship between conflict events and poverty, we undertake a descriptive analysis of the DHS-ACLED regional panel and an econometric one, in which we control for state fixed effects. We also address the changing nature of conflict within zones and across neighbouring states. For this purpose, and parallel to Idler and Tkacova (2023) in this Special Issue, we compare border regions in a spatial regression framework, acknowledging that ‘border regions are more similar in terms of people’s experiences and perceptions of conflict than countries’.
Although our analysis stays clear of claiming causality, we show how poverty reduction and increases may go hand in hand with a rise in conflict events, demonstrating the policy relevance of our findings. We find that conflict arises not necessarily in the poorest Nigerian states, but in some of the relatively better-off states. Furthermore, we find that although levels of the MPI decreased between 2008 and 2013, conflict may have played a major role in halting these trends, if not reverting them. Our empirical findings based on spatial regression framework point towards conflict spillovers or indirect associations between conflict and MPI levels: the likelihood of a conflict event taking place in any Nigerian state is positively associated with lower MPI levels in that state or its immediate neighbours.
Our findings add to the literature that studies the relationship between the changing character of conflict and well-being and poverty as well as development. Elsewhere in this Special Issue, Dursun-Özkanca (2023) demonstrates how economic inequalities between conflict parties can influence conflict dynamics including spatial changes in conflict and hinder the resolution of armed conflict at the interstate level. Our study complements these insights by shedding light on the relevance of development and inequalities at the intra-state level. It aligns with recent research that uncovers sub-national heterogeneity in terms of the conflict–poverty nexus using household-level data in combination with localized and geo-coordinated conflict data (Mueller and Techasunthornwat, 2020; Verwimp et al., 2018). Since we account for deprivations in health and education in a multidimensional poverty framework and find statistically significant correlations between conflict and multidimensional poverty, our findings speak to recent evidence on conflict in Nigeria being associated negatively with monetary poverty, with food insecurity (see e.g. Kaila and Azad, 2019) and with school enrolment (Bertoni et al., 2019). Lastly, our empirical findings on spatial conflict spillovers complement Alderdice (2023), as well as Idler and Tkacova (2023) elsewhere in this Special Issue, underscoring the importance of territoriality, place and space. Our findings provide a new and multidimensional lens on where conflict prevention needs to take place and how conflict prevention is a necessary condition for eradication of poverty in all its forms.
The paper is structured as follows: we first provide a background to the poverty–conflict nexus and endogeneity (second section), followed by an introduction of data and methodologies used to estimate poverty and conflict (third section). Based on our DHS-ACLED state panel, we describe the nature of poverty and conflict in Nigeria between 2003 and 2018 (fourth section), followed by an empirical and spatial estimation of the link between the two at sub-national level (fifth section). We provide some discussion of the results and concluding remarks in the sixth section.
Background to the poverty–conflict nexus and deprivations as people-centred poverty
People-centred measure of the quality of life or lack thereof
As the most populous African nation, Nigeria is home to the highest number of poor people globally, according to monetary poverty (World Bank, 2020). Many parts of Nigeria risk not reaching the first Sustainable Development Goal (SDG): the eradication of poverty (see e.g. Sumner et al., 2020). SDG 1 in its first target aims to eradicate extreme poverty as measured by a monetary poverty line of $1.90 a day. Yet the second target is to reduce by half the ‘proportion of men, women and children of all ages living in poverty in all its dimensions according to national definitions’. 1 This widely accepted notion of multidimensional poverty builds on Sen’s (2001) capability approach to capture people’s lived experiences of poverty in its many forms.
Arguably, this broad notion of poverty is most often measured by the global MPI, as reported regularly in the UNDP Human Development Reports since 2010. According to the 2020 global MPI, sub-Saharan Africa is the poorest region globally, with more than 593 million people living in multidimensional poverty, contributing more than 40% to the global number of MPI poor people (Jennings and Oldiges, 2020; UNDP and OPHI, 2020). In a cluster of neighbouring sub-national regions across the Sahel, poverty rates are around 90% or higher, as, for example, in Niger, Chad, Mali and northern Nigeria (Jennings and Oldiges, 2020).
Poverty and conflict
For several sub-Saharan African countries including Nigeria, poverty reduction has been slow in the early 2000s, with annual reductions in the headcount ratio of barely one percentage point in Nigeria, Ethiopia and Cameroon (Jennings and Oldiges, 2020). This indicates a standstill in terms of poverty eradication during the last decade (Alkire et al., 2020c). Simultaneously, many of the poorest African countries have witnessed armed actors engaged in conflict since the early 2000s. Prominent examples are Al-Qaeda and Islamic State-linked groups across the Sahel; Boko Haram in bordering regions of Nigeria, Niger, Chad and Cameroon; violent groups in East Africa across Somalia stretching into Kenya; and actors involved in domestic conflicts within, for example, the Democratic Republic of Congo and the Central African Republic (see e.g. World Bank, 2011, 2020).
Endogeneity
In the development economics literature on the relationship between conflict and development, the relationship between poverty and armed conflict is considered endogenous, implying reverse causality. An emerging strand of literature which employs household level data shows, for example, the long-term and adverse health effects of wars on child and adolescent growth (Akresh et al., 2011, 2012). Methodologically speaking, to circumvent the problem of endogeneity, Brück et al. (2019) explain that ‘the strategy of instrumenting conflict exposure with the distance to geographical areas of maximum conflict intensity which could be either the border or the capital of a country is widespread in the empirical literature (p. 210)’ (Adelaja and George, 2019; Blomberg et al., 2006; Brück et al., 2014; Justino and Verwimp, 2013; Justino et al., 2013; Verwimp et al., 2018). Similar to Idler and Tkacova (2023) in this Special Issue, although we do not employ an instrumented variable per se in our empirical methodology, our spatial regression framework allows accounting for distances to conflict zones.
Data and methodology for estimating poverty and conflict
Poverty data: DHS
We use the latest three and standardized rounds of the DHS – 2008, 2013 and 2018 – to estimate multidimensional poverty consistently at the sub-national level, across all Nigerian states. The DHS is unique for including questions that permit the calculation of anthropometric measures of underweight and stunting as well as various indicators of education and living standards. Standardized globally and largely also over time, the DHS makes comparisons over time and across countries and across sub-national regions feasible. For the years 2013 and 2018, we rely on state-level global MPI estimates as calculated by Alkire et al. (2020b). For 2008, we rely on our own estimates of state-level global MPI as these are not published elsewhere. Although we retrieve state-level population shares from the DHS, we rely on year-wise population totals for Nigeria from the United Nations Department of Economic and Social Affairs (UNDESA) (2020).
The global MPI
The global MPI measures acute poverty reflecting the dimensions of health, education and living standards. Spanning 10 indicators in total, each dimension is weighted by one-third and equal weights are applied within each dimension. The indicators for health are nutrition and child mortality; for education they are school attendance and years of schooling; and for living standards they are drinking water, sanitation, electricity, cooking fuel, housing and assets. 2 The global MPI has two components: the incidence and the intensity of poverty. The incidence or the proportion of the multidimensionally poor people is the headcount ratio (H) of multidimensional poverty. With a poverty cut-off of one-third, any person who is deprived in at least one-third of the weighted indicators is identified as being multidimensionally poor. The average intensity (A) of multidimensional poverty reflects the average deprivation share among the poor. The MPI is thus the product of H and A: MPI = H × A. Since for each indicator an indicator-specific cut-off is applied (see UNDP and OPHI, 2020 for more details), the global MPI essentially relies on a dual cut-off approach following closely the Alkire-Foster counting method (Alkire and Foster, 2011). For the purpose of this paper, only the state-level MPI is of relevance. By applying this method to measure absolute – not relative, or inequality-focused – multidimensional poverty, our paper is aligned with studies that posit the joint distribution of human deprivations at the centre of analysis.
Conflict data: ACLED
We rely on conflict data as collected by the ACLED (2021) because these data allow us to account for the different types of conflict events, which may or may not involve fatalities (see Eck, 2012). Importantly, we can distinguish between different types of conflict events. According to ACLED (2021), ‘the fundamental unit of observation in ACLED is the event’ (n.p.). The latter ‘involves designated actors and occurs at a specific named location’ (n.p.).Importantly for this study, locations are georeferenced, and events are dated by day.
To fully understand the dynamics of insecurity and how trends in violence evolve long-term, one should adopt a holistic vision of contemporary forms of conflict, violence and insecurity beyond armed conflict. Thus, we include all types of conflict events including non-fatal ones such as riots, protests and demonstrations, as well as violence against civilians, as these may impact or be spurred by the quality of life and thus poverty. 3
Aggregating conflict events
We aggregate ACLED data on conflict events by type at the state level and for each year from 2003 to 2018, and we produce time intervals of five years. For each state, we calculate year-wise totals of the incidence of conflict events – that is, a counter of conflict events – separately. We group available ACLED event types into four broad categories as follows: 4
Battles: violent interactions between two organized armed groups.
Strategic developments and explosions/remote violence: strategically important instances of non-violent activity by conflict actors and other agents within the context of conflict or broader political disorder. These can include recruitment drives, incidents of looting, and arrests. An event involving one side using remote weapons (e.g. artillery). These events can be against other armed actors, or used against civilians;
Riots or protests: violent events where demonstrators or mobs engage in destructive acts against property and/or disorganized acts of violence against people. Public demonstrations in which the participants are not violent.
Violence against civilians: violent events where an organized armed group deliberately inflicts violence upon unarmed non-combatants.
Using as many events as possible, we can distinguish riots or protests (type 3), which may or may not involve fatalities, from, for example, military clashes (type 1) which typically have more fatalities. For our analysis of a people-centred approach to poverty and conflict, it is important to account for ‘violence against civilians’ (type 4) as a separate type of conflict event since it has repercussions on peoples’ lives without necessarily involving fatalities. By doing so, we aim to capture a more holistic and dynamic view of conflict and violence.
We aggregate conflict events by time intervals of 2003–2007, 2008–2012 and 2013–2017, so that all state-level poverty estimates for 2008, 2013 and 2018 are aligned to a five-year time period of previous conflict events.
Poverty and conflict in Nigeria over time
Trends and the changing forms of multidimensional poverty
Nigeria is both the most populous African country and the poorest, with almost 100 million people living in multidimensional poverty (Jennings and Oldiges, 2020). According to extreme monetary poverty ($1.90 poverty line), 50 million people live below the national poverty line – more than anywhere else in the world (National Bureau of Statistics, 2020).
We study the period for which we have data on multidimensional poverty at the state level. We show in Figure 1 how the MPI decreased across most states between 2008 and 2013 but stagnated or increased between 2013 and 2018. The pattern of a north–south divide that is known for monetary poverty (National Bureau of Statistics, 2020) is also evident for multidimensional poverty. The poorest states are located in the north, bordering Niger and Chad. Many of these states in the predominantly Muslim north east saw a decline in the MPI between 2008 and 2013, visibly so in the neighbouring states of Borno, Gombe and Adamawa. Although there was little improvement in the far north west, some states like Kano reduced the MPI between 2008 and 2013, while Kaduna saw an increase. In the north-central and southern parts of Nigeria, the MPI mostly decreased, indicating progress and an improvement in overall well-being.
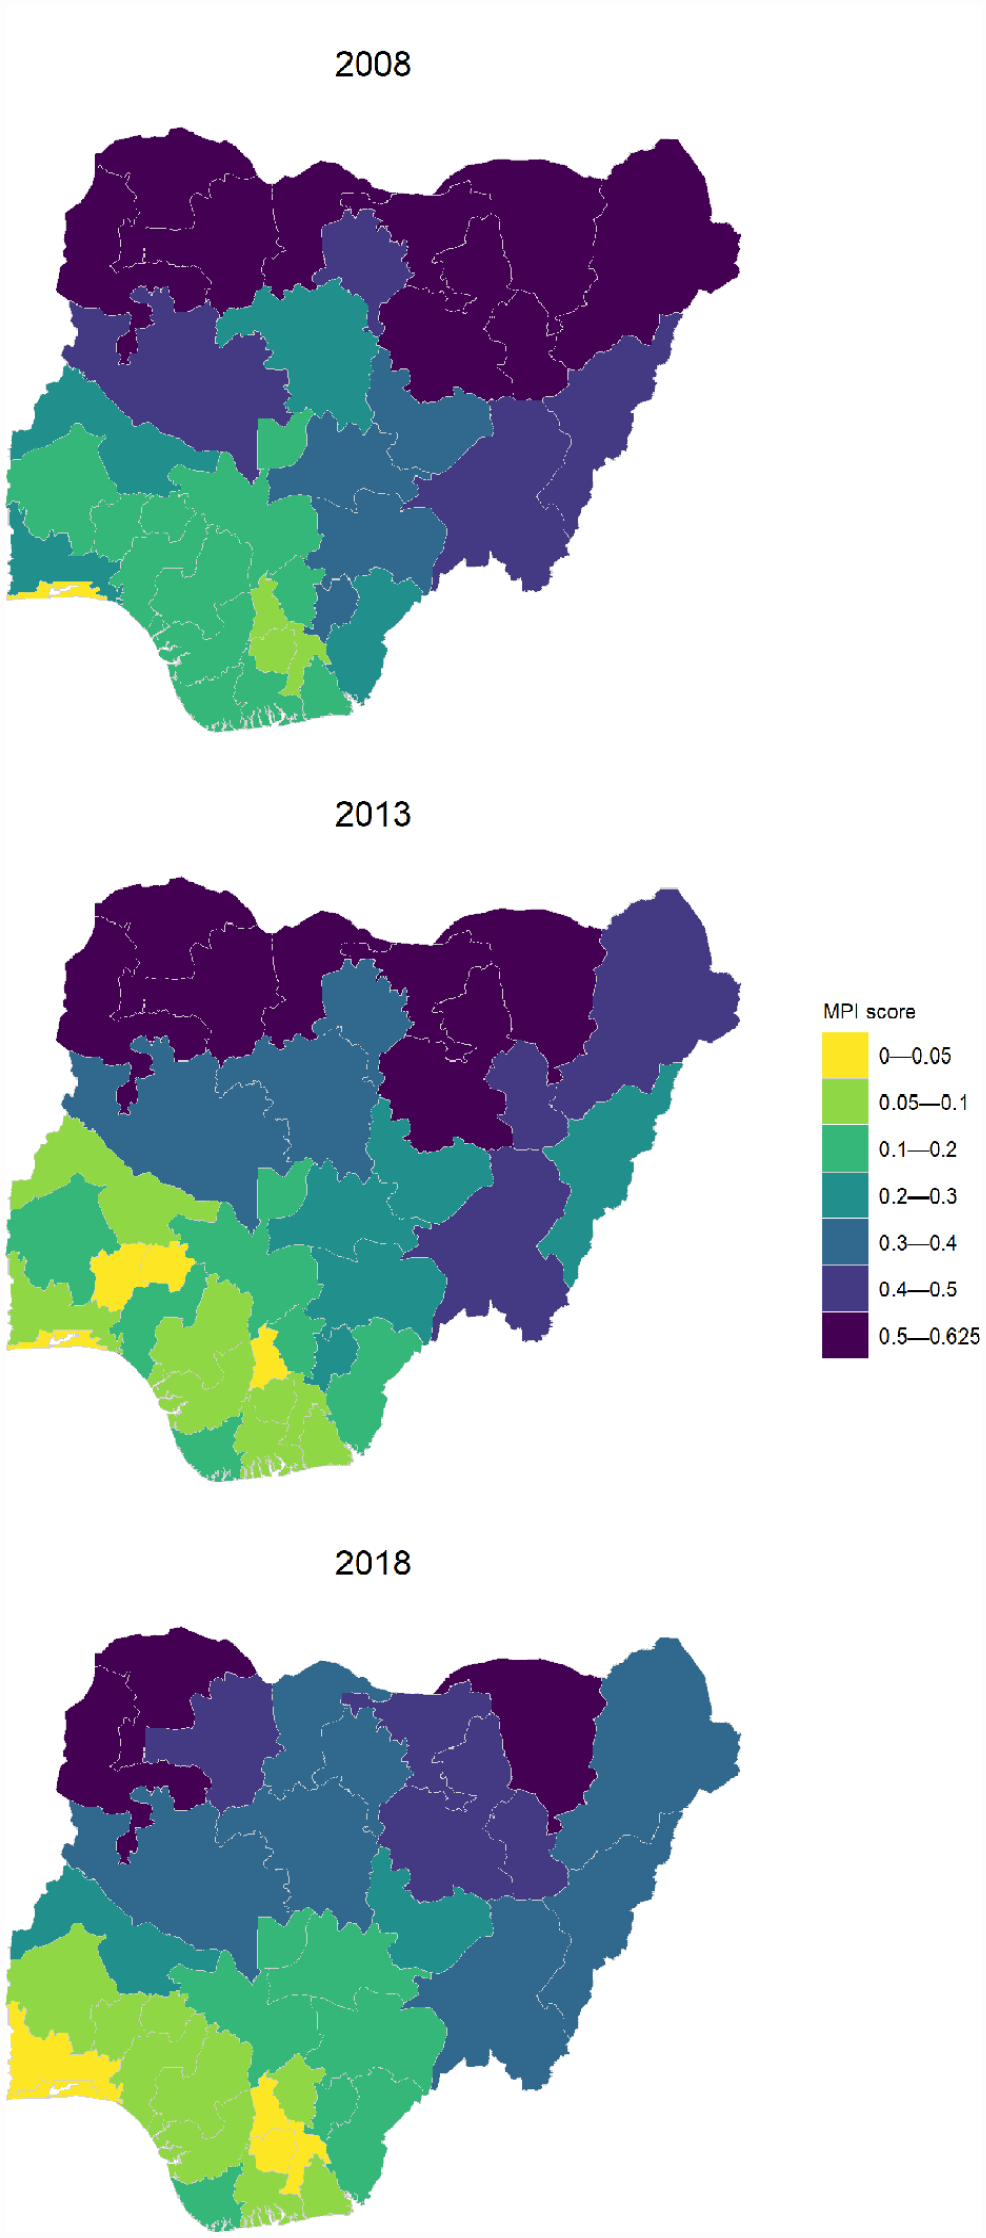
MPI score in 2008, 2013 and 2018.
During the second period of our trend analysis, we find that in many states the progress made in reducing the MPI stagnated, and that in some instances it was reversed. For example, in Adamawa State in the north east, the MPI decreased from 0.467 to 0.277 between 2008 and 2013, but then increased to 0.332 by 2018. During the same periods, the headcount ratio of multidimensional poverty moved from 80% to 57%, only to increase afterward to 63% (see Table A.1).
The relatively less poor north-central states of Kwara, Oyo and Ekiti manifest a similar pattern (see Table A.1). Likewise, several southern states in the Niger Delta with much lower levels of MPI saw a reduction in the incidence of MPI between 2008 and 2013, followed by either only little progress (Akwa Ibom, Rivers) or a reversal (Bayelsa) between 2013 and 2018 (see Table A.1).
Dynamics and actors of conflict events
To provide a background to various conflicts in Nigeria, Kaila and Azad (2019) and Nwankpa (2014) group these into three broad categories that vary by region and type of actors. First, militant groups have been operating in the oil-rich Niger Delta across several states, engaged in activities ranging from kidnapping and robbery to attacks on petroleum installations and attacks on state institutions. For example, the Movement for the Emancipation of the Niger Delta (MEND) conducted attacks against petroleum plants and the government between 2003 and 2013, followed by attacks from the Niger Delta Avengers (NDA) since 2016, among others. 5
Second, there have been ethnic communal conflicts between communities of herders and farmers largely in the north-west and north-central regions and also in Adamawa in north-eastern Nigeria. 6
Third, the north east of Nigeria has witnessed the violent arrival of the religiously motivated group Boko Haram, internationally known for destroying villages and schools and the kidnapping of children. Nearly every Nigerian state experienced one of the three conflicts as described above, communal, ethnic-religious or as part of the Niger Delta insurgencies. The ACLED data on conflict events support this claim and make visible the different parties involved. As per ACLED specifications, each party involved in any type of conflict event, including protests, is labelled as an actor and this includes both the aggressor and victim – such as civilians, for example. We show those in Figure 2 for three periods preceding a DHS round: 2003–2007, 2008–2012 and 2013–2017.
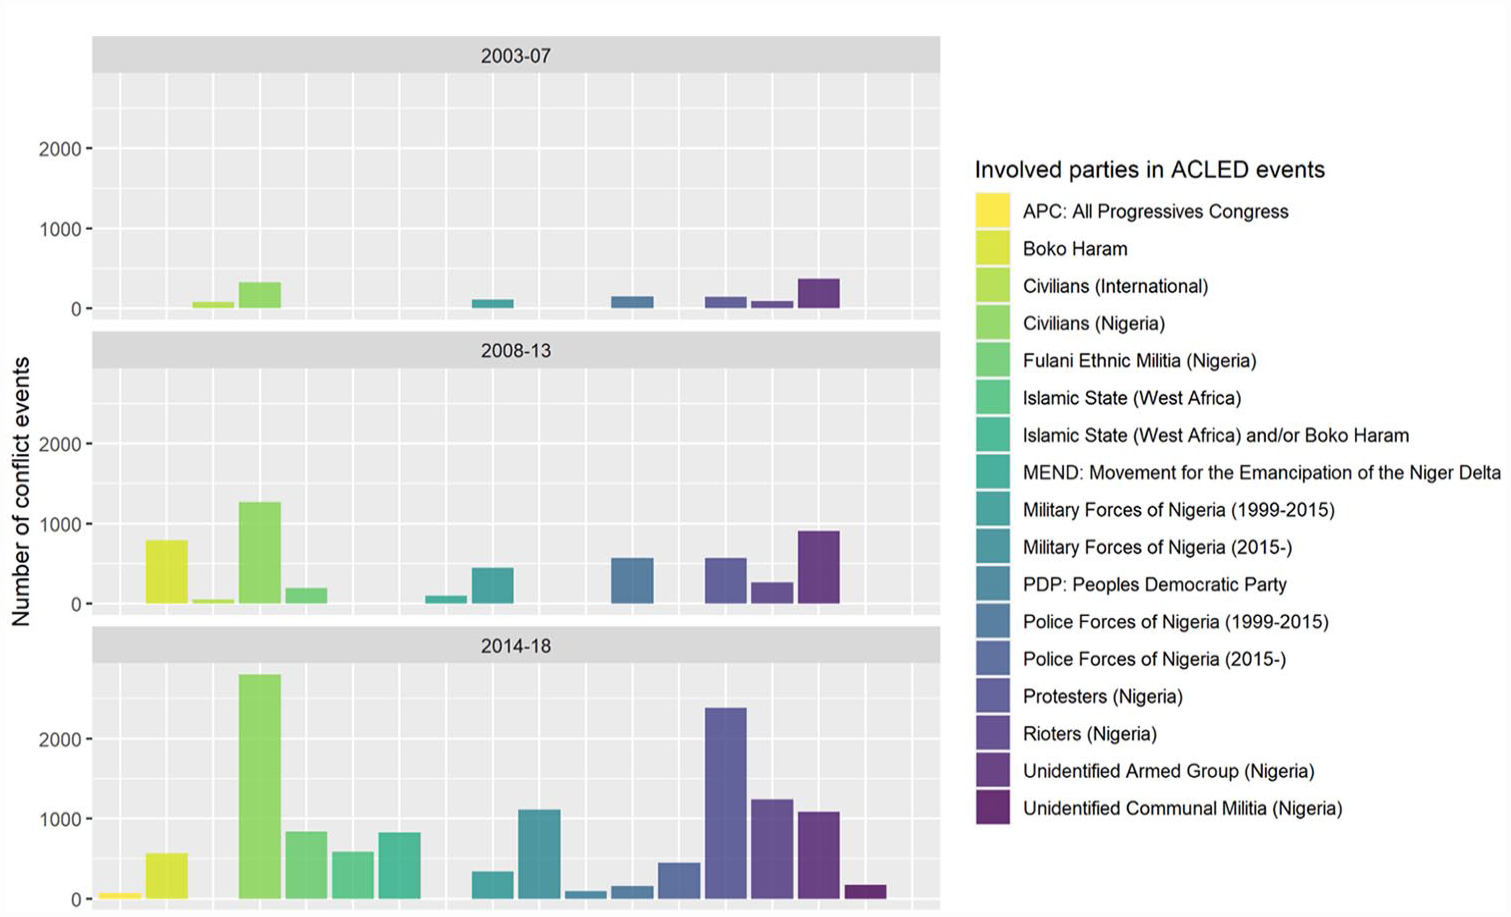
Parties involved in Armed Conflict Location and Event Data Project (ACLED) events.
In the first five-year interval, conflicts were largely confined to unidentified armed groups (more than 300 instances) and military forces. In the second period, the advent of Boko Haram and the Islamic State together count for almost 1000 conflict events, while unidentified armed groups accounted for more than 700. Additionally, ‘protesters’ increased substantially from around 130 instances to 550 in the second period. By the third period (2014–2018), these increased exponentially to more than 2000, whereas conflicts involving Boko Haram and Islamic State remained at around 500 each. Civilians bore the brunt of many of the conflicts and increasingly so, as they were listed more than 300 times in the first period, more than 1250 times in the second and almost 3000 times in the third.
There is a valid concern that the increase in the number of conflict events between 2008 and 2018 may be partially due to better reporting and may thus be considered as an ‘artificial inflation’ of results. We acknowledge this but point to the fact that ACLED data for Nigeria have been collected since 1997. 7 Thus, we believe that the accuracy of reporting mechanisms for the time periods of interest (2003–2008 vs 2008–2013 vs 2014–2018) are similar and allow for a meaningful comparison over time. Although reporting and vetting mechanisms have certainly improved over time, the accuracy of ACLED data for Nigeria seems trustworthy, and the data have been used widely in academia, news outlets and international organizations.
Types of conflict events across states and time
As described earlier, we use four broad categories of conflict events as coded by the ACLED. They include ‘Battles’, ‘Riots and protests’, ‘Strategic developments, explosions and remote violence’ and ‘Violence against civilians’. We plot the number of conflict events for each of the four types by state and five-year-time periods. For illustration, we discuss events in the north-east and south-south zones of Nigeria (Figures 3 and 4), and the plots for the remaining zones can be found in the Appendix (Figures B.1 to B.4).
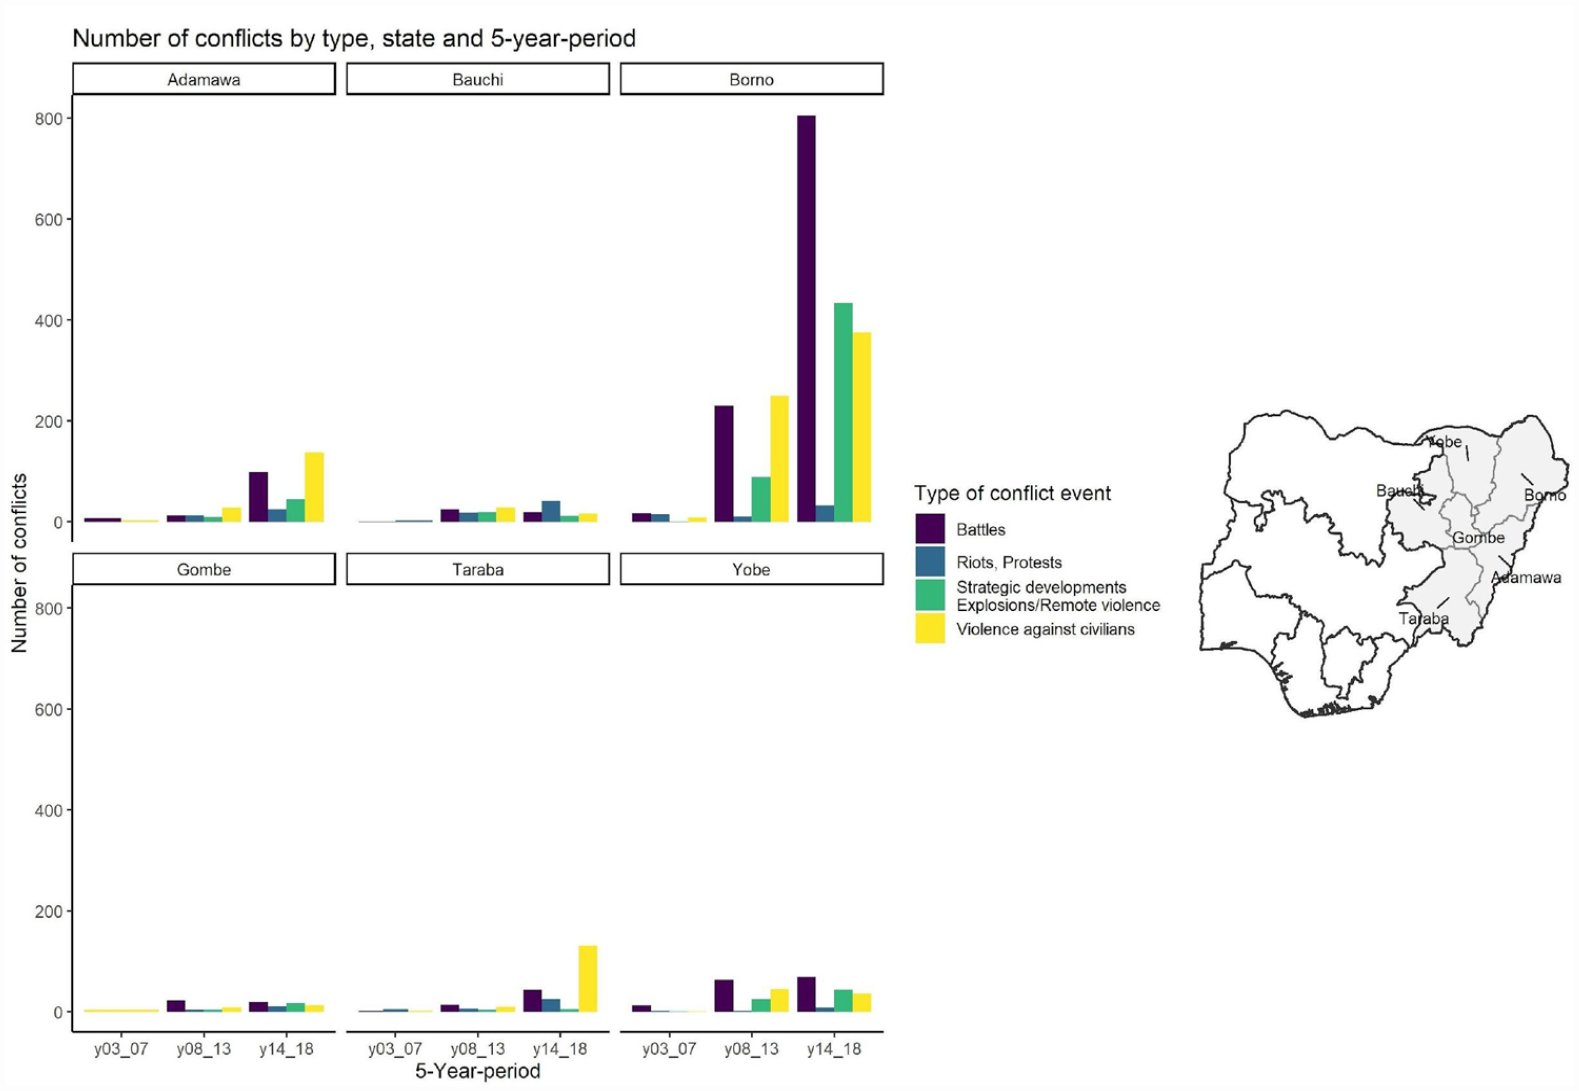
Conflict events by state and type: north east.
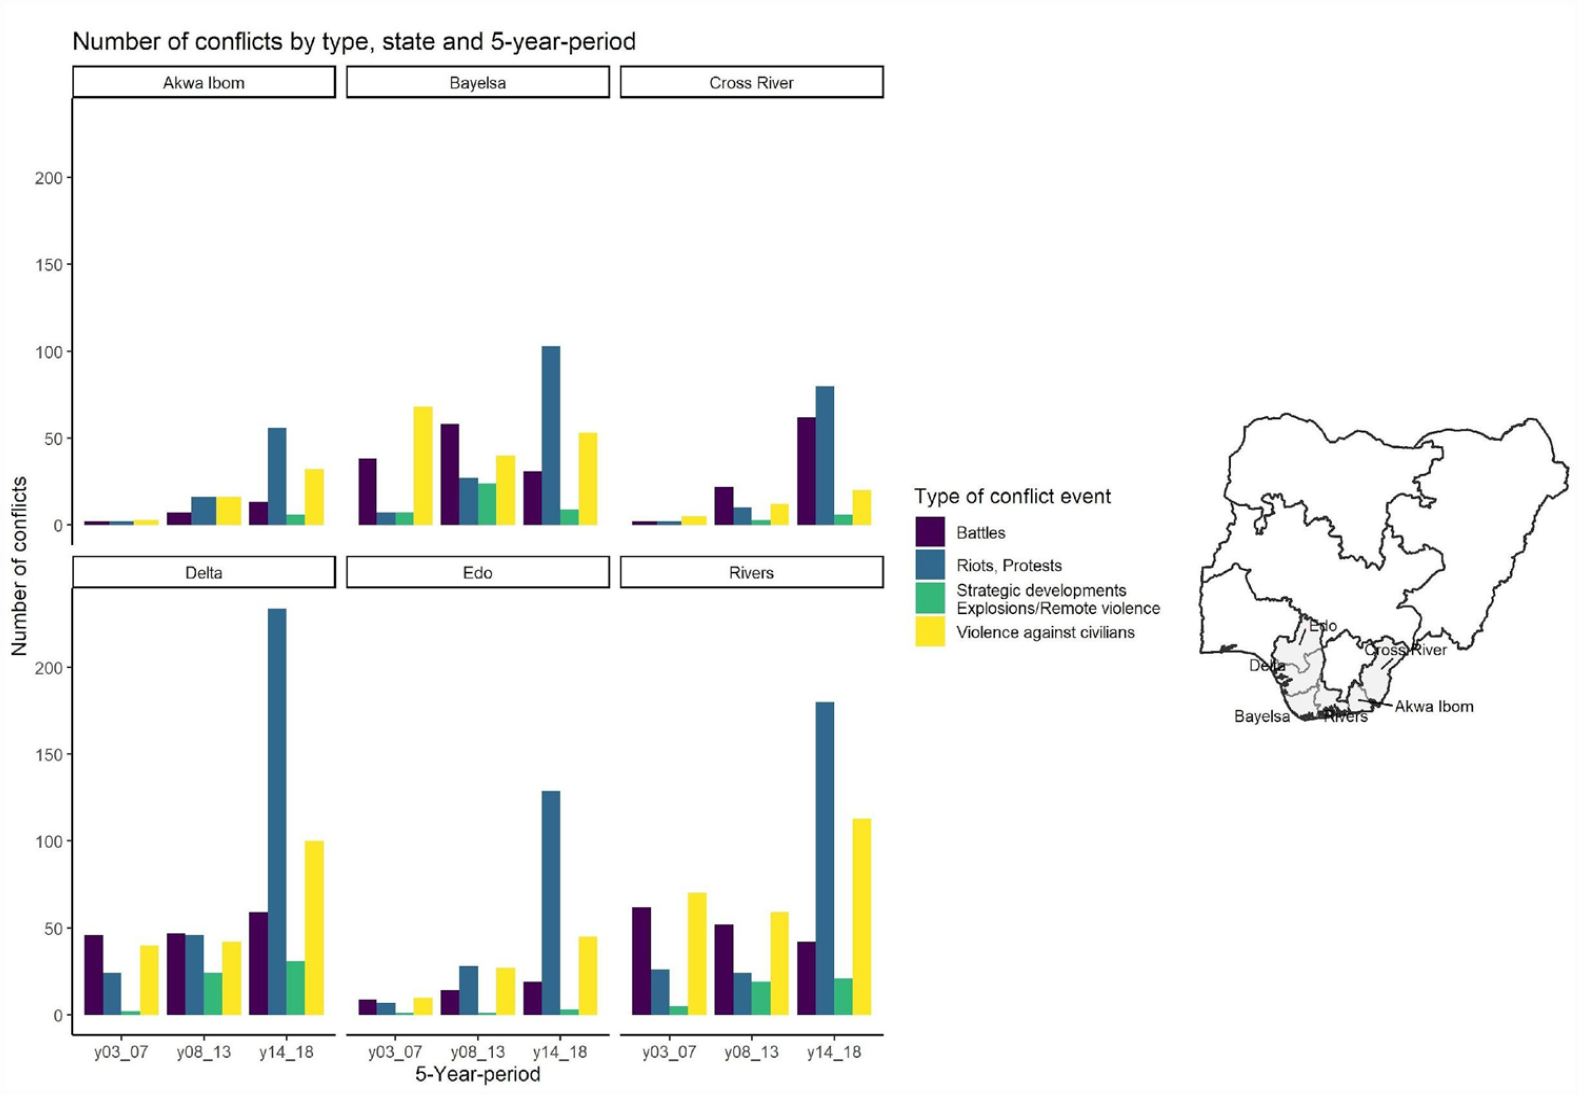
Conflict events by state and type: south-south.
The bar charts show how four types of conflicts vary in magnitude across states and time. For the north east, Borno state stands out. The disproportionately high number of violent attacks against civilians (by Boko Haram) and battles with government forces are shown in Figure 3. This is particularly so for the second period (2008–2013), and even higher levels for the third period, which vividly expand the scale of the y-axis. Relatively speaking, other states within the north east seem to be less affected, yet violence against civilians rose also in the states of Adamawa and Taraba.
In the southern states of the ‘south-south’, as depicted in Figure 4, the rise in riots and protests is visible across all six states. The toll for civilians increased steadily in all states, especially in Delta state and Rivers state, whereas Bayelsa state saw a constant and relatively high number of violence against civilians.
Trends in poverty and conflict events
Joining the concurrent changes in conflict events and multidimensional poverty, we overlay state-wise MPI maps with the geo-locations of the four types of conflict events in Figure 5. For each DHS year with poverty data, we overlay all conflict events that happened in the five years prior and not including the survey year.
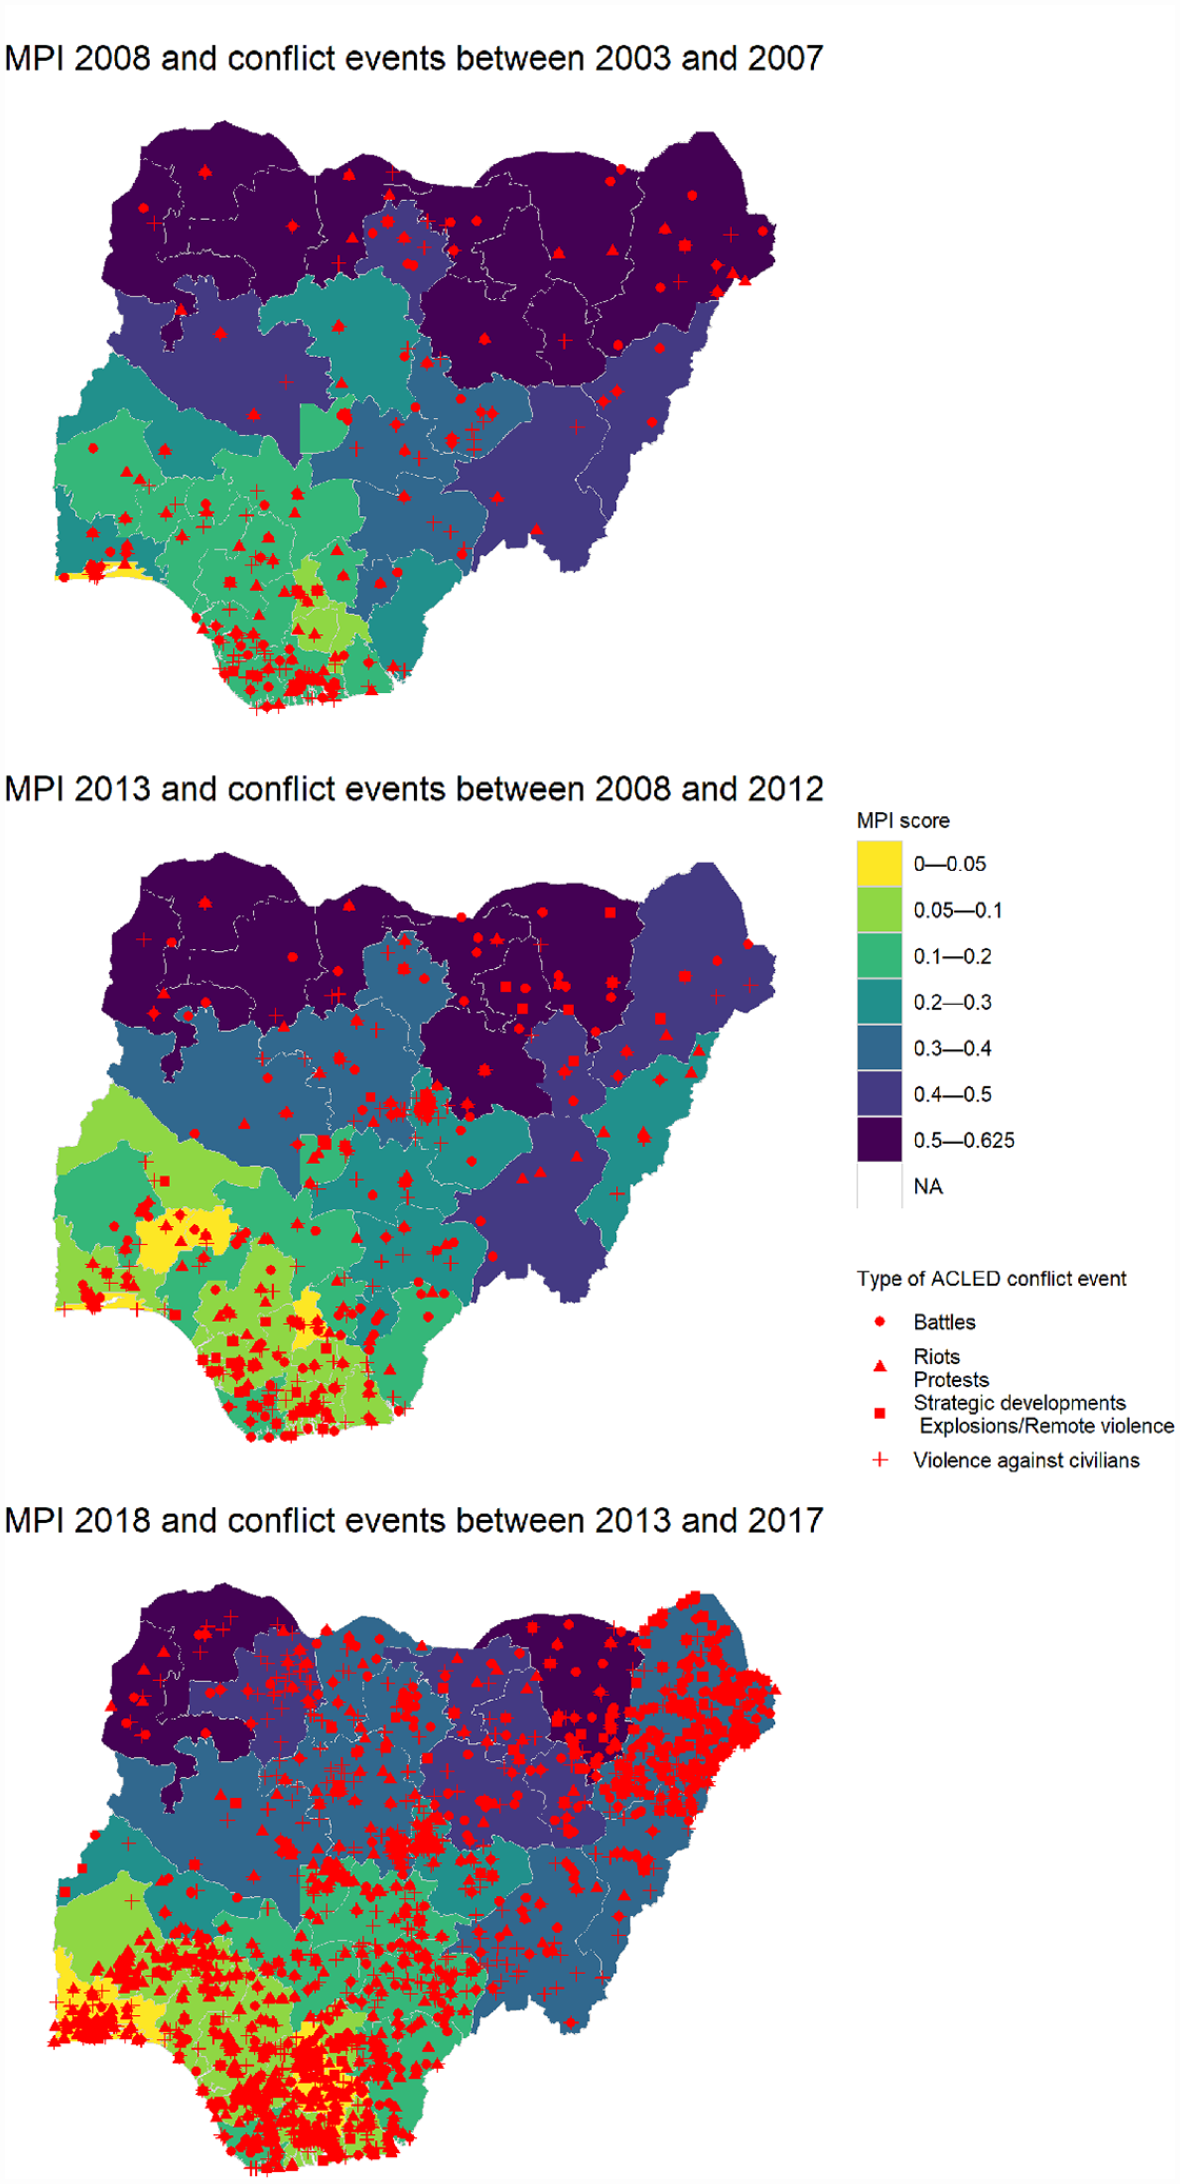
Dynamics of conflict events and multidimensional poverty.
The north-eastern states have traditionally been among the poorest in Nigeria. Although they were still by far the poorest in 2018, several states experienced an intermittent period of poverty reduction between 2008 and 2013. During the period 2008 and 2012, there was no evident rise in conflict events. This, however, occurred between 2013 and 2017, when the number of events exponentially increased across the north and especially in the north east (e.g. Borno state). Southern states saw a similar pattern. By far the least poor states, and after much progress in MPI reduction between 2008 and 2013, progress during the period until 2018 was mixed. Conflict events slightly increased from the first to the second period, and then escalated in the third period, with all southern states visually covered by conflict events. Both the locations and the number of conflict events change over time. Among the wealthiest regions, the number of all types of conflict events in the Delta state have increased over time as well. This shows that conflict events: (a) may increase in both poor and rich states; and (b) could potentially halt or reverse progress in poverty reduction.
The poverty–conflict nexus: towards quantifying the relationship
Using the unique DHS-ACLED regional panel data, and adopting a people-centred measure of poverty, we examine econometrically whether conflict may indeed have hindered ongoing progress in poverty reduction.
For this, we take a model-based approach to measure the association between MPI levels by state i at time t (
Model (1) represents the simplest specification, and takes the following form:

where
Model (2) aims at making subnational heterogeneities more visible by including regional indicator variables,

This model allows us to estimate region-specific coefficients,
Model (3) complements the previous model by including time effects (λ). The interaction terms defined previously are still present:

Model (4) further includes the state-level economic revenue (X) as an additional variable to control for general economic conditions:

For analytical clarity, each one of these models is estimated separately for different types of events. The reason is that one single model that counts the number of events implies giving each conflict event the same relative importance, thus obscuring potentially different associations with poverty levels. The estimation results of the model for battles are presented in Table 1, and the rest of the estimation results are presented in the Appendix Tables – A.2 (Strategic developments or explosion/remote violence), A.3 (Riots and protests) and A.4 (Violence against civilians).
Results fixed effects fit: conflict type 1 (Battles).
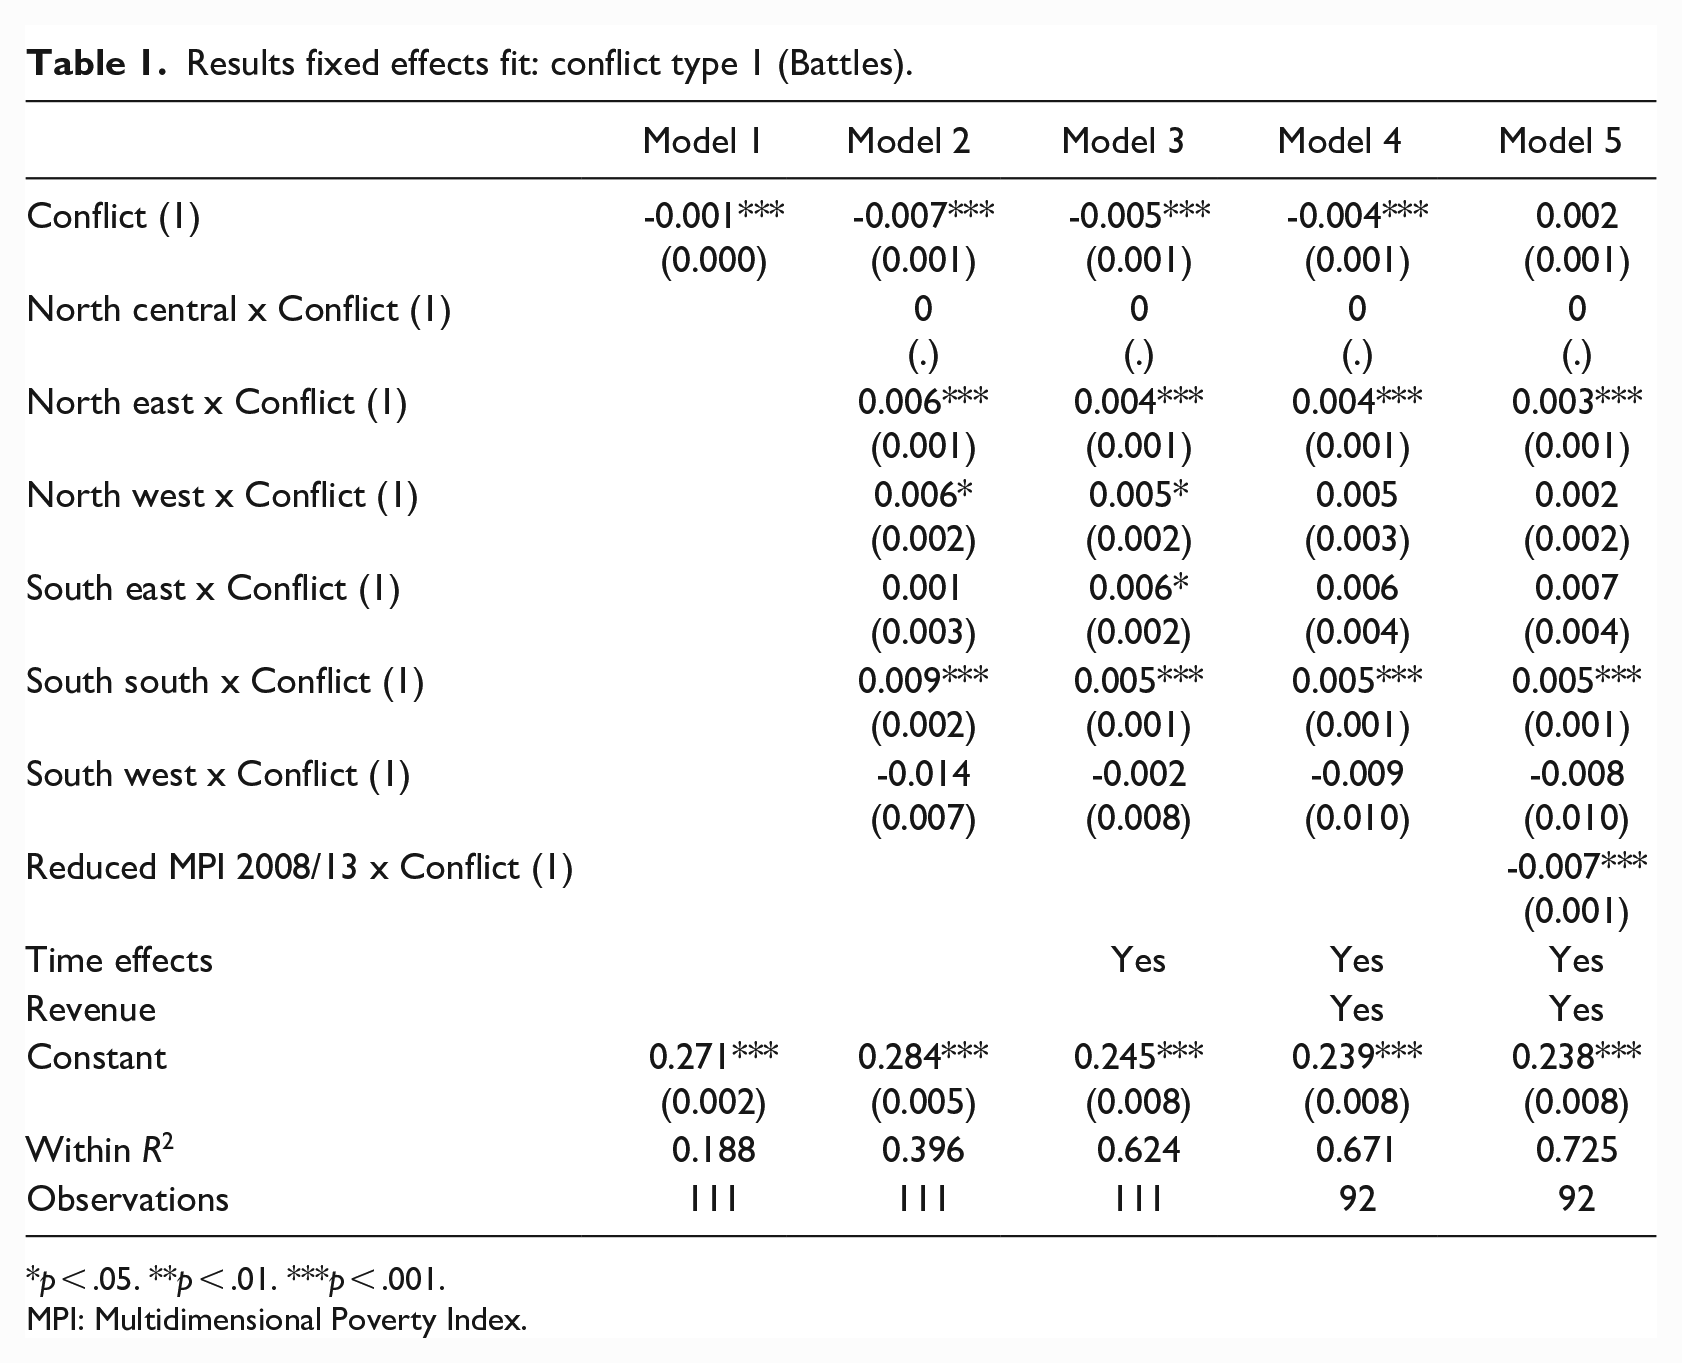
p < .05. **p < .01. ***p < .001.
MPI: Multidimensional Poverty Index.
One result that we wish to highlight, and that is largely robust across model specifications, is that conflict events are more frequently associated with lower MPI levels. This is inferred by the negative and significant coefficients directly associated with each conflict variable across all models (see the first four columns of Table 1 for battles; estimated results for other types of conflict events are presented in Tables A.2–A.4). This result is aligned with Verwimp et al. (2018) who stress that understanding conflict as a problem of poverty and of the poor is not entirely accurate.
We also detect marked regional heterogeneities around the general negative association between conflict events and MPI levels. Although this relationship is valid for the country as a whole, it is particularly true in the north-central and north-east regions, which is consistent with the description presented in previous sections. This regional heterogeneity can be more easily seen in Appendix Tables A.5–A.8 presenting the estimated marginal effects of each conflict event on the MPI value based on Model (4), the most complete one.
Moreover, we show that not only is conflict consistently associated with lower MPI levels, but that this relationship is stronger in states that managed to reduce multidimensional poverty in 2008–2013. This is supported by the estimation results of a fifth model specification that includes an additional regressor indicator variable signalling those states where MPI was reduced in that time span, interacted with the number of conflict events.

Indeed, the negative sign of the newly introduced coefficient (see Table 1, column 5) shows that the occurrence of conflict events is associated with lower MPI levels, in particular in those states that have reduced poverty in 2008–2013.
Without claiming causality, the significant negative sign of the coefficient associated with the newly introduced interaction term presented in Table 1, column 5, for Battles – as well as in Tables A.3 and A.4 for other types of conflict – provides evidence suggesting that conflict may indeed have halted processes of poverty reduction in Nigeria. To put this in context, the number of multidimensional poor people in Nigeria has increased from 88 million to 91 million between 2013 and 2018 (Jennings and Oldiges, 2020). This result is consistent with all types of conflict except for riots and protests, for which we do not find a significant association with poverty. Thus, the occurrence of conflict events may not only be associated with stopping poverty reduction processes seen for the period of 2008 to 2013 but could also be associated with a reversal of these trends. To provide further evidence for this claim, let us recall Figure 5. Evidently, the far central-eastern state of Adamawa saw a significant MPI reduction between 2008 and 2013. The MPI score reduced from 0.47 to 0.28 (also see Table A.1), while conflict events between 2008 and 2012 were sporadic. Yet the next period, between 2013 and 2018, saw a deterioration in poverty reduction, as the MPI score did not decrease further but rose to 0.33. At the same time, conflict events picked up drastically as well. We concur that it may be this concurrence along with similar associations visible in other states such as Niger, Gombe and Kebbi that our regression models pick up.
Digging further: accounting for the role of space
So far, the associations that we detect go beyond internal political borders. Recalling Figure 5, we know that conflict events have increased across state boundaries and particularly also in less poor regions of Nigeria’s central and southern regions. Motivated by the changing patterns and changing nature of conflict, we probe this further and set grounds for subsequent research on this matter, we fit a fixed effects spatial regression of the following form:

where W denotes the spatial weights matrix for all pairs of states. The generic element Wa,b quantifies the geographic proximity between states a and b, and thus it indirectly specifies the magnitude of the ‘spillover’ association between conflict in state b and MPI levels in state a. In this analysis, we posit a contiguous spatial dependence with W containing unity-valued elements only if regions a and b are immediate state neighbours. All other elements in W, including those in the main diagonal, are zero-valued. Hence,
The estimation results of this model can be found in Table 2. Irrespective of the type of conflict event, we find that the indirect (i.e. spatial spillover) association between conflict and level of MPI is at least as strong as – and often larger than the direct one. This means that conflict events are more frequent in Nigerian states that have lower MPI levels or are next to states with relatively lower MPI levels. This means that conflicts tend to occur in ‘clusters’ of relatively less poor Nigerian states. This result is consistent with the previous ones, and it further shows that they go beyond political borders.
Spatial spillover effects of conflict on Multidimensional Poverty Index (panel setting).
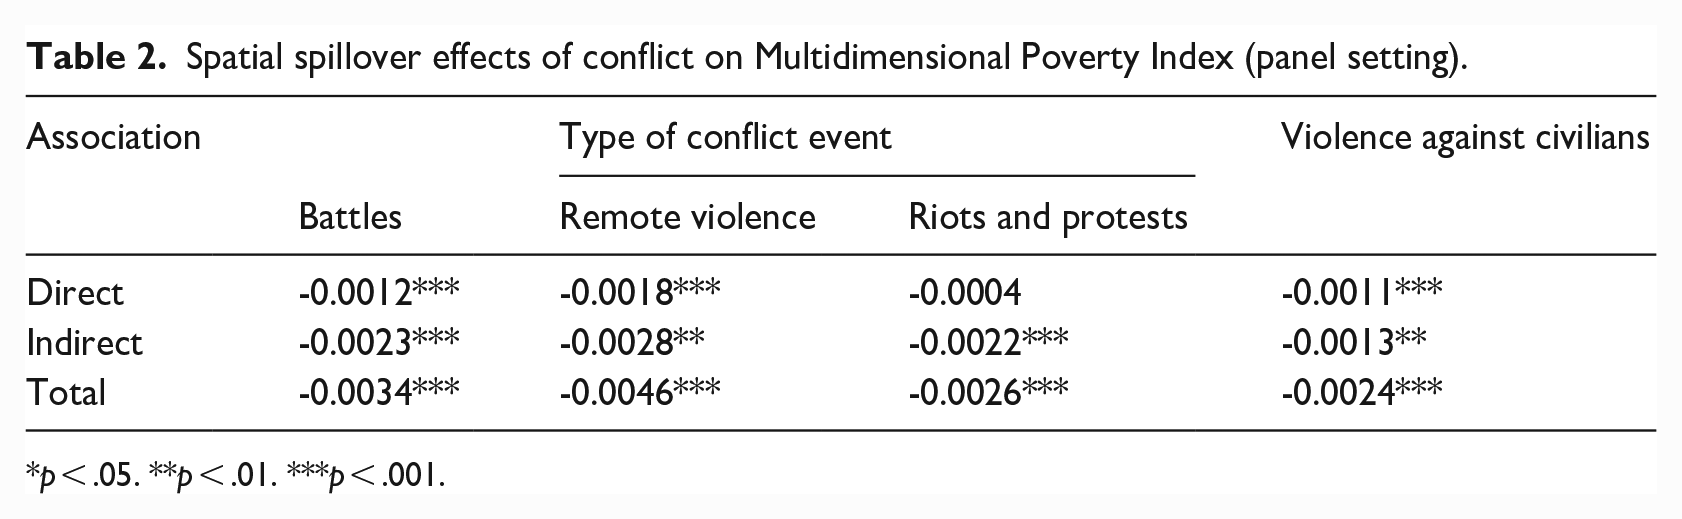
p < .05. **p < .01. ***p < .001.
Concluding remarks
In this article, we have focused on the changing dynamics of both poverty and conflict in Nigeria between 2003 and 2017. Acknowledging that both poverty and conflict occur in many forms, our estimations of associations between the two take into account the simultaneous deprivations poor people experience – as captured via the MPI – and four major types of conflict as recorded by the ACLED. With a state panel of 37 Nigerian regions, we combine multidimensional poverty estimates for 3 survey periods in 2008, 2013 and 2018 with conflict events witnessed 5 years prior to each survey. Guided by the overall question as to how conflict is associated with levels and trends in poverty, we are also interested in whether conflict is more likely to occur in poor areas to begin with.
Without claiming causality, we find that conflict arises not necessarily only in the poorest Nigerian states, but in many of the less poor states too, and increasingly so over time. Analysing trends of multidimensional poverty and of the changing patterns of conflict, we demonstrate that following periods of poverty reduction in many states, conflict may have played a major role in halting these trends, if not reversing them. Results from our spatial regression framework indicate conflict spillovers or indirect associations between conflict and MPI levels. These show that the likelihood of a conflict event taking place in any Nigerian state is positively associated with lower MPI levels in that state or its immediate neighbours. In other words, states with previous records of successful poverty alleviation (and thus a lower MPI) saw either an increase in conflict events or a halt in poverty reduction. Without claiming causality, we find that trends of poverty reduction stop when and where conflict arises across Nigeria. In several states, conflict may have actually contributed to the rise in multidimensional poverty. A related aspect that needs further investigation in this direction is the role played by the intensity of conflict – for instance, as measured by number of fatalities – on multidimensional poverty. An important avenue for future research is the need to understand how fatalities shake up households’ capacity to avoid livelihood deprivation. It is likely that tackling this important issue may require mixed methods that combine hard, objective quantitative evidence with a qualitative assessment of households’ adaptability to fatal conflicts.
Our findings on spatial spillover effects call for greater attention to the (shifting) territoriality of conflict within the international borders of a country. They also echo observations by Idler and Tkacova (2023) in this Special Issue. They visualize dynamically changing conflict shapes based on Boko Haram-related conflict events in Northern Nigeria. As shown in Figure 6 of their article, these have shifted across several Nigerian state boundaries and further inland. Thus, although conflict events were mostly concentrated and originated in the poorest (northern) states, over time spatial spillovers eventually affected wealthier states. In other words, the lives of both the poor and better-off are affected.
The spatial spillovers being at least as large as the direct associations between poverty and the experience of conflict may reflect a need for inter-state coordination to prevent conflict. From a policy perspective, there is a need to avoid thinking of conflict borders as impermeable barriers. Our analysis shows that social and economic outcomes – as captured in the MPI – are responsive to conflict irrespective of the existence of a political border. Keeping such spillovers in mind may help prevent conflict outburst in regions that are vulnerable due to their geographical proximity to conflict-prone areas as well. Furthermore, and related to the work by Rugo (2023) in this Special Issue on how the arts help understand experiences of conflict, our analysis shows that by focusing on the lived ‘experience of poverty’ via the many forms of poverty over time, we can get closer to conceptualizing how people experience different conflict events. This in turn may not only help prevent further conflicts, but may also guide policies on recovery and rebuilding of societies and improving people’s quality of life in the aftermath of conflict events.
Supplemental Material
sj-do-2-ips-10.1177_01925121231177441 – Supplemental material for Multidimensional poverty and conflict events in Nigeria over time
Supplemental material, sj-do-2-ips-10.1177_01925121231177441 for Multidimensional poverty and conflict events in Nigeria over time by Ricardo Nogales and Christian Oldiges in International Political Science Review
Supplemental Material
sj-docx-3-ips-10.1177_01925121231177441 – Supplemental material for Multidimensional poverty and conflict events in Nigeria over time
Supplemental material, sj-docx-3-ips-10.1177_01925121231177441 for Multidimensional poverty and conflict events in Nigeria over time by Ricardo Nogales and Christian Oldiges in International Political Science Review
Supplemental Material
sj-dta-1-ips-10.1177_01925121231177441 – Supplemental material for Multidimensional poverty and conflict events in Nigeria over time
Supplemental material, sj-dta-1-ips-10.1177_01925121231177441 for Multidimensional poverty and conflict events in Nigeria over time by Ricardo Nogales and Christian Oldiges in International Political Science Review
Footnotes
Appendix
Acknowledgements
We thank participants of the Changing Character of War seminar, University of Oxford (![]() ), 25 February 2020, for very useful feedback, as well as three anonymous reviewers for kind suggestions and ideas. We also thank the entire OPHI team for their encouragement and helpful discussions. Special thanks go to Dr Annette Idler for her continuous support in the process of thinking about and writing up this article.
), 25 February 2020, for very useful feedback, as well as three anonymous reviewers for kind suggestions and ideas. We also thank the entire OPHI team for their encouragement and helpful discussions. Special thanks go to Dr Annette Idler for her continuous support in the process of thinking about and writing up this article.
Funding
The authors received no financial support for the research, authorship, and/or publication of this article.
Disclaimer
The views expressed herein are those of the authors and do not necessarily reflect the views of the United Nations.
Supplemental material
Supplemental material for this article is available online.
Notes
Author biographies
References
Supplementary Material
Please find the following supplemental material available below.
For Open Access articles published under a Creative Commons License, all supplemental material carries the same license as the article it is associated with.
For non-Open Access articles published, all supplemental material carries a non-exclusive license, and permission requests for re-use of supplemental material or any part of supplemental material shall be sent directly to the copyright owner as specified in the copyright notice associated with the article.