
Abstract
Prior research demonstrates that audiences tend to converge in their valuations of firms similar to preexisting category prototypes or exemplars. Much less is known of the influence of salient outliers, specific firms that receive market-wide attention due to their extreme, ambiguous performance, on audiences’ valuations. We argue that outlier similarity, by contrast with prototype similarity, leads to divergent valuations among individual investors. We explore this insight in the context of initial public offerings (IPOs). In this context, converging valuations among investors lead to limited information asymmetry concerns and hence reduced underpricing on the first day of trading of an issuing firm. Hence, we expect that prototype similarity leads to lower underpricing while outlier similarity leads to higher underpricing. We test our hypotheses using a sample of 2,488 United States IPOs from 1996 to 2015, measuring prototype and outlier similarity through a natural language processing technique applied to nearly 160,000 financial documents. We find that in low-tech industries, where prototypes are informative about category members, prototype similarity reduces underpricing, but not in high-tech industries. Additionally, we find that outlier similarity increases underpricing, especially for more recent outliers. This paper contributes to the literature on market valuation and market categories, and advances research on meaning and culture using new text-based computational methods.
Keywords
Introduction
Extant research on audiences’ valuation in markets (Durand & Paolella, 2013; Hannan et al., 2019; Lamont, 2012) suggests that ‘typical’ firms, i.e. firms with high similarity to market categories’ prototypes, as well as firms similar to well-known category exemplars (Barlow, Verhaal, & Angus, 2019; Pontikes & Barnett, 2017; Soublière & Gehman, 2020; Zhao, Ishihara, Jennings, & Lounsbury, 2018), enjoy a perceptual advantage (Leung & Sharkey, 2014; Negro & Leung, 2013): audience members more easily identify them, infer their unobservable attributes (Hsu & Grodal, 2015) and convergently estimate their value. By comparison, little attention has been dedicated to salient outliers, which stand out across existing and forming categories within a market owing to their recent extreme and ambiguous performance. Indeed, as extreme, the performance of salient outliers does not have clear attributable causes in firms’ characteristics and clear implications for firms’ underlying value. For instance, dramatic stock price increase, topping corporate social responsibility (CSR) charts, or 100% of IPOs’ first-day returns are all extreme performance outcomes with ambiguous interpretations: different audiences may disagree on their causes and their consequences for firm value (e.g. DesJardine, Marti, & Durand, 2021). The inherent difference between salient outliers and category prototypes suggests that the concomitant study of similarity to both category prototypes and salient outliers may shed new light on firm valuation.
Thus, we investigate how prototype similarity and outlier similarity simultaneously affect how investors value an issuing firm in the IPO market. When a firm has high prototype similarity, investors easily identify its observable attributes, correctly infer its unobservable attributes, and use common interpretive schemas to relate this information to expected levels of performance. Hence, given high prototype similarity, investors tend to convergently infer firm value, reducing concerns that there is information asymmetry among investors (Akerlof, 1970). Conversely, when a firm has high outlier similarity, investors tend to dissent about how its observable attributes relate to its underlying value, to discrepantly infer its unobservable attributes and to use different interpretive schemas. Hence, investors tend to diverge in their individual valuations, leading to information asymmetry concerns. Since, in the IPO market, firms’ value is discounted when firms are subject to information asymmetry concerns (Biais & Faugeron-Crouzet, 2002; Rock, 1986), the two similarities drive firm value in opposite directions.
We test our hypotheses on a sample of 2,488 United States IPOs from 1996 to 2015. We use a document embedding model (Le & Mikolov, 2014) on 2,488 IPO prospectuses and 159,216 annual reports produced by a benchmark of 33,308 established firms to measure issuing firms’ prototype similarity and outlier similarity. Our dependent variable is IPO underpricing, a measure of the discount applied to an issuing firm’s value in response to information asymmetry concerns (Pollock & Rindova, 2003; Pollock, Rindova, & Maggitti, 2008). To partially account for regressor imbalance and endogeneity, we use coarsened exact matching (Blackwell, Iacus, King, & Porro, 2009) on top of OLS regressions. Surprisingly, while the relationship between prototype similarity and underpricing does not appear as significant, in additional analyses, we find such a negative and significant relationship in low-tech categories – i.e. when prototypes are informative about category members – but not in high-tech categories. The relationship between outlier similarity and underpricing is positive and significant, and is attenuated when the ambiguity that surrounds a salient outlier is reduced (as time passes). Overall, our findings support our theory and are robust to alternative measures of the two similarities, alternative specifications of the embedding model, and the use of exogeneous instruments.
This paper first contributes to the literature on market valuation (Gouvard & Durand, 2023; Hannan et al., 2019; Lamont, 2012) by contrasting the effect of prototype similarity on investors’ valuation with that of outlier similarity. Second, this paper advances research on meaning and culture using computational methods (Aceves & Evans, 2023; Kozlowski, Taddy, & Evans, 2019; Poschmann, Goldenstein, Büchel, & Hahn, 2023) as it introduces new methods to measure both prototype similarity and outlier similarity in a high-dimensional semantic space. It further includes a detailed review of different computational methods to measure semantic similarities between texts in Appendix.
Theory Development
Valuation and the two similarities described
In this section, we focus on how prototype and outlier similarity relate to valuation, especially in the IPO context. We will further explore in additional analyses the mechanisms supporting our main hypotheses and develop theoretical implications in the Discussion section.
Market categories summarize information on ‘the symbolic and material attributes of products, firms, and industries that are both shared among actors and that distinguish these entities from others’ (Durand & Thornton, 2018, p. 632). Market categories are defined by their prototypes, abstract representations of their ‘average’ members (Mervis & Rosch, 1981; Reed, 1972). For example, we all share an abstract representation of the prototypical fast-fashion retailer that summarizes general information about its activities, e.g. fast-fashion products imitate haute couture’s trends, are affordable and are sold in large retail stores. Fast-fashion retailers that fit this representation appear typical (e.g. Zara), while retailers deviating from this prototype appear atypical (e.g. Boohoo.com). It is generally easier for market participants to interpret information and make inferences about firms or products with high prototype similarity, which facilitates their individual valuations and ensure their convergence (e.g. Hsu, 2006; Hsu, Koçak, & Hannan, 2009; Kennedy, Lo, & Lounsbury, 2010). 1
Recent research suggests that beyond prototype similarity, similarity to salient reference points, i.e. specific firms or products that stand out within a particular market, explain audiences’ valuations. In the early video game market, successful games served as a benchmark to evaluate new games in the absence of pre-established categories (Zhao et al., 2018). In the phone app market, similarity to successful apps is conducive to more downloads (Barlow et al., 2019) while, on crowdfunding platforms, support for new projects is influenced by their similarity to past successes and failures in the same category (Soublière & Gehman, 2020). Finally, imitators crowd in market categories blessed with extreme successes but shun those with extreme failures (Pontikes & Barnett, 2017). A first limitation of this research is that it focuses mostly on exemplars of a specific market category whose influence on audiences’ valuations is limited within the confines of this category (e.g. on Kickstarter, tabletop games or video games). A second limitation is that this research focuses on reference points which are unambiguously related to success (or failure) within their category so that audiences value them convergently. Hence the mechanisms associating similarity to these reference points to audiences’ valuations are not essentially different from those associating prototype similarity to audiences’ valuations. Notably, they both result in convergence among audiences’ valuations.
To expand this research in new directions, we contrast the influence of prototype similarity on audiences’ valuations with that of similarity to reference points which receive market-wide attention due to their extreme, ambiguous performance – which we label as salient outliers. Markets abound with examples of salient outliers: a firm may face widely inconsistent earnings predictions, may achieve market valuation well above expectations based on financial accounting ratios and/or, as in this paper, may experience exceptionally high first-day returns when going public. In all these cases, the firm exhibits an extreme outcome on a particular dimension of performance, but the interpretation of this outcome is unclear such that audiences might interpret it discrepantly. The market valuation of Tesla is a good example of an extreme and ambiguous performance outcome due to the large discrepancy between Tesla’s market valuation and the one that could be expected based on financial accounting ratios (Rothaermel, 2020). Some investors believe this valuation reflects Tesla’s future earnings while others find it absurd based on fundamentals. 2 In this sense, Tesla is a salient outlier in financial markets. 3
As such, salient outliers are an important counterpoint to category prototypes. Unlike category prototypes, which generally go unquestioned, salient outliers are extensively discussed by market participants, specifically because their extreme performance is difficult to interpret. For instance, Tesla’s market valuation is typically the object of regular debate among observers of financial markets. A related consequence of the ambiguity of the relationship between salient outliers’ characteristics and their performance is that, while audience members generally share the same representation of category prototypes, they differ in their interpretation of salient outliers. For instance, some investors interpret firms with extremely high CSR performance as investing in long-term sustainability, but others see them as wasting resources (DesJardine et al., 2021). Finally, while category prototypes are relatively stable and enduring, salient outliers are relatively unstable and transient. They either fall from view once audiences’ attention is attracted to new salient outliers or stay long enough in the limelight for audiences to resolve the ambiguity surrounding their extreme performance – thus ceasing to be salient outliers.
Overall, contrasting how prototype similarity and outlier similarity relate to valuation would usefully complement existing research. Before detailing our hypotheses, we present our empirical context, the IPO market, in more detail.
Context: IPO and underpricing
During an IPO, an issuing firm becomes a publicly traded company. A set of underwriters (investment banks) and the issuing firm’s managers present the offering to investors and write an IPO prospectus, or Form S-1, a document required by the US Securities and Exchange Commission (SEC). The prospectus is the primary source of information about the issuing firm and influences investors’ perceptions (Loughran & McDonald, 2013, 2017). Underwriters set the final offer price and allocate shares to investors who bid for them. On the first day of trading, investors who have been allocated shares can sell them to other investors.
In the IPO market, issuing firms are frequently underpriced; i.e. underwriters set the final offer price well below the expected market price (Cohen & Dean, 2005; Park & Patel, 2015). This underpricing is a discount applied to issuing firms when there appears to be significant heterogeneity among investors in the information available to them, so that individual investors tend to reach divergent valuations of the issuing firm, i.e. when information asymmetry concerns are high (Pollock & Rindova, 2003; Pollock et al., 2008). In the absence of underpricing, poorly informed investors would have difficulty taking part in profitable IPOs. Well-informed investors, who value IPOs accurately, would only bet for shares in profitable IPOs. Poorly informed investors would thus be crowded out of these IPOs and be allocated shares mainly in unprofitable IPOs (Biais & Faugeron-Crouzet, 2002; Rock, 1986). Hence, in the absence of underpricing, uninformed investors would have little interest in participating in IPOs. However, underwriters and issuing firms need all kinds of investors to participate in the IPO market to raise sufficient funds and guarantee liquid and efficient market exchanges. Thus, if information asymmetry concerns are high, underwriters underprice IPOs, enabling poorly informed investors to benefit from participating in them.
This feature of the IPO market makes it an ideal setting to explore the effect of prototype and outlier similarity on investors’ valuations. Higher (lower) levels of underpricing suggest a higher (lower) discount of a firm’s value in response to the two similarities as a function of the effects that they might have on the divergence (convergence) of investors’ valuations.
The two similarities and underpricing
When considering in which firms to invest, investors, like other audiences, use market categories to identify potential targets and facilitates information processing about them (Smith, 2011; Wry, Lounsbury, & Jennings, 2014). Investors notably rely on industry categories to help them define potential targets’ activities (Zuckerman, 1999, 2017). Hence, we define the relevant prototype for a given issuing firm as the prototypical member of its main industry category.
Prototype similarity covaries with information asymmetry concerns for three reasons. First, when an issuing firm has high prototype similarity, investors recognize many observable attributes of the firm and associate them with expected performance levels – which in turn influences their valuations (Zuckerman, 2017). Second, with higher levels of prototype similarity, investors make better inferences about the firm’s unobserved features and their implication for the firm’s value (Leung & Sharkey, 2014; Murphy & Ross, 2005; Naumovska & Zajac, 2022; Negro & Leung, 2013). Third, the more prototypical an issuing firm is, the more investors will rely on common interpretive schemas associated with the prototype’s category to connect the issuing firm’s observable and unobservable attributes to expected performance levels (Hsu, Roberts, & Swaminathan, 2012; Zuckerman, 2004).
Hence, when an issuing firm has high prototype similarity, investors tend to (1) analyse more convergently observable attributes, (2) more convergently infer how the firm’s unobservable attributes relate to its value, and (3) apply more common interpretive schemas than when prototype similarity is low. As a result, with higher prototype similarity, investors tend to converge in their individual valuations. Thus, information asymmetry concerns are limited; hence, the level of underpricing of the issuing firm is lower:
In the IPO market, we define salient outliers as any issuing firm from any industry category having achieved especially high first-day returns in the recent past. Highly underpriced firms constitute clear instances of extreme performance in this market. As Pollock et al. (2008) mention: ‘Some IPOs exhibit dramatic differences between their offering and closing prices (Ritter & Welch, 2002). Such large deviations from the offering price are unusual and surprising, so high levels of underpricing are likely to be noticed and discussed, and likely to become widely available information’ (p. 340). High levels of underpricing generate investors’ interest and correlate with increased web traffic to the issuing firm’s website following its IPO (Demers & Lewellen, 2003). The financial press routinely comments on first-day ‘pops’, whose causes and consequences generally appear ambiguous. 4 For instance, when the restaurant chain Cava went public in June 2023 it received substantial attention due to its extreme first-day returns of 99%. Commentators speculated about which attributes of Cava might have explained such first-day returns and what they meant for the IPO market. 5 Such debates occur around many salient outliers in the IPO market, such as Beyond Meat (IPO in 2019, 163% first-day returns), 6 Airbnb (IPO in 2020, 113% first-day returns), 7 or Poshmark (IPO in 2021, 142% first-day returns). 8
Salient outliers influence IPO investors’ valuations of similar firms. First, since salient outliers tend to receive media coverage, which weights into the decision of IPO investors (Pollock & Rindova, 2003), we would expect IPO investors to be well aware of recent salient outliers and sensible to an issuing firm’s similarity to them. Second, valuing issuing firms is difficult due to limited access to public information on those firms (Pollock et al., 2008). We would thus expect IPO investors to support their valuations of issuing firms on multiple reference points beyond category prototypes. Due to the attention received by salient outliers, the similarity between a focal issuing firm and a salient outlier would likely be perceived as worthy of consideration when valuing the issuing firm. For instance, before Cava went public in 2023, it was compared to Sweetgreen, a similar company, which also experienced a significant first-day ‘pop’ in 2021 (76%). 9 Third, due to the lack of information on issuing firms, IPO investors pay particular attention to IPO prospectuses (Loughran & McDonald, 2013; Martens, Jennings, & Jennings, 2007). IPO investors are thus likely sensitive to similarities between issuing firms’ prospectuses and especially between those of salient outliers having captured market attention and those of issuing firms in which they consider investing – these similarities may in turn influence their valuations. 10
An important specificity of salient outliers is that their extreme performance is ambiguous – some audience members consider it as an aberration, while others strive to make causal associations between the outlier’s characteristics and its extreme performance. Due to this ambiguity, some investors are likely misguided in their interpretation of how the salient outlier’s attributes relate to its performance and in their interpretation of this performance for the salient outlier’s underlying value. Hence, there likely are divergences among investors’ individual valuations of salient outliers, and in turn outlier similarity may thus foster divergence among investors’ valuations of issuing firms.
First, when a focal issuing firm is similar to a salient outlier, this indicates that they share some observable attributes across their respective industry categories. Through analogical reasoning (Durand & Thornton, 2018; Etzion & Ferraro, 2010; Ketokivi, Mantere, & Cornelissen, 2017), some investors may thus base their interpretation of how those observable attributes relate to the issuing firm’s performance and underlying value on their interpretation of the salient outlier’s own observable attributes. Second, if outlier similarity is high, some investors may further infer that the issuing firm possesses unobserved attributes similar to those of the salient outlier. They might again base their interpretation of how those unobservable attributes relate to the issuing firm’s performance and underlying value on their interpretation of the salient outlier’s own unobservable attributes. However, in both cases, since some investors’ individual interpretation of the salient outlier’s attributes and their relationship to performance and valuation are likely misguided and divergent from that of better-informed investors, their individual valuations of the focal issuing firm may be misguided and divergent as well. Finally, due to the ambiguity surrounding salient outliers’ extreme performance, investors cannot rely on shared interpretive schemas to make sense of available information both about the outlier’s performance and the performance of similar others. As a result, outlier similarity leaves wide open the choice of interpretive schemas mobilized by various investors. Therefore, outlier similarity may increase the likelihood of diverging value estimates. 11
Hence, when an issuing firm has high outlier similarity, investors tend to diverge in their individual valuations because they (1) do not convergently analyse how observable attributes relate to an issuing firm’s value, (2) infer in discrepant ways the firm’s unobservable attributes and how they relate to its value, and (3) apply multiple and diverse interpretive schemas. As a result, with higher outlier similarity, information asymmetry concerns among investors are likely high; thus, the level of underpricing of the issuing firm is higher:12,13
Data, Methods and Results
Data
We collected data on US IPOs from 1996 to 2015 from the SDC Platinum new issues database and Professor Jay Ritter’s database (see Loughran & Ritter, 2004: Appendix B). We collected stock-level data for firms in our sample from CRSP and fundamentals data from Compustat. We excluded IPOs initially priced below $5 (i.e. penny stocks), and IPOs for financial institutions, closed-end funds, American depository receipts and real estate investment trusts. We collected S-1 forms submitted by the 2,488 IPOs in our sample for which we had a valid Central Index Key (CIK), which was used to identify financial documents in the SEC database. As we measured prototype similarity using a benchmark of publicly traded established firms, we downloaded 159,216 annual reports (Form 10-K) for all 33,308 US publicly listed firms included in Compustat for which we had a CIK between 1995 and 2015 from the SEC website.
Natural language processing method to measure prototype and outlier similarity
To measure firms’ prototype and outlier similarities, we trained a document embedding model on our corpus of 159,216 annual reports and 2,488 IPO prospectuses. A document embedding model learns document embeddings, i.e. multidimensional vectors representing documents in a semantic space by sliding a window over documents and trying to predict a target word within this window based on neighbouring words and document identity (Le & Mikolov, 2014). Through this process, documents containing semantically similar words are mapped to the same region of a high-dimensional semantic space. Similarities between firms can then be evaluated based on similarities between their document embeddings. This reveals similarities that a diligent examination of firms’ attributes – generally not possible with large samples – cannot precisely uncover. For an in-depth discussion of our measurement strategy, see Appendix A.
Preprocessing of documents
We preprocessed documents in several steps. First, we extracted the main texts of the annual reports or the IPO prospectuses. We reduced these texts to lists of tokens (i.e. words), removed punctuation and digits, and lowered words. We removed stop words and words characteristic of SEC filings rather than of firms themselves by removing all words that appeared in more than 50% of documents of each type. We also removed very infrequent words and focused on the 10,000 most frequent words.
Document embedding model specifications
Building on standard specifications (Dai, Olah, & Le, 2015; Lau & Baldwin, 2016; Le & Mikolov, 2014), we fixed the number of dimensions of the document embeddings learned by the model at 300 and adopted a window size of 5. The model was trained by passing 5 times over the entire corpus using an initial learning rate of 0.025, which decreased linearly at each pass to a minimum of 0.005. To improve model quality, we downsampled words that appeared more than 10−5 times (Mikolov, Sutskever, Chen, Corrado, & Dean, 2013). Our results are robust to the use of alternative specifications of the model (see Appendix B).
Variables
Dependent variable
Our dependent variable is the underpricing for a focal issuing firm, measured as the difference between the market price at the end of the first day of trading and the offer price divided by the offer price. The average underpricing in our sample is 29%, with a standard deviation of 55%. The variable skewed to the right due to some firms achieving very high underpricing (up to 606% for the IPO of theGlobe.com in 1998). These descriptives were comparable to those of other studies using underpricing as their main dependent variable (e.g. Loughran & McDonald, 2013; Park, Borah, & Kotha, 2016).
Independent variables
To measure prototype similarity, we first created prototypes for each 3-digit SIC code industry category. 14 For each year and industry, we considered the set of all established firms in the industry and took the centroid of the document embeddings associated with their annual reports:

where f indexes established firms,
We operationalized the prototype similarity of an IPO as the similarity of the document embedding of its IPO prospectus (Form S-1) to its industry centroid and mean-centred it 15 :

where g indexes the issuing firm, y indexes the year of issuing firm g’s IPO,
We measured an issuing firm’s outlier similarity as its similarity to the IPO with the highest level of underpricing in the preceding year. Formally:

where g indexes the issuing firm,
Note that unlike prototype similarity, outlier similarity is measured as a function of one’s similarity to the most salient outlier irrespective of industry boundaries. This is in line with our theorization of outliers as affecting the valuations of investors throughout the entire IPO market due to their sudden and extreme underpricing irrespective of industry boundaries. Finally, we mean-centred outlier similarity. Figure 1 plots the distribution of both similarities.
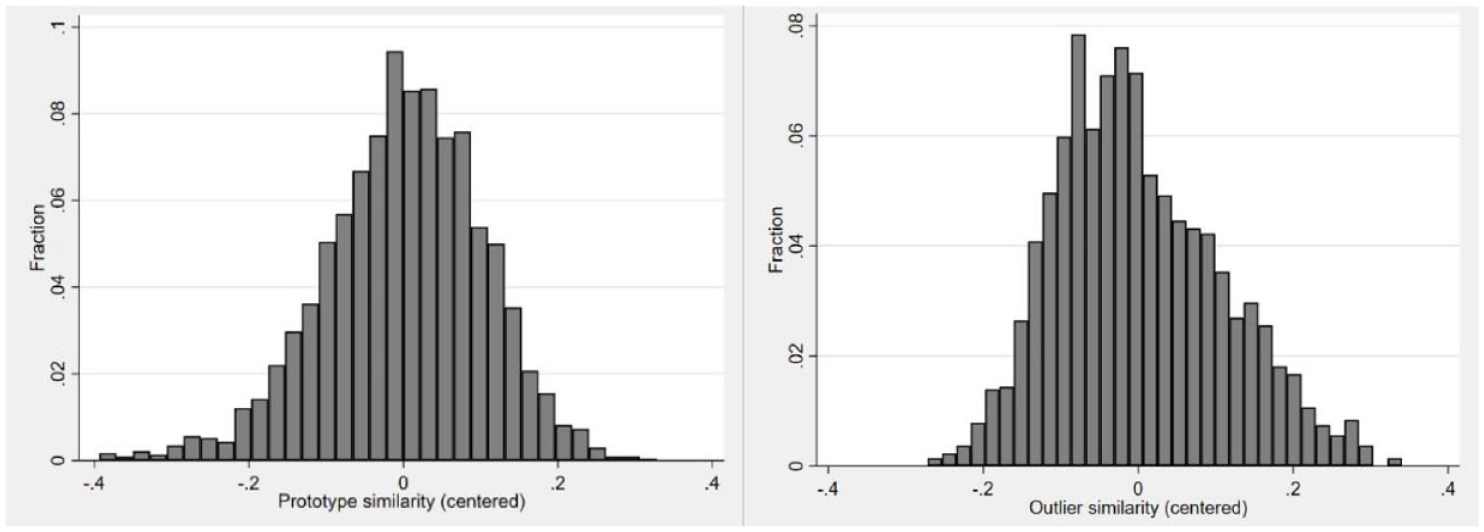
Distribution of prototype similarity (centred) and outlier similarity (centred).
Controls
Since the level of ‘hype’ for a particular industry may be correlated with both the outlier similarity of issuing firms within it and the level of underpricing, we control for it using two proxies: the average stock return and the average stock price volatility over the past quarter within a focal issuing firm’s industry. 16
As the level of investor enthusiasm in the financial market, which has known important variations during our period, impacts underpricing, we control for it using a rolling average of the VIX, the so-called ‘fear index’, over the three months preceding a focal issuing firm’s IPO. 17
Since high-tech IPOs tend to be subject to more information asymmetry (Carpenter, Pollock, & Leary, 2003; Ozmel, Reuer, & Wu, 2017), we created a tech dummy variable that took the value of 1 for issuing firms with three-digit SIC codes associated with high-tech industries (Kile & Phillips, 2009) 18 and 0 otherwise.
As the time elapsed since the rise of the outlier and the hype surrounding it may be correlated with underpricing, we measure the temporal distance from the outlier using the log of the number of days since the most highly underpriced IPO in the preceding year. 19 We further control for the log of the number of days since the beginning of the year.
Prior to an IPO, underwriters set a price range for the offering. Offer price revision is the percentage change between the final offer price set by underwriters and the middle of this initial price range (Hanley, 1993; Loughran & Ritter, 2002). To control for IPO market hotness, we used the percentage of IPOs with offer prices above the midpoint of the initial price range in the preceding month (Ibbotson, Sindelar, & Ritter, 1994). We also controlled for whether the IPO received venture capital (VC) support prior to the IPO, as its presence (value = 1) or absence (value = 0) influences underpricing (Arthurs, Hoskisson, Busenitz, & Johnson, 2008; Lee & Wahal, 2004). We further controlled for firms’ size (log of assets) and age (log of the number of years since founding plus 1).
Main results from OLS regression with multiple fixed effects
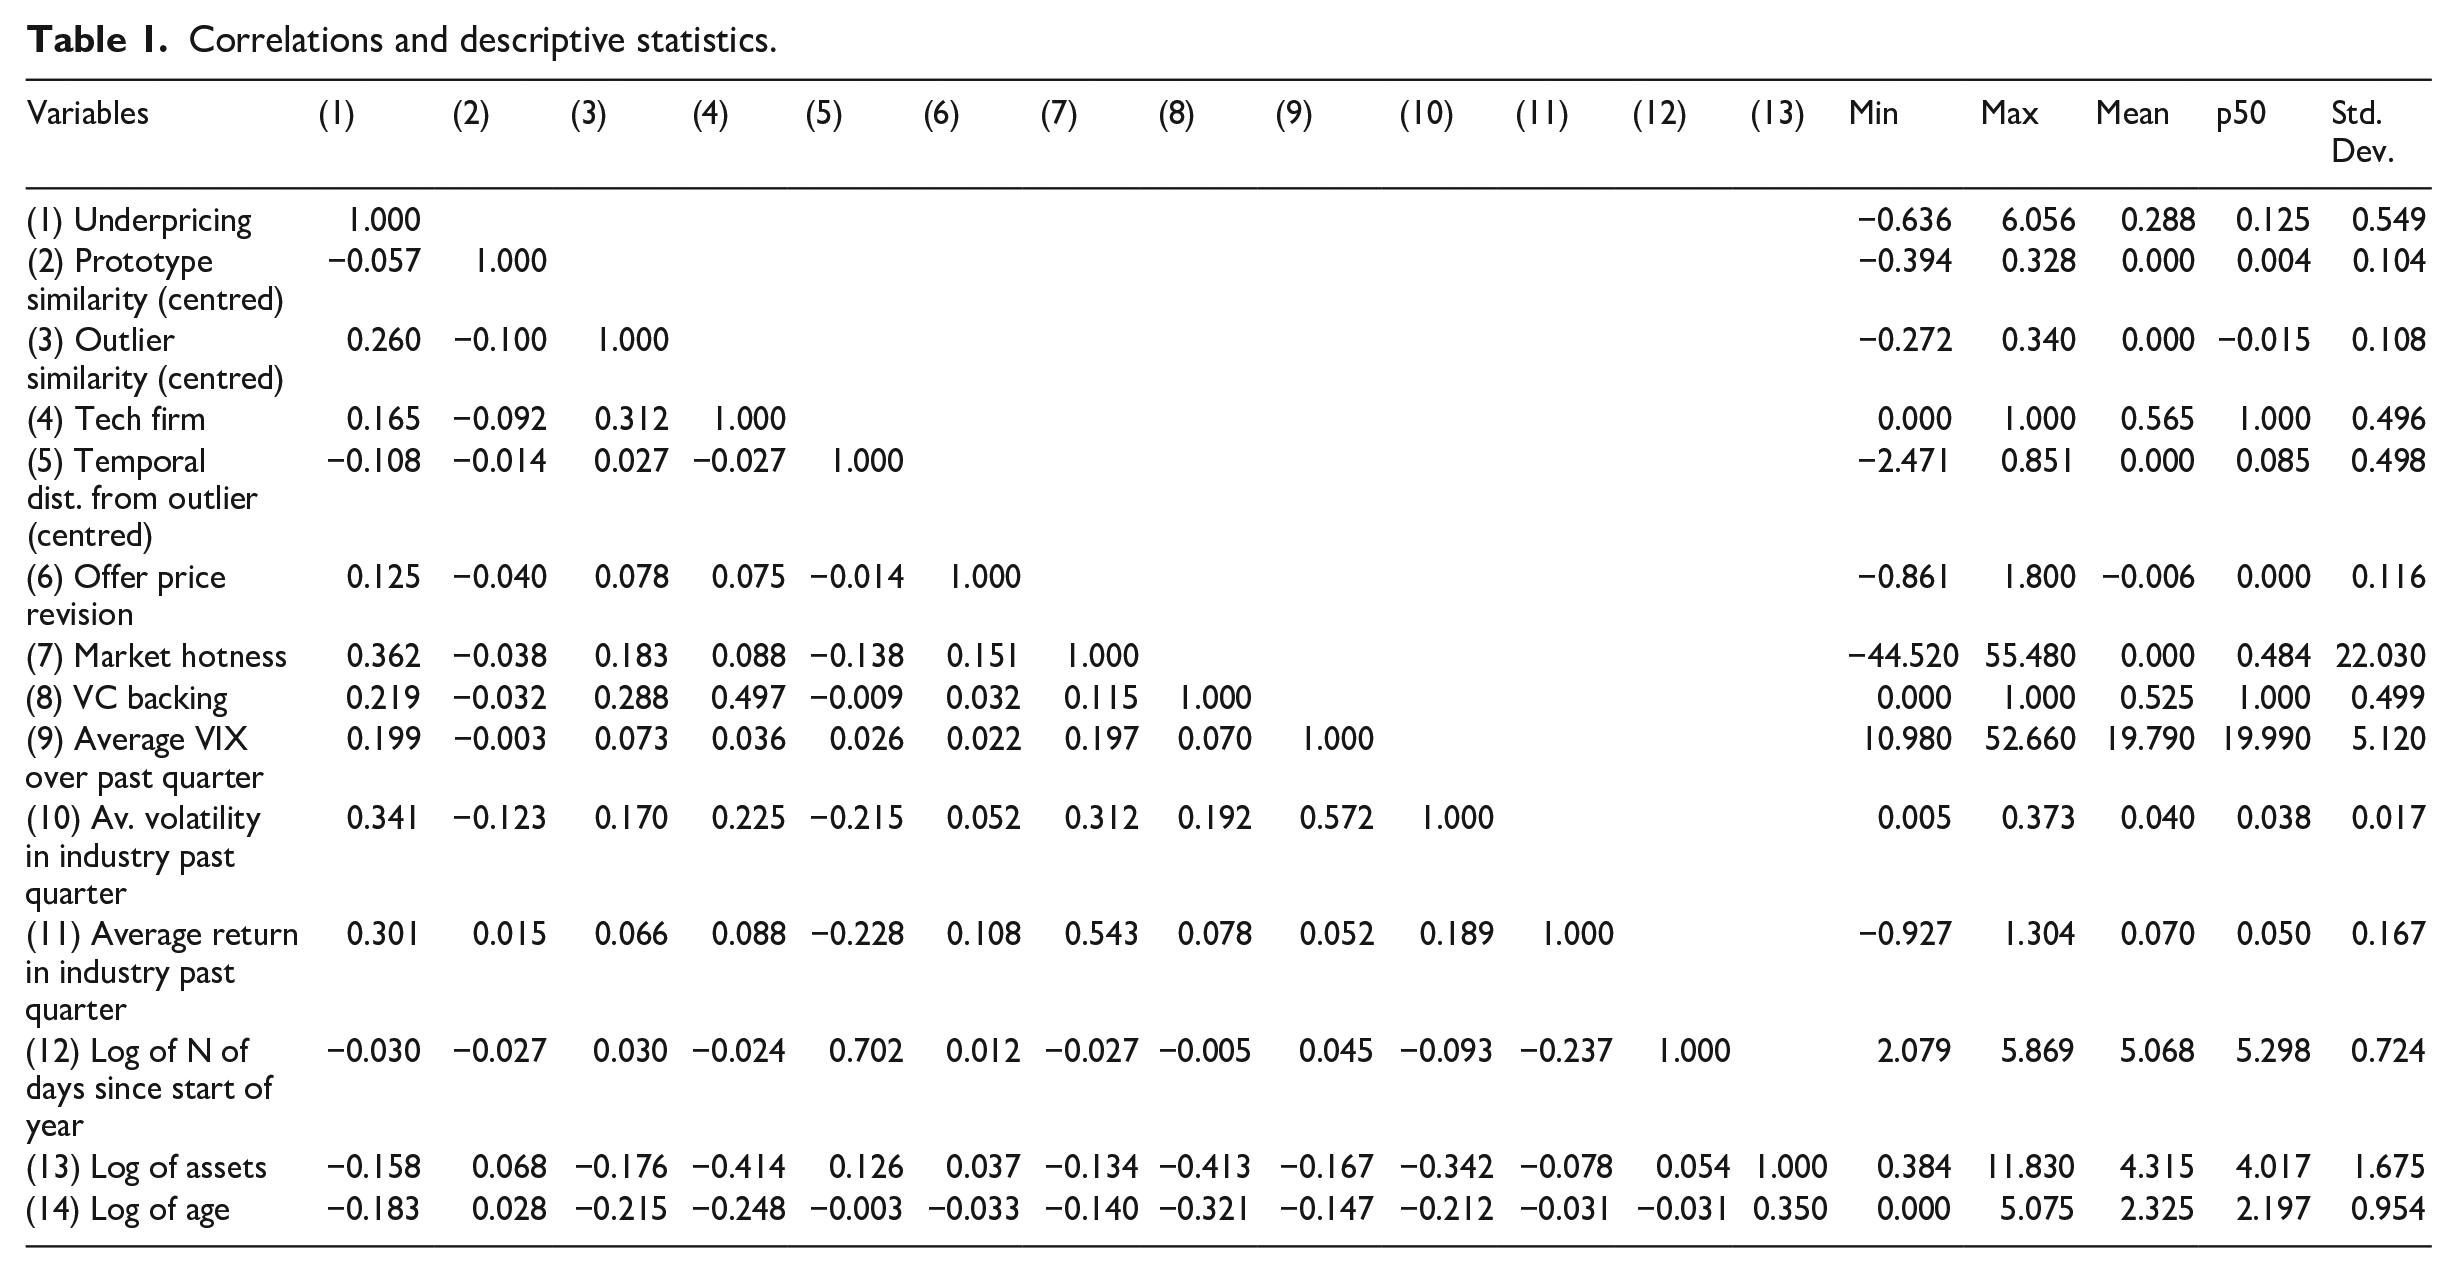
We estimated ordinary least squares (OLS) regressions of underpricing on prototype similarity and outlier similarity. In all models, we included industry fixed effects using 2-digit SIC codes to control for time-invariant unobserved heterogeneity between industries. We included lead underwriter fixed effects to control for stable unobserved factors, such as a lead underwriter’s prestige (Carter & Manaster, 1990), connections with institutional investors (Goldstein, Irvine, & Puckett, 2011; Gondat-Larralde & James, 2008), or propensity to underprice shares. We included stock exchange fixed effects to ensure that our results are not driven by systematic differences in IPO returns as a function of the market in which it occurs. We also included year effects to control for year-specific trends. Although including these fixed effects helps account for omitted variable bias, we acknowledge that our modeling strategy does not yield causal estimates, a limitation to which we return in the Discussion section. We clustered errors by industry. Table 1 presents descriptive statistics and the correlation matrix for our variables.
Correlations and descriptive statistics.
In Table 2, we present models 1–7, which correspond to our analysis using multiple fixed effects. Model 1 includes only our control variables. As expected, industry volatility, industry returns, VC backing, offer price revision, market hotness and stock market volatility (VIX) are all positively and significantly associated with underpricing (as well as the number of days elapsed since the outlier’s emergence) while age is negatively and significantly associated with underpricing. Model 2 introduces prototype similarity as an independent variable and does not show a significant association between prototype similarity and underpricing. Hence, H1 does not receive direct support. Model 3 introduces outlier similarity as an independent variable and reveals a positive and significant association between outlier similarity and underpricing (p = 0.001), which supports H2. In model 3, an issuing firm with an outlier similarity one standard deviation above the sample mean (i.e. + 0.11, Table 1) experiences a level of underpricing 5.6% higher than that of an issuing firm with the average level of outlier similarity, all else equal. In model 4, which includes both independent variables, the association between outlier similarity on underpricing remains positive and significant (p = 0.001), and its magnitude remains the same.
Underpricing: effects of prototype similarity (centred) and outlier similarity (centred).
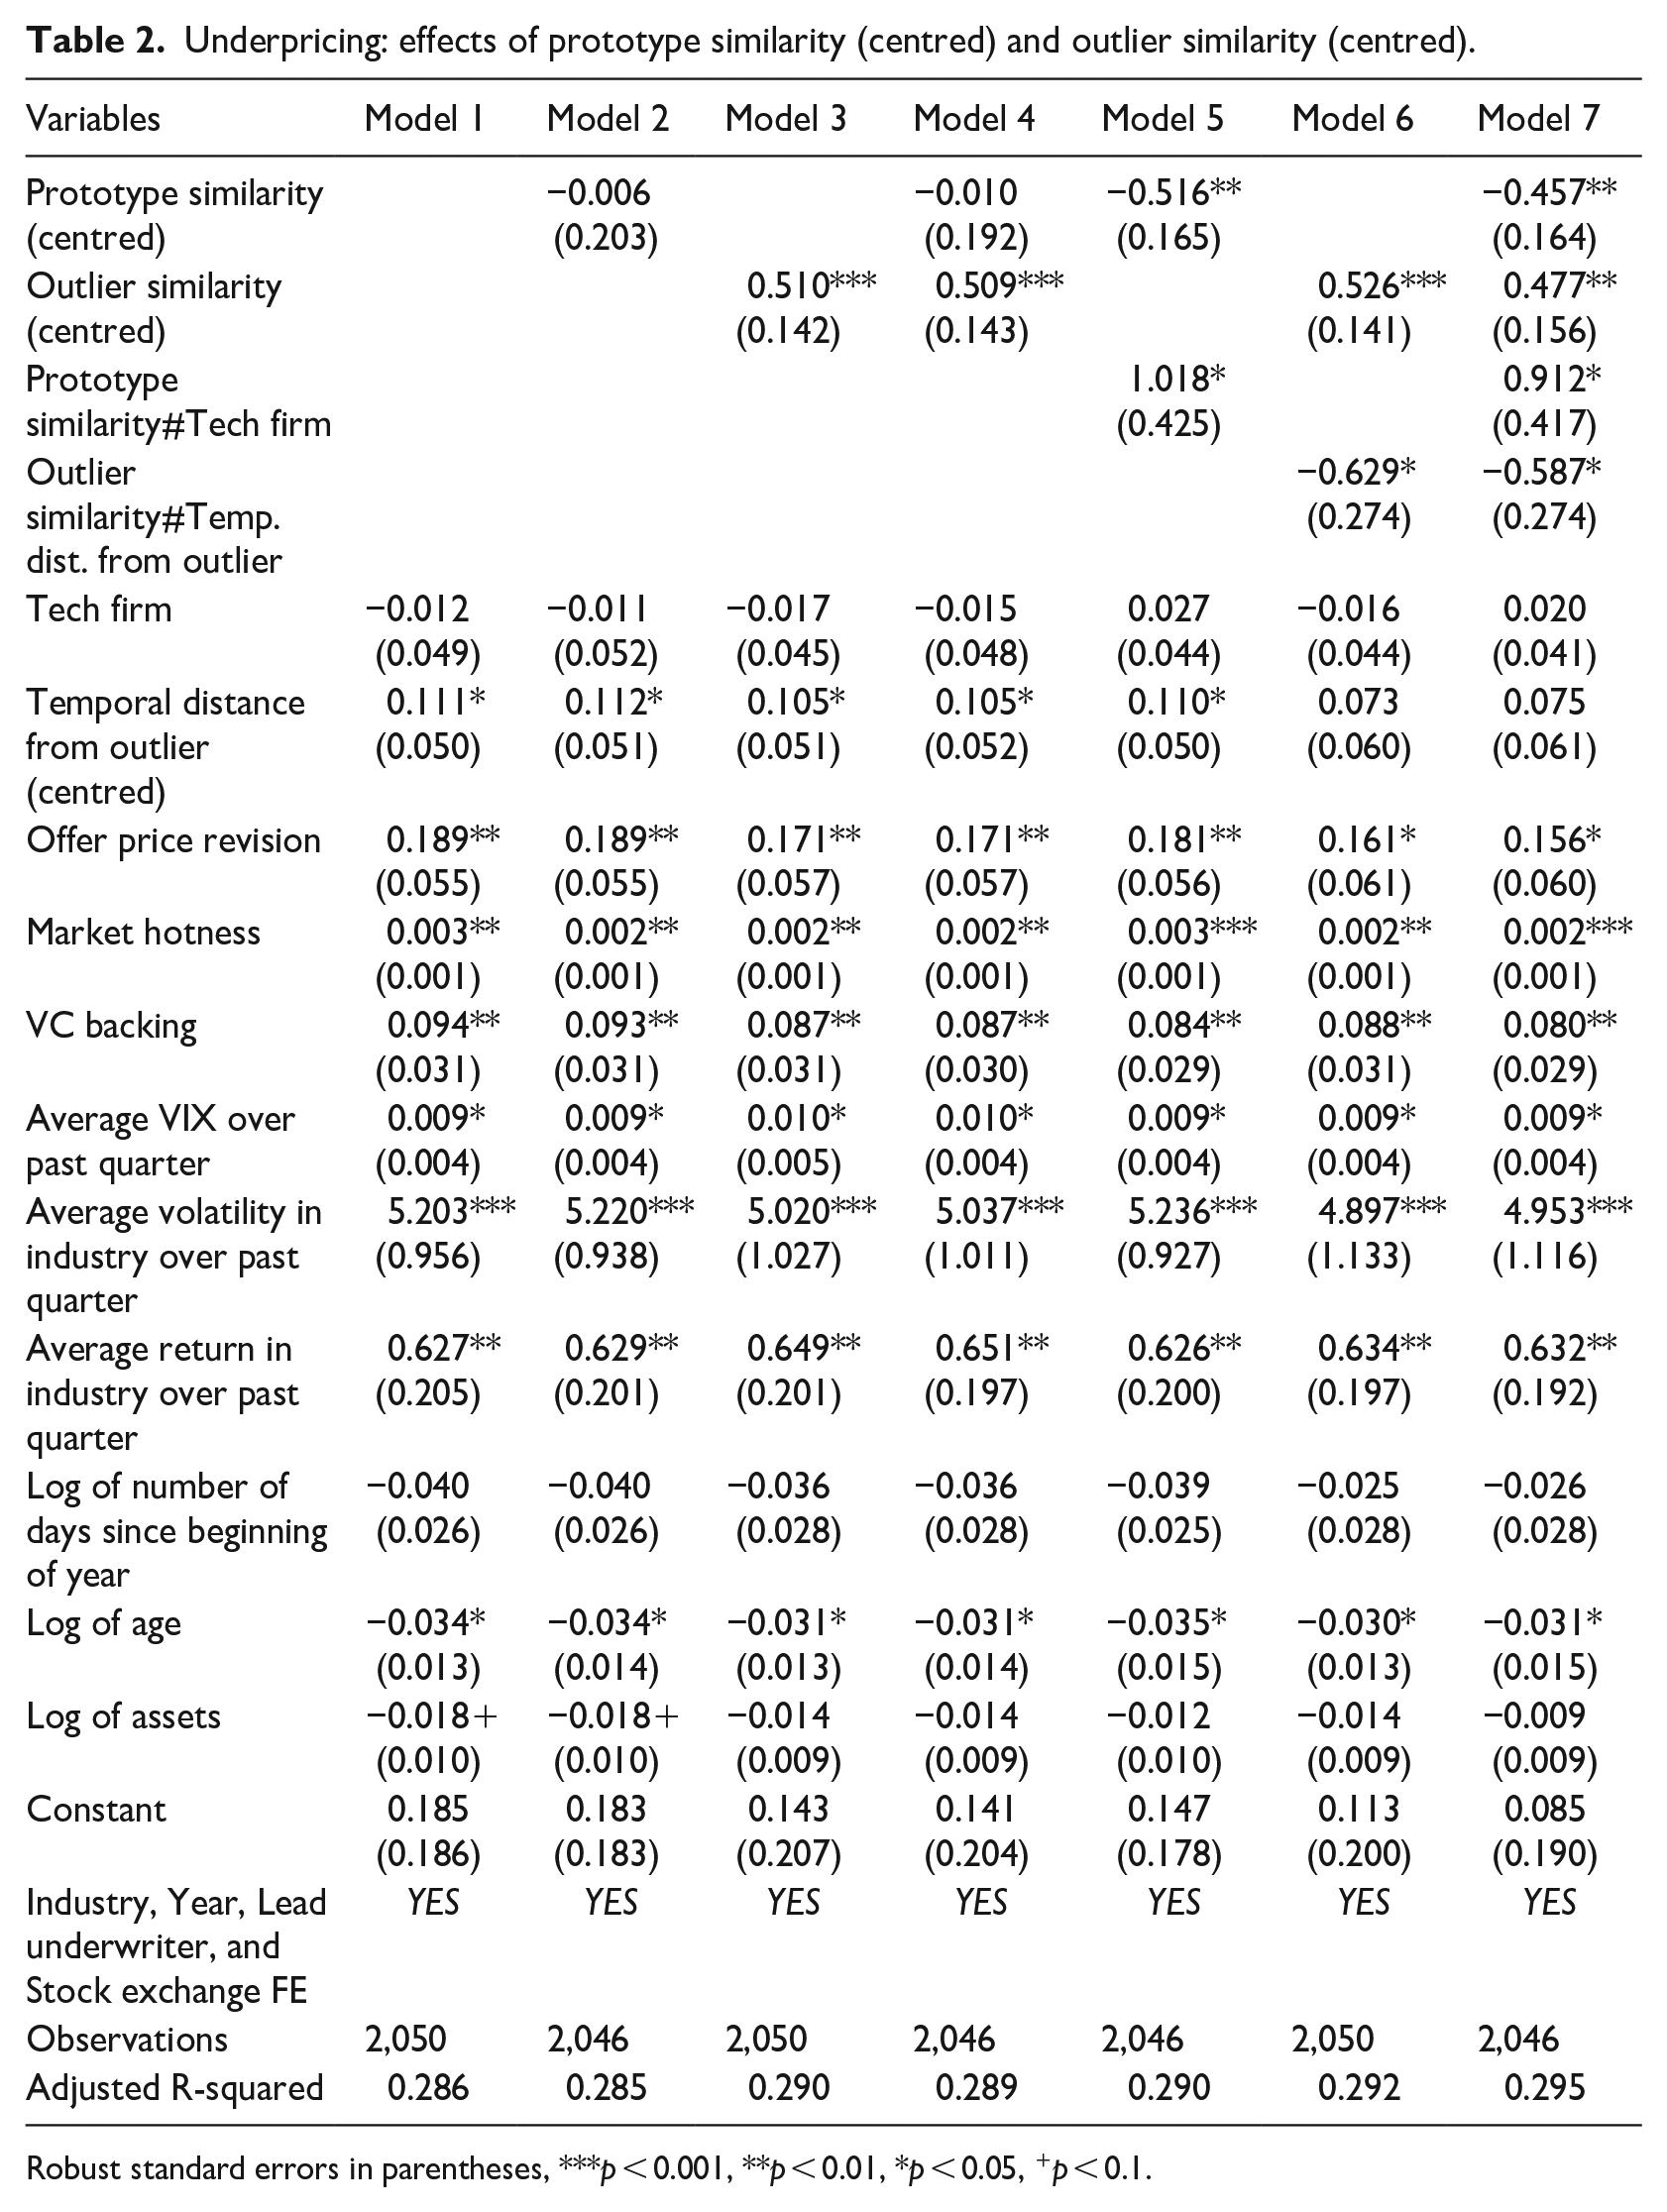
Robust standard errors in parentheses, ***p < 0.001, **p < 0.01, *p < 0.05, +p < 0.1.
Additional analysis probing the relationship between the two similarities and underpricing
Probing the mechanism supporting the effect of prototype similarity
Per our preceding argument, the negative relationship between prototype similarity and underpricing rests on investors’ ability to both make converging inferences about firms’ unobserved attributes and use shared interpretive schemas associated with categories when firms have high prototype similarity. However, categorical knowledge and interpretive schemas may not be equally distributed across industries. For instance, issuing firms in high-tech industry categories tend to have idiosyncratic features (Ozmel et al., 2017; Wu & Reuer, 2021), be young, develop new products and face considerable risk (Carpenter et al., 2003). All these factors complicate the abstraction of their features into category prototypes, limiting the quality of categorical knowledge and the kind of inference it permits. Hence, if our theory is correct, the negative association between prototype similarity and underpricing could be weakened in these industries.
In model 5, we thus include an interaction between prototype similarity and the high-tech industry dummy. We find that prototype similarity is negatively associated with underpricing as per H1’s expectations (p = 0.003), and as expected, the coefficient of the interaction between prototype similarity and the tech dummy is positive and significant (p = 0.02). More precisely, when prototype similarity is low, the difference between the average predicted levels of underpricing in high-tech and low-tech industries is negative and significant, while it is positive and significant when prototype similarity is high (see Figure 2). Overall, these results show that prototype similarity has a negative and significant association with underpricing in categories where prototype similarity provides better information (i.e. in low-tech industries) and a positive but not significant association with underpricing in less mature categories where prototypes are less established (i.e. in high-tech industries), which is in line with our theory. This explains why we do not find support for H1 in model 2 since the two effects (in low- vs. high-tech industries) cancel each other out (as in Figure 2A).
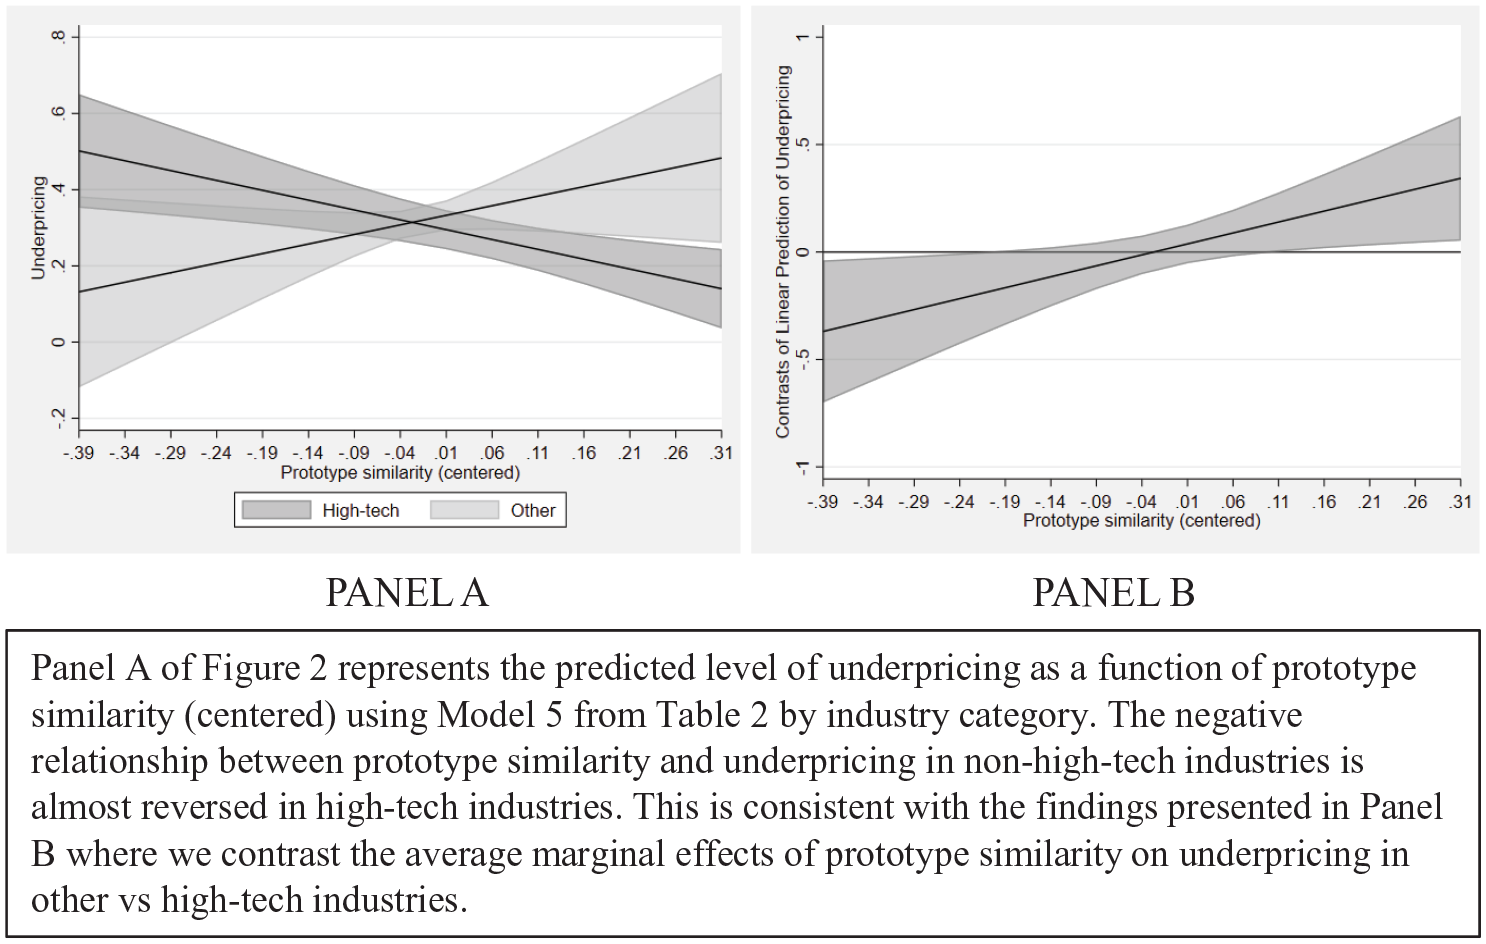
Marginal effect of prototype similarity (centred) on underpricing by industry.
Probing the mechanism supporting the effect of outlier similarity
The mechanism driving the positive association between outlier similarity and underpricing rests on the ambiguity of salient outliers’ extreme performance, which leads some investors toward divergent and possibly misguided valuations. If this mechanism is at play, we expect that as time passes and more information is revealed about outliers, investors converge on a common interpretation of the causes and implications of outliers’ past extreme performance. Thus, as time passes, investors’ valuation should diverge less and the positive association between outlier similarity and underpricing should be weaker.
In model 6, we thus include an interaction between outlier similarity and temporal distance from the outlier. The interaction between outlier similarity and temporal distance is negative and significant (p = 0.026). As illustrated in Panel A of Figure 3, the slope of the relationship between outlier similarity and underpricing is thus contingent on the temporal distance from the outlier. Panel B of Figure 3 further shows the average marginal effects of outlier similarity on underpricing as a function of the temporal distance from the outlier. As expected, for low values of temporal distance, the average marginal effect of outlier similarity on underpricing is positive and significant but not significant for higher values of temporal distance.
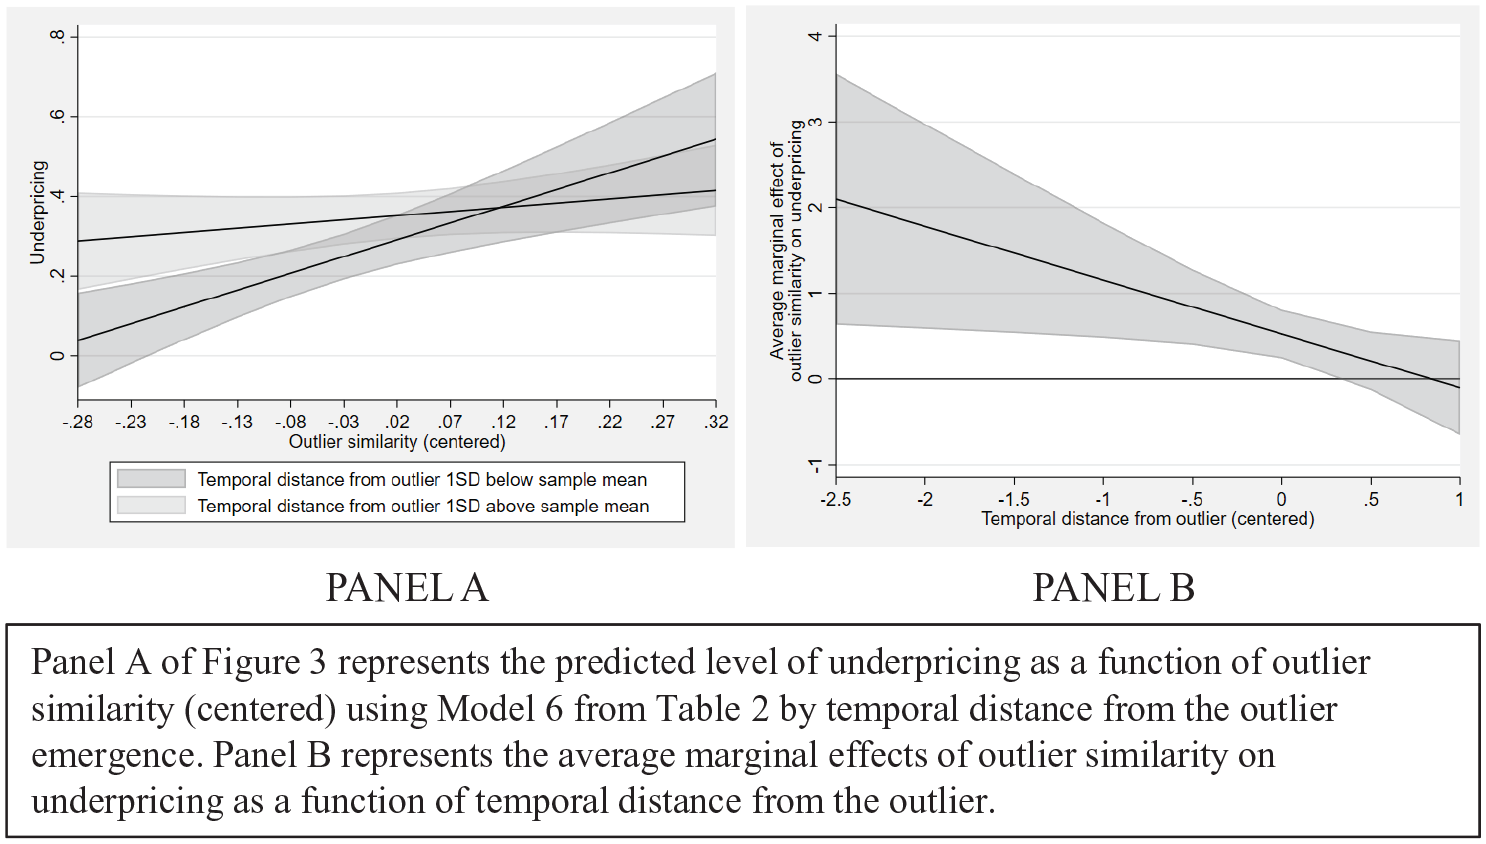
Marginal effects of outlier similarity (centred) on underpricing by temporal distance from outlier emergence.
Full model
In model 7 (full model), the main and interaction terms are in the expected direction and significant (p < .01 and p < .05, respectively), further supporting our theorizing.
Robustness checks
Results from CEM
One limitation of our approach is the potential covariate imbalance between firms with high vs. low prototype or outlier similarity. To partially address this limitation, we applied coarsened exact matching (CEM) (Blackwell et al., 2009) to assess whether being more vs. less similar to prototypes or outliers while being identical in as many other dimensions as possible is associated with more or less information asymmetry (see Corritore, Goldberg, & Srivastava, 2020 for a comparable approach). We created one discrete measure for both ‘treatments’, which takes the value of 1 if prototype (outlier) similarity is greater than the issuing firm’s industry median in a given year and 0 otherwise. We then performed two separate CEMs using the command cem in Stata (Blackwell et al., 2009) – one for each of our treatment variables – using VC backing, log of assets and log of age to create strata of comparable observations. To determine the variables to use to create strata, we ran a logistic regression of our treatment variables on all the controls used in our main OLS regression. We found that tech firm, VC backing and log of assets are significant predictors of having prototype similarity above the industry median in a given year, while tech firm, VC backing and log of age are significant predictors of having outlier similarity above the industry median in a given year. As we interact tech firm with prototype similarity in our analysis, we do not use it for matching to ensure that it varies within strata.
For both treatments, we used exact matching on VC backing and used the default binning strategy implemented in CEM in Stata for log of age and log of assets. The upper part of Table 3 shows that we successfully reduced imbalances in the data along the selected covariates based on the reduction in the multivariate L1 statistic, which measures the extent to which the distribution of covariates of interest in the treated group mirrors that of the control group (Blackwell et al., 2009). Additionally, differences in the mean values of the covariates used for matching purposes between the treated and control groups are not significant after matching.
OLS regression of underpricing on prototype similarity (centred) and outlier similarity (centred) after CEM.
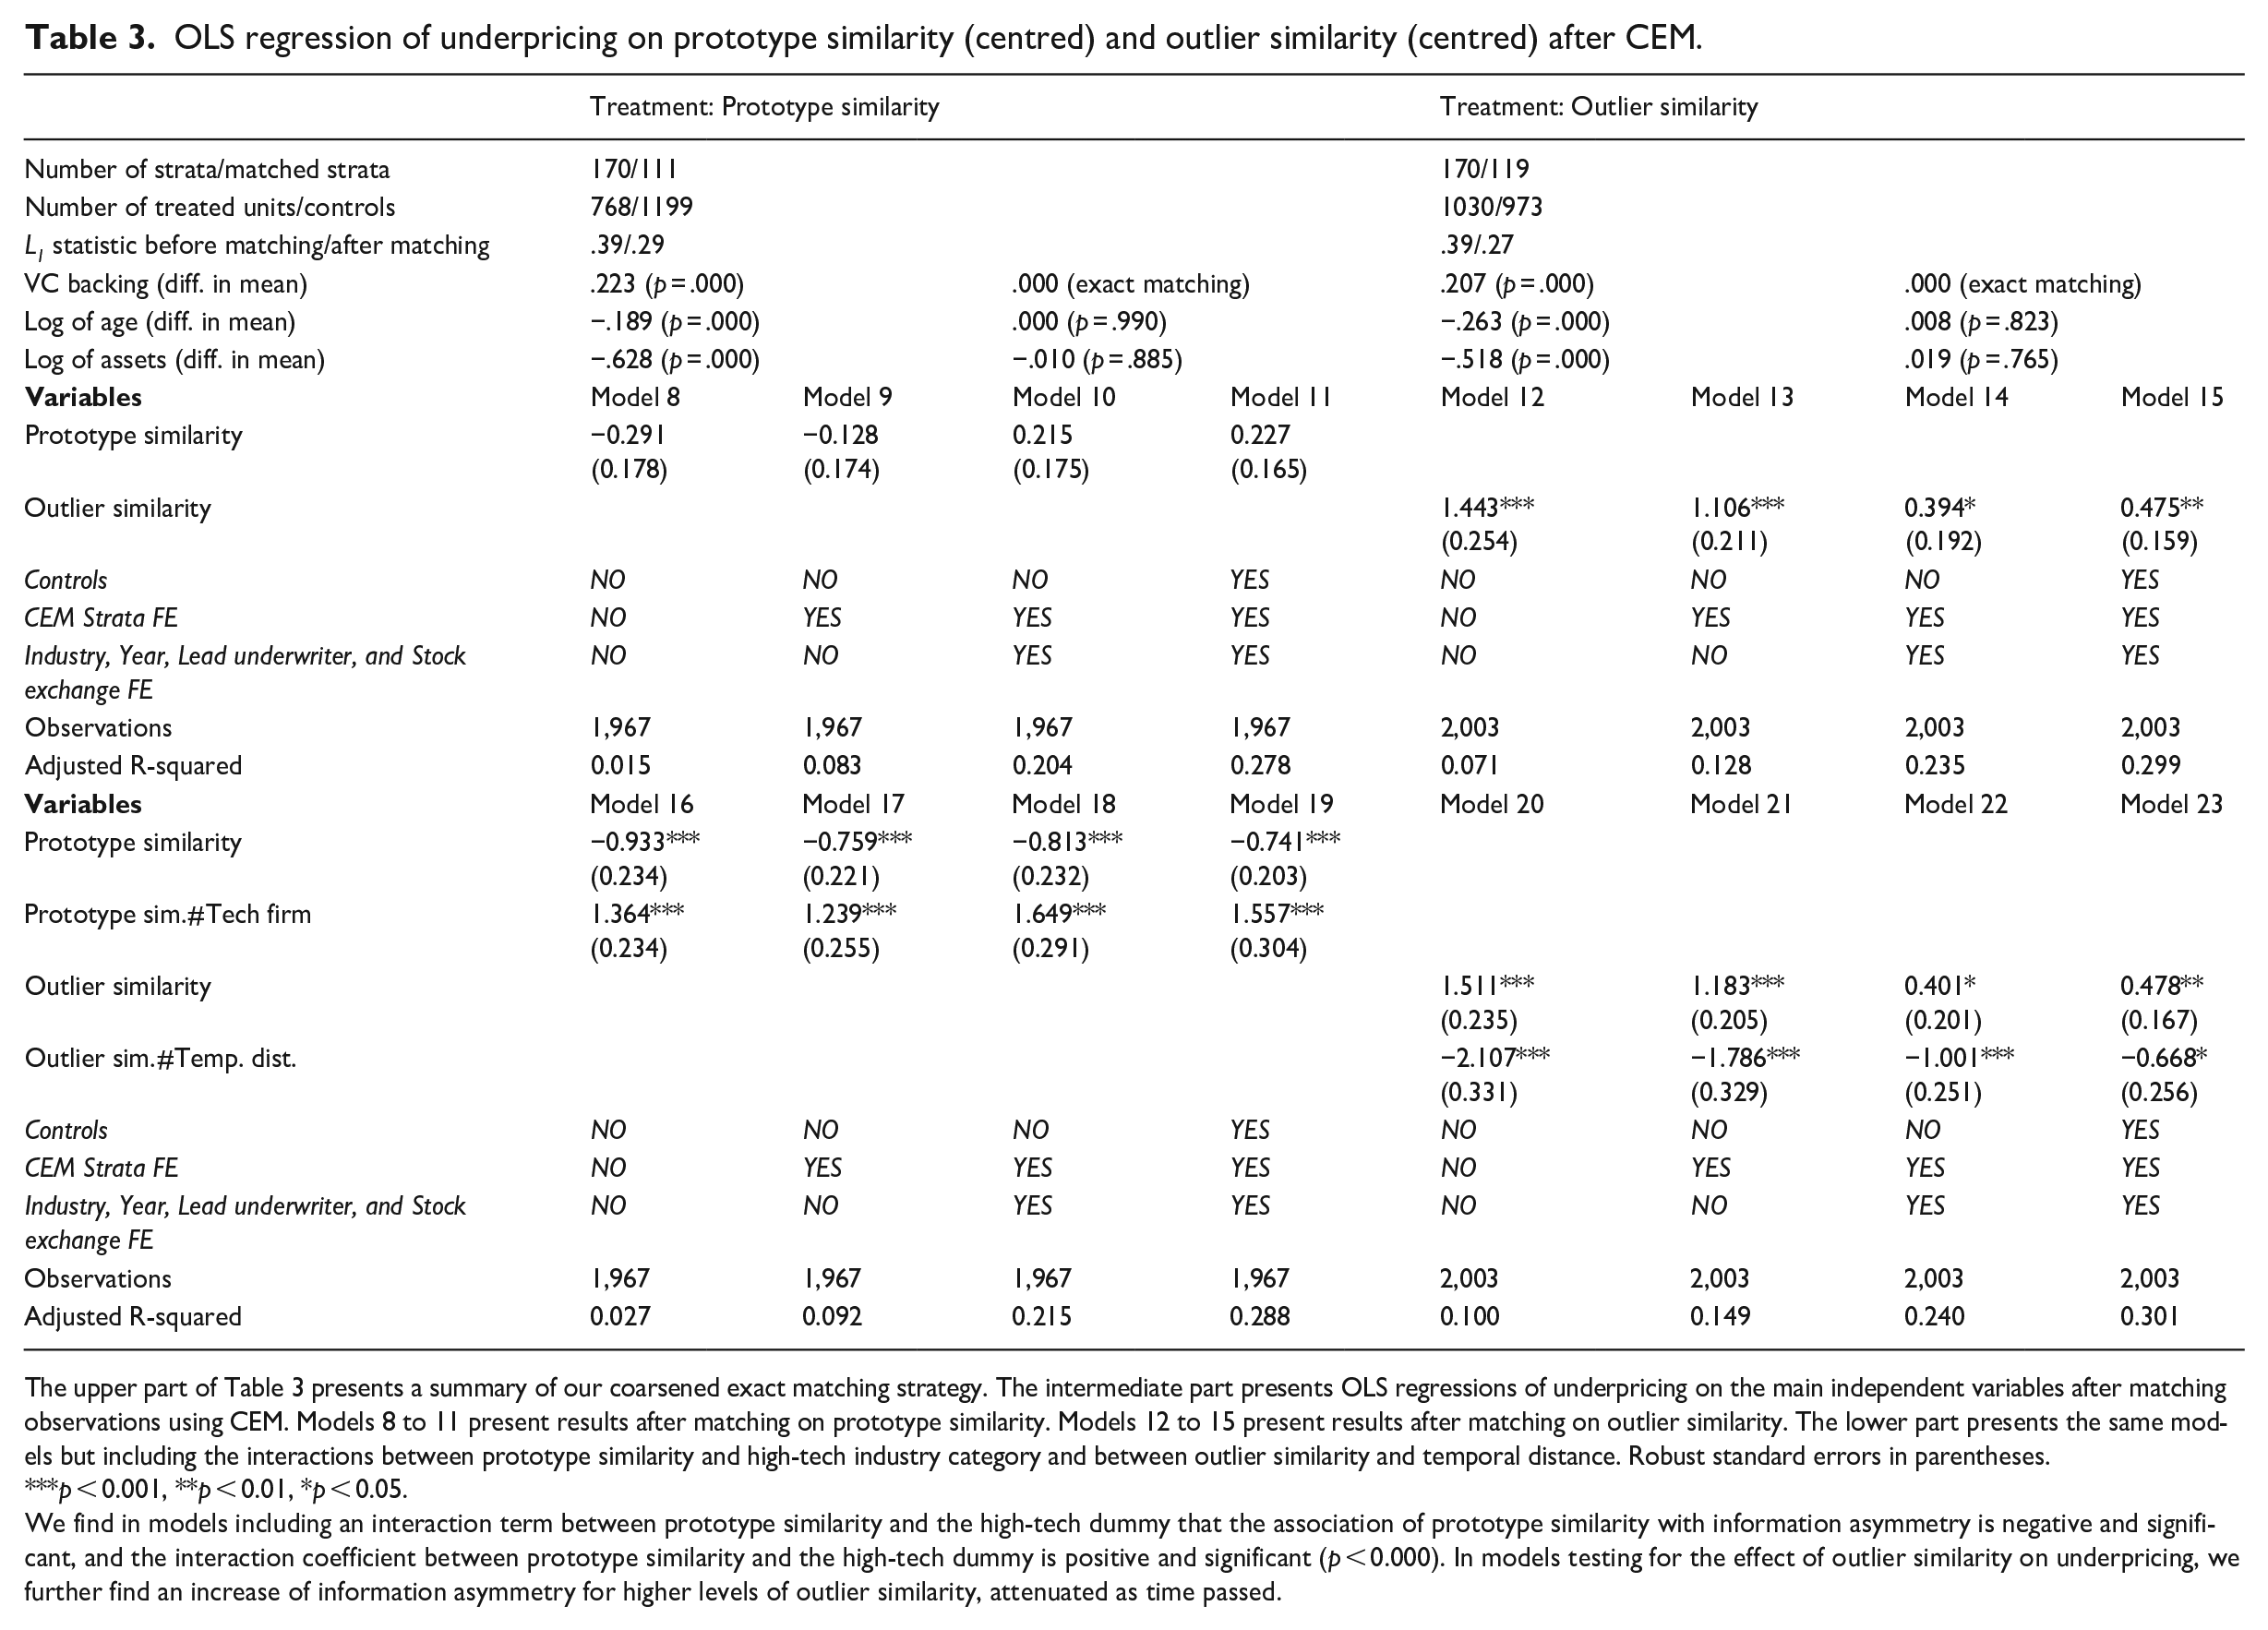
The upper part of Table 3 presents a summary of our coarsened exact matching strategy. The intermediate part presents OLS regressions of underpricing on the main independent variables after matching observations using CEM. Models 8 to 11 present results after matching on prototype similarity. Models 12 to 15 present results after matching on outlier similarity. The lower part presents the same models but including the interactions between prototype similarity and high-tech industry category and between outlier similarity and temporal distance. Robust standard errors in parentheses.
p < 0.001, **p < 0.01, *p < 0.05.
We find in models including an interaction term between prototype similarity and the high-tech dummy that the association of prototype similarity with information asymmetry is negative and significant, and the interaction coefficient between prototype similarity and the high-tech dummy is positive and significant (p < 0.000). In models testing for the effect of outlier similarity on underpricing, we further find an increase of information asymmetry for higher levels of outlier similarity, attenuated as time passed.
After matching, we ran the OLS underpricing regression on our continuous measure of the treatment used for matching. The lower part of Table 3 summarizes our results, which provide strong support for our hypotheses.
Other robustness checks
We measured prototype similarity using 4- and 2-digit SIC codes to determine whether the coarseness of the industry classification used to identify peers influenced our results. As investors may consider several outliers when assessing new offerings, we tested models where outlier similarity refers to an issuing firm’s average similarity to the two, three, four and five firms with the highest underpricing in the preceding year. Our results are robust to these alternative measures of the two similarities. 20
We tried different specifications of Doc2Vec with a window size of 5 (emphasis placed on similarities between neighbouring words) or 10 (emphasis placed on broader topical similarities) and embeddings dimensions of 100, 200 or 300. Results are robust to these alternative specifications (see Appendix B).
Another limitation of our main results is that prototype and outlier similarity are not randomly assigned across firms and may be endogenous. To address this endogeneity concern, we identified two exogeneous instruments that should be correlated with prototype and outlier similarity but not with the error term. Results are robust to this approach (see Appendix B).
Discussion
This paper first contributes to the literature on market valuation (Lamont, 2012), and specifically to research on categories and audience evaluation (Delmestri, Wezel, Goodrick, & Washington, 2020; Hannan et al., 2019). Recent research in this vein focused on between-audience member variations in valuation of the same firm or product, tying it to audience members’ reliance on different evaluation modes or theory of value (Gouvard & Durand, 2023; Paolella & Durand, 2016). This paper continues this vein of research, introducing salient outliers as a source of between-audience member variations in valuation. Due to the ambiguity that surrounds salient outliers, they do not help audiences converge in their valuations but rather beget confusion. In the IPO market, this fuels information asymmetry concerns and results in a value discount. Importantly, rather than presenting audiences’ reliance on outliers as an alternative mode of evaluation relative to prototype-based evaluation, we argue that the two similarities concomitantly affect valuation.
Similarity to others is often presented as a source of legitimacy, facilitating valuation and helping audiences reach an agreement on the value of a particular object – an advantage which comes at the expense of reduced distinctiveness and attention (Askin & Mauskapf, 2017; Slavich & Castellucci, 2016; Zuckerman, 2016). Outlier similarity seems to work relatively differently from this ‘baseline’ picture: it may be conducive to both greater attention being received and greater divergence among audiences regarding the value of a particular object. One potential implication is that outlier similarity may be used to counteract the influence of one’s similarity to other reference points as one strives to achieve optimal distinctiveness (Zhao & Glynn, 2022).
We further find evidence that the influence of salient outliers on audiences’ valuations co-exist with that of pre-existing category prototypes. This is particularly interesting given the different nature of category prototypes and salient outliers. Models of audience members’ valuations in markets often take preexisting categories as given (Hannan et al., 2019; Zuckerman, 1999). Although categories may change over time (Gollnhofer & Bhatnagar, 2021; Innis, 2022; Pedeliento, Andreini, & Dalli, 2020), they are generally presented as relating to the enduring features of organizations (Hannan et al., 2019; Kim & Jensen, 2011). Our findings suggest that, in addition to this relatively stable, slow-changing component of audience members’ valuations, we should consider a more transient, temporary component that may correspond to sudden hype, often epitomized by salient outliers, that may or may not subsequently move on to provide the foundation for new categories (Durand & Khaire, 2017).
The respective strength of these two influences on audience members’ valuations remains a relatively open question. In our setting, it seems that outlier similarity has a stronger and steadier association with prototype similarity, whose influence is washed out in high-tech categories. 21 However, this might be due to boundary conditions such as IPO investors’ generally lower interest in firms with high prototype similarity and greater openness to firms engaging in atypical activities (Pontikes, 2012). In any case, the influence of salient outliers on audiences’ valuations may suggest that audiences’ valuations regularly fluctuate in response to the rise and fall of salient outliers, which periodically attract their attention. This may contribute to explaining why, in prior studies that did not account for the influence of salient outliers, the premium that theoretically accrues to firms with high prototype similarity is limited or not observed in markets where outliers lie far away from prototypes. The meddling influence of salient outliers in audience members’ valuations would thus join the rank of possible explanations for the limited benefit of prototype similarity in some markets, alongside the use of different evaluation modes (Glaser, Atkinson, & Fiss, 2020; Gouvard & Durand, 2023), market growth (Pozner, DeSoucey, Verhaal, & Sikavica, 2022), categorical contrast (Kovács & Hannan, 2010) or status (Sharkey, 2014).
One aspect that we could not explore in depth in this paper is salient outliers’ own relationship to prototypes. Theoretically, salient outliers could either have high or low prototype similarity. 22 However, we could expect salient outliers which are also categorical anomalies to appear particularly ambiguous. While in our setting we did not find evidence of this, we believe that future research could benefit from further exploring how category prototypes relate to salient outliers. For instance, it could be that salient outliers that do not belong to pre-existing categories and eventually impose a positive interpretation of their performance succeed in becoming atypical exemplars that audience members may use as a benchmark when confronted with unexpected offerings (Gouvard & Durand, 2023).
We further contribute to organizational research on meaning and culture using computational methods (Aceves & Evans, 2023; Kozlowski et al., 2019; Poschmann et al., 2023). A recent trend in research on optimal positioning has leveraged natural language processing to represent documents produced by organizations in a semantic space as a proxy for their positioning (Haans, 2019; Majzoubi, Zhao, Zuzul, & Fisher, 2024; Vossen & Ihl, 2020). The motivation for doing so is that constructs such as prototype similarity or outlier similarity are difficult to measure on a large scale. For instance, it is generally not possible to ask market participants to rate firms in terms of their grade of membership into market categories or of their similarity to salient others when using a sample of thousands of firms. Natural language processing-based methods allow us to proxy for audiences’ perceptions of such similarities, under the assumption that semantic similarities between texts produced by organizations correlate with perceived similarities between them. As part of this paper’s contribution, we provide in Appendix A a detailed discussion of existing alternatives to measure constructs such as the two similarities to scale using organizational documents which we hope will help interested readers to navigate their way into this emerging field. We further detail the advantages of the method that we propose relative to other methods, namely its ability to capture semantic content that is unique to a specific document and hence representative of a focal organization’s specific positioning. The method that we propose can be applied to other settings with few modifications, offering the opportunity to standardize our measurements across studies and fields.
This study has certain limitations that suggest additional avenues for future research. First, we acknowledge that our models cannot fully address unobserved heterogeneity. Therefore, we do not present our findings as causal. However, the correlations that we unveil are robust to many different specifications, which warrants further exploration. Another limitation is that the dimensions of the semantic space in which we represent documents are not readily interpretable. In future work, researchers may delve into the dimensions along which organizations tend to be similar to prototypes or outliers using, for example, a sample of hand-coded texts. To simplify our theory, we did not address investor heterogeneity in the IPO market. Yet, investors may differ in several ways – for instance, institutional and retail investors, as well as long-term and short-term investors, are known to value firms differently (DesJardine et al., 2021; Jenkinson & Jones, 2009; Martens et al., 2007). This means that the associations between the two similarities and underpricing that we observe may be driven by specific types of investors – possibly by less sophisticated retail investors and more opportunistic short-term investors. Another possible caveat related to investor heterogeneity is that investors may switch from prototype-based evaluation to alternative evaluation modes (Gouvard & Durand, 2023) when confronted with firms with high outlier similarity, which may contribute to explaining part of our result. We hope that future research will be able to disentangle these effects using additional data on investors.
Conclusion
This paper shows that salient outliers influence audiences’ valuation in markets. However, unlike other reference points used by audience members to support their evaluation, most notably category prototypes, which generally help audience members converge in their valuations, outliers beget confusion. While identifying outliers and measuring outlier similarity is not easy, natural language processing methods applied to large corpuses of corporate documents can help us to do so, as this paper illustrates. They can thus help researchers clear out confusion around audiences’ valuations in markets. More broadly, natural language processing methods constitute a unique tool to study meaning making in markets and organizations as well as its consequences for collectives which, we hope, organizational researchers will seize to bring organizational research on meaning and culture across new frontiers.
Footnotes
Appendix A: In-depth discussion of document embeddings
To capture similarities among firms, we relied on semantic similarities among documents produced by firms, which capture underlying industry category membership (Hoberg & Phillips, 2010, 2018) and pairwise similarities in market positioning (Barlow et al., 2019). Specifically, we (1) represented firms in a semantic space by applying a document embedding model to firms’ annual reports and IPO prospectuses, (2) constructed prototypes and measured prototype similarity and (3) measured outlier similarity. We provided an overview of our entire approach in Figure A1.
Appendix B: Robustness checks
As part of our robustness checks, we replicated our results using alternative specifications of our main independent variables based on alternative specifications for Doc2Vec. We present these models in Tables B1 and B2.
To address endogeneity concerns, we further re-estimate models 2 and 3 using two-stage least squares regressions. To do so, we create two exogenous instrumental variables that should be correlated with prototype and outlier similarity but not with the error term in models 2 and 3, respectively.
The instrumental variable that we use for prototype similarity is the prototype similarity of established firms that are similar to a focal issuing firm. Indeed, part of the issuing firm’s prototype similarity is determined by the baseline level of prototype similarity among similar firms. Issuing firms need to adhere to this baseline tendency to be recognized as part of this group of similar firms (Zuckerman, 1999, 2016). However, there is no reason to expect that the prototype similarity of firms similar to a focal issuing firm are related to its underpricing, except through its association with the issuing firm’s own prototype similarity. Formally, we compute the average prototype similarity of the five most similar peers to a focal issuing firm.
The instrumental variable that we use for outlier similarity is the outlier similarity of established firms that are similar to a focal issuing firm. We would expect a mechanical association between one and the other as, if a focal issuing firm is most similar to firms that are also similar to a salient outlier, then the issuing firm should be similar to the salient outlier as well. However, there is no reason to expect that the outlier similarity of firms similar to a focal issuing firm are related to its underpricing, except through its association with the issuing firm’s own outlier similarity. Formally, we compute the average outlier similarity of the five most similar peers to a focal issuing firm.
Table B3 shows the results of our instrumental variable approach, which are consistent with our main analysis. The first-stage model for prototype similarity (model B21) shows a significant effect of the instrument on prototype similarity. The second-stage model for prototype similarity (model B22) does not show a significant association between prototype similarity and underpricing, as in model 2. The first-stage model for outlier similarity (model B23) shows a significant effect of the instrument on outlier similarity. The second-stage model for outlier similarity (model B24) shows a positive and significant association between outlier similarity and underpricing, as in model 3. Overall, these results are consistent with those obtained using OLS regression.
Acknowledgements
We would like to warmly thank the editorial team of the Special Issue, Jan Goldenstein, Dennis Jancsary, Stine Grodal, Bernard Forgues, and P. Devereaux Jennings, editor-in-chief, Tammar Zilber, and three anonymous reviewers who were crucial to shaping this paper. We are also grateful for the friendly comments from participants to the AOM 2021 on an earlier version of this paper. We would also like to thank the members of the SNO Institute for feedback on early versions of this paper. Finally, we thank Emanuele Bettinazzi for his friendly feedback during informal discussions.
Funding
The author(s) received no financial support for the research, authorship, and/or publication of this article.