
Abstract
This article explores the history of influenza, focusing on the four major flu pandemics in the last century and a half, outbreaks starting in 1889, 1918, 1957, and 1968. The article looks closely at flu etiology and the historical puzzles over which flu subtype was responsible for each major outbreak. Some mysteries regarding pandemic influenza remain, with core questions stubbornly refusing to yield answers. This article seeks to explore the history of flu in the hope that we can take away some lessons learned as we try to get ready for potential future flu pandemics.
Infectious disease experts warned us that the next big one would be influenza. But when it came it was coronavirus, not flu. So, what about the next time? Will that one be the flu? Might it be some version of the influenza of autumn 1918, one of the worst pandemics in human history?
The second-half of the twentieth century brought great advances in curative and preventive medicine, antibiotics to treat bacterial diseases, and the development of a wide array of vaccines that stopped many diseases in the first place. As advanced nations passed through the epidemiological transition, with the leading killers shifting from infectious diseases to long-term debilitating conditions, mainly heart disease and cancer, some leading health experts concluded that the age of infectious disease was behind us. It is not.
Today, as we see hopeful signs that COVID-19 might be beginning to ebb, one thing our generation truly understands is what it means to survive a pandemic. The only consolation for going through these terrible days is the rather cold comfort that we have learned some hard lessons.
But have we?
This article explores the history of influenza, focusing on the four major flu pandemics in the last century and a half, outbreaks starting in 1889, 1918, 1957, and 1968. We will consider the key questions regarding these events, looking closely at flu etiology and the historical puzzles of trying to determine which flu subtype was responsible for each one of these outbreaks. The subtypes of three are clear, but one is not.
We need to understand as much as possible about prior influenza pandemics, to take the lessons that they might offer, and move to action based upon this knowledge. We cannot make the right vaccine without a good understanding of what subtypes came before, when they disappeared, and which ones are more likely to reappear. But it is more than just which vaccines to make next. We cannot fully understand what we need to do to prepare for the next big one until we fully comprehend the history of human immune experiences with the flu, influenza’s “antigenic history” (Ma et al., 2011, p. 30).
At the same time, we need to recognize that not everything we want to know about pandemic flu is knowable. Many mysteries remain, with core questions stubbornly refusing to yield answers. This article seeks to explore the history of flu, acknowledging what we cannot know, underscoring what we know, and hoping that we take away some lessons learned as we try to get ready for the next big one.
Understanding the Influenza Virus
Influenza is a virus, and viruses are notoriously difficult to define. There is a long-running debate in medical science over whether viruses are even alive. It is hard to find the correct phrase to describe viruses. Some use the term “organism” to describe viruses, but this begs the question. Organisms are things that are alive. Are viruses alive?
They are not capable of locomotion. They cannot move around; they just land where they land. What is agreed upon is that viruses are bits of genetic material that, if they reproduce, more of them will follow. Viruses are “obligate parasites”; without a host, they do nothing (Andiman, 2018, pp. xi, 24).
Viruses are both very old and astonishingly ubiquitous. Viruses date from 3–4 billion years ago, emerging at some point—this too is debated—either just before or just after the first bacteria appeared (Turner, 2019, p. 16). Other than rocks, viruses may be the oldest thing on the planet.
Viruses are much more prevalent than all life forms, more prevalent than bacteria, and much more prevalent than humans. In fact, viruses tolerate humans only insomuch as we provide a vessel in which they can reproduce. Human beings are themselves part-virus; a tenth to as much as a fifth of our DNA represents the leftover wreckage of past viral invasions (Turner, 2019, p. 19; Wasik & Turner, 2013, p. 521).
Viruses can be DNA or RNA in their genetic form; DNA viruses are much more stable than RNA viruses. There are fewer DNA viruses that cause human disease. Herpes, chickenpox, and smallpox are the most notable. But most deadly human viral diseases are caused by RNA viruses, in large part because RNA viruses are innately more unstable.
RNA viruses are unlike DNA viruses in that RNA viruses do not check their production of copies of themselves as they increase in population. By not looking for any errors in reproduction, countless mutations naturally emerge in RNA viruses. There can be an evolutionary advantage in this.
RNA viruses evolve faster than any life-form on the planet, with a mutation rate a thousand times to tens of thousands of times faster than DNA viruses. Influenza is an RNA virus, and among all RNA viruses, flu mutates the fastest of all (Barry, 2004, p. 105; Garmaroudi, 2007). The influenza virus mutates constantly.
Forms of the Influenza Virus
Within the influenza virus, there are four types: A, B, C, and D. Influenza D is found only in cows. Influenza viruses C and B are not ordinarily deadly to humans. Both influenza C and B are vastly older types of the virus, far more acclimated to humans. One hallmark of the evolution of any ancient virus is that it does not kill its host, for it is usually not beneficial to the virus’ reproduction to burn down its home. But if killing the host does not benefit the virus’ reproduction, it does not care if the host dies. Viruses have no feelings about this one way or the other.
Influenza C and B only affect humans; neither has an animal reservoir. Influenza C is rare, while influenza B is, in some places, the main type of flu circulating. It is the dominant type in Vietnam for example (Dinerstein, 2018; Garmaroudi, 2007; Reicherte al., 2012, p.4; Simonsen et al., 1998, p. 53).
Influenza A, the only type with human pandemic potential, comes in a variety of subtypes. These subtypes are identified by the external spikes that the virus uses either for linking to cells or for subsequently leaving the cells it invaded. The virus spikes come in proteins labeled “H” (for hemagglutinin) and “N” (for neuraminidase).
Each round virion (the name used for a virus when it is outside a cell, pronounced VEE ree uhn) has about 500 spikes sticking out of it. The H is the initial docking part, while the N is for helping with virion release from the cell later. There are 18 H subtypes and 11 N subtypes, creating the potential of 198 influenza virus subtype possibilities (Saunders-Hastings & Krewski, 2016, p. 2).
Only the flu subtypes H1, H2, H3, and N1 and N2, coming in different combinations of Hs and Ns, are known to cause flu that can spread between humans. Other H and N’s can infect humans, coming straight from aquatic or domesticated birds, but these subtypes almost never make a continuing jump from human to human (Brown, 2018, p. 38).
There are many more types of flu found in birds than in humans or other mammals. Flu’s original home is in wild birds—shore birds, and waterfowl—invading their gastrointestinal systems, but not causing serious illness, indicating a far more ancient heritage in these avian hosts (Barry, 2004, p. 102; Cox & Subbarao, 2000, p. 408; Monto & Webster, 2013, p. 29; Taubenberger et al., 2019, p. 4).
The influenza virus enters waterfowl digestive tracts by the way of droppings from infected migrating birds, geese, or ducks. When these birds defecate into the water, they excrete virus. The virus can stay viable in the pools of water for weeks, ready to be slurped up and enter another bird’s digestive tract.
Mammals are different. Pigs make the best home for influenza, for, in pigs, the virus can dock either in the digestive tract or the respiratory system. This means that flu from birds or from mammals, or both, can readily infect pigs (Cox & Subbarao, 2000, p. 408; Dehner, 2012, p. 26).
For humans, nearly always only the respiratory system is available for initial flu infection. The virus cannot dock elsewhere. Humans can easily get the flu from pigs, but usually not directly from birds. One significant consequence of this is that when humans rarely do contract influenza from birds, it typically is not a type of virus that can spread thereafter from human to human. If it jumps directly from a bird to a human, the flu virus will nearly always stop there with just that one unfortunate human. Or at least, this has almost always been the case, so far.
Given the importance of pigs in flu transmission, the pigs’ special openness to receiving and sending flu infections, influenza could only have become a significant human disease in humans after pigs had been domesticated. The domestication of pigs was a gradual process, beginning in East Asia as early as 9000 BC and continuing to around 5000 BC.
For influenza to make the jump into humans, domesticated hogs would have likely needed to live near defecating ducks and geese. These waterfowls have never been fully domesticated, only gradually coaxed over thousands of years toward their present state of semi-domestication. For influenza to maintain a chain of infection in humans, a critical mass of farming people needed to live around domesticated pigs and semi-domesticated ducks, and/or geese. When these conditions were met, flu in humans had arrived.
Beyond pigs, it is possible that later, in the days before automobiles, horses too could have figured in influenza virus contagion into humans. When most land travel involved horses, the horses may have played a role in the emergence of flu pandemics in humans. Just like pigs, horses may have been a flu host that could spread the disease to humans (Dehner, 2012, p. 37; Morens & Taubenberger, 2012, pp. 266–267).
When influenza jumps to pigs (and perhaps to horses) and from there, to humans, the dominant viral form can change rapidly (Taubenberger et al., 2019, p. 4). The mutation rate for the virus is always the same no matter the host, but because humans are a more unusual host for the virus, some mutations will out-compete others in replication. In humans, mutant forms of the virus may be more rewarded with reproduction, whereas in birds, the mutant forms have no advantage. The relationship between birds and flu is an old one; what versions of flu will do best in birds was sorted out long ago. So while flu mutations in birds have no reproduction advantage, flu mutations in humans may have large reproduction advantages. Flu in humans mutates fast.
Influenza Etiology
For humans, flu is solely airborne (it must be inhaled to cause illness). The virus spreads after being launched into the air, expelled by an infected person sneezing, coughing, or even just from a loud talker (Cox & Subbarao, 2000, p. 411). Flu is nearly always an infection of the upper respiratory tract in humans, almost never involving the deeper respiratory tract (Brown, 2018, p. 93; Garmaroudi, 2007; Taubenberger et al., 2019, p. 9).
About four hours after infection, the flu virus is already busy making copies of itself and blasting them back out into their host. It takes 2–3 days for the flu to cause disease illness, although not all those infected will manifest symptoms.
A flu sufferer’s symptoms typically include a runny nose, sore throat, chills, fever, achiness, coughing, and sometimes, in children, vomiting. The prolific sneezing and coughing bouts provide a good service to the virus, helping it get out and find new hosts to infect and reproduce in. A person becomes most infectious a couple of days after infection, and usually continues to shed virus for another 6 days or so (Brown, 2018, pp. 83, 99; Garmaroudi, 2007).
The flu is nearly always self-limiting, resolving within 10 days. But, while most people who get the flu recover, the trouble is that so many people get it. Of these, a small percentage will die, not usually directly from the flu itself but from some other complication that the flu helped to cause. Pneumonia and other opportunistic lung infections are the main causes of death after a flu infection. Strokes and heart attacks rise sharply in the elderly following a serious bout of influenza. Flu is the most dangerous for the elderly, for as they age, people gradually lose vigor in their immune systems (Barry, 2004, p. 102; Dehner, 2012, p. 12).
Flu also preys on infants, the underdeveloped immune systems of children under 2 years of age making them especially vulnerable. The one age grouping that does very well against flu is people aged four through 13 years. Children of this age tend to stand up tough against most infections, the period in human growth when the immune system is the most robust (Ahmed et al., 2007, p. 1188).
When flu erupts in a community, it usually lasts about a month and a half, and nearly never more than two and a half months. The virus stops replicating when there is no longer sufficient number of non-immune humans to infect, severing the chain of infection (Cox & Subbarao, 2000, p. 411; Morens & Taubenberger, 2012, p. 265).
Flu Shift and Drift
The common view among most, if not all, flu researchers is that human influenza pandemics are only caused by flu virus subtype “shifts.” This shift has always been in the “H,” that is, for example, from H1 to H2, or from H2 to H3. A shift means that no one will have immunity to the new H subtype unless they had it previously at some prior point in their lives. It is this “H” shift that causes pandemics (Potter, 2001, pp. 572–573).
A shift only happens when there is a spillover event, from a waterfowl or a domesticated bird, or both, into a pig; then mixed, or “resorted,” inside the pig. This occurs when two or more influenza subtypes, coming from birds, pigs (or perhaps horses), and sometimes humans, are all infecting the exact same pig cell at the very same moment, combining them into something new. Most of these two- or three-part combination mutations are not viable, failing to enter and reproduce in another cell. But with endless mutations being churned out at random, sometimes one can come out with just the right formula to enjoy reproduction advantages. If a virus can reproduce, it will (Garmaroudi, 2007; Wang & Palese, 2013, p. 2218).
When a new subtype of influenza appears after a shift event, then a few years after the initial pandemic eruption the new subtype will eventually quiet down, settling back to circulate as a seasonal flu. With each passing year, as more people are exposed to this flu subtype, more people will have some level of acquired immunity to it. However, because older people do not respond as robustly to new lessons being offered to their aging immune systems, the flu is deadlier for them. With each passing year after a flu shift, the percentage of deaths from the subtype will move toward the older age brackets.
If this subtype is subsequently replaced by another circulating subtype, then this new subtype, after itself causing a pandemic, will likewise usually become a seasonally circulating flu. If the previously circulating subtype then reappears again later, that is, if it “recycles,” those with prior experience with this earlier subtype will enjoy some level of protection against the recycled subtype. The protection is the best if the prior subtype was the very first version of the flu that a person encountered, “imprinted” in the immune system at an early age (Simonsen et al., 1998, p. 59).
For much of the twentieth century, medical scientists held that it was impossible for more than one influenza A subtype to circulate at a time. However, this supposition was shown to be false in 1977, the year that H1N1 joined H3N2 in the global seasonal flu circulation. Still, prior to that, whenever a genetic shift occurred, the new subtype completely replaced the prior one. This happened in 1918 (H1N1), in 1957 (H2N2), and in 1968 (H3N2) (Cox & Subbarao, 2000, p. 418). Until 1977, only one subtype circulated at a time. Now it is two.
Influenza subtypes “drift,” mutations that account for the annually appearing seasonal flu. As an unstable RNA virus, influenza is constantly changing its outward presentation, coming in response to gradually building human herd immunity that can block viral reproduction. This drifting is what makes repeat infection with the flu, year after year, such a live possibility. Any of the major flu subtypes that are known to have previously attacked humans in pandemics, H1N1, H2N2, or H3N2, drifted in genetic make-up as it passed through the human population. Drift can come within a single winter flu season, but even more drift comes between the annual seasons (Brown, 2018, p. 40; Palese & Wang, 2011, p. 1; Potter, 2001, p. 572).
One key aspect of pandemic influenza is that during the outbreaks in 1918 (subtype H1N1),1957 (H2N2), and 1968 (H3N2), older people were not as adversely impacted as might otherwise have been expected from an ordinary seasonal flu. The lower-than-expected number of deaths among the elderly during a pandemic is a phenomenon known as “senior sparing.” Most researchers have concluded that the sparing of older people during pandemic flu outbreaks is due to a prior exposure to the same subtype, a subtype that was washed away during a subsequent pandemic (Taubenberger & Morens, 2006, p. 76).
Pandemic Influenza History
It is hard to be certain about past flu pandemics in human history. The flu is very hard to diagnose even today: the symptoms’ presentation resemble too many other common respiratory ailments. There are many people infected with the flu who have few symptoms. Flu fatalities are likewise hard to count. Flu deaths are often listed as deaths from pneumonia or non-specific respiratory diseases. Sometimes flu victims die from existing preconditions that were exacerbated by flu.
But if it is hard to be certain about flu cases and flu-related deaths now, it is even more of a challenge to look back into history and try to figure out which pandemics were flu, and which were maybe something else. Before the modern age, sickness and death were much more ever-present. Life expectancies were much shorter. In this context, flu would have often escaped notice; it would have been hard to see that more people than usual had bad coughs, or that more people were dying than usual. Only the most alarming disease events would have been drawn attention and written down somewhere for future historians to spot in the archival records. Still, the bits of evidence here and there provide enough information to draw some conclusions.
Major flu outbreaks in the human population have doubtless been around since domesticated hogs lived near semi-domesticated ducks, but the first-recorded outbreak of what was likely flu comes from Greece in 412
More appearances of what was likely to have been flu followed. Scholars have suggested the dates of 876–877, 927, 1173, 1323, and 1386–1387 as possible prior influenza pandemics. A particularly strong candidate for flu was a 1493 epidemic on Columbus’ second voyage to the Caribbean. The six sick hogs that disembarked on the island of Hispaniola that year are a very convincing bit of evidence. Another very likely instance, mentioned by most scholars working on the history of flu, was the 1510 outbreak of a flu pandemic in Africa and Europe (but not the Americas). There may have been another flu pandemic in 1557 (Cunha, 2004, p. 144; Morens & Taubenberger, 2012, p. 264).
Most historical scholars of influenza agree that the 1580 outbreak, starting in Asia and hitting especially hard in Spanish-American cities, was the first near-certain flu pandemic. In the seventeen century, there may also have been flu pandemics in 1658 and 1688 (Barry, 2004, p. 113; Dehner, 2012, p. 42; Morens et al., 2010, p. 1442; Potter, 2001, p. 574; Saunders-Hastings & Krewski, 2016, p. 3; Tognotti, 2009, p. 331).
For the eighteenth century, there appears to have been two major flu pandemics. In the years 1729–1733, flu spread in Russia. Then in 1781–1782, flu swept across China, Russia, and into Rome (Dehner, 2012, p. 43; Potter, 2001, p. 575; Saunders-Hastings & Krewski, 2016, p. 3).
Several major flu pandemics occurred in the nineteenth century. Some sort of global outbreak occurred in 1801, and this might have been flu. The 1830–1833 flu pandemic, which appears to have started in China, before spreading over much of the world (although perhaps not into South America), was probably the worst flu pandemic in the world until the 1918 pandemic. Other dates for suggested flu pandemics in the 1800s include 1833–1837 and 1841. The 1847–1848 flu pandemic was a major event in the western world, followed by possible flu pandemics 1857 and 1874.
All in all, medical history scholars variously count at least 12 major influenza pandemics since 1500. By the late-nineteenth century, advancing speeds of transportation, especially steamship travel, made it much more likely for localized flu epidemics outbreaks to spread globally, becoming pandemics (Cunha, 2004, p. 148; Dehner, 2012, p. 45; Eyler, 2010, p. 28; Morens & Taubenberger, 2012, p. 265; Morens et al., 2013, p. 2347; Nickol & Kindrachuk, 2019, p. 2; Potter, 2001, p. 575; Saunders-Hastings & Krewski, 2016, p. 3; Taubenberger & Morens, 2006, p. 70; 2013, p. 3; Tognotti, 2009, p. 331; Wang & Palese, 2013, p. 218).
The “Russian” Flu 1889–1894
In the late summer of 1889, a deadly flu appeared, with the first major outbreak in St. Petersburg in October and November. Within four months, the flu had spread around the globe. The estimates for the case fatality rate for the pandemic suggest that it was not especially deadly; at around 0.08%, the case fatality rate was about at the level of a seasonal flu. But by the time the pandemic had passed in 1894, it had killed an estimated 300,000 people. Because it was first reported in Russia, it came to be called the “Russian” flu (Barro et al., 2020, pp. 2, 5; Dehner, 2012, p. 55; Ramiro et al., 2018, p.267; Simonsen et al., 2011, p. 82; Valleron et al., 2010, p. 8778; Valtat et al., 2011, p. B7).
The “Russian” influenza of 1889–1894 poses a key question regarding flu history. For us to understand more about the threat from pandemic influenza, it would be enormously helpful to know what subtype the “Russian” flu was. The trouble is that this is difficult to determine.
Unlike the 1918 flu, or with the flu pandemics of 1957 and 1968, for the 1889–1894 “Russian” flu pandemic, we do not have preserved human tissue to examine, and therefore no remaining bits of the virus to study. Without such materials to scrutinize, we cannot undertake any archeo-epidemiology studies for the 1889–1894 pandemic. We also cannot use blood serum drawn from people today to search for “Russian” flu antibodies in their systems, for no one alive before 1889 is still with us today. However, we know the identity of the flu subtypes for the pandemics of the twentieth century, and working from this, we can draw some inferences about the identity of the 1889 “Russian” flu. From this we can reflect upon the long-term implications for future preparedness (Morens & Taubenberger, 2012, p. 262).
Research breakthroughs in 1932 and 1933 allowed scientists to correctly identify flu subtypes. With the power of electron microscopes, medical researchers could see the virus for the first time. When pandemic flu arrived in 1957, medical researchers could see that it was a new subtype, H2N2. In 1968, epidemiologists could quickly ascertain that they were dealing with a new pandemic subtype, H3N2.
Correctly identifying the source of the 1918 influenza was more of a problem. Scientists had been trying since 1951 to isolate the virus from exhumed human remains from the Alaskan permafrost, working with the bodies of those who had died in the 1918 pandemic. In their frozen and preserved tissue, it was hoped, they could find bits of the 1918 virus and correctly identify its subtype. These efforts, however, were not successful at first. In the 1980s, researchers began to study human tissue from the 1918 pandemic preserved in wax and housed in medical libraries in the USA and the UK. Then, finally, in the 1990s, researchers succeeded in isolating 1918 virus from excavated frozen human remains. This progress in scientific research has allowed for some positive influenza subtype identifications: the 1918 subtype was H1N1, 1957 was H2N2, and 1968 was H3N2 (Brown, 2018, pp. 86–87; Morens & Taubenberger, 2018a, p. 2285; Taubenberger et al., 2019, p. 3). So what then was the 1889 subtype?
A Brief History of Influenza Subtypes
Flu science strongly suggests that a person’s prior experience with a subtype can offer at least some level of protection against the same subtype if it reappears later in their life. Long-term protection is especially strong against the first subtype that one encounters in childhood (“childhood imprinting”). But because flu subtypes drift gradually after the year of their pandemic-inducing arrival, changing into seasonal flu, the protection a person receives from prior exposure to a subtype is by no means complete. The protection against the subtype will fade as the virus subtype churns and drifts.
Still, population cohorts with some prior experience with a flu subtype will suffer less—fewer cases, fewer deaths—than otherwise would have been expected if this subtype recycles, reappearing as a pandemic. In this protection, it is nearly always the H spike and not usually the N spike that provides the human immune system the subtype experience that accounts for senior sparing in pandemics.
To investigate this problem, few points regarding flu subtypes need to be explained. (Please consult Figure 1 “Pandemic and Circulating Influenza.”)
Pandemic and Circulating Influenza
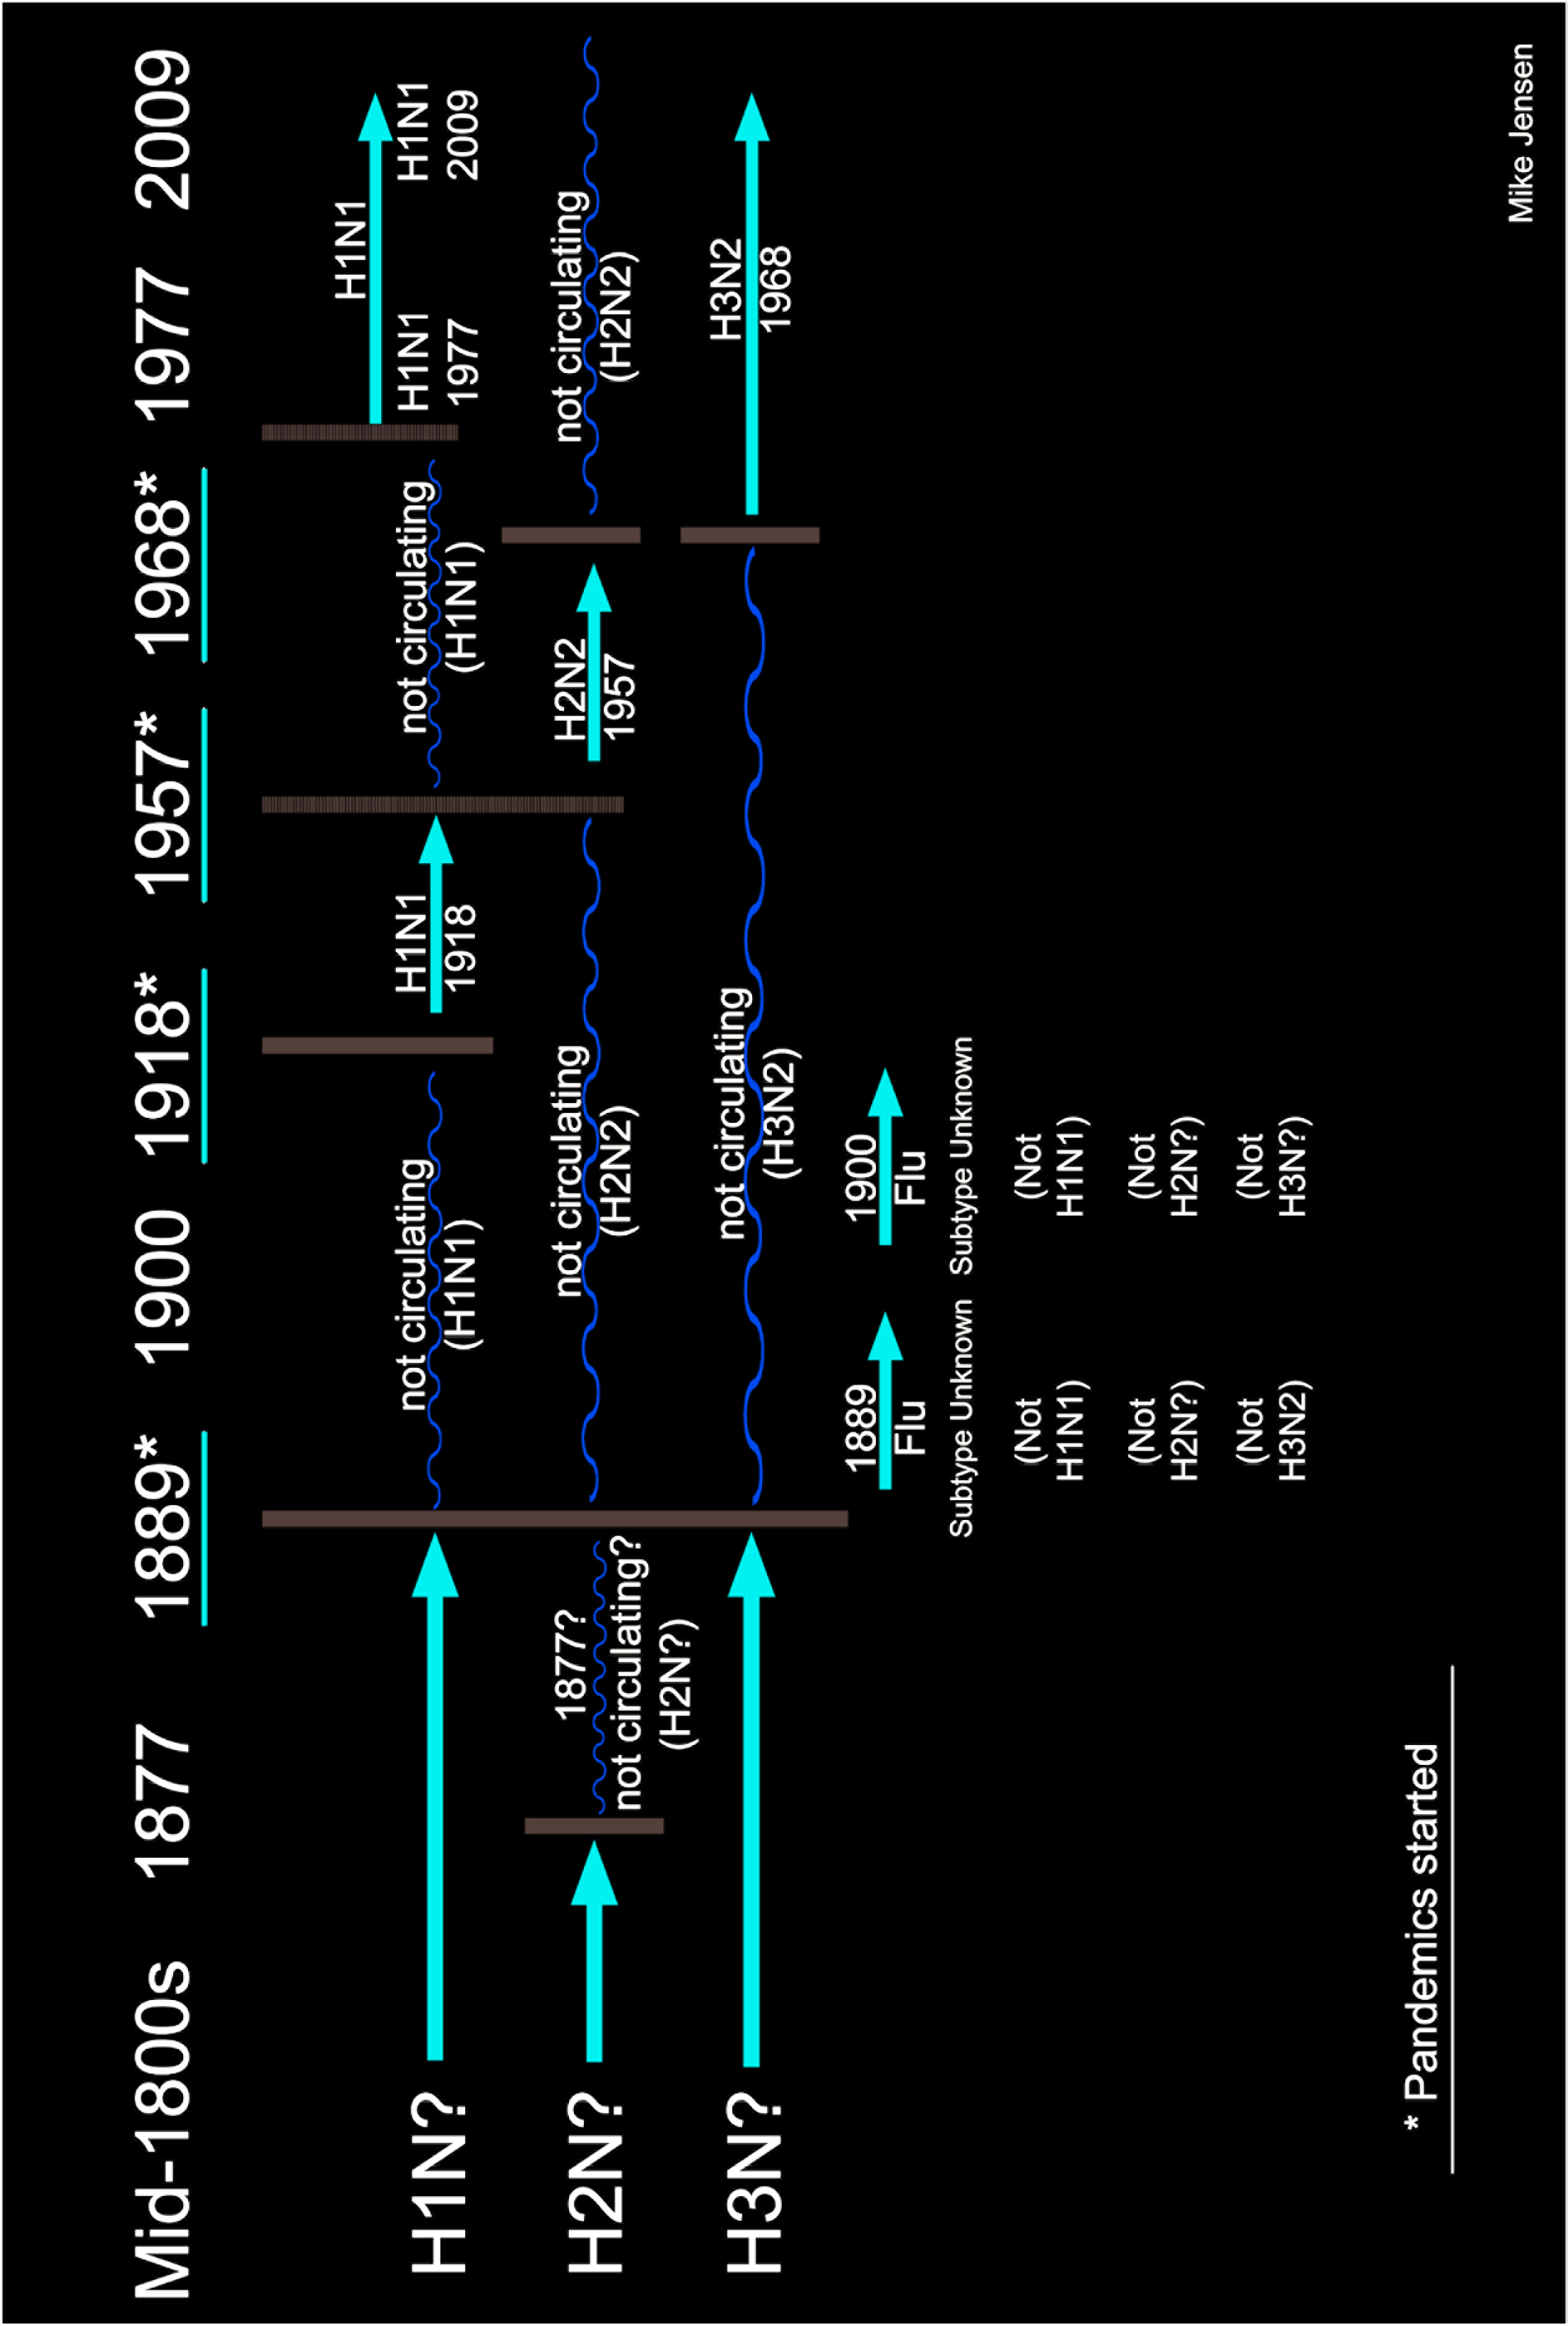
Usually one subtype at a time
One general principle of flu science is that it is usually the case that only one subtype of influenza A circulates at a time. Most medical researchers agree that all flu pandemics are triggered by the appearance, or reappearance, of a flu subtype that was not currently circulating. We know only of pandemics caused by H1, H2, and H3 subtypes. We know for certain that the subtype of flu that killed so many in 1918 was H1N1.
It follows that H1N1 could not have been the circulating subtype at the time that the pandemic appeared in 1918.
Senior sparing
We also know that seasonal flu kills the very young (younger than two years old), and even more so, the very old. However, the 1918 pandemic was unique in that young adults were the most affected. During the 1918 pandemic, those aged 20–40 years were the age group which was the hardest hit. However, in 1918, those people aged around 60 years and older were largely spared, “senior sparing.” The elderly are the age cohort that ordinarily, during a seasonal flu, are the most adversely impacted.
Something was sparing seniors in the 1918 pandemic.
In 1918, senior sparing started to lower death rates beginning at age 30
Something remarkable appears in the data when we look more closely at the details of deaths by age bracket during the 1918–1921 pandemic. The data shows that suddenly, at right around age 30, death rates drop off. To be sure, younger adults past the age of 30 suffered disproportionately in the 1918 pandemic. But right around age 30, the steady climb in death rate abruptly drops, falling off sharply. In 1918, those aged 30–40 and above, while still greatly impacted, suffered less deaths, comparatively, than those under age 30.
Something remarkable happened in death rates beginning at around the age 30 in the 1918 pandemic.
1889 was the critical year
For the flu pandemic of 1918, there was a very significant difference between being born before 1889 and being born after 1889. In 1918, there was exceptional senior sparing, and the first effects of the sparing kicked in right about at age 30. This is clear in data for the USA, and it shows up wherever age-specific data is available, everywhere in the world (Ahmed et al., 2007, pp. 1188–1893; Chowell et al., 2010, p. 571; Gagnon et al., 2013, pp. 1–2).
The “Russian” flu year of 1889 marks a critical watershed in pandemic flu history.
In 1918, the H1N1 influenza replaced a different flu subtype
As we have seen then, for the 1918 pandemic, the number of deaths per 1,000 by age group begins to drop suddenly at right around the age of 30. Thirty years prior to 1918 was 1888, the year before the “Russian” flu began in 1889. In 1889, it is therefore safe to assume, some H1 subtype stopped circulating, replaced by a different subtype. People each year older than 30 years in 1918 had spent more years being exposed to some form of the H1 subtype circulating until it was replaced in 1889. For those around 30 years old or more in 1918, the older an individual was, the better the chances that they had had prior exposure to a previously circulating H1 that stopped circulating in 1887.
People older than 30 years in 1918 had seen the H1 before.
Childhood imprinting protected those born before 1889
It is also likely that with older groups, their childhood imprinting with a H1 subtype could have been with one that more closely matched the version that recycled in 1918. This would explain why in 1918 each year older past age 30 brought a greater and greater chance of survival, except, however, for the very elderly, whose immune systems no longer functioned as well.
Those older than 30 years in 1918 were likely to have the correct childhood imprinting experience with a H1 subtype.
Using information from the 1957 and the 1968 pandemics
Other information regarding senior sparing bears on trying to determine the identity of the 1889 flu. We know that the 1957 pandemic was a shift to the subtype H2N2, and that the 1968 pandemic was another shift, this time to subtype H3N2. We also know that each of these pandemics showed senior sparing, but, significantly, starting at much older age brackets.
Senior sparing shows up in the data for the 1957 and 1968 pandemics.
H2 circulated before 1877
During the 1957 “Asian” H2N2 flu pandemic, senior sparing occurred mostly among the very elderly, those aged 80 years and older. A key source of information that bears on this is what might be called “serologic archeology,” that is, looking at the flu antibodies present in older people. Researcher J. Mulder’s study of the impact of the “Asian” flu pandemic in the Netherlands in 1957 found that only those born before 1877, those people 80-years-old and older in 1957, showed antibodies to H2 flu of that year (Mulder, 1957, p. 334). Antibodies to H2 for people in this age group were also found in the studies conducted in Italy (Mulder & Musurel, 1958, p. 811). In 1967, researchers Robert E. Serfling, Ida L. Sherman, and William J. Houseworth, likewise noted senior sparing in the 1957 epidemic, finding the protected age bracket to be those aged 80 years or older (Serfling al., 1967, p. 438). In 1973, epidemiologists Nic Masurel and William M. Marine came to similar conclusions, finding pre-existing antibodies to H2 andH3 in people born before 1877.
1877 was a watershed year for H2. It stopped circulating that year.
H3 circulated to 1889, but H2 stopped circulating in 1877
Masurel and Marine, focusing on the 1877–1889 cohort (people born after 1877 but before the 1889 “Russian” flu), found only pre-existing antibodies to H3, but not to H2. H3 antibodies ran straight through to the time of the “Russian” flu, whereas H2 antibodies ended in 1877 (Masurel & Marine, 1973, pp. 44–45). Researchers, Stephen C. Schoenbaum, Marion T. Coleman, Walter R. Dowdle, and Stephen R. Mostow, writing in 1976, similarly found H2 antibodies in those born before 1878, but not in those born between 1878 and 1891. Researchers, Reichert, Chowell, and McCullers, writing in 2012, reported the same conclusion. In 1957, those born 80 years earlier or before (1877 and before) were spared in the pandemic of H2N2 in 1957 (Reichert et al., 2012, p.4).
H2 stopped circulating in 1877.
H2 co-circulated with H1 until 1877
From this, we can conclude that some H2 subtype was circulating until 1877, co-circulating with H1N1 until that year (Schoenbaum et al., 1976, p. 170).
H1 and H2 co-circulated.
H3 co-circulated with H1 to 1899
Findings for the 1968 “Hong Kong” flu, H3N2, add to our understanding. Stepen C. Schoenbaum et al, writing in 1976, reported that during the 1968 H3N2 “Hong Kong” flu pandemic, those born before 1890 enjoyed considerable immunity. In a long-term blood serum study from a California retirement community, researchers found that nearly all residents who were born before 1890 showed antibodies to H3, whereas those born after 1889 showed no antibodies to H3 (Schoenbaum et al., 1976, p. 166). Researchers Tom Reichert, Gerardo Chowell, and Jonathan A. McMullers found the same pattern of senior sparing for the 1968 H3N2 pandemic (Reichert et al., 2012, p. 9). Researchers Mark A. Miller, Cecile Viboud, Marta Balinska, and Lone Simonsen, writing in 2009, also identified the same pattern of senior sparing in the 1968 pandemic: those about 80 years old and older were spared. In the 1968 pandemic, the very elderly had some protection because they had seen a H3 before in their childhood (Dowdle, 2006, p. 35; Miller et al., 2009, p. 2595).
H3 stopped circulating in 1889.
The Remaining Puzzles Regarding the “Russian” Flu
What all these studies show is that before the “Russian” flu of 1889–1894, some subtype of influenza H3 had to be circulating along with the H1 subtype that was also circulating. In addition, some H2 subtype would have been circulating until 1877, along with some H1 subtype. This also means that the H3 subtype replaced a H2 subtype in 1877. However, no scholar has suggested 1877 as a pandemic year. Why 1877 seems such a pivotal year cannot be explained by science or existing evidence.
There was no senior sparing noticed in the 1889 pandemic, so whatever subtype it might have been, it was something that people alive then had not previously experienced. No one had any immune experience that served to protect them. The “Russian” flu, of unidentified subtype, could have circulated, some researchers suggest, until the epidemic year of 1900, or else right down to the 1918 pandemic, when whatever may have been circulating before was clearly replaced by H1N1 in the great pandemic (Cunha, 2004, p. 148; Ramiro et al., 2018, p. 270).
One problem with this proposed explanation of the historical flu subtypes and the identity of the 1889 flu pandemic is that it would mean that more than one subtype of flu circulated at a time in the nineteenth century. A possible explanation of this could be that all three subtypes (H1, H2, and H3) were circulating in ebbs and flows in the late nineteenth century, until the 1889 pandemic came along and washed them all away. Perhaps, as travel times quickened in the late nineteenth century, the flu finally became global after the 1889 “Russian” flu pandemic.
Some researchers have concluded that we cannot know what subtype the “Russian” flu was, and that all attempts to solve this puzzle are merely “speculative” (Morens & Taubenberger, 2012, p. 333). Undaunted, others have suggested that the “Russian” flu was H3N8 or possibly H2N8, replacing the H2N2 or H3N2 (or both) that had been circulating before 1889. Others offer H3N2 as the best candidate for the 1889 pandemic (Ahmed et al., 2007, p. 1188; Dowdle, 2006, p. 37; Eyler, 2010, p. 28; Garmaroudi, 2007; Márquez Morfín & Molina del Villar, 2010, p.132; Morens & Taubenberger, 2018b, p. 1451; Nguyen-Van-Tam & Hampson, 2003, p. 1762; Saunders-Hastings & Krewski, 2016, p. 7; Tognotti, 2009, p. 331; Wang & Palese, 2013, p. 218; Valleron et al., 2010, p. 8778).
But as we have seen, the problem with all these educated guesses is that had the 1889 “Russian” flu been any H3 or H2 subtype, we could not then make sense of the specific senior sparing patterns by age bracket noted in the 1957 and 1968 pandemics. It seems more consistent with the evidence to conclude that the “Russian” flu of 1889 could not have been any subtype of H1, H2, or H3.
And that is the paradox. The 1889 pandemic should not have been any other subtype of flu other than H1, H2, or H3, for there are no other human subtypes of flu that we know of that can spread readily from human to human and can cause pandemics. So while the 1889 flu had to be an H1, H2, or H3, for we know of no other types that cause pandemics, it also cannot be any of these three subtypes given the age patterns for senior sparing we know to be true for 1918, 1957, and 1968. In the end, what cannot be true, seems that it also must be true.
Many questions remain, and the answers to these questions matter very much, for they bear greatly on our understanding of the influenza virus and should inform how we prepare for the next great flu pandemic. Our decisions on how to best protect ourselves depends upon understanding what happened before.
The problem of correct historical identification of the 1889 “Russian” flu will continue to be debated, approached intellectually in several ways. One approach would be to re-scrutinize the evidence of senior sparing and see if we could just make the evidence go away. The trouble with this is that the phenomenon of senior sparing is just too plainly expressed in all the evidence for all three pandemic events, 1918, 1957, and 1968.
In the alternative, we could attack the scientific principle of prior exposure to a specific H subtype granting subsequent protection later in life. Here too, however, all the evidence works to reinforce the basic principle that prior exposure to an H subtype will provide protection against flu recycling if it shows up again later in one’s life as a pandemic.
Or finally, we could attack the “one flu subtype at a time” flu science principle. This line of argumentation might be the most promising. After all, two subtypes are circulating now, the H3N2 subtype since 1968, which was joined by H1N1 in circulation since 1977 (and modified in 2009). If it is happening now, then it is also possible that it was happening before: to 1877 H1N? and H2N?, and from 1877 to 1889 still H1N? and now H3N? too.
It could be that the period from 1889 to 1977, a time when only one flu subtype at a time was circulating (H1N1 from 1918 to 1957, H2N2 from 1957 to 1968, and then H3N2 from 1968 to 1977, when H1N1 rejoined it), was not just the way things always had to be, but was instead a historical aberration. If we set aside the “only one subtype at a time” principle and replace it with a “there can indeed be more than one flu subtype at a time circulating” proposition, then this would at least fit all the evidence before us.
Of course, that would still leave the mystery of what the “Russian” flu might have been. And, with this interpretive problem, we cannot even retreat to the reassuring bromide of “more research is needed,” for it looks far from certain that more research will ever answer this question. We may never know what the “Russian” flu was, just what it was not: not H1N1, not H2N2, and not H3N2. Whatever it was, it was swept away beginning in the spring of 1918.
The Great Influenza Pandemic of 1918–1921
Four global waves of influenza, 1918–1921, killed somewhere between 35 million to as many as 100 million people, or roughly 1.9% to as many as 5.5% of the entire world’s population of 1.9 billion people at the time. At least half of all global flu deaths during the pandemic came just in a few months in the autumn of 1918. The pandemic preyed especially on those adults under age 30, killing nearly one in 10 of all young adults in the world. It was one of the worst pandemics ever, with only the Black Death claiming more lives (Beiner, 2006, p. 496; Barro et al., 2020, p. 2; Barry, 2004, p. 5; 2009, pp. 324–325; Morens & Taubenberger, 2018a, p. 2285; Nickol & Kindrachuk, 2019, p. 1; Taubenberger et al., 2019, p. 1).
For the USA, the estimates of the total deaths have ranged from 550,000 to 675,000 out of a population of 100 million, around 0.5% of the total national population. For the less developed world, the numbers are more hazy but it is clear enough that the overall death totals even worse. India probably suffered more deaths from the flu than any other place on earth during the pandemic, losing somewhere between 7 million to as many as 20 million lives from the flu. The most careful estimate places the total number of lives lost in India at 13.88 million. Out of a population of total population at the time of about 318 million, India lost from 2% to 6% of its total number to the pandemic (Barro et al., 2020, p. 5; Brown, 2018, p. 58; Chandra et al., 2012, p. 857; Potter, 2001, p. 576).
If global deaths from the 1918–1921 pandemic are difficult to exactly determine, it is even harder to estimate the total number of people who were infected. This is so because the symptoms identified are not specific to just influenza. Even more, there were countless others who became infected, but who barely noticed any symptoms. Many infected were completely asymptomatic.
The best estimates are that the 1918–1921 influenza pandemic probably infected around a third of the world’s population, although some researchers suggest that the number was higher, placing the amount infected at 40% (Barro et al., 2020, pp. 2, 5, 6; Barry, 2009, pp. 324–325; Loo & Gale, 2007, p. 267; Morens & Taubenberger, 2018a, p. 2285; Nickol & Kindrachuk, 2019, p. 5; Wang & Palese, 2013, p. 222).Without knowing precisely how many people were infected, case fatality rates (infected who die) are necessarily far from certain. Ordinary seasonal flu typically has a case fatality rate of around 0.1% or less. For the great flu pandemic of 1918–1921, researchers generally place the case fatality rate at 2.1–2.5%, but other estimates rise to as much as a 6% case fatality rate, worldwide (Barro et al., 2020, pp. 2, 5, 6; Barry, 2009, pp. 324–325; Loo & Gale, 2007, p. 267; Morens & Taubenberger, 2018a, p. 2285; Nickol & Kindrachuk, 2019, p. 5; Wang & Palese, 2013, p. 222).
Origins of the 1918 Pandemic
The pandemic came in four waves, starting first with a “herald” wave, a mild flu outbreak that appeared in the USA in early spring of 1918. It looked at the time like just a late-arriving seasonal flu. It was not.
There has long been speculation about where the pandemic started. In part, this could stem from the all-too-common human tendency to want to blame somebody else when things go wrong. For epidemic scapegoating, this somebody usually turns out to be people in a faraway and unloved land, or else the disease is blamed on unwelcome foreigners in one’s own country. It is for this reason that it is good practice to try to avoid naming future pandemics after the place where they were first noticed. Indeed, this old habit may today actually function to impede early reporting of pandemic outbreaks, lest the world comes to somehow blame them for it.
The consensus among researchers is that the pandemic likely began in Haskell County, Kansas (400 miles west of Kansas City). It was probably a blend of avian influenza that had recombined with a pig flu virus, or viruses, that then spilled over into nearby humans. The first major outbreak came at a military outpost at Camp Funston, in Fort Riley, Kansas (just over 130 miles west of Kansas City, Missouri). Camp Funston was a training facility for US forces being deployed to Europe in World War I.
From Camp Funston, the first wave of the flu moved on to other US military bases, hitting 24 for the 36 major facilities. Then the outbreak began to wane in the summer of 1918 (Barry, 2004, p. 169; Nickol & Kindrachuk, 2019, p. 4). The British Medical Journal declared that the pandemic was over (Brown, 2018, p. 49). It was not.
As summer turned to fall, a second wave of the flu began to show up on military camps across the USA. The dying commenced. This time, everyone quickly realized, it was not merely a mild seasonal flu. The flu spread with deadly speed aboard the troop transport vessels traveling to the European theater of war. One in five US soldiers died en route to the war. It infected and killed everywhere. Of the American forces in World War I, eight of every ten deaths came from the flu, not from combat (Garmaroudi, 2007; Márquez Morfín & Molina del Villar, 2010, p.125).
Autumn 1918 brought the full horror of the rush of death. One astonishing feature of the pandemic was its timing, for the second wave swept all over the world at roughly the same moment. It lasted from fall until well into February 1919. Only those who had gotten the flu in the mild first wave in the spring of 1918 were immune to the deadly fall wave of 1918. A third, less deadly, 1919 outbreak followed, and then a final, weaker, fourth wave came in 1920 into 1921, seen only in some places, in New York City, Mexico City, and in Taiwan (Alonso et al., 2011, p. 816; Barro et al., 2020, p. 2; Barry, 2009, pp. 324–325; Beiner, 2006, p. 497; Chowell et al., 2011, p. 1; Dehner, 2012, pp. 61, 64–65;Nickol & Kindrachuk, 2019, p. 4).
Ordinarily, the seasonal flu most impacts those under two years, infants with not-yet-fully-developed immune systems, and hits even harder those aged 70 or older, people whose immune systems are no longer as robust (Ahmed et al., 2007, p. 1188). But what was different about the 1918–1921 flu pandemic is that young adults (aged 20–40) suffered the most of all. This appears to be true in just about all locations for which we have information. For the USA and in Western Europe, where we have more historical documentation, the high mortality among young adults is clear. For the less-developed world, in the places where we have studies—Florianopolis, Brazil; Mexico City; in the department of Boyacá, Colombia; Perú; in Taiwan, among a few other locations—the findings are the same. The 1918–1921 pandemic preyed upon young adults (Alonso et al., 2011, p. 818; Chowell et al., 2010, p. 567; 2012, p. 51; 2020, p. 48; Hsieh, 2009, p. 1618).
Senior Sparing Patterns
In the USA and in Western Europe, as we have seen, older populations were clearly spared from the 1918 pandemic. However, this senior sparing during the 1918–1921 pandemic does not appear to have always been the case in all other parts of the world. In Brazil, Argentina, Perú, Colombia, Chile, and Uruguay, research has established that all population age cohorts seem to have been impacted, with seniors not being spared (Chowell et al., 2014, pp. 1803, 1809; Simonsen et al., 2011, p. 82).
For Latin America, these two age-specific mortality patterns noted for 1918–1921—the great vulnerability of young adults, and a widespread absence of senior sparing—raise interpretive problems. If throughout the region there was a lack of prior experience from flu, then the age pattern for mortality should have begun to rise at age 14 and just kept rising through each age cohort. The age-specific age graph should be a “V” shape, shooting ever upwards after age 14. This was certainly the pattern in the remote villages in Alaska, which had heretofore been passed over during prior flu pandemics.
But for Latin America, the deaths per age group suddenly stopped rising at around age 30. While mortality was still uncommonly high for adults 30–40 years across Latin America during the 1918–1921 pandemic, something remarkable showed up in the Latin American data beginning at around age 30, just as it does in the US and Western European flu death age bracket data. At 30 years old, for Latin America, excess mortality, and especially excess mortality from respiratory diseases, abruptly halted its climb and began to taper off, the graph showing a “W” shape instead of a “V” shape (Chowell et al., 2012, p. 51). This would strongly suggest that those people in Latin America who were about 30-years-old or older in 1918, that is, people who had been alive before the 1889 “Russian” flu, were being protected in 1918, and those born after the 1889 flu began to circulate were not protected.
Why this protection for the elderly seems to have waned in Latin American settings, but not in the USA and in Western Europe, is very curious. Perhaps, Latin America’s impoverished socio-economic conditions exacerbated this immune system weakening in the aged, resulting in less senior sparing.
Another possibility could have been the nature of the childhood imprinting experience in Latin America. As we have seen, the first flu that one experiences in their life imprints the immune system to best defend against that version of the flu. One’s immune response will be the strongest against the flu version first imprinted in childhood. Therefore, it could be that before the 1918–1921 pandemic, the older generations in Latin America were imprinted by a previously circulating version or subtype, whereas the middle-aged Latin American generations, especially those born right before 1889, were imprinted with a flu H1 subtype version that better protected them to the H1N1 in 1918.
This is a possible explanation for much of Latin America’s unusual age-specific death distribution during the 1918–1921 H1N1 pandemic. If this childhood imprinting explanation holds true, it would also follow that the seniors in the USA and Western Europe would have been more widely exposed and imprinted in the mid to late nineteenth century to a H1 flu subtype version that proved a better match to the 1918 pandemic. This reading is consistent with the available data (Gostic et al., 2019, pp. 1–3, 11).
In sum, two points are clear. First, for every place where we have data, the death rate per 1,000 in population, broken down by age bracket, abruptly halted its climb at right around age 30, that is, those born before the “Russian” flu of 1889. Second, senior sparing for the elderly was the most pronounced in the USA and Western Europe, which were more in steady intercommunication with other parts of the world in the second-half of the nineteenth century.
The Deadly Second Wave
The second wave of the flu starting in the fall of 1918 proved breathtakingly deadly, sometimes killing those infected within 24 hours, and occasionally even faster. In some cases, the symptoms could be particularly horrifying, including bleeding from the eyes and ears (Barry, 2009, p. 324; Beiner, 2006, p. 497; Nickol & Kindrachuk, 2019, p. 4).
Why the second wave in the fall of 1918 and into early 1919 was so much more deadly is not completely understood. Through all four of the global waves, 1918 into 1921, it does not appear that the virus mutated in any significant dimension, or at least in a greater disease-inducing way. Modern researchers have studied the make-up of the virus from the spring and the fall of 1918, looking under the microscope at frozen tissue and other specimen samples preserved from the time, but have found no genetic differences in the virus. There is no viral evidence that would account for the heightened virulence in the autumn.
It could be that during the second wave that many victims experienced a deadly over-reaction of their own immune systems. Young adults have, as a rule, stronger immune responses, and this could actually have served to make them more likely to die. Their immune systems seem to have launched such massive counterattacks to the invading virus and follow-on bacterial infections, ripping apart the disease cells that had invaded their lungs, that in the process of defeating the invaders so much debris-filled fluid filled up their lungs that many young people just drowned in the wreckage created by their own immune systems. This “cytokine storm” explanation is altogether possible, if not certain (Brown, 2018, p. 92; Morens & Taubenberger, 2018b, pp. 1449–1450).
Most victims of the 1918 flu pandemic died not directly of flu itself, but due to secondary bacterial infections, opportunistic invaders that colonized and spread in the wake of the viral attack. The damage to the lungs could be so severe that those infected were opened to bacterial infections that would otherwise have been just routinely marked and cleared by their immune systems. Some bacterial infections appeared right away, but most took many additional days or even weeks to take hold, sicken, and kill (Barry, 2004, pp. 153, 251; Morens & Taubenberger, 2018b, p. 1452).
An Uneven Catastrophe: Wiped Out or Passed Over
Where the population was completely epidemiologically naïve, the human death toll from the 1918–1921 pandemic could be stunning. In some remote stretches of Alaska, the flu pandemic killed as many as seven of every 10 people in indigenous communities. In a few of these Alaskan villages, every single adult died; only those aged 4–14 survived. (Children in this age bracket everywhere seem to enjoy strong protection against nearly all infections, the so-called “Goldilocks” period in immune system development in humans.) Some Alaskan towns became populated with nobody other than people aged 4–14 years, villages of children (Ahmed et al., 2007, p. 1191; Garmaroudi, 2007).
Very few places around the world managed to avoid the great flu pandemic entirely. One was American Samoa, completely defended by a quarantine imposed by the US Navy. However, the neighboring islands of Samoa (previously known as “Western Samoa”) were not spared. Unshielded by a US naval blockade, the virus arrived, killing more than one of five of those on the islands. Australia looked like it was going to be passed over, but in late December 1918, a troop ship came into port, bringing home some of their boys who had fought in the war. Influenza, lamentably, disembarked with them (Barry, 2004, p. 375; Flecknoe et al., 2018, p. 62; Jernigan & Cox, 2013, p. 6; Morens & Taubenberger, 2018b, p. 1452; Potter, 2001, p. 576).
While global study of the 1918–1921 flu is far from complete, for Latin America, we now have studies for at least a few regions. The findings add new dimensions to our understanding of the depth of human suffering, the nature of the influenza virus, and some potential lessons to learn.
Perú experienced three waves of flu, 1918–1920. First came a mild wave from July to September 1918, a bit later than in the USA. As was the case elsewhere, the second wave was the worst in Perú, coming from November 1918 to February 1919. For the capital city of Lima, however, the third wave, January through March in 1920, was the deadliest (Chowell et al., 2011, p. 1). In the Southern Hemisphere, the travel distance plus the inversion of the seasons likely explain why Perú leagged in infections and death. Perú was not spared, it just suffered somewhat later than countries in the Northern Hemisphere.
In Chile, the mild first wave of flu also arrived later, not starting until the autumn of 1918, lasting until February 1919. Deaths in Chile peaked during the third wave, July 1919 through February 1920. For Chile, then, the worst period began fully one year after the deadly second wave had washed over the Northern Hemisphere and lasted in Chile a good deal longer. Chile went through a fourth and final wave from June to December 1921 (Chowell et al., 2014, pp. 1803, 1806).
For Mexico, the flu arrived just as the bloody Mexican Revolution was ending. The mild first global wave missed the nation entirely, with the flu first starting to show up in Mexico only in October 1918. By the end of the month, however, some 2,000 people in Mexico were dying from flu every day. In four months, during the autumn of 1918, a total of 300,000 Mexicans died of flu. And then it just stopped. The flu pandemic ended in Mexico City by December 4, 1918, and had stopped all over Mexico by January 1919 (Márquez Morfín & Molina del Villar, 2010, pp.121, 122, 126, 127, 141; Saunders-Hastings & Krewski, 2016, p. 5).
While not all researchers agree, it seems that Mexico, like the USA and Western Europe, experienced at least some level of “senior sparing.” It could be that Mexico’s proximity to the USA meant that it had shared a common prior experience with the same flu epidemics in the mid- and late-nineteenth centuries. The overall death toll was much worse in Mexico than perhaps anywhere else in the Western Hemisphere. In Mexico, the flu killed somewhere around 21–36 people per 1,000 in population, while, by way of comparison, it killed five people per 1,000 in population in the USA and in the UK. Overall, the flu may have killed somewhere between 2.3% to 4% of Mexico’s total population, this coming right after the Mexican Revolution had killed 1.5 million, another 10% of the total population. These were the dark days in Mexico (Barry, 2004, p. 398; Márquez Morfín & Molina del Villar, 2010, p. 123; Patterson & Pyle, 1991, pp. 14–15).
The “Pfeiffer Bacillus”
During the pandemic, most health experts in the USA and the western world thought that the cause of the flu was bacterial, one they called the “Pfeiffer” bacillus. Medical researchers of that age knew about bacteria. They could see bacteria under a microscope. Since the breakthrough discoveries of bacteria in the 1860s and 1870s by Louis Pasteur and Robert Koch, medical researchers had correctly linked specific bacteria to 50 different diseases. Some medical authorities of the age had a few notions about potential smaller disease-causing entities, but these, they could not see and could not really study. When most doctors of this era thought about disease etiology, they thought about bacteria (Tognotti, 2003, p. 97, 106).
In the late-nineteenth century, Richard Friedrich Johannes Pfeiffer was one of the foremost medical authorities in the world. He had studied under the tutorship of Robert Koch. Pfeiffer had risen to the position of Director of Research at the Berlin Institute for Infectious Diseases.
When Pfeiffer announced in 1892 that he had discovered the bacteria that cause influenza, the world took notice. Pfeiffer’s bacteria became the accepted gospel of flu etiology. In 1918, this understanding remained the ossified dogma, representing what was widely seen as the most-learned view on the matter (Brown, 2018, p. 35; Eyler, 2010, p. 27; Tognotti, 2003, p. 103).
As the pandemic swept forward, medical lab researchers leapt into action, studying specimen samples from flu victims, hunting for the Pfeiffer bacillus. But, before long, many researchers reported trouble in finding the Pfeiffer’s bacillus in their samples. For a time, the defenders of medical orthodoxy explained this by attacking the work of the researchers who could not locate any Pfeiffer bacteria in their lab specimens. They must be in incompetent, they argued. If they had just looked properly, they would have found Pfeiffer bacteria. Those who failed to find it were obviously inferior researchers, old school experts explained.
But as the evidence piled up, some scientists began to wander away from the prevailing belief in Pfeiffer bacteria. Some younger medical scientists guessed correctly that the source of the flu had to be a virus, even if the concept of viruses had not been fully worked out (Tognotti, 2003, p. 105).
Medical research in 1918 and 1919 was naturally focused on the development of a vaccine. The only vaccines that came, however, were made to protect against the Pfeiffer bacteria. The anti-Pfeiffer bacteria vaccines that were developed, coming in many formats, were subsequently deployed, especially on army bases where individual consent to particulate in an inoculation trial was not required. However, there was no consensus amongst researchers as to how to measure the success or failure of the vaccines that they came up with. They published their findings anyway; the scientific and medical journals of the day were not yet peer-reviewed. Most studies claimed that their vaccine against flu bacteria was a triumphant success (Eyler, 2010, pp. 27, 31, 33).
Oddly, it is possible that the vaccine developed against “bacterial flu” may have helped save some lives. Because most of those who succumbed to the 1918 flu died from opportunistic bacterial infections, it could be that the anti-bacterial vaccine, in the few that got it, might have helped protect them against bacterial pneumonia, or at least from some of the various follow-on bacterial pneumonia infections that came in the wake of a bout with the flu.
Recent investigations into the vaccine efficacy data from the time shows that the vaccines may have saved the lives of at least 4 out of 10 to as many as 7 out of every 10 people vaccinated. Each vaccine, it seems, was constructed from bacteria circulating near the lab making it, and this may have served to help best match the vaccine to local bacterial threats, the greatest threats in each locale. The vaccines were unique to each separate place, and this may have functioned to make them more effective. Still, the vaccines, whatever inadvertent success they may have had, clearly had a hit-or-miss quality. The vaccine did not hit what it was aiming at, but it seems to have hit something, and in doing so, appears to have helped many of the soldiers who got the shot (Chien et al., 2010, pp. 1639, 1645; Morens & Taubenberger, 2012, p. 332).
Try Something
Mostly, medical science failed the challenge of the 1918 great flu pandemic. Baffled, some doctors decided that they must be looking at some form of the Black Death, a pneumonic plague. Unsure of what was causing the disease, doctors, researchers, and enterprising salespeople cooked up an astonishing array of serums and antitoxins and then dispensed them to paying customers. None of these nostrums had any positive effect (Dehner, 2012, p. 65; Tognotti, 2003, p. 100)
One common treatment passed out to the suffering was just common aspirin. Nowadays, these pills are usually harmless enough, but at the time, medical professionals had no real understanding of how much aspirin to prescribe. Some doctors gave their patients too much aspirin, in fact, in some cases, fatal doses of aspirin. Indeed, aspirin overdoses in 1918 may have been a significant contributor to overall fatalities during the pandemic. In the event, rumors spread that the US enemy in the war, Germany, where Bayer aspirin was made, was causing the pandemic (Barry, 2004, p. 343; Brown, 2018, pp. 5, 13). This story, of course, was false.
Quinine was another drug of choice to treat flu. It did nothing to help. In fact, if given in large doses, quinine can cause serious adverse reactions. Another option was garlic. This did no good, but it at least did no harm. Some offered their belief that smoking killed influenza germs. Ads for cigarettes to protect against flu infection competed with snake oil remedies, pushing for space in the newspapers (Brown, 2018, p. 15; Tognotti, 2003, p. 106).
If all else failed, some older doctors turned to the one go-to medical treatment of the just prior age: bloodletting. Medical journals in the USA in the period still provided detailed instructions on when and how to treat patients with bloodletting. Well-schooled physicians consulted their manuals and bled their patients (Brown, 2018, pp. 11–12).
But no one anywhere did any better. When the pandemic arrived in Mexico, local notables gathered everyone together for a charity bull fight to raise money to combat the pandemic. The pandemic advanced anyway, so Mexican authorities started a campaign to fumigate homes. Mexican health officials recommended that people wash their hands with harsh cleansers and rinse out their noses with boric acid (Márquez Morfín & Molina del Villar, 2010, pp. 136–137).
Garlic, quinine, aspirin, leeches, boric acid, there was just not much yet that medicine could do to help in these years. In the early-twentieth century, there was a diphtheria antitoxin that was widely available and worked well. By the 1920s, doctors could offer a tetanus antitoxin, and by the late-1930s, a tetanus vaccine (Barry, 2004, pp. 71, 93). By far the best thing that medicine could do in 1918 was to try nothing aggressive. It helped to provide nursing care, making sure those hospitalized had enough to drink and eat, and that they could rest. If a patient could get this care, while avoiding cigarettes, bloodletting, or aspirin overdoses, then they might survive their doctor’s attentions (Barry, 2004, p. 319).
Some non-medical interventions worked. Even in 1918, public health authorities understood the benefit of social distancing. In the USA, health officials in Philadelphia experienced their first-reported cases on September 17, but did not put in place social distancing measures until October 3. A great death toll resulted in Philadelphia. Seeing this, other cities acted more promptly. St. Louis saw their first flu cases on October 5, and by October 7, had closed the most common gathering venues (Brown, 2018, pp. 53–54; Tomes, 2010; Smith, 2007, p. 1341). Perhaps going second allowed St. Louis to learn from Philadelphia’s mistakes.
For medical scientists, the main lesson they seem to have taken from the 1918 pandemic was that the best plan of action was to try to change the subject. Doctors and medical authorities had failed to halt the pandemic. They just found the whole topic to be uncomfortable. They preferred stories where doctors and medical researchers were heroes, and in this one, they had failed utterly. No one wanted to discuss it. In this way, the 1918 influenza became, in the notable phrase of historian Alfred W. Crosby, the “forgotten” pandemic.
Legacies
Five or six weeks after the great flu appeared in any location, it would just stop. This happened with every outbreak at every place. The only possible explanation for this must be that the virus was running out of non-immunes to enter and reproduce. In the end, the flu just burned out (Barry, 2004, p. 231; Bjørnstad & Viboud, 2016, p. 12899; Brown, 2018, p. 51).
One bout of any of the waves of the pandemic seems to have conferred immunity to the subsequent surges of the flu. And one bout with any of the pandemic waves continued to provide some level of protection to the H1N1 that ultimately morphed into the seasonal flu in the years that followed. Those who suffered H1N1 were less likely to get other versions of H1N1 later in life (Barry, 2004, p. 231; Bjørnstad & Viboud, 2016, p. 12899; Brown, 2018, p. 51).
After the 1918–1921 pandemic, the H1N1 settled back to become the reigning subtype of seasonal flu. As it meandered about, passing again and again through much of the human population, it ultimately became less deadly. It did not need to be deadly to replicate, just infectious. It gradually reverted to the usual seasonal flu form, killing the elderly and children under four years old.
In 1957, the circulation of H1N1 ended with the appearance of H2N2 subtype. Still, it appears that even H2N2 was a partial descendant of the H1N1, and the H3N2 that followed in 1968, was in turn a descendant of the H2N2. The H1N1 was, in this sense, the parent of subsequent pandemic flus (Barry, 2004, pp. 370–371; Scholtissek et al., 1978, p. 13; Simonsen et al., 2011, p. 82; Taubenberger et al., 2019, p. 1).
Flu in the 1920s into the 1940s
After the 1918–1921 pandemic and H1N1’s retreat into a drifting seasonal flu, some deadly years, nevertheless, came from time to time: in 1929, 1933, 1937, 1943, and in 1946 (Andiman, 2018, p. 27; Dehner, 2012, pp. 79, 84). Worries persisted that another major pandemic could come. Medical science would have to do better next time.
After some initial laboratory breakthroughs in 1931, the flu virus was finally seen under an electron microscope in 1933. Now that scientists could look at it, their understanding of the virus began to improve (Saunders-Hastings & Krewski, 2016, p. 6).
The first goal had to be the development of a vaccine, an undertaking that took on greater urgency as World War II approached. Influenza had severally weakened the USA’s fighting ability in the First World War. This could not happen again (Dowdle, 2006, p. 34).
In response, the US government established the Commission on Influenza to direct an effort to make an influenza vaccine as swiftly as possible. By 1943, the US military was already involved in field trials, and by the end of the war, most US soldiers had been given an injection of one or another of the flu vaccines that the researchers had decided were worth trying out. All in all, the flu vaccines they developed seemed to have worked well, providing sometimes very good protection to US military personnel during the Second World War.
For US civilians, the USA deployed in 1947 its first flu vaccine developed intended for use in the general population. It was a colossal failure; the vaccine was completely ineffective. The history and principles of influenza drift were not yet fully understood by the researchers, and as a result, the vaccine that year completely missed its mark (Dehner, 2012, pp. 84–85; Dowdle, 2006, p. 34; Saunders-Hastings & Krewski, 2016, p. 6; Zimmer & Burke, 2009, p. 281).
The Centers for Disease Control and Prevention (first opened in 1946 and operating under different names until the current one was adopted in 1992) continued the search for a good vaccine. Investigations began to uncover how past versions of the virus had drifted into subsequent iterations. Medical authorities were coming to recognize that to respond effectively they needed to gather early global information on each successive flu outbreak. By the early 1950s, the reach of the program, under US and UK funding, fanned out across the world (Dehner, 2012, pp. 86–87; Saunders-Hastings & Krewski, 2016, p. 6). It was these institutions that faced a daunting challenge in 1957: a complete viral shift, the pandemic of H2N2.
The “Asian” Flu of 1957 (H2N2)
In February 1957, a deadly flu was first reported in Yunnan Province, China (bordering northern Vietnam, Laos, and Myanmar, also known as Burma). US health authorities became aware of the outbreak in April; by summer, it had spread everywhere on earth. While passenger air travel had become more common by this time, the pandemic starting in 1957 seemed to have spread more by land and along shipping routes than by air (Saunders-Hastings & Krewski, 2016, p. 7).
The 1957–1959 “Asian” flu pandemic of H2N2 was more contagious than the ordinary seasonal outbreaks. In the USA, about a quarter to a third of the population became infected. The best estimates for total case fatalities put the influenza pandemic of 1957–1959 at the low rate of 0.07% to the high-end estimate of 0.67%. In the UK, the case fatality rate was possibly around 0.3% (Barro et al., 2020, pp. 2, 5; Clark, 2020; Henderson et al., 2009, pp. 1, 6–7; Jackson, 2009, p. 622; Nguyen-Van-Tam & Bresee, 2013, p. 454; Nickol & Kindrachuk, 2019, p. 2; Saunders-Hastings & Krewski, 2016, p. 7).
The Asian flu was not innately more deadly, it was just catchier. And because more people got the flu, more people died. No exact count of the deaths can be made. The best estimates are that the H2N2 pandemic killed around 70,000–116,000 Americans, and a total of one million to as many as four million people worldwide. Given these totals, the H2N2 pandemic was actually less deadly than some severe seasonal flu: less than in 1937 (H1N1), less than in 1943 (H1N1), and less than the subsequent H2N2 seasonal flu of 1963 (Brown, 2018, p. 68; Clark, 2020; Potter, 2001, p. 577; Saunders-Hastings & Krewski, 2016, p. 7).
The H2N2 pandemic varied in its deadliness in different regions. It least impacted Europe; it brought the most excess mortality to Latin America (Viboud et al., 2016, pp. 738–739). Chile provides the best-studied case in point.
In Chile, the H2N2 influenza pandemic of 1957–1959 killed over 8,000 people out of a population of 7.6 million, 0.11% of the total population. Chile suffered a level of death from the pandemic at a rate three to five times as high as that found in the developed world. It could be that Chile, far away from the rest of the world, had in the late-nineteenth century been spared from the circulating H2 subtype at any point before 1889, so no one in the population had any level of prior immunity (Chowell et al., 2017, pp. 230, 233).
In Washington, in early-1957, medical researcher Maurice Hilleman of the Walter Reed Army Institute of Research began to suspect that senior sparing was present in the USA in this outbreak. Subsequent research has confirmed Hilleman’s hunch, at least to the satisfaction of most epidemiology experts working on the topic (Clark, 2020; Dehner, 2012, pp. 93–95; Dowdle, 2006, p. 34; Henderson et al., 2009, p. 7).Yet, for Chile, there was no pattern of senior sparing in the 1957–1959 H2N2 pandemic. This finding would be consistent with Chile’s overall higher death totals from the pandemic (Chowell et al., 2017, pp. 234, 246; Viboud et al., 2016, p. 738).
Hilleman had taken an early start on vaccine development, and the vaccine began to become available for first use in the USA by August 1957. It took just 4 months to produce 40 million doses. Yet, even this rapid production pace was too slow, for most of the vaccine arrived too late, coming in time to help combat only the final part of the fall wave. The vaccine was only partially effective anyway, providing protection to around 50%–60% of those inoculated (Clark, 2020; Dehner, 2012, p. 93; Henderson et al., 2009, p. 6; Jackson, 2009, p. 622; Monto & Webster, 2013, p. 22; Simpson, 2020).
The “Hong Kong” Flu, 1968–1969 (H3N2)
As the pandemic of 1957–1959 receded, the H2N2 became the new (and only) seasonal influenza A subtype in circulation around the world. This situation ended in 1968 when H2N2 was replaced with a new subtype, the H3N2 “Hong Kong” flu. The “Hong Kong” flu was another viral shift, bringing H3 into the mix, added to the N2 already in circulation.
Since 1968, H2N2 has not returned in circulation in the world. All people born in 1968 and after have no prior immune experience to any potential future recycling of any H2 subtype. Only people who lived from 1957 to 1968 would have any pre-existing immunity or childhood imprinting that could provide protection against the re-emergence of any new H2 subtype (Taubenberger et al., 2001, p. 1830).
July 1968 brought the first-reported cases of the H3N2. As was the continuing practice then, because the first cases of H3N2 were reported in Hong Kong, the killing pandemic took the name “Hong Kong” flu. The H3N2 quickly spread over the globe, arriving in the USA with soldiers returning home from their tours of duty in Vietnam. In this way, the 1968–1969 “Hong Kong” flu may have the first pandemic influenza that traveled across oceans chiefly by airplane, not by ship (Brown, 2018, p. 69; Jester et al., 2020, p. 669; Morens & Taubenberger, 2012, p. 265).
The outbreak of H3N2 “Hong Kong” flu peaked in the USA from December 1968 into January 1969, lasting in all about six weeks. This new flu was not that infectious. The basic reproduction number (or R0, pronounced “R naught”) for the 1968–1969 H3N2 pandemic was around 1.8 R0, a comparatively low figure for flu, even a garden variety seasonal flu (Jester et al., 2020, pp. 670, 672; Schoenbaum et al., 1976, p. 167). Estimates for total case fatalities put the influenza pandemic of 1968–1969 at the very low rate of 0.03% (Barro et al., 2020, pp. 2, 5; Nguyen-Van-Tam & Bresee, 2013, p. 454).
Overall, the 1968 H3N2 “Hong Kong” flu proved neither all that contagious nor all that deadly. It could be that prior exposure to the N2 subtype, circulating for 11 years prior to the 1968–1969 H3N2 pandemic (from the 1957–1959 H2N2 pandemic until 1968), provided some level of protection. (Cox & Subbarao, 2000, p. 413; Morens & Taubenberger, 2012, p. 270).
Worldwide, the H3N2 pandemic of 1968–1969 killed somewhere between half of a million to as many as two million people. For the USA, the H3N2 pandemic of 1968–1969 killed, perhaps, 33,800 people total, or about the same amount lost in a typical seasonal flu. Some estimates place the number killed by H3N2 in 1968–1969 in the USA at around 100,000 people, which would have been somewhat a higher level of loss than for a typical flu season in the USA. Given this threat level, US authorities chose not to respond very aggressively; only a few K-12 schools and colleges closed. A new version of the flu vaccine to deal with the H3N2 “Hong Kong” flu pandemic was rushed into distribution in the USA in the first part of 1969, but, as with other flu vaccines during pandemics, it arrived well after the flu peak had passed (Garmaroudi, 2007; Jester et al., 2020, pp. 670, 672; Monto & Webster, 2013, p. 23; Saunders-Hastings & Krewski, 2016, p. 9).
Looking back at the three twentieth century flu pandemics, 1918–1921, 1957–1959, and 1968–1969, recent research always allows us to draw some important comparisons. One way to do this is to compare “excess mortality,” the expected level of deaths for a given location and a given time, set against the actual number of recorded deaths. If there are more deaths than usual for that timespan in that place, then at least part of this excess mortality could be attributed to the flu in pandemic years.
The global excess mortality rate (per 100,000 in population) for the 1918–1921 pandemic was 598; for the 1957–1959 pandemic, 41; but for the 1968–1969 pandemic, only 17 (Saunders-Hastings & Krewski, 2016, p. 8). The H3N2 “Hong Kong” flu pandemic was so limited in its impact that many people at the time never even learned of it. Those who were born later were even more unlikely to have heard about it. If the 1918 pandemic was the “forgotten” pandemic, the 1968 pandemic was the “never even heard of it” pandemic.
One positive result of the 1968–1969 H3N2 pandemic was the ensuing enhancement of early surveillance and reporting on global flu outbreaks and coordination by the World Health Organization (WHO). The WHO stood sentinel as the H3N2 followed the familiar route, settling back to be the one form of influenza A circulating. This situation continued until something completely unexpected happened. In 1977, the H1N1 subtype returned into circulation, but instead of replacing the H3N2, the H1N1 joined with it and began co-circulating.
The “Swine” Flu of 1976
The story of how H1N1 came to reappear in 1977 begins in 1976 with the “swine” flu scare. In January 1976, headlines issued a shrill alarm: H1N1, the same flu subtype that had devastated the world in 1918–1921, had come back. This influenza had been positively identified at the Fort Dix army base in New Jersey. It had already killed one person, and there was confirmation of human-to-human spread, with serologic evidence found in 230 cases (Zimmer & Burke, 2009, p. 281). Oh no!
The world stood in horror. But slowly it became clear that this H1N1 subtype had not moved beyond Fort Dix. The only person who died of H1N1 in 1976 turned out to be the first person who contracted it. It was not spreading. It never did (Brown, 2018, p. 71; Dowdle, 2006, p. 35; Tognotti, 2009, p. 333).
But no one could have known all this at the time. The threat seemed startling; a response urgently demanded. US President Gerald Ford (1974–1977) launched an immediate mass vaccination effort, making the announcement with vaccination heroes Jonas Salk and Albert Sabin at his side. But as we now know, there was no need for a vaccine to be developed, no need to develop it in record time, and no need for a mass vaccine deployment. Nevertheless, beginning in October 1976, the USA vaccinated over 40 million residents against the H1N1 “swine” flu. Completely unnecessary, the vaccine did no good. Some maintain, however, that it did some harm (Andiman, 2018, p. 32; Kilbourne, 2006, p. 11).
As the vaccine rolled out, health authorities noticed a rise in victims of Guillain-Barré syndrome, an affliction which brings sensations of tingling, numbness, trouble walking, paralysis, and in rare cases, death (Ampel, 1991, p. 660; Monto & Webster, 2013, p. 23).
In the USA, 532 people suffered Gullain-Barré syndrome shortly after receiving the 1976 “swine” flu vaccine. The exact number of Gullain-Barré deaths is difficult to count, for the syndrome can make overall bad health situations worse, and for those with already serious pre-conditions, it can be a contributing factor in their death if not the sole cause of their demise. All told, as many as 32 people died due to Gullain-Barré, although some reported the number of deaths as 23 (Saunders-Hastings & Krewski, 2016, p. 10; Zimmer & Burke, 2009, p. 281).
As news of these deaths hit the airwaves, President Ford’s “swine” flu vaccine initiative became a public relations disaster. The Centers for Disease Control director, David J. Sencer, tendered his resignation. The USA abruptly halted its entire flu vaccination program (Brown, 2018, p. 75; Dehner, 2012, p. 103).
The trouble with this cautionary tale of government over-reaction, however, is that it is not at all clear that these Gullain-Barré illnesses and deaths were the result of the “swine” flu vaccines. In fact, what caused these individuals to suffer with Gullain-Barré is not known.
In the USA in 1976, two million military personnel received two doses each of the “swine” flu vaccine. However, the incidence of Gullain-Barré in this population dropped below the ordinarily expected levels for people in this group. As we try to consider the side effects and adverse effects, it is essential to set the incidence of the identified condition or problem against the context of what usually is the case. In 1976, there were no more cases of Gullain-Barré than usual. Indeed, there were fewer than usual (Brown, 2018, p. 75). The long-term damage from the “swine” flu vaccine fiasco, however, had been done. Henceforth, more people would be hesitant to get vaccines, especially if they had been hurried out during a pandemic.
The 1977 Reappearance of H1N1
Following the “swine” flu scare in 1976, a different H1N1 subtype was detected in Russia, in the far eastern region of Siberia, first reported in mid-1977 (Dehner, 2012, pp. 104–105; Monto & Webster, 2013, p. 23). This was a cause for major concern. H1N1 was spreading.
Subsequent research has pieced together what happened, even if some of the details remain hidden. In Russia, or perhaps in China, lab researchers had begun to use stored H1N1 virus from 1950 or 1951 in their efforts to develop a new vaccine against the “swine” flu thought to be a grave global danger at the time (Dowdle, 2006, p. 38).
The Russian (or Chinese) vaccine development team seems to have been testing the efficacy of their vaccine with a “challenge” trial, a procedure where a group of test subjects is injected with the new vaccine, and then are intentionally infected with the disease to see if the vaccine works to protect them. What appears to have happened in 1977 was that the researchers decided to use military recruits in a non-voluntary challenge test, vaccinating them against H1N1 with their new vaccine, and then infecting them with old samples of H1N1 they had around the lab.
We can surmise all this because we know what version of H1N1 began to circulate in the world in 1977. It was the H1N1 version from 1950 or 1951, a standard lab sample from that period commonly called the “Scandinavian” flu lab sample. We know this to be true because the H1N1 that appeared in 1977 had not drifted. In fact, it had not mutated at all from 1950 or 1951, literally frozen in time, in a lab freezer in the Soviet Union or China (Dehner, 2012, pp. 104–105; Palese, 2004, p. 583).
Flu vaccines efficacy is not very good. The flu drifts too much for any vaccine to protect more than, at best, two-thirds of the time. In 1977, some of the challenged soldiers must have flunked the test, came down with the flu, and then went into town and infected some people who lived there. From this point, the resurrected 1950–1951 H1N1 virus spilled out and went global. This created an unusual situation, but one that continues down to the present: two influenza A subtypes are in circulation (Saunders-Hastings & Krewski, 2016, pp. 11, 13).
There was one additional oddity in the aftermath of the 1977 lab spill of H1N1. Those born before 1957 (but after 1918) were largely spared from the revived H1N1, probably because they had been imprinted against this subtype. This was so because H1N1 had been the sole subtype circulating since 1918, only being replaced by H2N2 in 1957. Those born after 1957 were the most susceptible to the H1N1 that came back into circulation in 1977 following the lab spill (Ahmed et al., 2007, p. 1189; Cox & Subbarao, 2000, p. 414; Saunders-Hastings & Krewski, 2016, p. 6).
The “Mexican” H1N1, 2009
The H1N1 subtype from the lab spill circulated from 1977 until 2009, when another form of H1N1, first identified in Mexico, replaced it. This 2009 version was a different type of H1N1, a three-way mix of avian, hog, and human flu. The new H1N1 quickly came to be seen as a serious global threat. Although not a new flu subtype, it represented a significant drift in H1N1. The 2009 H1N1 strain spread over the world, replacing the prior H1N1 in circulation, although not replacing the H3N2 that remains in co-circulation (Palese & Wang, 2011, p. 1).
The first-reported occurrences of H1N1 in 2009 came in La Gloria, Mexico, a small town not far from the eastern coastal city of Veracruz. Global fears soared and alarms went off everywhere. It was H1N1 again, the ghost of 1918 reappearing (Brown, 2018, p. 78; Wang & Palese, 2013, p. 224).
As with other post-WWII era flu outbreaks, a vaccine for the 2009 H1N1 arrived too late to make a real difference. But fortunately, this flu turned out to be not especially deadly. Estimates for global deaths from the H1N1 outbreak 2009–2010 range from a low of 151,700 up to 575,400. The best estimates, based on excess mortality calculations, place the number of deaths worldwide from the 2009–2010 H1N1 pandemic at roughly 300,000, or about the same as a typical seasonal flu death toll. In the USA, the H1N1 killed 12,500 people in 2009–2010, a very low total even for seasonal flu, and very low indeed for a pandemic. The new H1N1 spared seniors; they had seen H1N1 before and had likely been imprinted against it in childhood. H1N1 continues in circulation today, but is less deadly than the co-circulating H3N2 for older people (Brown, 2018, p. 78; Dehner, 2012, p. 141; Jernigan & Cox, 2013, pp. 4, 11; Nickol & Kindrachuk, 2019, p. 2; Paget et al., 2019, p. 1; Petersen et al., 2020, p. e241; Troy, 2010, p.138; Wang & Palese, 2013, p. 224).
Seasonal Flu
Nowadays, H3N2 and H1N1 circulate the globe, appearing as seasonal flu and quietly mutating. While it would be technically possible to get both at once, one subtype usually crowds out the space in the host for the other, at least at the same time. It is possible to get them both sequentially, however, and so people can come down with both in one flu season (Wang & Palese, 2013, p. 222).
Seasonal flu today of either subtype typically has a basic reproduction number, R0, of 0.9–2.1. By way of comparison, measles is highly infectious, at around 12–18 R0; whooping cough, at around 6 R0; smallpox, R0 4–6; the common cold, R0 at 2.5; and MERS at the low measurement of R0 at 0.3–0.8.
H3N2 is the main flu subtype around today, a strain that mutates much more rapidly than the other subtype, H1N1, also in circulation now. Today H3N2 is twice as prevalent and more dangerous than the co-circulating H1N1 (Jester et al., 2020, pp. 669, 675; Taubenberger et al., 2019, pp. 2, 4; Wang & Palese, 2013, p. 224).
The H3N2 is especially hazardous for people aged 65 years and older. It is possible that the increased risk of H3N2 for older populations could be explained by childhood imprinting. For people over 65, that is, those born before 1957, the first flu subtype they would have been exposed to would have been H1N1. For people this old, or older, their repeated exposures to H3N2 since 1968 would have provided some immune experience, but not at the same level as that provided from their childhood imprinting against H1N1.
H1N1 today chiefly impacts infants. As time moves on, however, more and more people will have the more commonly circulating H3N2 as their first childhood imprinting experience. Because H3N2 mutates so rapidly, the immune imprinting may be less directly on target as every year brings a new iteration of H3N2 (Gostic et al., 2019, p. 2).
While pandemic flu is not seasonal, coming at just about any time of the year, many people typically experience flu as a seasonal infection. Of course, even the annual “seasonal” flu is not at all seasonal in tropical zones with high humidity, occurring there year-round (Brown, 2018, pp. 120–121; Lee et al., 2007, p. 1052; Potter, 2001, p. 573; Taubenberger & Morens, 2006, p. 72).
But in temperate areas, flu does occur seasonally, especially in zones where the seasonal shifts in temperature are wider. When it is cold, and especially when the air is dry, flu spreads more readily (Barry, 2004, p. 256; Brown, 2018, pp. 121, 126). In temperate zones, winter is death’s time. Excess mortality jumps up sharply in the winter, with much more incidence of heart disease and strokes. Excess winter mortality in temperate zones is strongly linked to flu (Reichert et al., 2004, p. 492).
It is not apparent why the flu cases and deaths increase more in temperate zones during the winter months. There is, however, no shortage of proposed explanations.
Some have suggested that winter puts people more indoors. However, this notion breaks down when exposed to scientific examination. Human motion studies show that people in temperate zones are not indoors more in winter. In the summer too, people stay indoors, typically parked in front of the air conditioner (Brown, 2018, p. 121).
It could be that the cold and dry weather allows the virus (technically, virions) to stay viable outside of a host longer (Deyle et al., 2016, p. 13081; Kilbourne, 2006, p. 12). But the best explanation may be that it is the presence of increased levels of vitamin D, coming from extended exposure to sunlight, that most drives the seasonality of flu. During winter months, when the sun’s rays are less intense in higher latitudes, people get less direct sunlight. Therefore, they receive less vitamin D, which comes mostly from sunlight. Vitamin D might serve, some medical researchers have argued, to prime the immune system (Brown, 2018, p. 123).
Another possible explanation for flu seasonality in temperate zones is the timing of the K-12 school sessions. Children are the main spreaders of seasonal flu: shortly after they return to school in the fall, seasonal flu follows (Bjørnstad & Vibound, 2016, p. 12901).
Usually, seasonal flu preys upon older people, infants, and pregnant females. The elderly pay the heaviest price. For people aged 65 years or more, in the USA, each year, seasonal flu kills at least 1 of every 2,200 people, but in some years, it claims 1 of every 300 elderly people (Garmaroudi, 2007; Morens & Taubenberger, 2018b, p. 1449; Simonsen et al., 1998, p. 53).
Worldwide, the seasonal flu infects perhaps 1 of 10 people annually (in some places it is higher, in Mexico, for example, 2 of 10), killing somewhere around 300,000–650,000 people in the world every year (Bonvehí et al., 2012, p. 506; Kuri-Morales et al., 2006, p. 379; McLean et al., 2016, p. 5410; Nickol & Kindrachuk, 2019, p. 1; Paget et al., 2019, p. 1).
In the USA, the seasonal flu usually kills around 21,000–36,000 people every year. However, the level of death can vary widely. For the USA, in the 2011–2012 season, 12,000 died from seasonal flu; but in 2014–2015, it jumped to 56,000; and during the 2017–2018 season, 61,000 to as many as 80,000 people died in the USA from the seasonal flu. Flu keeps killing people, year after year. We have yet to come up with a way to prevent this (Bonvehí et al., 2012, p. 506; Simonsen et al., 1998, p. 53; Taubenberger & Morens, 2013, p. 2; Taubenberger et al., 2001, p. 1829, 2019, p. 2; Viboud et al., 2016, p. 739).
Vaccines
The world does not produce enough flu vaccines and does a poor job in equitably distributing that which it has. Total global production of annual flu shots today reaches only around 450–530 million each year. With a global population of 7.8 billion, this means that only around 6%–7% of the world’s population gets a flu shot every year. Humanity is not well-protected against seasonal flu (Dinerstein, 2018; Garmaroudi, 2007; Stöhr, 2013, p. 352).
Nearly all the world’s flu vaccine is produced in Western Europe, North America, Japan, and Australia. The vaccines are usually quadrivalent, designed for protection against H3N2, H1N1 (post 2009 type), and two B strains (Stöhr, 2013, pp. 352–353). The vaccine is still a hit or miss, one of the least efficacious vaccines commonly used. The flu vaccine is usually effective in around half of those inoculated, but sometimes only provides protection in around a third of those vaccinated. During the 2004–2005 flu season in the Northern Hemisphere, the vaccine proved only about 10% effective; for 2014–2015, only 19%–29% effective (Brown, 2018, pp. 7, 151, 155, 165).
Made in the developed world, over three-quarters of all flu vaccine ends up being injected into arms there. The USA and the EU vaccinate about 4 of 10 people per year (Brown, 2018, p. 129; Dinerstein, 2018). Other nations do not have enough vaccines, so they try to focus their distribution efforts where it might do the most good. Mexico and Brazil, for example, focus their vaccinations on the elderly. This allocation is typical in the developing world, with efforts directed at vaccinating the most vulnerable populations. These approaches raise some concerns however (Bonvehí et al., 2012, p. 509; Fedson, 2003, p. 1553).
By age grouping, the flu vaccine does the worst in preventing serious illness and deaths in those 65-years-old and older (Kuri-Morales et al., 2006, p. 183). This is the case because older people are the age group that is least likely to get a good immune response and solid protection from any vaccine, not just the flu vaccine. And for the elderly, of all the vaccines they receive, their weakest immune response is with the flu vaccine.
Children who attend school are the main flu spreaders of flu. Once the kids get home from classes, they immediately start shedding flu virus the moment they hit the door. Fortunately, children respond exceptionally well to the flu vaccine, at least if that year’s version is on target. Therefore, the best shot for protecting older people is the vaccine given to their grandchildren 10 or more days earlier (Brown, 2018, pp. 155–156). When a serious flu epidemic breaks out, closing the schools is a really good idea, and holding off on seeing the grandparents until the kids are all vaccinated, even a better one.
Most people living in the developing world never get any flu shot at any point in their lives. The countries of the developing world nations usually do not make the vaccine, and getting doses from developed nations is problematic. Flu vaccine does not travel well; it can only be stored for a few months before it is no longer effective. Today, over half of the world’s people, the people of the global South, have access to just 4% of the annual flu vaccines distributed. Around a third of all nations do not vaccinate for flu at all (Fedson, 2003, pp. 1552–1553; Palache et al., 2015, p. 5599; Stöhr, 2013, p. 356).
Spillover
As we have seen, flu subtypes jump readily from wild birds to domesticated fowl, and from there, into hogs (and perhaps horses), and then finally, into humans. Poultry, like humans, are not the usual hosts of flu. When flu jumps from waterfowl to chicken, it is not likely to produce a form of flu that will continue to spread easily from chicken to chicken, or from human to human. Moreover, the wild bird to domesticated bird path seems unlikely to create versions of the flu that can then spread from human to human (Jernigan & Cox, 2013, p. 8; Morens & Taubenberger, 2018b, p. 1450; Morens et al., 2013, pp. 2345, 2347).
In 1997, however, a H5N1 spillover from chickens into humans triggered anxious concern. People in Hong Kong were showing up in the emergency room with what was quickly identified as H5N1, the “bird” flu.
Six people died that year of H5N1, and by 2015 it had caused over 400 human deaths, focused on Indonesia, Egypt, and Vietnam. But 2015 brought the last reported death from H5N1. The H5N1 spread from chicken to human, but did not mutate well enough to jump readily from human to human, a good thing too, given that the case fatality rate of the H5N1 was around 50%. (Jernigan & Cox, 2013, p. 3; Monto & Webster, 2013, p. 24; Saunders-Hastings & Krewski, 2016, p. 9; Taubenberger & Morens, 2013, p. 1; World Health Organization [WHO], 2015; 2021).
A key problem with preventing the spread of H5N1 with a vaccine was, oddly, the very fact that it focused its killing on chickens. The H5N1 can get into ducks causing them no ill effect, but in chicken it is nearly always fatal. This is a big problem because most human vaccine against flu is still cultivated in chicken eggs, just as it has been for the past 65 years (Cox & Subbarao, 2000, p. 408; Dehner, 2012, p. 83; Stöhr, 2013, p. 352). Because of this, a vaccine for H5N1 could not be produced in chicken eggs. The virus cannot be grown in this medium; it just turns the chicken eggs to mush.
If H5N1 could somehow mutate to leap from human to human, we could not produce a vaccine, at least on a large scale, against this subtype of influenza. And this is what makes H5N1 so worrisome. It probably cannot happen, but if it mutates so that it can move from person to person, things could get very dark, very fast. There are other ways to make vaccines, but these techniques are not yet used in the USA (Dehner, 2012, pp. 123–125, 138).
There are other influenza subtypes that have spilled over, posing additional threats. Subtypes from H6, H7, H10, and H15 would be the deadliest threat if they were to jump into humans. Still, these subtypes seem poorly suited to make the leap into humans; they are designed to attach to waterfowl digestive tracts, not human respiratory tracts (Morens & Taubenberger, 2018a, p. 2286).
In 2013, H7N9 spilled over from chickens into humans, causing 37 human deaths that year and ultimately 616 deaths total before the outbreak ended in 2019. In 2014, H5N6 spilled over in China, and nine deaths have resulted, so far. This H5N6 subtype is still around (Andiman, 2018, p. 41; Taubenberger & Morens, 2013, p. 1; United Nations & Food and Agriculture Organization [UN & FAO], 2021; WHO, 2015, 2021).
In January 2021, H4N6 spilled over in China, but no one died from this subtype to date (WHO, 2021). Other subtypes, including H9N2, have also spilled over from chickens into humans, causing illness but no reported deaths. Fortunately, H4, H5, H7, and H9 subtypes, experts reassure us, do not appear to be able to spread readily from human to human (Taubenberger & Morens, 2013, p. 2). We should really hope that they are all right about this.
We need to be more vigilant. The WHO established the World Influenza Center in London in 1948. By 1962, the network had expanded to two centers, and by 1976, to three, two of which were in the USA (in Atlanta and then Memphis). But only in 2005 the WHO called for reporting of any public health emergency that could have international implications. Even now, human flu surveillance in the developing world is very thin, and animal flu surveillance is all but non-existent (Jernigan & Cox, 2013, pp. 9, 11, 12). The next flu pandemic, like all those before, will come from animals into humans. We should be watching more closely.
What Next?
The WHO needs about six months lead time to predict the next flu variety and to produce the seasonal flu vaccine (Brown, 2018, pp. 154–155). However, a seasonal flu shot would not provide protection against a pandemic flu event; the shot protects, sort of, against drift, but not when the virus shifts (Ropero-Álvarez et al., 2012, p. 917). And because a new subtype would require the development of a new vaccine, a pandemic would almost certainly have devastated humanity long before a vaccine could be developed, produced, and administered around the world.
The quest now is to find a “universal” flu vaccine, one that is much more effective and one that would not need to be renewed every year. We are not there yet. We do not know when, if ever, this solution could arrive.
Some believe that we should not bother to worry about all this. Anton Erkoreka, writing in 2009 in the pages of the Journal of Molecular and Genetic Medicine, argued that it cannot happen again, that the 1918 influenza was so deadly only because of the context of trench warfare in World War I, and even if a new pandemic started, we could just beat back any secondary bacterial infections with antibiotics, and that, anyway, new antivirals will provide effective cures against any flu that could emerge (Erkoreka, 2009, p. 190).
Were that wishing made it so. The alarming rise of antibiotic resistance makes flu victims much more vulnerable to secondary bacterial infections these days (Nickol & Kindrachuk, 2019, p. 7). Antivirals do not work well. Remedies like Tamiflu serve mainly to shorten the length of flu symptoms. Antivirals can sometimes bring serious reactions, including copious vomiting and in some cases, nightmarish hallucinations (Brown, 2018, pp. 136, 144; Glezen, 1996, p. 64).
Our world today, our generation right now, truly understands what it means to live through a pandemic. We have seen that if a vaccine is invented in the developed world, that only the leftovers will make it to the developing world, unless, like Cuba, they can make vaccines themselves.
The worst pandemics in human history claimed vast tolls in lives lost. The Black Death of the 1300s cost as many as 200 million lives. The 1918 flu killed as many as 100 million. Still, some might argue, this was all such a long time ago. Won’t modern medicine save us all now?
Maybe, but not all doctors think so. Mark well the words of Dr. Victor C. Vaughan, in 1918 the University of Michigan Dean of Medicine. Dr. Vaughan, after tending to soldiers in the fall pandemic wave, vowed henceforth to “never again to prate about the achievements of medical science and to humbly admit our dense ignorance” (Brown, 2018, p. 63).
Most epidemiologists thought that the next big one would be some form of influenza. Will the experts be right next time? Will the next one be flu?
The H2N2 influenza subtype has not been around since 1968. Any potential H2 subtype would make an excellent candidate for the next influenza pandemic, threatening all humanity (Fedson, 2003, p. 1553). The clock is ticking; we just do not know what time it is (Barry, 2004, p. 451).
Footnotes
Declaration of conflicting interests
The author declared no potential conflicts of interest with respect to the research, authorship, and/or publication of this article.
Funding
The author received no financial support for the research, authorship, and/or publication of this article.