
Abstract
Different views on the role of personal factors in moderating individual viewing behaviour exist. This study examined the impact of personality traits on individual viewing behaviour of facial stimulus. A total of 96 students (46 males and 50 females, age 23–28 years) were participated in this study. The Big-Five personality traits of all the participants together with data related to their eye-movements were collected and analysed. The results showed three groups of users who scored high on the personality traits of neuroticism, agreeableness and conscientiousness. Individuals who scored high in a specific personality trait were more probably to interpret the visual image differently from individuals with other personality traits. To determine the extent to which a specific personality trait is associated with users’ viewing behaviour of visual stimulus, a predictive model was developed and validated. The prediction results showed that 96.73% of the identified personality traits can potentially be predicted by the viewing behaviour of users. The findings of this study can expand the current understanding of human personality and choice behaviour. The study also contributes to the perceptual encoding process of faces and the perceptual mechanism in the holistic face processing theory.
1. Introduction
It has recently been established that the spontaneous tendency to look at people’ faces is a hallmark of human behaviour and an essential cognitive adaptation that facilitates individual engagement during visual interaction [1]. Human faces have been considered as multi-dimensional visual stimuli that can be used to convey a comprehensive range of information during the visual processing task. The information conveyed can be classified under two categories: face traits and face states [2]. Face traits refer to the facial features that are relatively permanent, including gender, race, aesthetics and age (elderly or young), while face states refer to the dynamic facial movements of speech, emotion and direction of gaze. Face processing is believed to be a universal area of expertise in humans and perhaps one of the first developed areas. This might be because faces can provide the richest cues of an individual’s identity [3]. From a functional point of view, the importance of face processing makes sense because recognising individuals facilitates communication with people and maintains group structure and hierarchy. However, acquiring specialised face processing mechanisms, either by natural selection during phylogeny or by intensive learning during ontogeny, is an essential process. Therefore, research conducted to explore the eye behaviour revealed a high level of attention to the eyes compared with other regions, when scanning facial stimuli [4,5]. Aside from the eyes, people also tend to concentrate on the mouth and nose regions [6]. Viewers’ perceptual response to these regions is also influenced by task demands (e.g. free viewing and gender discrimination) as well as the characteristics of the stimuli, such as emotional expression of the face with specific diagnostic features (e.g. fearful wide-open eyes or happy grinning mouth) [7,8].
The literature (e.g. [9]) showed a direct link between certain facial traits and people’s psychological characteristics, which can be complemented by certain visual preferences [10]. Previous studies (e.g. [11]) on individuals’ visual preferences have the potential to determine emotional and decision-making behaviours. For example, Guy et al. [12] identified stable and robust individual differences in visual predilection for faces. Gambarota and Sessa [13] reported qualitative differences in visual working memory for face representations as a function of psychopathology and personality traits. This led us to explore how individual preferences for faces can serve as indicators of certain psychological aspects. Previous studies like Zenner [14] and Al-Samarraie et al. [15] showed how individuals’ preferences can be linked to specific personality dimensions. Yet, the picture emerging from these studies shows limited evidence about the role that personality dimensions in influencing the viewing behaviour of individuals. The personality of a person can represent differences in characteristic patterns of thinking, feeling and consequently behaviour [16]. Personality features constitute a vital part of our preferences and actions; hence, it is important to understand which of these features maybe linked to our viewing behaviour. This is why we assume that psychological construct such as personality is important to face recognition. In addition, studying how personality traits may contribute to the individual processing of facial features is crucial for understanding individual differences in future decision-making and recognition schemes. Hence, two questions were explored as follows: (1) how personality traits impact users’ viewing behaviour? and (2) can personality traits be predicted using users’ viewing behaviour?
Based on the above, this study examined the impact of personality traits on users’ viewing behaviour. We also examined the role of personality traits in predicting such behaviour. The participants were grouped according to their score on the Big-Five personality model. We used eye-tracking technology to explore the differences in the perceptual structure of people observing and distinguishing the facial features of individuals of different age groups. Subsequently, a supervised machine learning algorithm was applied to the eye-movement data to predict the personality traits of the participants. It is anticipated that the findings from this study can offer new insights into human interaction, personality and rational choice theories. This study also offers crucial insights for the study and detection of socio-affective cognition.
2. Literature review
Previous studies that examine the correlation between users’ personality and their eye-movements indicate that people with similar personality traits tend to exhibit similar eye-movements [17]. Personality traits are indicators of individuals’ tendencies from behavioural, cognitive and emotional perspectives [18]. Differences in personality can be examined based on the Big-Five model of personality (also known as the five-factor model) that is used extensively in psychology [19]. The model consists of five factors that are commonly used to represent the personality dimensions: extraversion, neuroticism, openness to experiences, agreeableness and conscientiousness [20,21]. Neuroticism refers to the individual’s characteristics of being easy to fed up and having unstable emotion [22]. It is used as a manner for understanding the relation between personally relevant traits and the emotional stability of a person in certain contexts [23,24]. Extraversion represents a coherent psychological patterns in terms of personal’s behaviour, cognition, passion that vary from one individual to another based on the task demand and environmental conditions [25]. A study by Tett and Burnett [26] argued that extraversion in people is probably to be observed during the process of active interaction. Openness to experience represents the characteristic of own intellectual and independent-minded [22]. Individuals high in of openness to experience are characterised as being exploratory in nature and seek new, unconventional and unfamiliar experiences [27]. The agreeableness trait refers to the positive behaviour exposed by a person to a certain event. Ode et al. [28] stated that agreeableness is associated with motives to maintain positive interpersonal relations. Finally, conscientiousness refers to the type of propensity that characterises a person as being dependable in achieving his or her goals [29]. Quintelier [30] pointed out that people high in conscientiousness trait are viewed to be more organised and responsible.
Our review showed a few articles in the literature that have described the relationship between personality traits and the recognition behaviour of individuals [31,32]. Yet, it is believed that specific personality traits may explain a moderate proportion of variance in human interaction. Determining the ways in which personality traits react with contextual determinants to shape viewers’ social behaviour has significant implications for numerous scientific and technological areas [33]. This can be achieved through a behavioural analysis of the relationship between individuals’ personality traits and eye-movement patterns. Human eye-movement is a fundamental behaviour that can reveal important cognitive, affective, motivational and social characteristics of people [34]. Previous studies (e.g. [20,35,36]) addressed the possibility of linking human perceptual behaviour to a specific personality trait for several reasons. One possible reason is that individual differences are manifested on molar and molecular levels of behaviour [37]. In addition, the perceptual behaviour of people is conditioned by social, motivational, cognitive and regulatory functions [34]. Canli [38] added that some stimulus materials seem to evoke certain eye-movement patterns due to the emotional response of the individual. This phenomenon may imply a possible link between the human neurological system and specific personality traits.
Nevertheless, a few studies have examined the possibility of predicting specific individual differences using eye-movement patterns. For instance, Eivazi and Bednarik [39] proposed a system that uses real-time eye-tracking technology to measure the patterns of visual attention among people, and predict their visual behaviour when performing a problem-solving task. Henderson et al. [40] examined the possibility of using eye-movements to classify the type of task – scene searching, scene memorisation, reading and pseudo reading – the user is performing using multivariate pattern classification. Another work by Al-Samarraie et al. [20] investigated the feasibility of predicting the personality traits (Big-Five dimensions) from user preferences conveyed by their eye-movements during a visual presentation task. Based on these, it is possible to deduce that individual visual preferences may somehow be associated with a specific personality profile. This has motivated researchers, such as Al-Samarraie et al. [15], to explore the role of personality traits (conscientiousness and agreeableness) in inferring users’ visual preferences. The authors treated personality traits as a continuous variable and deployed the bagging classifier together with a genetic search method to assess the predictions of eye parameters based on personality dimensions. They found that individuals who scored high on a specific personality dimension exhibited a unique eye-movement pattern when fixating on the region of interest. Meanwhile, Al-Samarraie et al. [36] studied the impact of personality dimensions (conscientiousness, agreeableness and extraversion) on users’ information-seeking behaviour. The authors found that individuals with a specific personality profile tended to outperform others in most information-seeking tasks. Kim and Kim [41] highlighted the potential of individual personality dimensions in stimulating online users’ decision to select visual preferences that are linked to their self-presentation through colour. The same was addressed by Yin et al. [42] who argued that personality can still be used to shape human behaviour through identifying the specific contingent role of extraversion, conscientiousness and agreeableness from a cognitive-affective perspective. Despite these efforts, only very little knowledge exists on the role of personality in modulating viewers’ viewing behaviour [43]. The characteristics of personality traits mentioned above motivated us to study their impact on individuals’ viewing behaviour. This was achieved using the International Personality Item Pool Representation of the NEO PI-R™ (IPIP-NEO). IPIP-NEO (see section 3.4 for more details) is the most popular approach used in the literature for assessing the Big-Five traits [35].
3. Method
We examined the eye-movement behaviour of participant who viewed three faces of individuals that belong to different age groups (baby, young and elderly). This section explains the study participants, materials, eye-tracking configuration, personality measure and procedure. A predictive model was built by testing a number of algorithms until one was found achieving high accuracy.
3.1. Participants
We initially recruited 98 graduate students (46 males and 52 females) with ages ranging from 23 to 28 years. They all had normal or corrected-to-normal visual acuity. Furthermore, they underwent personality and eye calibration tests. During the calibration test, two participants were excluded due to some technical difficulties in capturing their pupil. Consequently, 96 subjects (46 males and 50 females) participated in this study (age M = 24.54, standard deviation (SD) = 1.59). Everybody was healthy, with no visual impairment (the Snellen visual acuity of 6/18) [44]. To increase the accuracy of the eye-tracking measurements, only participants without glasses were recruited to facilitate the eye-tracking process [45]. Furthermore, all the participants were given details concerning the purpose of the investigation. Finally, informed consent forms were obtained.
3.2. Materials
Faces are multi-dimensional visual stimuli that offer a comprehensive understanding of viewing behaviours during the visual processing task. The spontaneous tendency to look at people’ faces is a hallmark of humans’ behaviour and an essential cognitive adaptation that facilitates individual engagement during visual interaction. Therefore, this study assumed that the differences in individuals’ processing of visual information when processing facial stimuli can be further exploited. As facial stimuli displayed, three faces of individuals in different age groups (baby, young and elderly) were displayed randomly. The participants’ perceptual experience when processing the facial features of these individuals was assessed. The people whose faces were used as the stimuli in this study were female, similar to previous studies [46–48]. Images were obtained from FACES database and the City Infant Faces Database. The reason for using only female faces in this study was that female faces are probably to elicit more robust responses than male faces [49,50]. In addition, this study was not interested in the effect of target stimuli gender on participants’ viewing behaviour. The three trials were presented on a white background.
3.3. Eye-tracking configuration (apparatus)
We used the SMI iView X™ RED eye tracker (SensoMotoric Instruments GmBH, Berlin, Germany) to record the participants’ eye-movements. The device uses an infrared sensor to capture eye-movements as the observer looks at each display. The eye position and pupil diameter were recorded using x- and y-values that we sampled at a rate of 60 Hz. The stimuli were presented via a standard 22-inch LCD monitor with a screen resolution of 1680 × 1050 pixels. The participants sat comfortably on a chair, with their eyes approximately 50 cm from the monitor.
3.4. Personality measure
The IPIP-NEO was used in this study. These items, known as the Big-Five personality traits, were developed by Goldberg [51] mainly to assess the personality profile of a group of people. In this context, we used the online version of the IPIP-NEO instrument which consists of 120 items based on the five Likert-type scale (very inaccurate, moderately inaccurate, neither accurate nor inaccurate, moderately accurate and very accurate). IPIP-NEO was used in this study because it offers the highest internal consistency of any measure of extraversion, neuroticism, consciousnesses, agreeableness and openness to experience [52]. In addition, it is one of the most widely used and well-validated inventories for measuring personality [53]. Each participant was tasked to complete the IPIP-NEO questionnaire after finishing the eye-tracking experiment. Then, both the eye-movement data and personality profile of all the participants were used in the classification process, which eventually helped us to build the predictive model of the individuals’ personality traits.
3.5. Procedure
The experiment took place in the eye-tracking laboratory. In this study, the laboratory condition was favoured to an in-situ experiment, as it allows greater control over the experimental conditions (e.g. light and noise conditions). Figure 1 shows the study procedure; it consists of providing the participants with a short demonstration about their roles in the visual viewing task. The participants were instructed to view the displayed image of the three faces in a manner similar to real faces. Furthermore, chin rests were not used; this allowed for a more natural viewing setting, as the movements of the participants were not restricted [45]. In addition, all the participants were instructed to avoid making abrupt movements to ensure measurement accuracy. Moreover, each trial was displayed for 5000 ms. This also includes the fixation cross between the instruction and the facial trials. Based on this, the overall experiment time was 35,000 ms. At the end of the experiment, we collected the following commonly used eye-tracking data: average pupil diameter, fixation duration, fixation number and saccade velocity peak [54–57], as there were no standard eye-movement parameters mentioned in prior visual studies. In this study, participation was voluntary, and there was no monetary compensation for the participants.
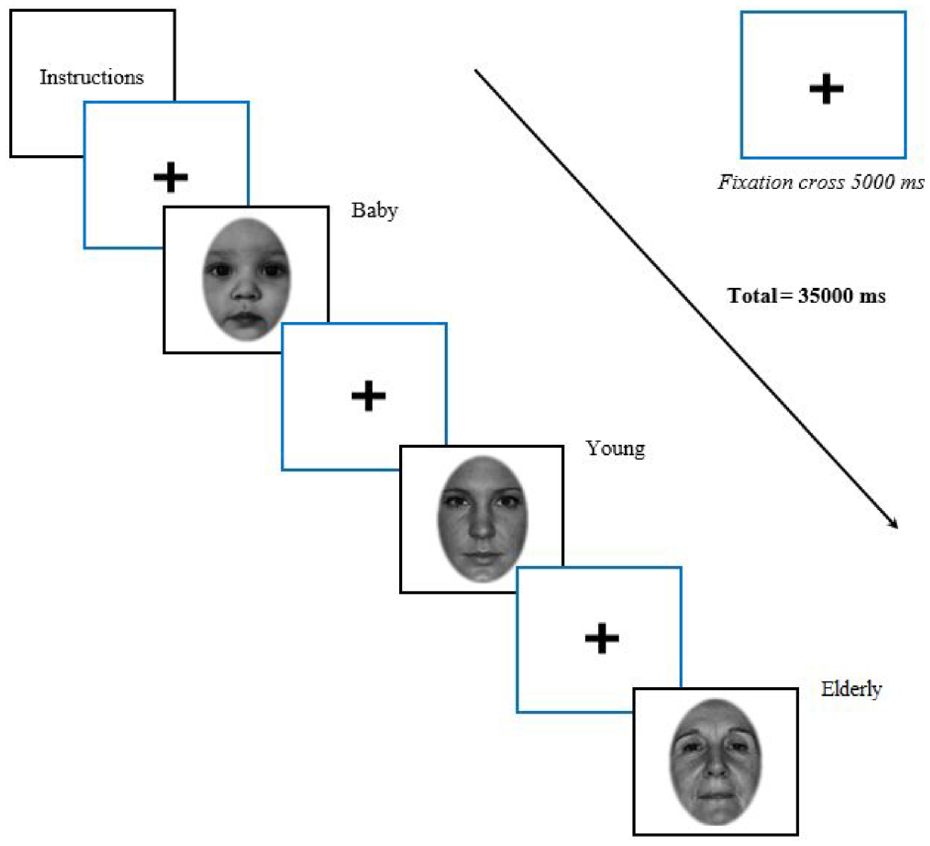
Experiment flow.
We grouped the participants based on their high scores on personality traits. We first used the hierarchical clustering method to identify the number of clusters. Ward’s method and the Euclidean distance based on the recommendation of Sarsam and Al-Samarraie [35] were used for this purpose. The dendrogram plot was inspected to determine the number of clusters, which showed a three-cluster solution. The membership value for each cluster was also obtained based on the similarity and dissimilarity in personality data. The first cluster showed that participants scored high in neuroticism, followed by openness to experience, extraversion, agreeableness and conscientiousness. This cluster was labelled as the ‘neuroticism’ cluster (N = 36). Participants in the second cluster scored high in agreeableness, followed by neuroticism, conscientiousness, extraversion and openness to experience. Thus, we labelled this cluster as the ‘agreeableness’ cluster (N = 33). Participants in the third cluster scored high in conscientiousness, followed by neuroticism, extraversion, openness to experience and agreeableness. Hence, this cluster was labelled as the ‘conscientiousness’ cluster (N = 27). To confirm differences between the three clusters, we used analysis of variance (ANOVA) test in which the results showed a significant difference (p < 0.05) in all personality traits of the three clusters/personality profiles. Table 1 summarises the statistical result of cluster algorithm.
Statistical results of the clustering algorithm.
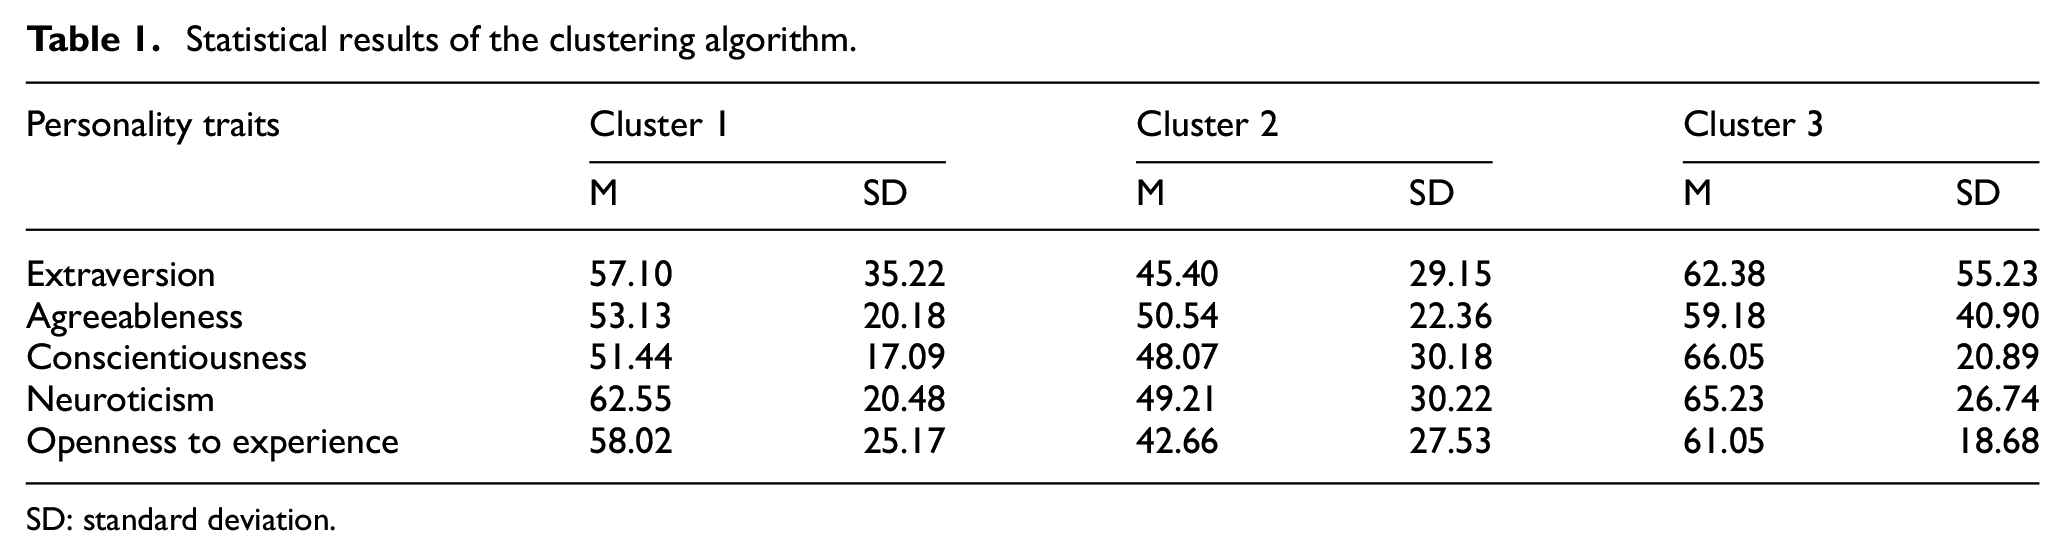
SD: standard deviation.
4. Results
Section 4.1 discusses the descriptive statistics and the ANOVA corresponding to each personality trait in the interaction with the stimuli provided by the face of subjects in each age group as the within-subject factor. Section 4.2 discusses the classification process, including the utilised classification algorithms and the evaluation metrics, used to assess the performance of the predictive model in this study.
4.1. Descriptive statistics results
This section presents the descriptive statistics and ANOVA results of participants who scored high on neuroticism, agreeableness and conscientiousness for each trial. Table 2 presents the summary of the eye-movement data of the participants that scored high on neuroticism, agreeableness and conscientiousness, respectively, when viewing the three faces.
Descriptive statistics and ANOVA results.
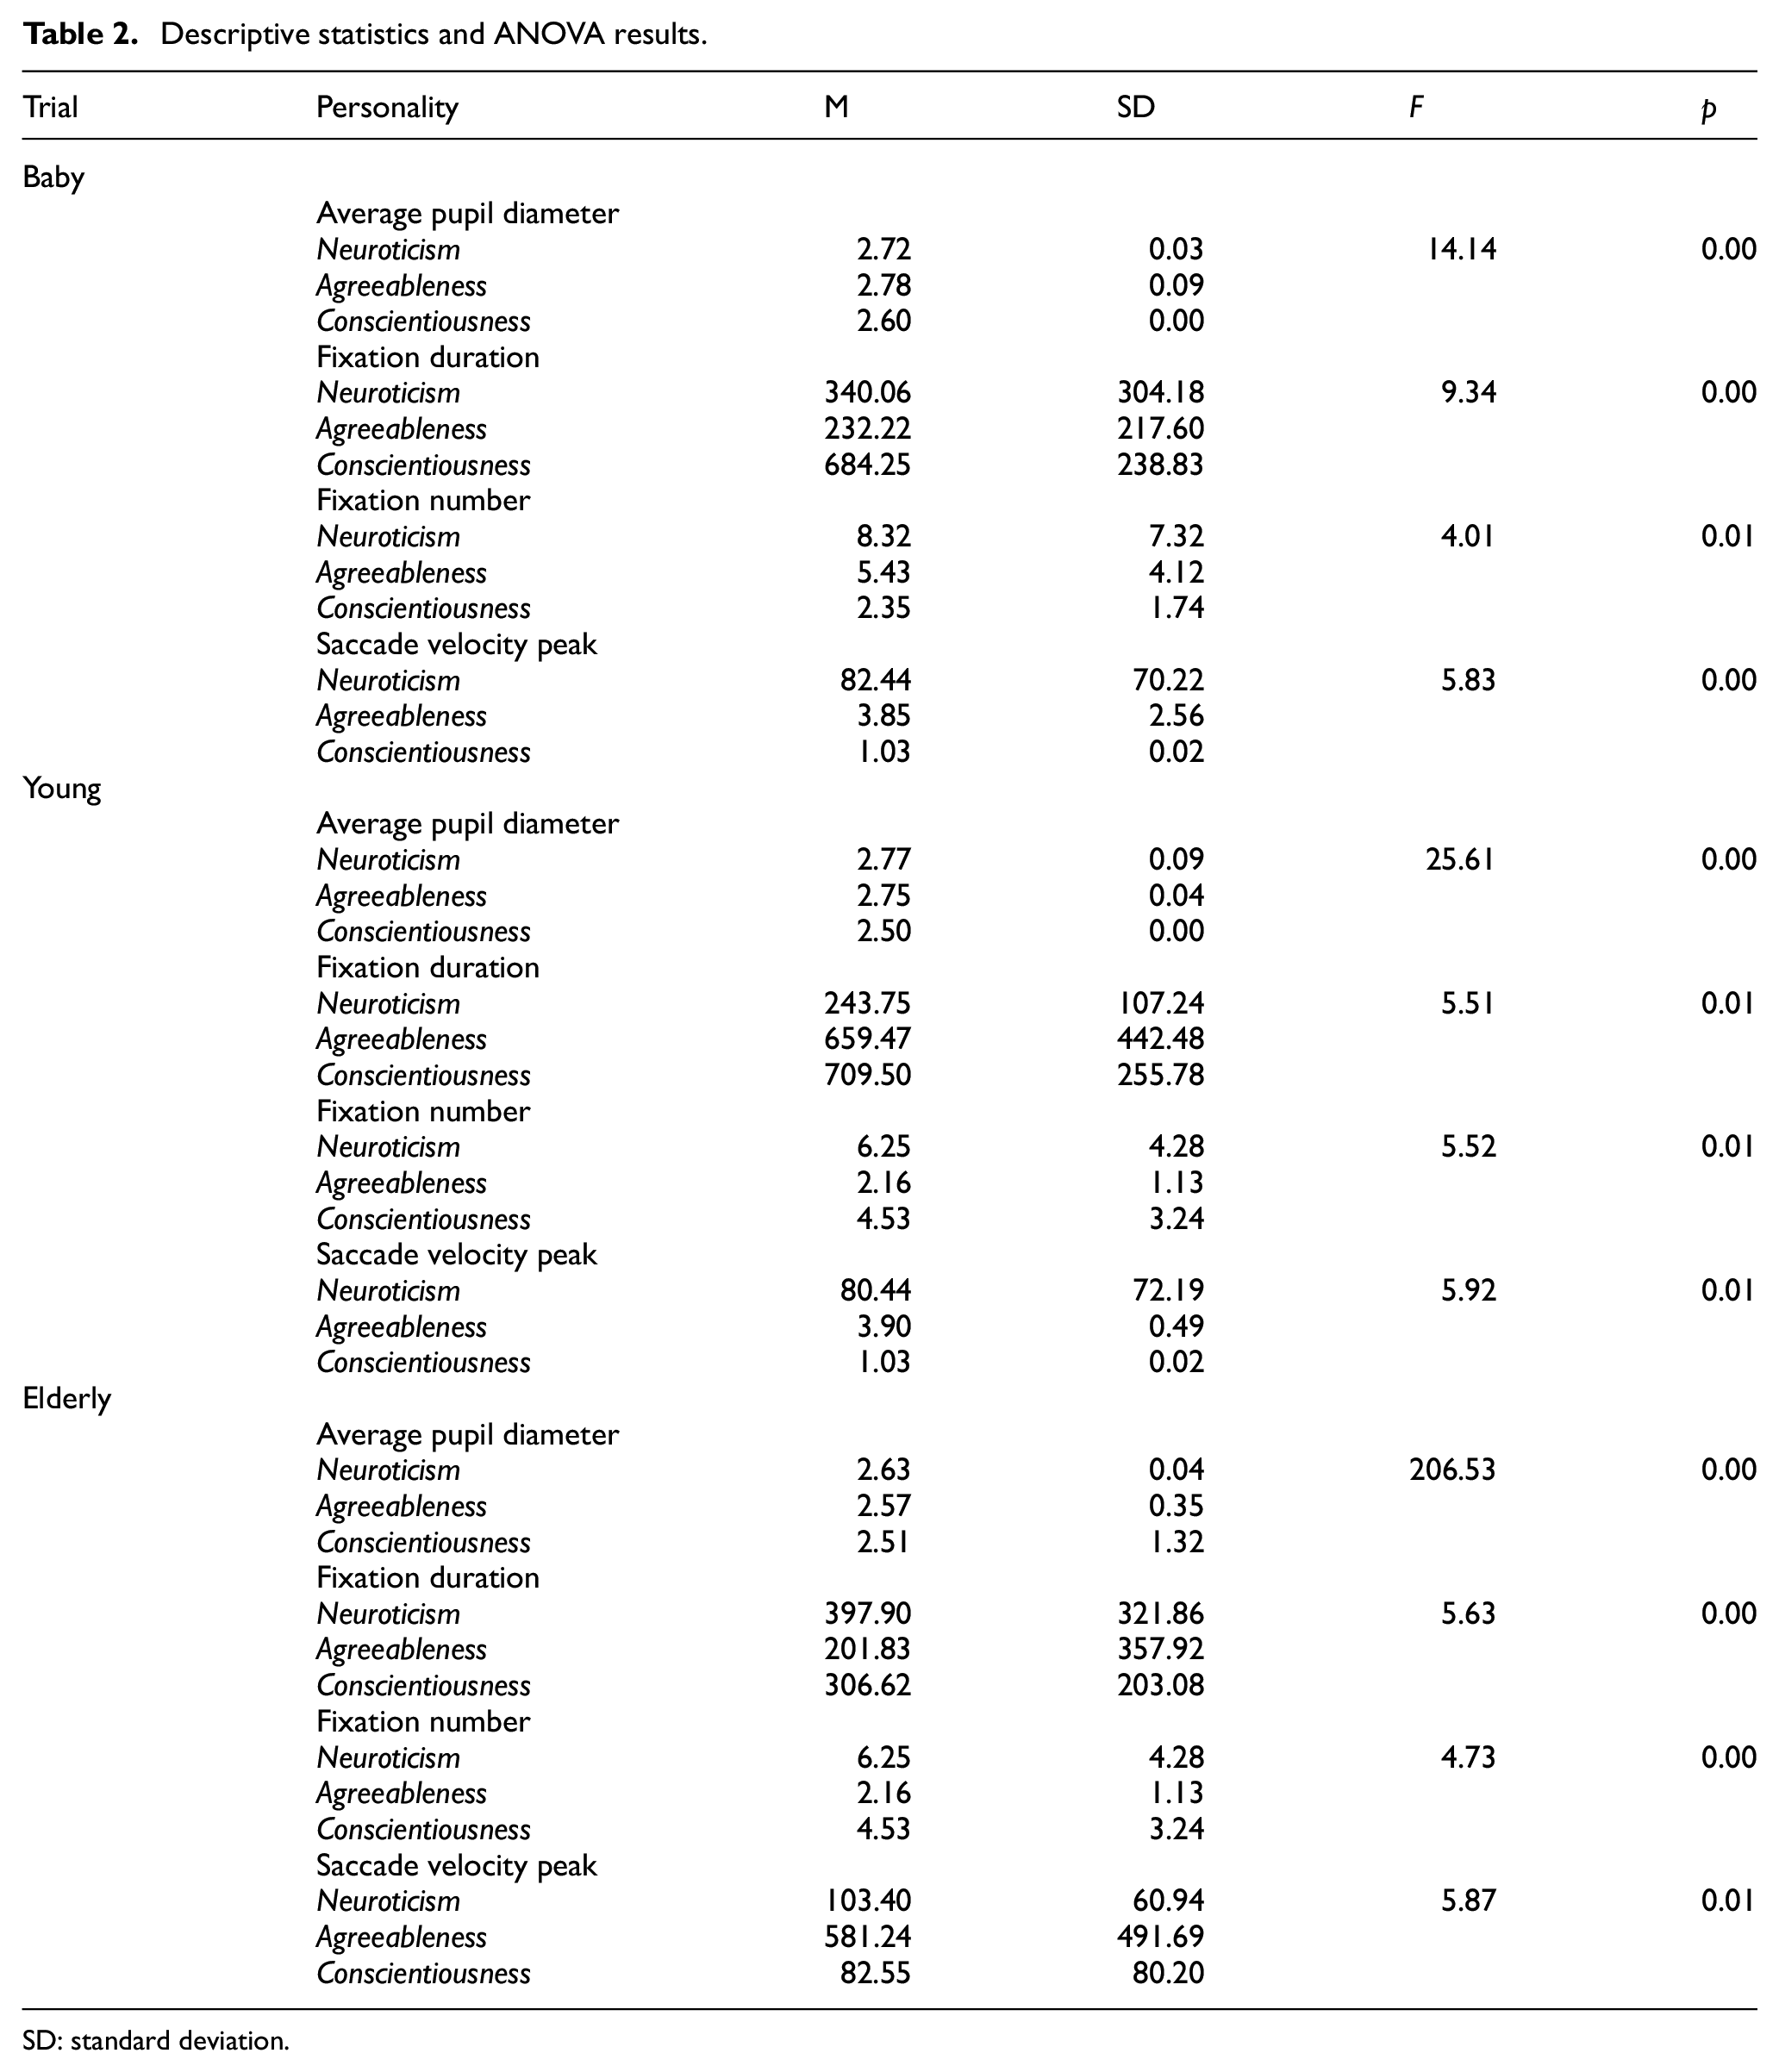
SD: standard deviation.
In the first trial (baby’s face), the participants with high conscientiousness had a smaller average pupil diameter compared with those with high agreeableness and neuroticism. The result of the ANOVA test showed a significant difference (p < 0.05) in the participants’ average pupil diameter, fixation duration, fixation number and saccade velocity peak results while viewing the visual stimuli.
In the second trial, the descriptive results revealed that the high-neuroticism group had the highest average pupil diameter, followed by the high-agreeableness participants and the high-conscientiousness participants. The results showed a significant variation in the pupil diameter, fixation duration and fixation number of the participants according to their personality profile. A significant difference was also observed in the saccade velocity peak among the three groups of personality traits.
In the third trial, the ANOVA result revealed a significant difference in the average pupil diameter among the participants during the visual task. The eye-movement results revealed that the high-neuroticism participants had the largest average pupil diameter, followed by the high-agreeableness participants and the high-conscientiousness participants. We also observed a significant difference in the participants’ fixation duration, fixation number and saccade velocity among the three personality profiles. Figure 2 shows the differences in eye-movement patterns ((a) for pupil diameter, (b) for fixation duration, (c) for fixation number and (d) for saccade velocity peak) for the three personality profiles in each trial. From these, it can be concluded that the different personality groups manifest different viewing behaviours.
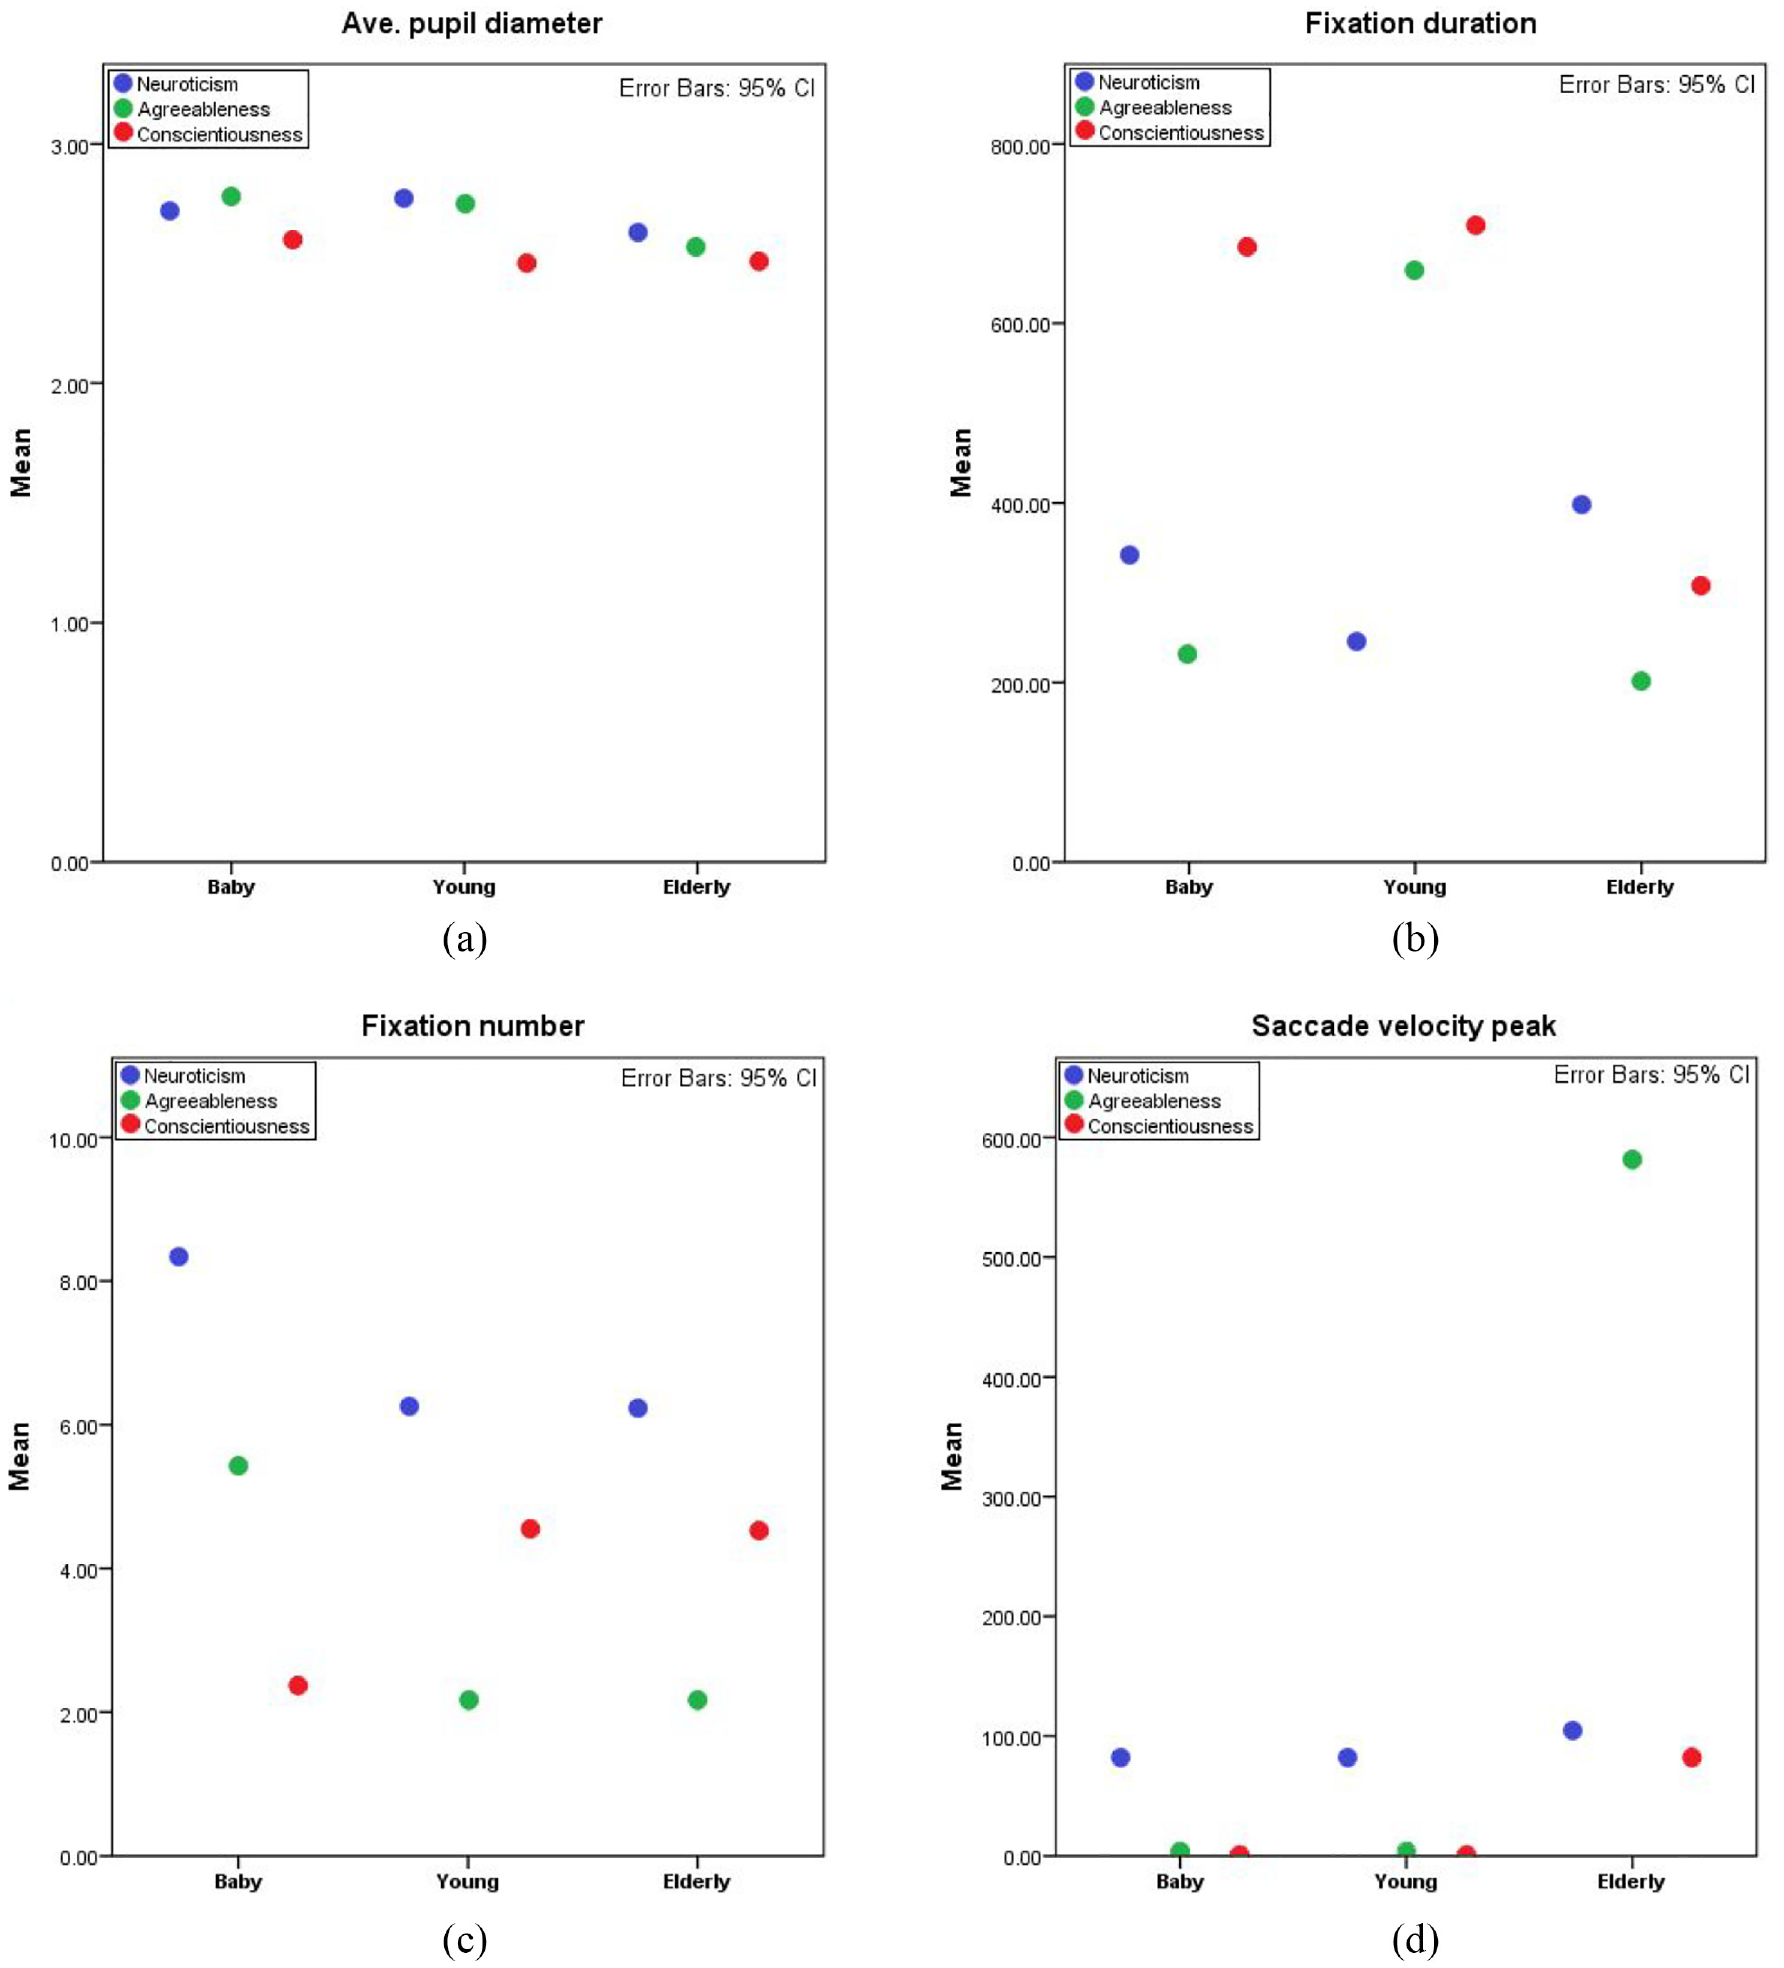
Differences in eye-movement patterns for the three personality profiles.
To further understand the perceptual behaviour of participants, we examined the focus map of their eye-movement across the three trials (see Figure 3). From the figure, it can be assumed that the viewing behaviour of the participants varied according to the specific personality trait they scored high on. Specifically, it was observed that the high-neuroticism subjects scanned extra visual features when processing the faces of different age groups, compared with the subjects who scored high on other personality traits. Furthermore, it was found that the high-neuroticism participants decoded the facial characteristics using the general features of the face. In contrast, the high-agreeableness subjects tended to fixate largely on the upper area of the face (the eye and forehead), while the high-conscientiousness participants were more probably to focus on the middle region of the face in their attempt to decode the visual stimulus.
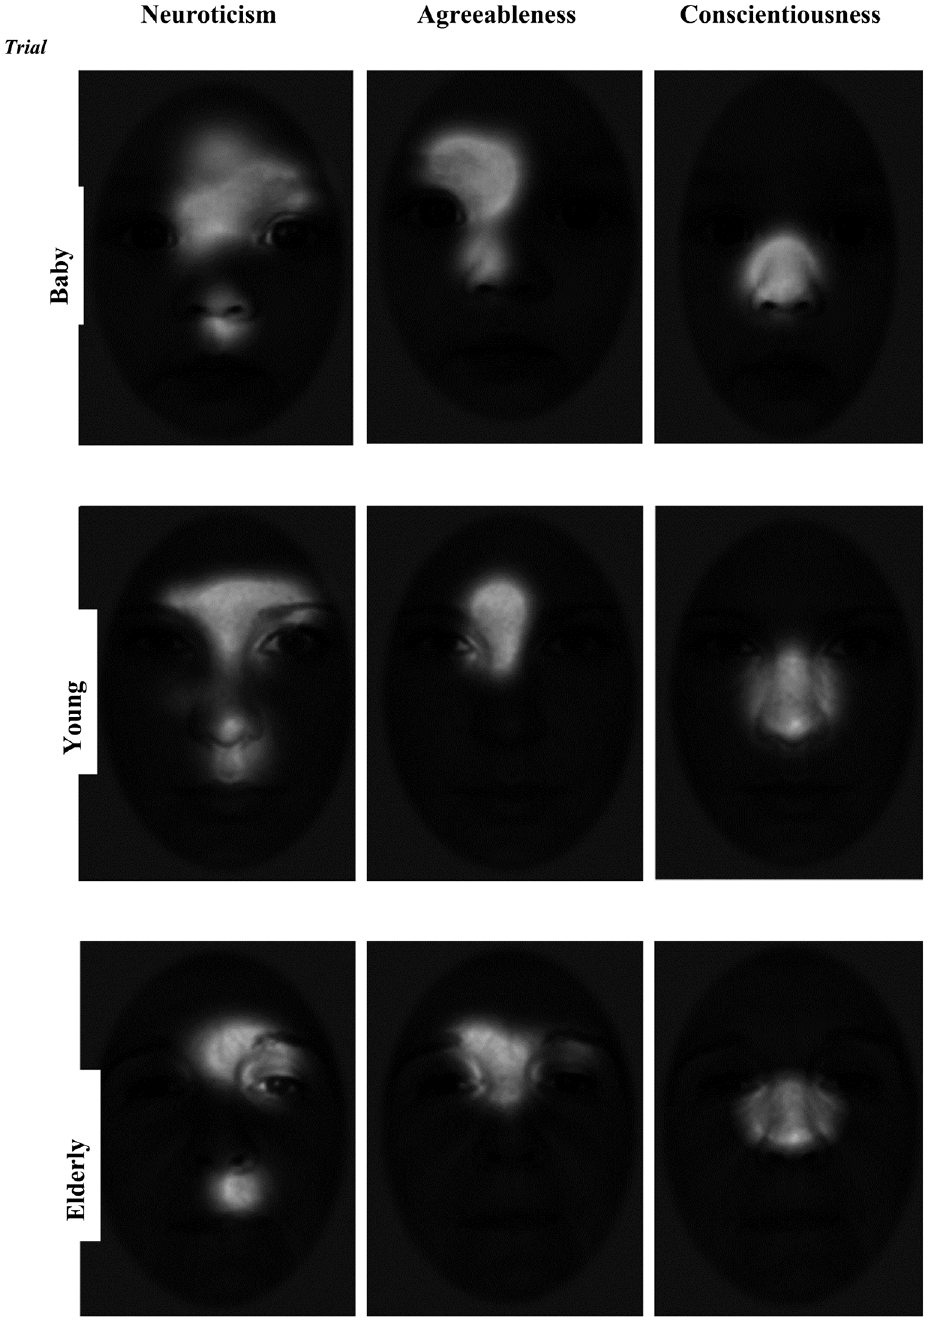
Focus map of users’ viewing behaviour according to their personality traits.
4.2. Classification result
To predict the personality traits of the participants from their viewing behaviour, we utilised four machine learning algorithms – sequential minimal optimisation (SMO) or support vector machine (SVM), random forest, bootstrap aggregating (bagging) and instance-based learner (IBk) – based on the Waikato Environment for Knowledge Analysis (Weka). In addition, a number of evaluation metrics were used to assess the effectiveness of the predictive model. For example, we used the following metrics: accuracy and kappa statistics for their simplicity and computational efficiency [58]; root-mean-squared error (RMSE) for its comparability to the standard error of kappa; receiver operating characteristic (ROC) for its insensitivity to changes in class distribution [59]; and confusion matrix for its role in understanding the performance of each learning algorithm [60]. The parameters of the algorithms were set to the default values proposed in the literature (SVM [61]; random forest [62]; bagging [63] and IBk [64]). The partitioning of data between training and testing subsets was made randomly by the stratified 10-fold cross-validation mechanism in Weka [65]. We used the data of all the 96 participants divided into three clusters. The size of the data consisted of 51,685 records.
Our classification results are summarised in Table 3. The table shows that the SMO classifier has the highest classification accuracy (96.73%), followed by the random forest (82.54%), bagging (74.68%) and IBk (64.51%) algorithms. In addition, the SMO achieved the highest kappa statistic result (95.45%), compared with the random forest (77.27%), bagging (61.27%) and IBk (53.57%) classifiers. In contrast, our result reveals that the SMO has the lowest RMSE (12%), whereas the IBk has the highest RMSE (54%), followed by bagging (39%) and random forest (28%). The ROC result for the three classes revealed that the SMO achieved higher an ROC value, compared with the random forest, bagging and IBk (see Figure 4).
Summary of the classification result.
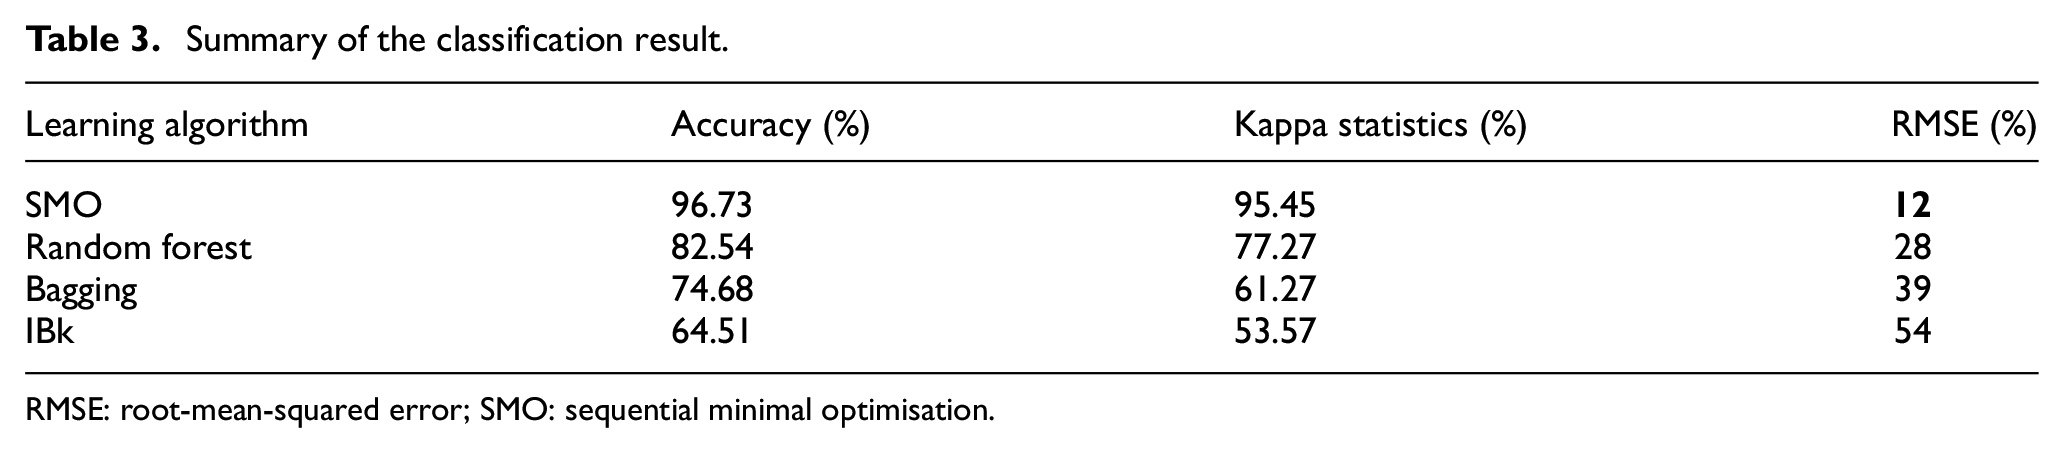
RMSE: root-mean-squared error; SMO: sequential minimal optimisation.
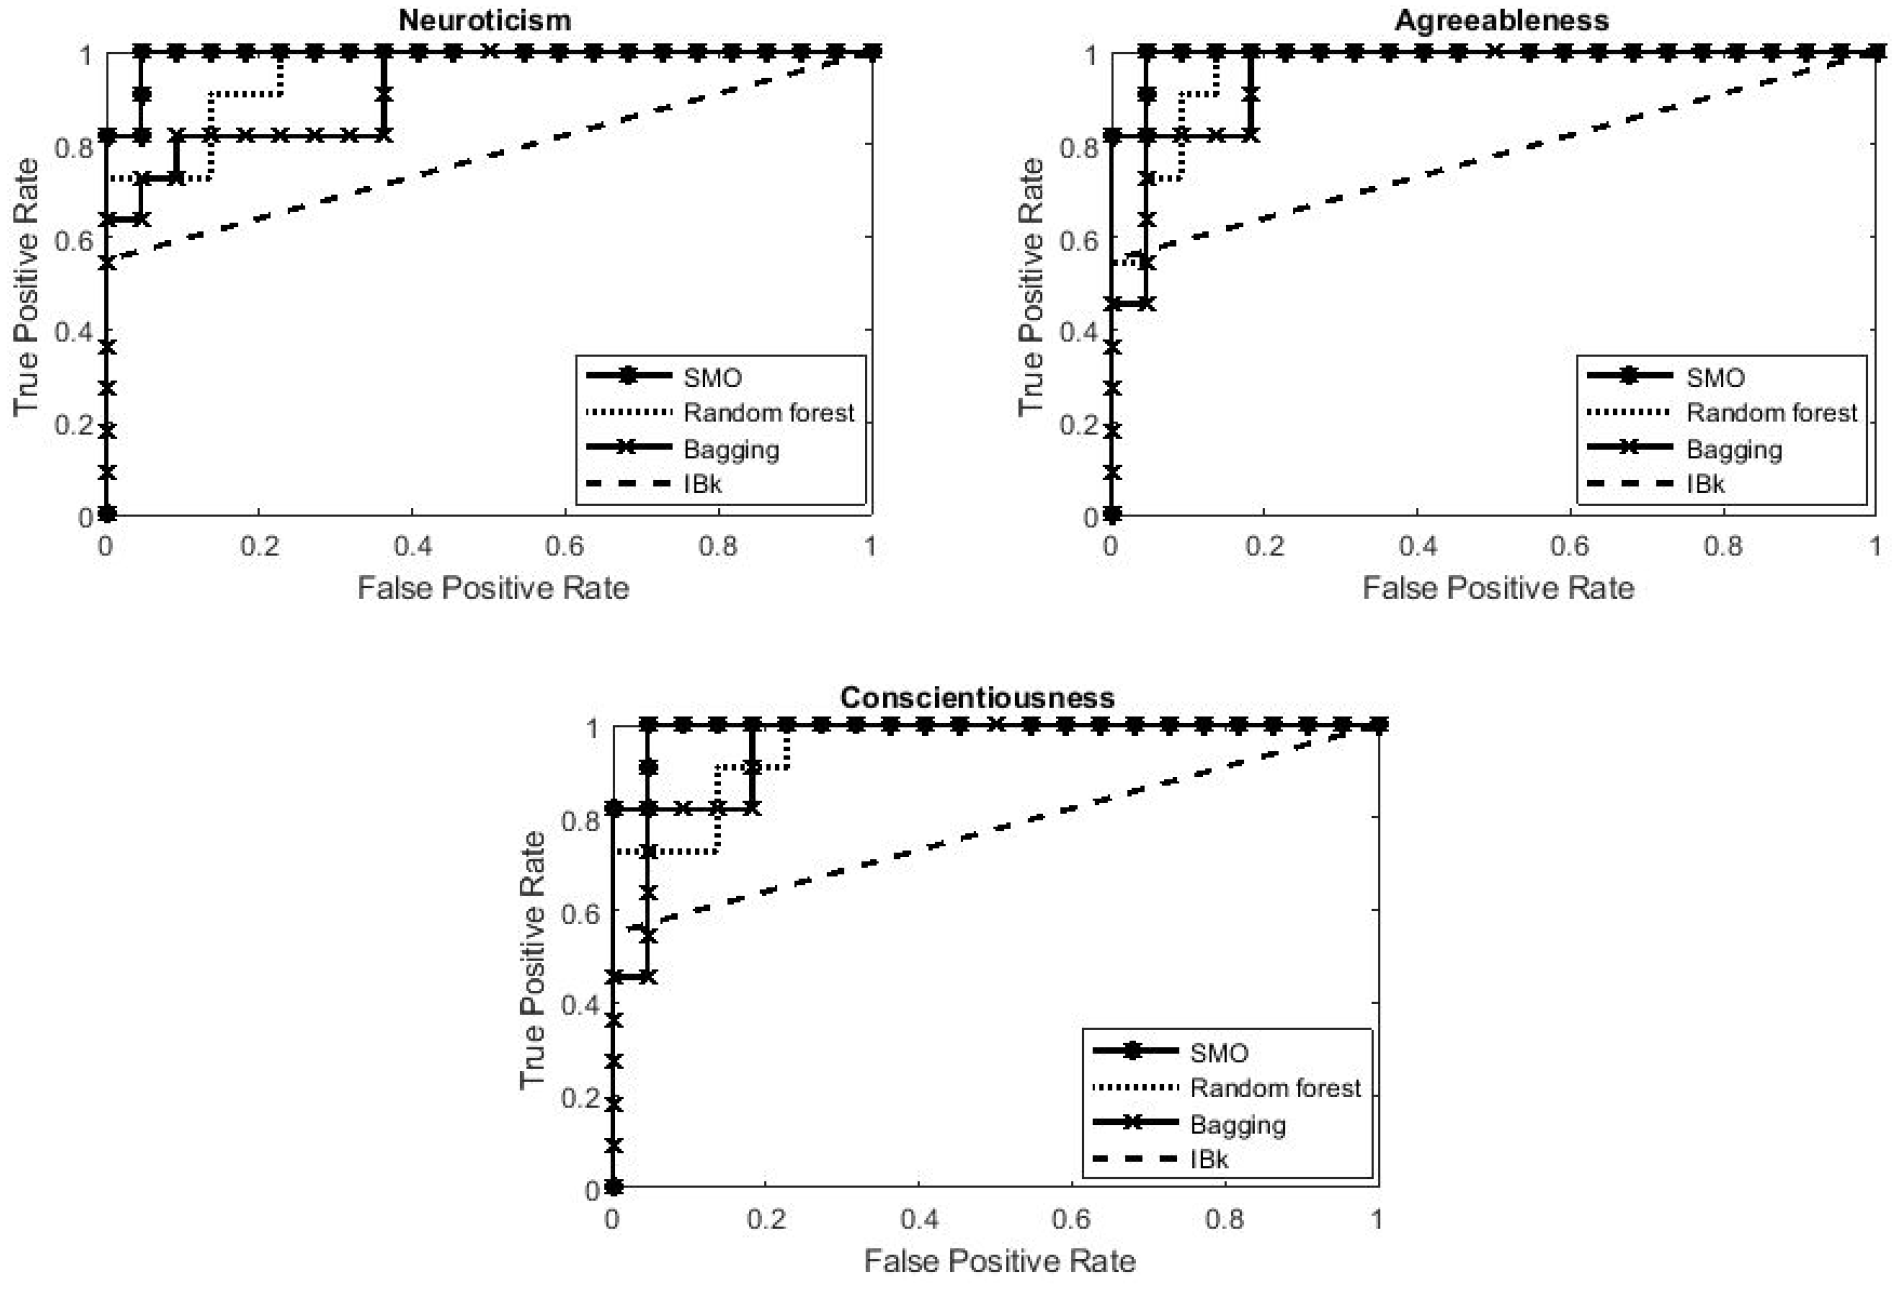
ROC curve of the selected classification algorithms.
Then, a confusion matrix was produced to analyse how a classifier could effectively recognise instances belonging to different classes [66]. This method is commonly used to measure the relationship between predicted and actual instances when representing the instances along the diagonal direction of the confusion matrix. The result of the confusion matrix is displayed in Figure 5, where the value in each cell denotes the ratio of trials identified as the corresponding label (category) to the total number of trials in the actual category. Therefore, by analysing the diagonal of the four confusion matrices, it can be observed that the SMO algorithm demonstrates the highest prediction accuracy based on the actual and predicted classes: 91.70%, 100% and 100% for neuroticism, agreeableness and conscientiousness, respectively.
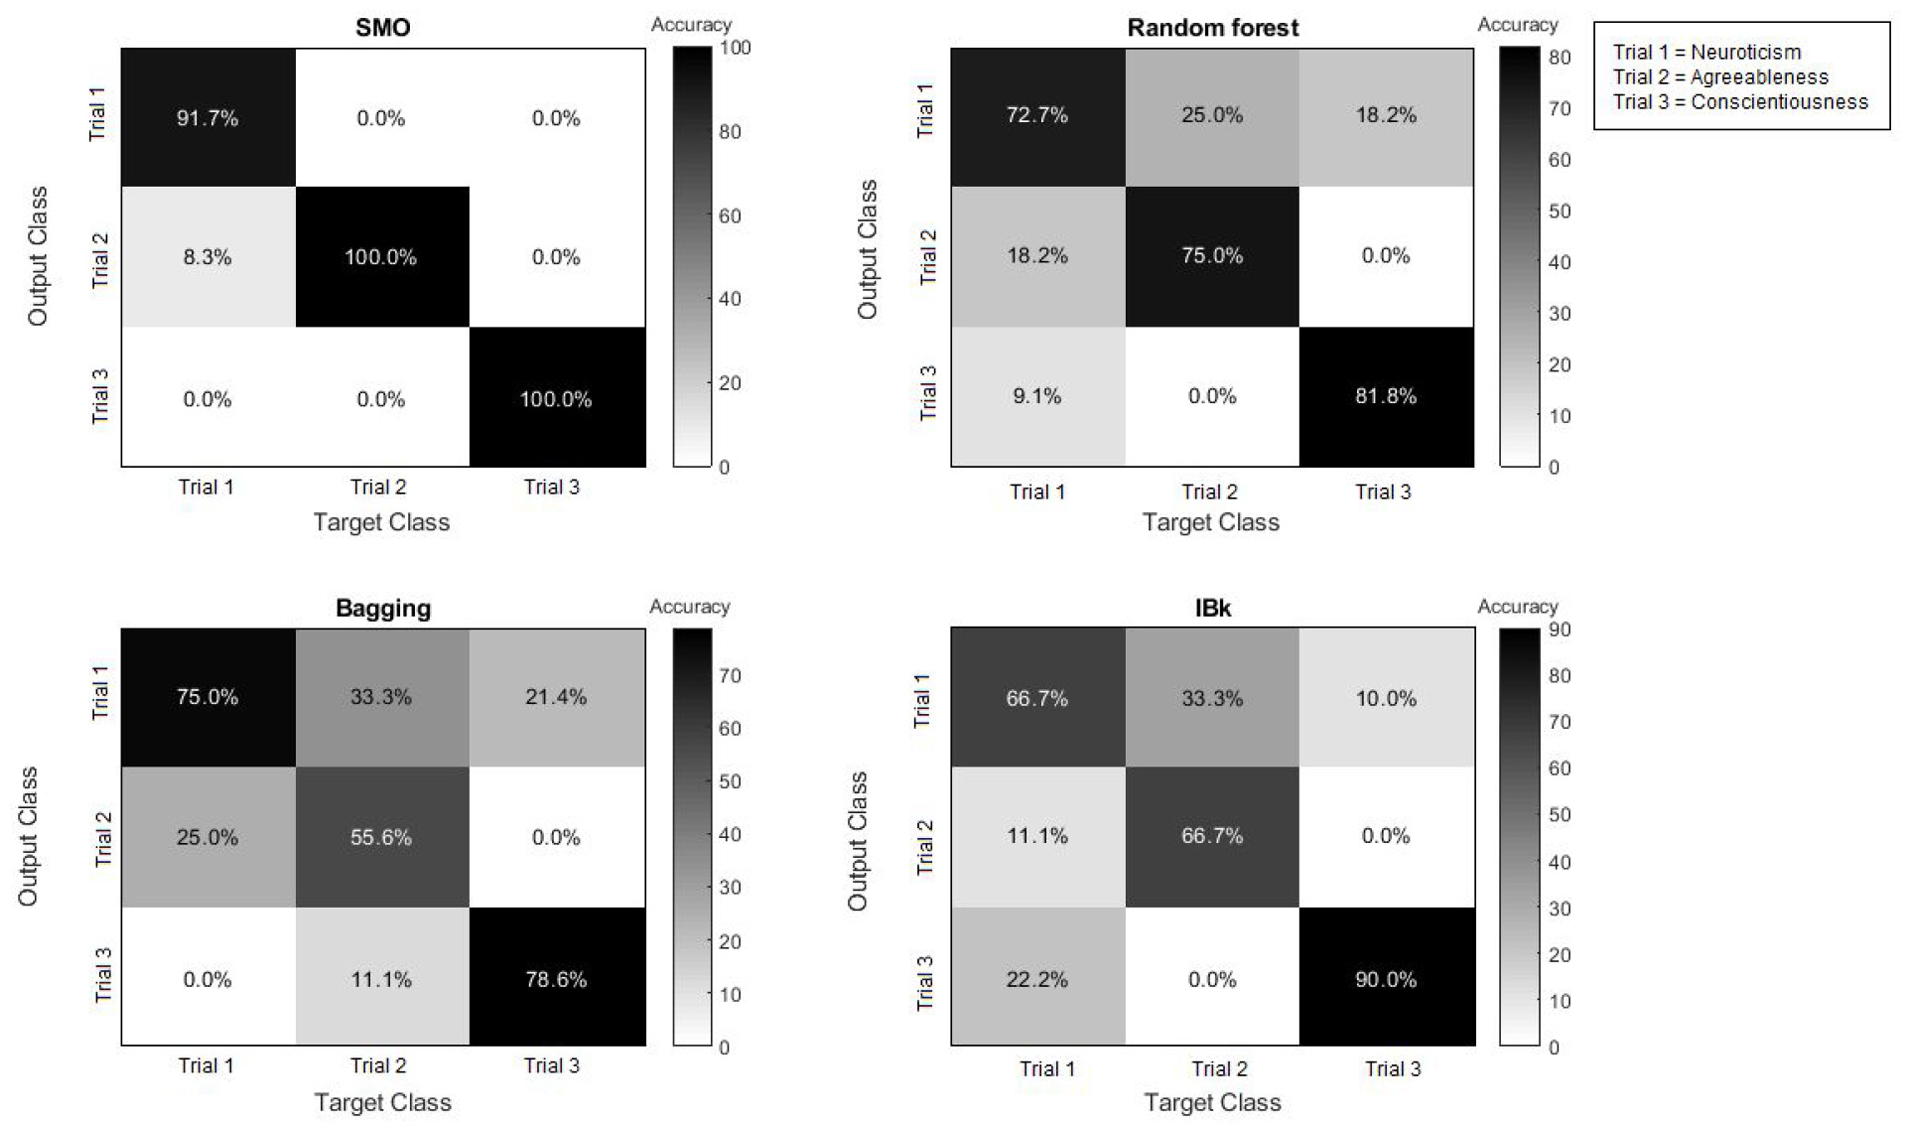
Confusion matrix results.
From these observations, it can be inferred that users’ viewing behaviour can be useful in predicting individual personality traits based on the patterns of eye-movement.
5. Discussion
In this study, we explored the role of personality in shaping users’ viewing behaviour. The results showed three groups of users who scored high on the neuroticism, agreeableness and conscientiousness traits and their corresponding viewing behaviour. The finding revealed that users tended to manifest unique viewing behaviour according to their personality trait. The relationship between the personality and viewing behaviour seems to be attributable to eye-movement during the visual processing task. The interindividual differences arising from the individuals’ personality are probably to influence the attention processes during gazing [67,68]. In line with our findings, studies that examine the relationships between users’ personality dimensions and eye-movement suggest that people with similar traits tend to move their eyes in similar ways [17]. Meanwhile, previous work revealed that both attentional preferences and eye-movement in selective attention during visual processing might be somehow related to individuals’ personality dimensions [21,35,69]. Based on the eye-movement data, it can be suggested that the differences in the users’ personality dimensions may lead to certain preferences and tendencies in terms of visual modality. For instance, users’ viewing patterns when observing the visual stimuli might be subject to their personality type; this influences visual information processing and social gaze behaviour during the viewing task [70]. Our results extend the findings of the literature by demonstrating that eye-movement is regulated by our personality [71]. This is possibly because personality peculiarities have been demonstrated to shape individuals’ response to the stimuli [72]. This finding corroborates previous works on users’ behaviour in their interaction with online content (e.g. online behaviour) where personality traits may play a significant role in shaping individuals’ preferences in the environment [73]. Furthermore, some existing studies aver that there is a correlation between personality and visual experience, and people with high levels of openness were found to spend a longer time fixating and dwelling on locations when watching abstract animations [34], while perceptually curious individuals inspect more of the regions in naturalistic scenes [74]. Consequently, personality may be regarded as a symptomatic expression of certain environmental affects or consistencies of behaviour [75].
In this study, after characterising the eye-movement data, we predicted the subjects’ personality profile based on their viewing behaviour using the SMO classifier. The core of this finding is that informative behavioural features can be automatically determined from a large and diverse set of eye-movement characteristics; this study also uncovers previously unknown links between personality and gaze [17]. Al-Samarraie et al. [20] applied multi-target learning method to predict the continuous dimensions of personality using certain fixation and saccadic eye parameters, and they demonstrated the feasibility of correlating individuals’ personality dimensions and eye-movement behaviour. Our findings also corroborate the work of Lagun et al. [76] about the likelihood of detecting cognitive impairment using automatic classification algorithms to process peoples’ eye-movement data.
6. Implications
Studying people’s viewing behaviour can establish a better understanding of how they process information and learn. The findings of this study have several practical and theoretical implications. From a practical perspective, this study revealed the potential of visual processing behaviour using eye-movements (e.g. viewing behaviour) in predicting the personality characteristics of an individual. In addition, the findings of this work can offer new insights that can enrich the human interaction domain by making it possible to build interfaces that exploit users’ psychological characteristics to provide positive user experience. Personality profile has already been proposed to improve the information processing style of individuals. Based on our findings, personality profile and eye-movement behaviour of online users could be further incorporated to personalise the design of user interfaces. For example, a visual processing design taxonomy could be developed to facilitate individuals’ recognition of visual stimuli in accordance with their personality. In terms of application, the eye-movement pattern of online users can be used as a passive, non-invasive source of input to infer the characteristics of their personality. Our analysis of eye-movement data revealed a unique opportunity for considering the personality dimensions in assessing the viewing patterns of individuals, which can benefit facial recognition research and enhance the visual processing experience of online users.
From a theoretical standpoint, this study provides a novel approach to characterising individuals’ personal preferences, thus contributing to the general recognition theory and signal detection theory by underscoring the different notions of personality and how it can be defined and predicted from individuals’ viewing behaviour. Furthermore, the findings of this study extend the Big-Five personality model by providing more evidence about the relationship between individuals’ personality traits and their eye-movement behaviour. The findings of the current work also have significant implications for the holistic face processing theory and provide a justification for the perceptual encoding process of visual information that is extremely essential in face-to-face communication. In addition, the findings of this study will provide additional knowledge on the information processing theory in a way that will underscore the differences between people observing the same stimuli. More specifically, from our focus map result, it can be observed that it is necessary to factor in individual peculiarities when interpreting visual stimuli, and the personality profile plays a crucial role in selecting and processing information in particular areas in the stimuli (we may call these areas as ‘preferred areas’). In addition, this study highlights the link between the information processing style and the personality type; thus, different personality traits manifest different information processing styles. From our findings, it can be observed that specific preferences can be linked to our personality and can be a clue to effectively personalising visual stimuli. It is also assumed that different personality traits correspond to different attention levels and, thus, different capacities to handle mental work. For this reason, this study contributes to the capacity model of attention theory by highlighting the potential relationship between the mental effort corresponding to personality types and the resultant viewing behaviour associated with it. Finally, the findings of this study can support the Schachter–Singer two-factor theory of emotion stating that emotion is based on physiological and cognitive factors. In this context, our result can explain the potential relation between the preferred areas in the stimuli according to the personality and the emotion associated with these areas. In other words, different personalities will react differently to specific areas in the stimuli. These differences contribute to the uniqueness of the viewing behaviour corresponding to the personality.
7. Limitation and future works
This study has a number of limitations that need to be addressed in the future. We used three facial stimuli composed of individuals of different age groups (baby, young and elderly) to demonstrate the differences in users’ viewing behaviour according to their personalities. Future studies can explore other visual stimuli, such as emotional expressions and natural scenes. Another limitation of the study pertains to the personality traits; we used only three dominant personalities (neuroticism, agreeableness and conscientiousness). Future work can examine and compare the viewing behaviour of users based on other personality dimensions. Our eye-movement data consisted of average pupil diameter, fixation duration, fixation number and saccade velocity peak because these are the most common parameters used in eye-movement studies. In the future, researchers can inspect other eye parameters and investigate their effect on the performance of the predictive model. In addition, this study used the parametric method via the ANOVA test due to the popularity of this statistical approach. Future researchers can deploy other non-parametric tests and examine the similarities and/or differences between the groups. Furthermore, the correlation between the participants’ characteristics, such as age, and eye-movement behaviour was not examined in this study. Exploiting this correlation may provide some insights into the users’ behaviour in the groups under examination. This includes studying potential interactions between personality traits in a setting similar to the current work. In addition, future studies can extend this work by investigating the relationship between personal features and eye-movement behaviour to characterise the user preferences when viewing a display. Moreover, in our work, we relied on the four most frequently deployed machine learning algorithms in similar tasks, SMO or SVM, random forest, bagging and IBk. We recommend that future studies examine additional algorithms to find the best classification scheme. Researchers can also consider applying other types of classificatory methods, such as the multi-label classification. By doing so, it would be possible to predict multiple aspects simultaneously. An additional limitation of our work is its use of several evaluation metrics: accuracy, kappa statistic, RMSE, ROC and confusion matrix. These robust metrics were used in the literature to accurately estimate the merit of the prediction capability of the classifiers. Furthermore, in this study, we relied on stratified 10-fold cross-validation, a powerful mechanism for assessing the overall learning process. In this context, future scholars can examine the correlation between the fold numbers and examine the prediction result associated with this change. In the future, researchers can also utilise another test-based approach, such as leave-one-out cross-validation or bootstrap, to vary the samples used in the training set, which plays a significant role in the prediction process.
8. Conclusion
This study examined the role of personality traits in modulating users’ viewing behaviour. For this purpose, the Big-Five personality dimensions and eye-movement data of 96 participants viewing the faces of individuals in different age groups were obtained. This study found three dominant personality traits: neuroticism, agreeableness and conscientiousness. The eye-movement results demonstrated that users who scored high on the same personality traits exhibit similar tendencies during visual processing of human faces. We also proposed a model for predicting the users’ personality profile of neuroticism, agreeableness and conscientiousness based on their viewing behaviour (eye-movement parameters). The findings of this study offer new insights that can enrich visual recognition and processing of facial expressions, as well as personality-related research. Our findings also contribute to the holistic face processing theory and the perceptual encoding processing of visual information.
Footnotes
Author’s note
Samer Muthana Sarsam is now affiliated with the Department of Business Analytics, Sunway University Business School, Sunway University, Selangor, Malaysia.
Author contributions
S.M.S. and H.A.-S. contributed to the conceptualisation, methodology and results of this study. A.I.A. contributed to visualisation and discussion of this study. All authors contributed to the reviewing and editing of this article.
Declaration of conflicting interests
The author(s) declared no potential conflicts of interest with respect to the research, authorship and/or publication of this article.
Funding
The author(s) disclosed receipt of the following financial support for the research, authorship and/or publication of this article: This work was funded by the Researchers Supporting Project (RSP2020/157), King Saud University, Riyadh, Saudi Arabia.