
Abstract
Adopting a person-centered approach with longitudinal data, our study examined the stability and transitions of loneliness profiles across three consecutive years, during adolescence. We also explored the lasting effects of loneliness and the role of intraindividual characteristics—sex, self-worth, social acceptance, friendships competence, and social withdrawal—in predicting transitions between profiles. Data were collected from an initial sample of Portuguese adolescents (N = 721; 47.9% boys). Latent transition analyses revealed four loneliness profiles: Non-lonely (most stable), Highly lonely (least stable), Peer-related lonely (increasingly stable), and Family-related lonely (decreasingly stable). Most adolescents transitioned to profiles with lower loneliness, except those in the Family-related profile, who tended to move toward the Highly lonely profile. Our findings also suggest lasting effects, as adolescents with a history of loneliness were more likely to report feeling lonely again later. Intraindividual characteristics also impacted on the transitions among profiles. Overall, these findings highlight the importance of recognizing loneliness as a multidimensional experience with a potentially discontinuous developmental trajectory.
Keywords
Introduction
Loneliness refers to the subjective experience of a perceived discrepancy between desired and actual social relationships (Peplau & Perlman, 1982). It involves painful and distressing feelings stemming from dissatisfaction with the quantity or quality of one’s social relationships. This discrepancy can reflect a lack of close, meaningful relationships or a sense of not belonging within social groups (Hyland et al., 2019; Qualter et al., 2015). The complex and multifaceted construct of loneliness holds relevance during adolescence, which is widely recognized as a developmental period when loneliness tends to peak (e.g., Qualter et al., 2015).
As adolescents strive for greater autonomy and independence, they often distance themselves—both physically and emotionally—from their parents and family members, while still relying on them for emotional support (Bowker et al., 2021). This developmental transition can lead to unmet social needs within the family context, potentially giving rise to loneliness (Danneel et al., 2018). At the same time, peers become increasingly important sources of belonging, validation, and identity. Developing and maintaining close, emotionally meaningful peer relationships becomes a central developmental task, and adolescents who struggle in this domain may experience loneliness (Eccles et al., 2020; Rubin et al., 2009).
In this context, several researchers have emphasized the importance of distinguishing between different types of loneliness, as they may lead to distinct developmental outcomes. For instance, Weiss (1973) proposed that different types of relationships may offer different social provisions, and thus, deficiencies in these relationships give rise to different forms of loneliness—social loneliness, which arises from the absence of a broader, engaging social network, and emotional loneliness, which stems from the lack of a close, emotionally intimate dyadic relationship.
Although distinctions between different types of loneliness are increasingly recognized, most studies still focus on global loneliness (Geukens et al., 2022). For instance, a recent meta-analysis by Mund et al. (2020) reported that 62% of studies assessed only global loneliness, with few simultaneously capturing distinct facets such as social and emotional loneliness. Moreover, existing research often uses variable-centered approaches, overlooking how different types of loneliness co-occur and vary across social contexts like family and peers. Social and emotional loneliness, within both family and peer contexts, are present to some extent in most individuals and may vary across different periods of life. Only a few have used a person-centered approach to explore adolescent loneliness. Some studies have examined relationship-specific loneliness and attitudes toward solitude (Maes et al., 2015; Vanhalst, Goossens, et al., 2013), others focused on social and emotional loneliness (Shevlin et al., 2014), and only one study considered both dimensions across family and peer contexts (Ribeiro et al., 2022). These studies typically identified four to six distinct profiles, including adolescents with high or low loneliness across both contexts, or high loneliness in only one. One study also highlighted both qualitative and quantitative variations in loneliness experiences (Shevlin et al., 2014).
In addition to being rare, these person-centered studies were cross-sectional and did not provide insights into the developmental course of loneliness. Overall, longitudinal research on this topic remains scarce (e.g., Hutten et al., 2021). Among the few longitudinal studies available, most adopt a variable-centered approach and conceptualize loneliness as a stable developmental process. Some have identified three to six distinct developmental trajectories of loneliness from childhood to young adulthood, characterized by different levels and directions of change (e.g., Eccles et al., 2020; Qualter et al., 2013; Schinka et al., 2013; Vanhalst, Goossens, et al., 2013). Overall, most adolescents report consistently low levels of loneliness, while some show slight decrease over time (e.g., Qualter et al., 2013; Vanhalst, Goossens, et al., 2013), or an increasing in peer-related and a decrease in parent-related loneliness (e.g., Danneel et al., 2018).
While research on loneliness transitions in adolescence is scarce, some adult studies show that loneliness can develop discontinuously. Life changes like widowhood or divorce predict transitions into loneliness, while better health and social engagement predict recovery (Hawkley & Kocherginsky, 2018; Sheftel et al., 2024). However, these studies focus on general loneliness, not in relationship-specific forms. To date, no research has explored loneliness transitions during adolescence using relationship-specific measures, an important gap that our study aims to fill.
Addressing gaps and limitations identified in previous research, our study uses a person-centered, longitudinal approach that simultaneously considers social and emotional loneliness within both peer and family contexts. From a developmental perspective, we use latent transition analysis (LTA) to examine how adolescents may move between distinct loneliness profiles over time, highlighting its dynamic nature.
LTA provides a flexible, person-centered approach to examining developmental changes by modeling transitions between latent profiles over time. Unlike growth curve models, which assume continuous change, LTA captures discontinuous shifts across multiple timepoints. In our study, we combined latent profile analysis (LPA) to identify distinct loneliness profiles with a structural model that tracks transitions across three assessment timepoints, allowing us to analyze how adolescents move between mutually exclusive profiles over time.
Influence of Intrapersonal Characteristics on Transitions Among Loneliness Profiles
Previous research has consistently linked loneliness to individual characteristics such as social withdrawal, sex, and self-esteem (Mahon et al., 2006). Socially withdrawn adolescents often experience fewer positive peer interactions, which can hinder relationship formation and increase loneliness (Spithoven et al., 2017). Similarly, low self-esteem has been associated with both the development and persistence of loneliness (Danneel et al., 2020; Vanhalst, Goossens, et al., 2013). In contrast, feeling socially accepted and perceiving oneself as competent in forming close friendships may serve as protective factors. Adolescents who believe they can initiate and maintain close peer relationships tend to report lower levels of loneliness over time. These self-perceptions promote greater social engagement, more effective conflict resolution, and deeper engagement in relationships (Spithoven et al., 2017; Vanhalst, Goossens, et al., 2013). Conversely, those with low friendship competence may avoid social situations, feel insecure about their social skills, and face a higher risk of persistent or worsening loneliness (Danneel et al., 2020).
Although related, perceived social acceptance and friendship competence are conceptually distinct from loneliness. Adolescents may feel accepted by peers but still experience loneliness by desiring a greater number of peer relationships. Likewise, they may feel socially competent but still feel lonely, if they perceived that peer support is lacking (Danneel et al., 2020).
Despite these well-established associations, it remains unclear whether such individual characteristics predict changes in loneliness over time. Thus, our study examined whether sex, perceived social acceptance, self-worth, friendship competence, and peer-reported social withdrawal predicted transitions between loneliness profiles across adolescence.
The Present Study
To our knowledge, no previous study has used latent transition models to examine the development of adolescent loneliness, except for Hammond et al. (2022), which focused on adult populations. We adopt a longitudinal approach to analyze profile stability and change, the influence of early loneliness experiences, and the role of individual characteristics in these developmental trajectories.
The first aim of our study was to identify distinct profiles of adolescents based on their experiences of loneliness. We simultaneously considered social and emotional loneliness, as they related to peers and family, using LPA. Consistent with findings from Ribeiro et al. (2022), we expected to identify four groups: (1) a group that is highly lonely (social and emotionally) within both peers and family contexts; (2) a group that is not lonely across all four manifestations of loneliness; (3) a group that is highly social and emotional lonely in the peer context only; and (4) a group that is social and emotional lonely in the family context only. This cross-sectional profile identification was conducted at each of the three assessment timepoints to examine whether similar profiles emerged consistently over time.
Our second aim was to extend previous research by analyzing transitions and patterns of change among adolescents’ loneliness profiles across three consecutive assessment timepoints, using LTA. This approach allowed us to examine not only the stability of individual membership within specific profiles over time but also the dynamics of movement between qualitatively distinct loneliness experiences.
Our third aim was to test whether the adolescents’ early loneliness profile predicted the latter one. Understanding longer-term patterns in loneliness is crucial, as research suggests that persistent or chronic loneliness can contribute to cumulative socio-emotional risks or vulnerabilities.
Finally, our fourth aim was to explore how intrapersonal variables—such as sex, perceived social acceptance, friendship competence, self-worth, and peer-perceived social withdrawal—might help explain heterogeneity in transitions between loneliness profiles over time. Using LTA with covariates, we aim to identify not only who belongs to specific profiles, but also who is more likely to remain in or shift between them.
Method
Participants
For three consecutive academic years, students in Grades 7 through 9, attending three Portuguese public junior high schools in the Lisbon metropolitan area, were invited to participate in our study. Participants first completed the measures as seventh graders and then annually thereafter. The sample comprised 721 adolescents (345 boys; 47.9%) at the first assessment timepoint, 455 (229 boys; 50.3%) at the second, and 252 (128 boys; 50.8%) at the third. The mean age of participants at each of the assessment points was 12.66 (SD = .83), 13.59 (SD = .81), and 14.61 (SD = .75), respectively.
Procedure
During the second trimester of each academic year, with all necessary ethical approvals, parental consent, and adolescents’ assent, participants completed paper-and-pencil questionnaires at school. A research assistant supervised the process, clarified doubts, and emphasized confidentiality, voluntariness, and independent responses. Personal data collection and processing were carried out by recommendations of APA Ethical Guidelines, in compliance with the Declaration of Helsinki, ensuring the privacy and confidentiality of participants’ information. The assessment protocol was approved by ISPA—Instituto Universitário Ethical Committee and MIM (0578000013).
Measures
Self-Reported Loneliness
Participants completed the Portuguese version (Ribeiro et al., 2019) of the Relational Provision Loneliness Questionnaire (RPLQ; Hayden-Thomson, 1989), to assess social and emotional loneliness. This 28-item multidimensional measure assesses subjective feelings of loneliness through two aspects of social dissatisfaction (lack of group integration or social loneliness; lack of personal intimacy, or emotional loneliness) experienced in two different social contexts—peers and family. The measure comprises four subscales: (1) peer-group integration (e.g., “I feel in tune with other young people”); (2) peer-personal intimacy (e.g., “I have a friend I can tell everything to”); (3) family-group integration (e.g., “I feel that I usually fit in with my family”); and (4) family-personal intimacy (e.g., “I have someone in my family I can tell everything to”). Participants rate how true each statement is for them, on a 5-point Likert-type scale ranging from 1 (not at all true) to 5 (always true). In this study, all item scores were reverse coded, with higher scores on each subscale indicating higher levels of loneliness. In our sample, Cronbach’ α for the subscales were high ranging between .85 and .92.
Peers Perceived Social Withdrawal Behavior
The Portuguese version (Correia et al., 2014) of the Extended Class Play (ECP; Burgess et al., 2006) was used to measure adolescents’ social withdrawn behavior. This 37-item peer nominations questionnaire assesses six dimensions of social functioning and reputation: aggression, social withdrawal, peer exclusion, peer victimization, prosocial behavior, and sociability/popularity. In the present study, only the social withdrawal subscale was used (e.g., “Doesn’t talk much or talks quietly”). Participants were instructed to pretend to be the directors of an imaginary class play and to nominate one boy and one girl from among their participating classmates for each of 37 positive and negative roles. To eliminate possible sex stereotyping, only same-sex nominations were considered (Zeller et al., 2003) and, additionally, to adjust for the numbers of nominations and nominators, all item scores were standardized in terms of sex and classrooms. Peer nomination procedures are highly reliable (Burgess et al., 2006), and Cronbach’ α for the subscale used in our study was .87.
Perceived Social Acceptance, Close Friendships, and Self-Worth
To assess self-perceptions of social acceptance, friendship competence, and self-worth, participants completed the Portuguese version (Peixoto et al., 1996) of the Self-Perception Profile for Adolescents (SPPA; Harter, 1988). This 40-item instrument comprises seven domains: scholastic competence, social competence, athletic competence, physical appearance, romantic appeal, behavioral conduct, and friendship competence, with an additional subscale for global self-worth. Each item presented two opposing statements (e.g., “Some teenagers do very well at their classwork” BUT “Other teenagers don’t do very well at their classwork”), and participants chose which statement best described them, followed by a rating of how true it was on a 4-point scale (1 = Really true for me, 2 = Sort of true for me, 3 = Sort of true for me, 4 = Really true for me). Half of the items in each domain were phrased with the negative statement first to balance responses and reduce social desirability bias. In our study, only the subscales of social acceptance, friendship competence and global self-worth were used, with Cronbach’s alphas for these subscales being .75, .85, and .75, respectively.
Results
Plan of Analysis
Data analyses were conducted using Mplus Statistical Package—version 7.4 (Muthén & Muthén, 1998–2015), applying latent variable modeling to cross-sectional and longitudinal data. LPA and LTA were used to identify profiles and examine changes over time (Collins & Lanza, 2010). All models were estimated using full information maximum likelihood (FIML) to handle missing data (Collins & Lanza, 2010), an approach that is particularly well-suited for longitudinal studies with participant attrition.
The analysis began with the selection of a measurement model (Nylund, 2007) that accurately captured distinct patterns of loneliness and allowed for the examination of how different types of loneliness co-occur in family and peer contexts. At each of the three assessment timepoints, LPA models ranging from one to six profiles were tested to identify the optimal number of subgroups reflecting adolescents’ loneliness patterns. Model selection was guided by empirical fit indices as well as the interpretability and theoretical relevance of the profiles.
Models were specified using standardized mean scores from the four RPLQ subscales: Peer Group Integration, Peer Personal Intimacy, Family Group Integration, and Family Personal Intimacy that capture social and emotional loneliness across peer and family contexts.
To identify the optimal number of loneliness profiles, we used multiple criteria, as no single index can definitively determine the best-fitting LPA model. The Bayesian information criterion (BIC) and the sample-size adjusted BIC (SABIC) were the primary fit indices, with lower values indicating better model fit. Model comparisons were further supported by the Vuong–Lo–Mendell–Rubin likelihood ratio test (VLMR-LRT) and the bootstrapped likelihood ratio test (BLRT), where significant p-values indicate that adding an additional profile improved model fit (Nylund, 2007). Classification quality was assessed using entropy (values closer to 1 indicate clearer separation) and average posterior probabilities (AvePP > .70). Beyond statistical fit, theoretical interpretability was key to model selection. Once the measurement models were established, we tested LTA models for measurement invariance, transition effects, and covariate influences, using likelihood ratio tests (LRT) and regression coefficients.
Descriptive Statistics of All Variables
Means and standard deviations for all study variables at each assessment timepoint are presented in Table S1. Correlations among variables across all timepoints are shown in Table S2, with most associations reaching statistical significance. Globally, across time, all types of loneliness were positively associated with peer-reported socially withdrawn behaviors and negatively associated with self-perceptions of social acceptance, friendship competence and self-worth.
Latent Profiles Solutions of Loneliness for Each of Three Assessment Timepoints
LPA were conducted separately for each of the three assessment timepoints, testing models with one to six profiles. Table 1 presents the models fit indices, entropy values, and class prevalence proportions. Across all timepoints, increasing the number of profiles improved the model fit, as indicated by decreasing BIC and SABIC values, and increasing log-likelihood (LL). The BLRT p-values remained significant for all comparisons, supporting a better fit for models with more profiles. However, the VLMR-LRT favored a four-profile model over a three-profile model at Time 1 (p < .036) and marginally at Time 2 (p < .071), but not at Time 3 (p < .111), suggesting that a three-profile solution might be sufficient. Nonetheless, the BLRT results, along with theoretical considerations, supported the four-profile solution as the best-fitting model. Entropy values for the four-profile models were high (.88 – .89), indicating an accurate classification. AvePPs exceeded .80 for all profiles, and latent class probabilities ranged from .85 to .98, reflecting a good class separation (Table 2). Each profile included at least 1% of participants and was theoretically meaningful. Accordingly, the four-profile model was selected for its balance of fit, interpretability, and parsimony.
Model Statistical Fit Indices for Latent Profile Analysis (LPA) Solutions of Loneliness, ranging From one to six Profiles by Each Measurement Timepoints.
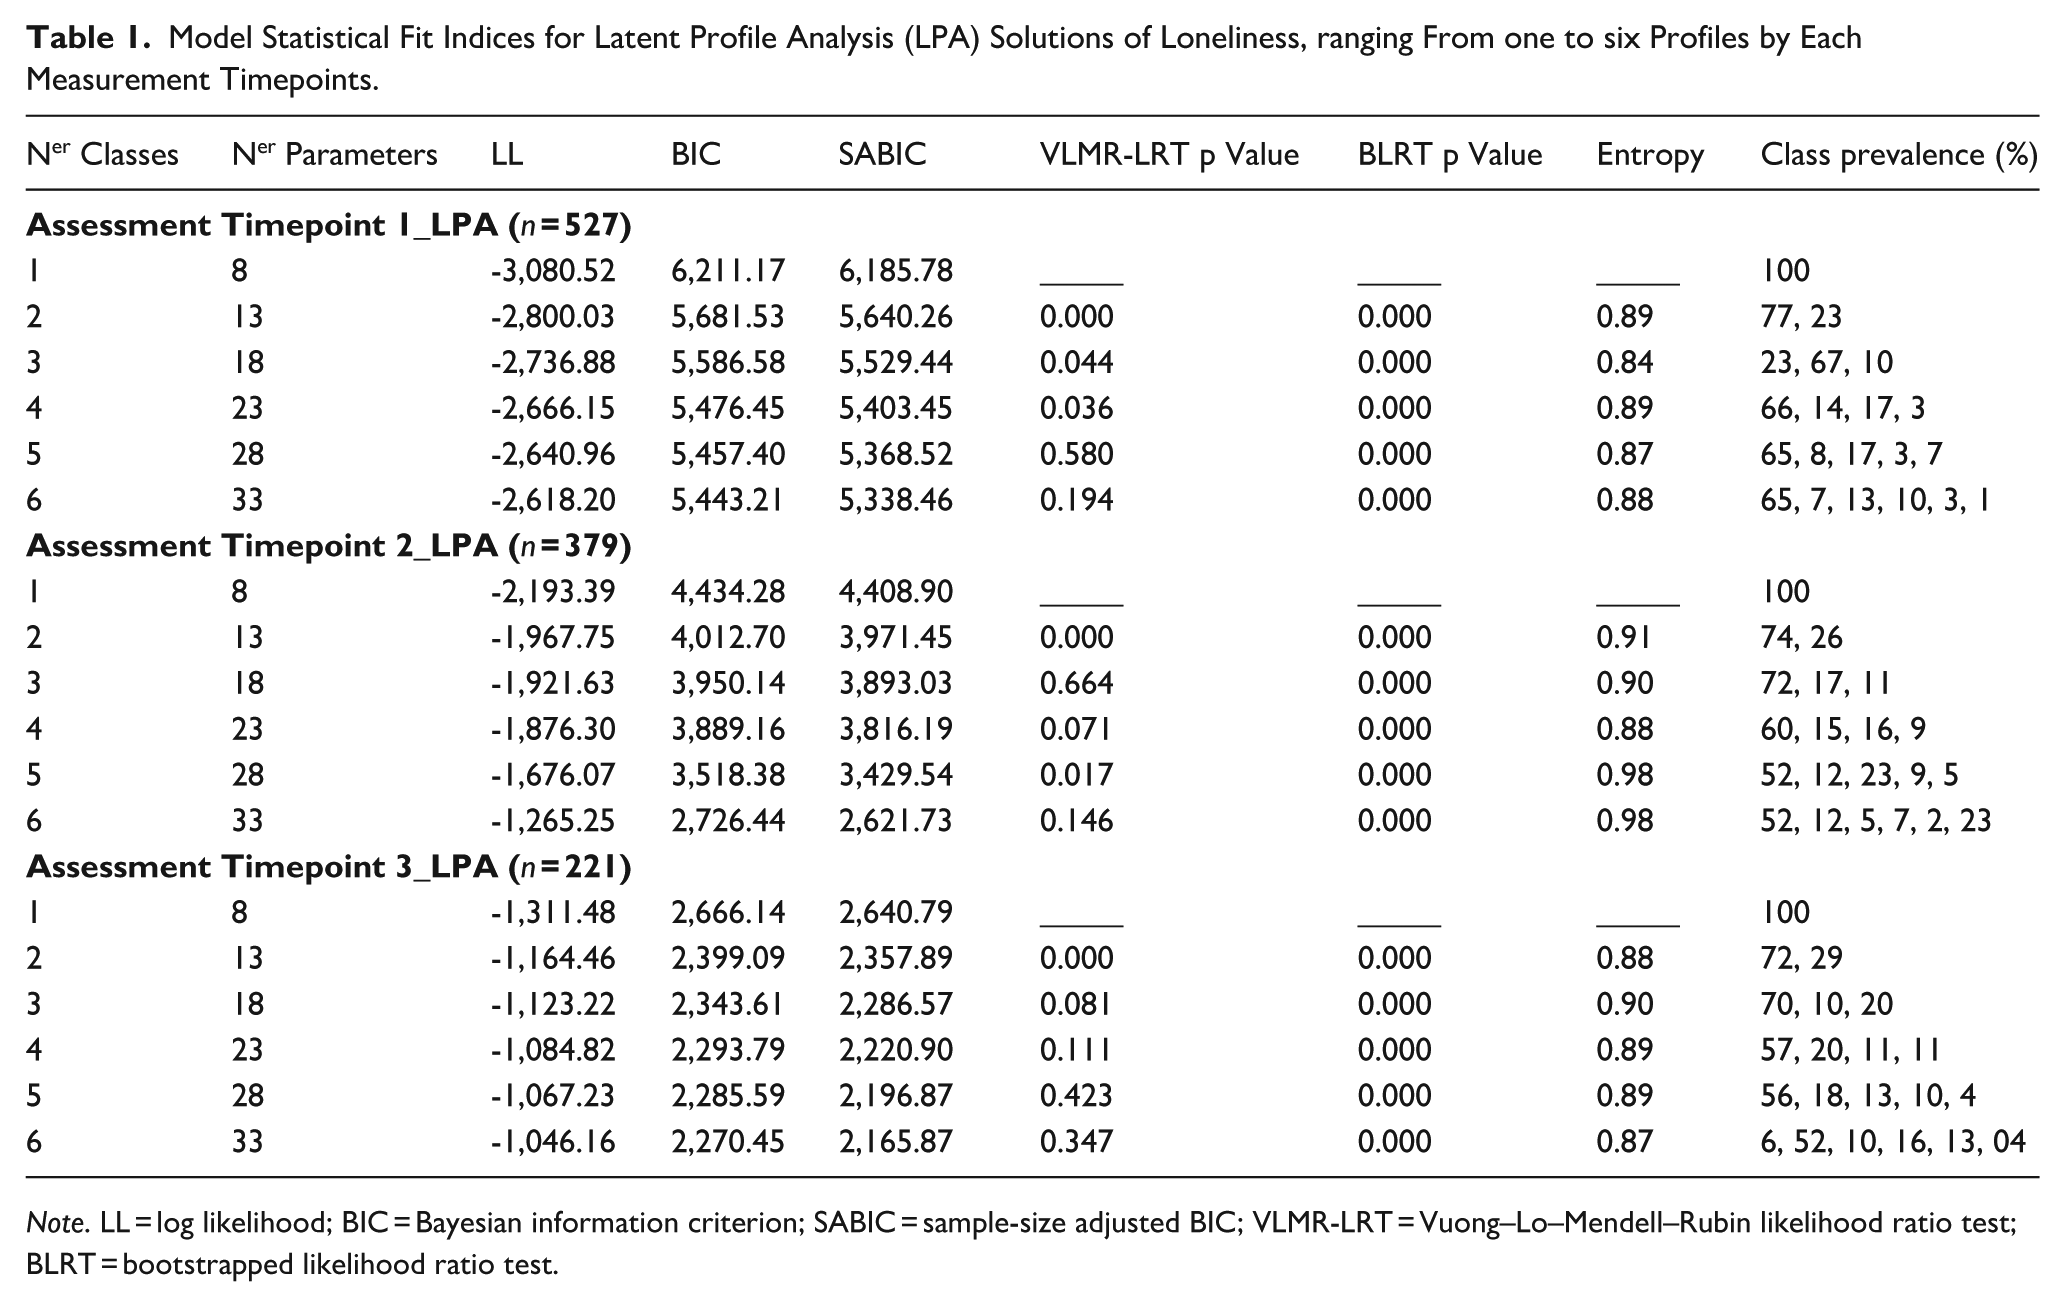
Note. LL = log likelihood; BIC = Bayesian information criterion; SABIC = sample-size adjusted BIC; VLMR-LRT = Vuong–Lo–Mendell–Rubin likelihood ratio test; BLRT = bootstrapped likelihood ratio test.
Average Posterior Probability (AvePP) of the Most Likely Latent Profile Membership by Latent Loneliness Profile.
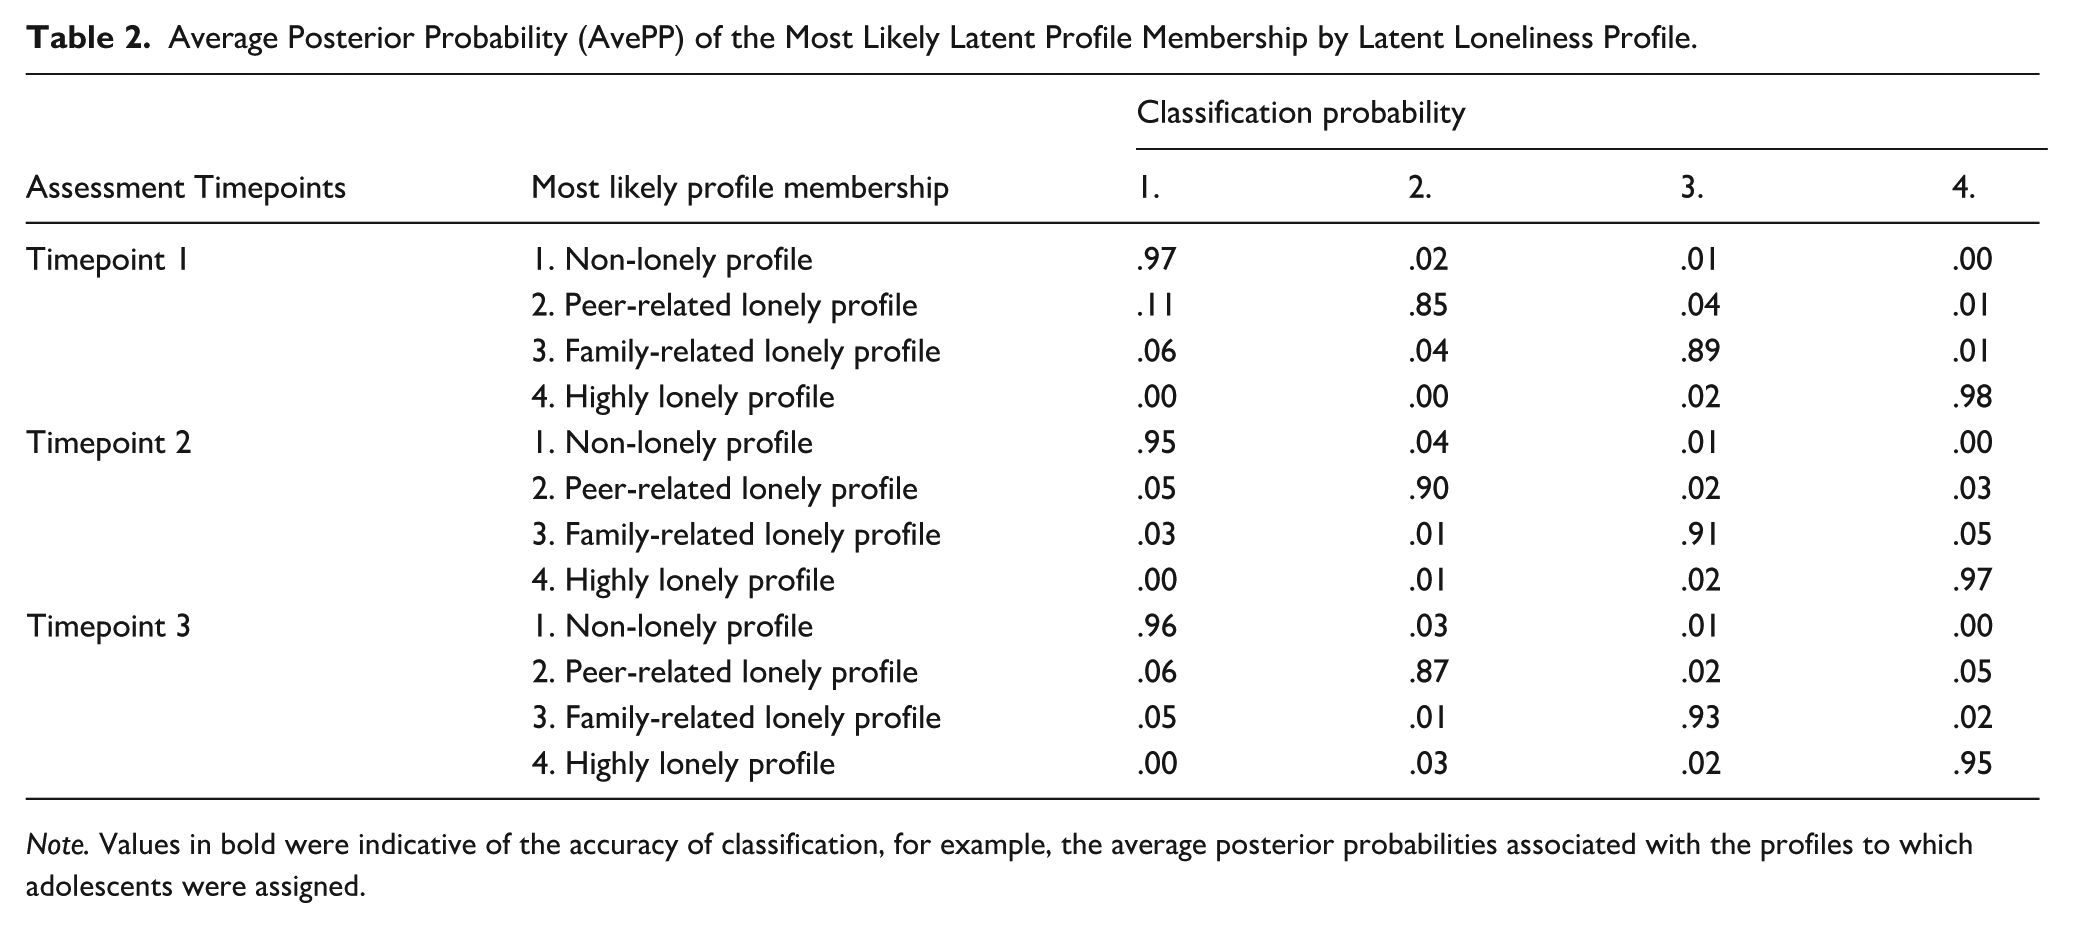
Note. Values in bold were indicative of the accuracy of classification, for example, the average posterior probabilities associated with the profiles to which adolescents were assigned.
At each assessment, the four loneliness profiles were labeled based on the mean scores obtained for each type of loneliness (social and emotional) within each social context—peers and family (see Figure 1). Profile 1, labeled Non-lonely, was the largest group (66% at Time 1; 60% at Time 2; 57% at Time 3) and included adolescents who reported the lowest scores for both types of loneliness across both social contexts. Profile 2, labeled Peer-related lonely, comprised adolescents (14% at Time 1; 15% at Time 2; 20% at Time 3) who reported the highest social and emotional loneliness in the peer context only. Profile 3, labeled Family-related lonely, comprised adolescents (17% at Time 1; 16% at Time 2; 11% at Time 3) with the highest social and emotional loneliness scores in the family context only. Finally, Profile 4, labeled Highly lonely, was the smallest group (3% at Time 1; 9% at Time 2; 11% at Time 3) and included those who reported the highest scores for both types of loneliness across both social contexts.
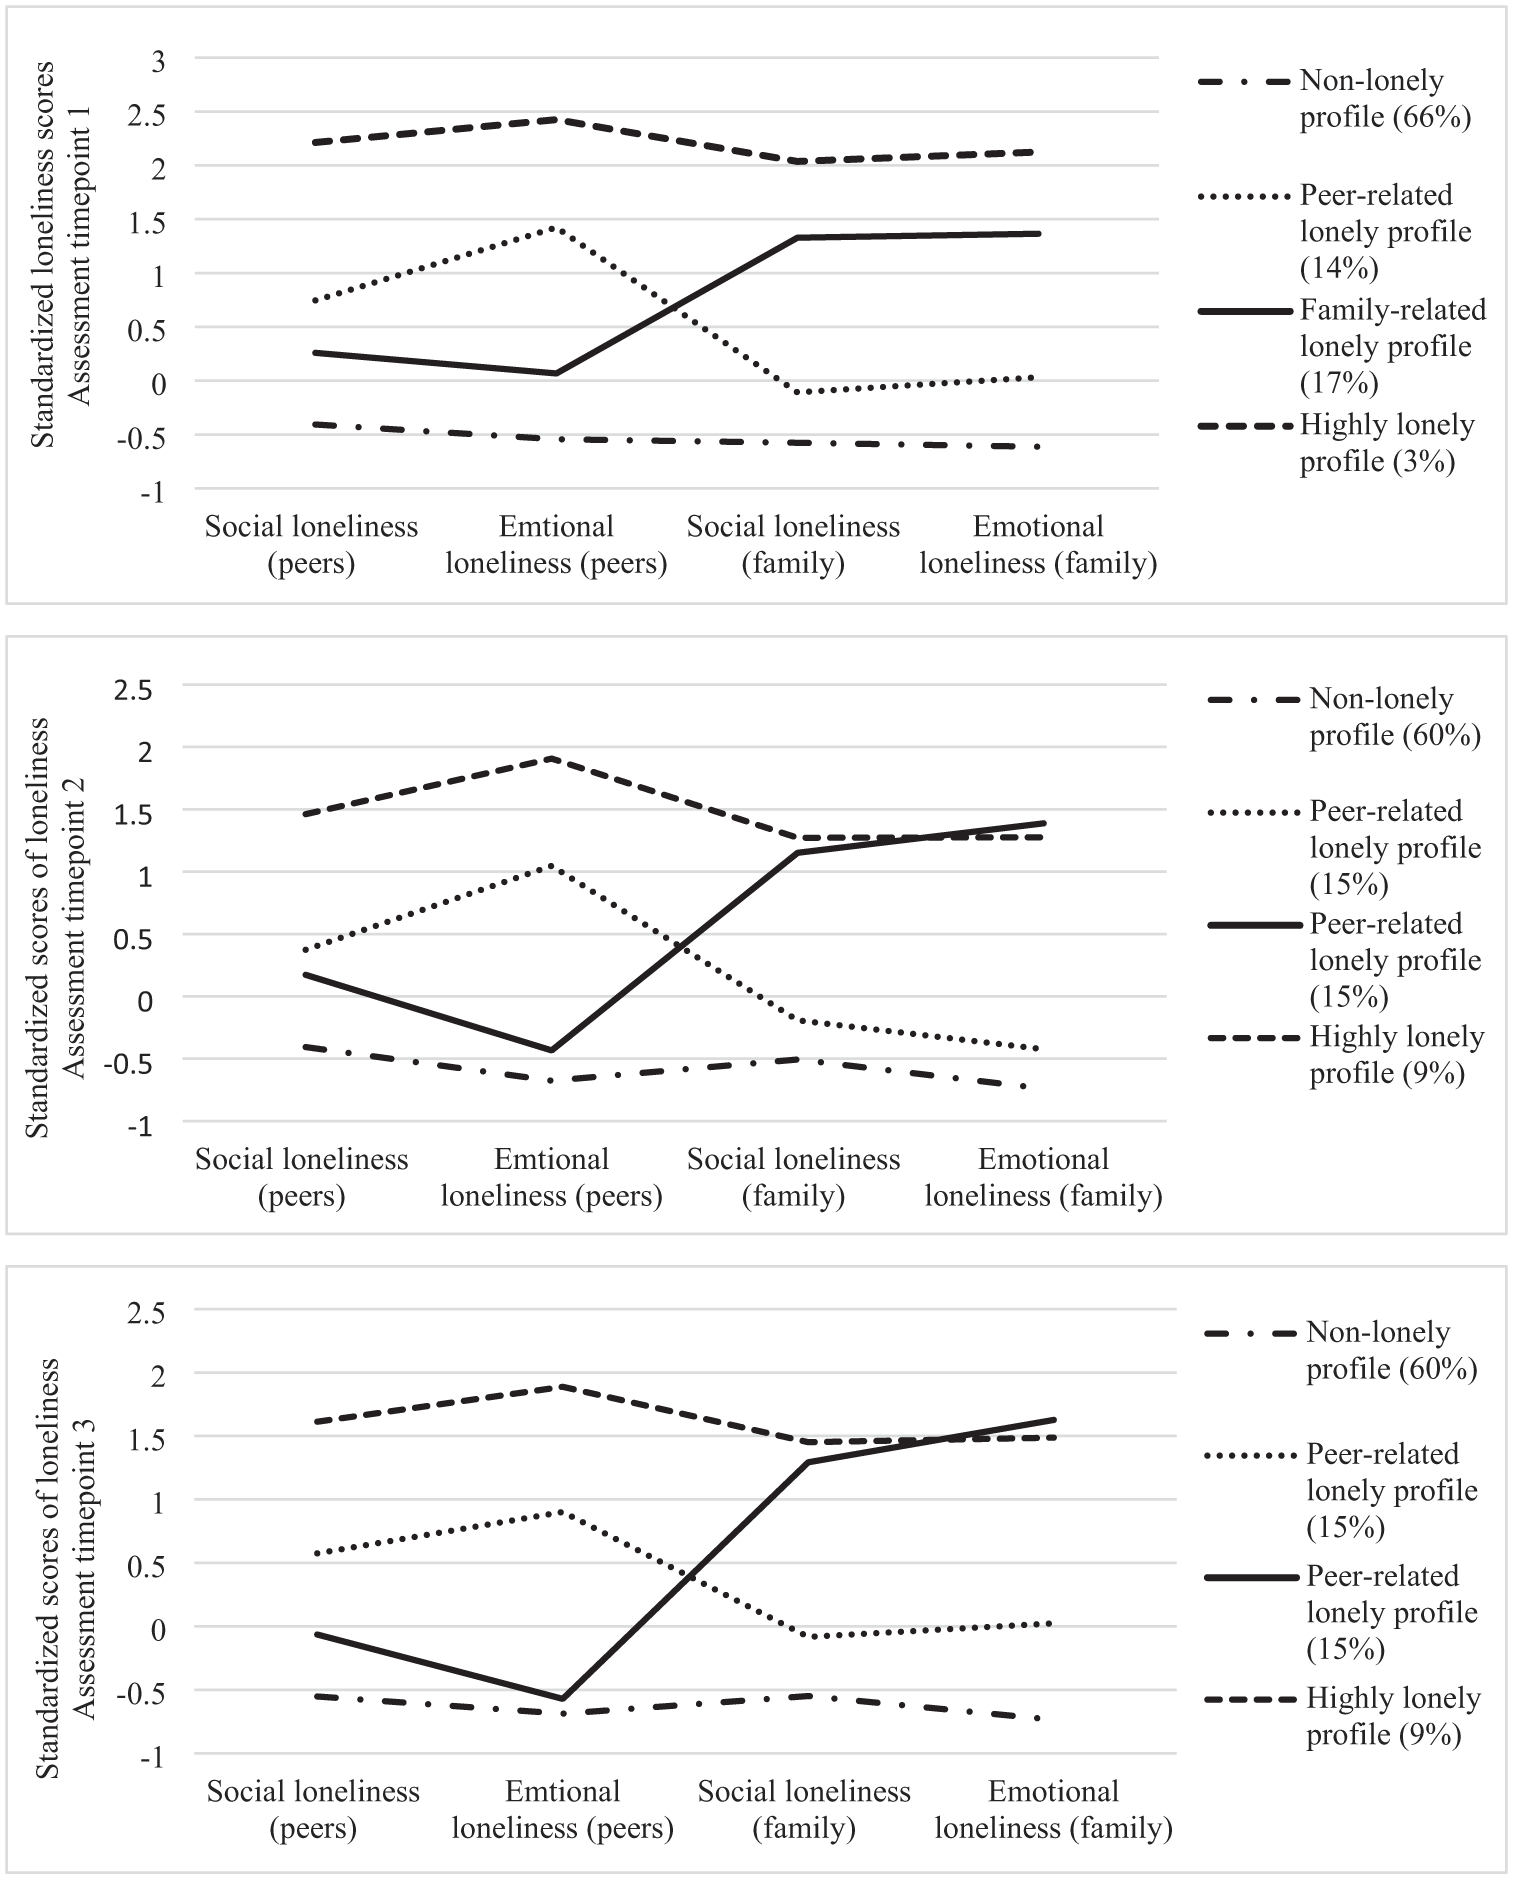
Final Four-Cluster Solution Based on Z-Scores for Social Loneliness With Peer Group, Emotional Loneliness With Peer Group, Social Loneliness With Family, and Emotional Loneliness With Family.
Although the four loneliness profiles remained consistent across assessments, their sizes changed (Table S3). The Non-lonely profile consistently remained the largest, though its prevalence decreased from 66% at Time 1% to 57% at Time 3. In contrast, the Highly lonely profile was consistently the smallest, increasing from 3% to 11% over the same period. The prevalence of the Peer-related lonely profile decreased from Time 1 to Time 2, then increased from Time 2 to Time 3, while the Family-related lonely profile showed the opposite pattern, increasing from Time 1 to Time 2 and decreasing from Time 2 to Time 3.
Model Specification of LTA Model Without Covariates
Measurement Invariance
LPA models across the three assessment timepoints identified the same number and types of latent profiles. To build a longitudinal model, we first tested measurement invariance using LRTs, comparing models assuming full measurement invariance, full non-invariance, and partial invariance. Results showed that the full non-invariance model fit the data better than the full invariance model (Δχ² = 68.724, df = 32, p < .00001), but worse than the partial invariance model (Δχ² = −31.213, df = 16, p < .00001). However, model fit indices (Table S4) did not clearly favor any single model. For practical reasons, we retained the full measurement invariance model to enable consistent interpretation of transition probabilities and to assume stable loneliness profiles over time, without constraining profile sizes.
Transition Patterns With First- and Second-Order Effects
In line with prior analyses, we compared the full measurement invariance model with variations incorporating first- and second-order transition effects to examine the stability of and changes in loneliness profiles over time. A second-order effect implies that an adolescent’s profile membership at a given time depends not only on the immediately preceding timepoint but also on earlier states, allowing for the examination of whether loneliness at Time 3 is directly influenced by loneliness at Time 1, beyond the effect of Time 2. Three models were tested: one including only first-order effects, one including both first- and second-order effects, and one testing a first-order effect that excluded transitions through Time 2 (Table S5). LRTs showed that the model including the second-order effect provided the best fit (Δχ² = 84.349, df = 9, p < .00001), suggesting a lasting influence of loneliness at Time 1 on profile membership at Time 3.
To explore the impact that early loneliness feelings have on adolescents’ trajectory, transition probabilities were analyzed. Table 3 presents the transitions probabilities between Time 1 and 2, and between Time 2 and 3, based on a second-order effect and assuming equal profile structure over time.
Latent Transition Probabilities Between Assessment Timepoints 1 to 2, and Between Assessment Timepoints 2 to 3, Based on the Estimated Model (Full Measurement Invariance) With Second-Order Effect.
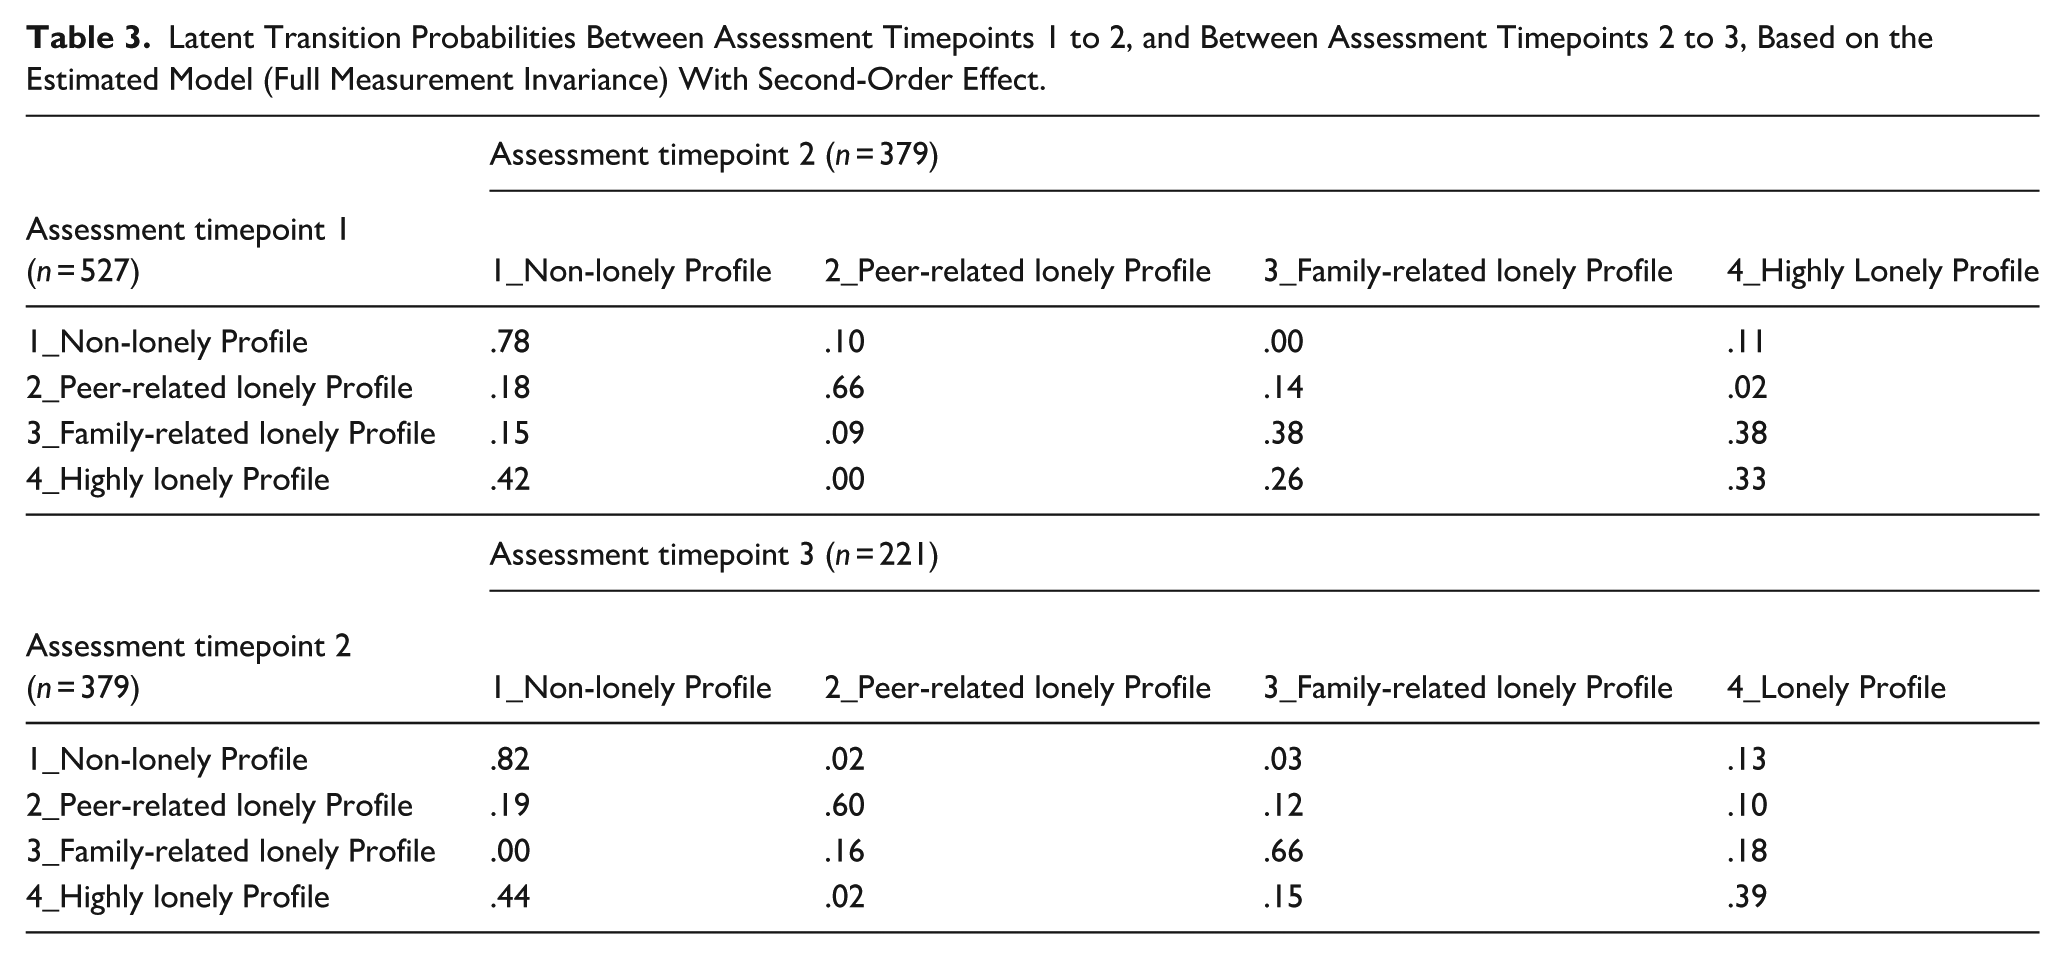
The results showed that most adolescents in the Non-lonely and Peer-related lonely profiles at Time 1 remained in the same profile at Time 2. The Non-lonely profile was the most stable, with 78% of adolescents retaining their profile membership at Time 2. Adolescents in the Peer-related lonely profile showed a stability rate of 66%, with similar rates of change to the Non-lonely (18%) and Family-related lonely profiles (14%) at Time 2.
A substantial proportion of adolescents in the Family-related lonely and Highly lonely profiles at Time 1 remained in the same profiles at Time 3 (38% and 33%, respectively). Among adolescents initially in the Family-related lonely profile, 38% transitioned to the Highly lonely profile and 15% to the Non-lonely profile. The Highly lonely profile showed the lowest stability, with only 33% remaining in the same profile; among those who changed, 42% transitioned to the Non-lonely profile and 26% to the Family-related lonely profile.
Between Time 2 and Time 3, transition probabilities were generally similar to those observed between Time 1 and Time 2, except for the Family-related lonely profile. Stability increased for both the Non-lonely profile (from 78% to 82%) and the Highly lonely profile (from 33% to 39%), while the Peer-related lonely profile showed a slight decrease in stability, accompanied by a consistent pattern of transitions. The Family-related lonely profile showed the largest change, with its stability increasing to 66%, and comparable transition rates to the Peer-related lonely (16%) and Highly lonely (18%) profiles.
Table 4 further highlights the lasting influence of loneliness at Time 1 on adolescents’ profile trajectories. Regardless of their profile at Time 2, 30% of adolescents initially in the Highly lonely profile remained in the same profile at Time 3, while others transitioned to the Family-related lonely (41%) or Non-lonely (26%) profiles. Among those initially in the Non-lonely profile, 52% remained stable through Time 3, although 28% transitioned to the Highly lonely profile. Notably, 85% of adolescents in the Peer-related lonely profile at Time 1 remained in that profile at Time 3. Adolescents who began in the Family-related lonely profile at Time 1 were almost equally likely to end up in any of the four profiles by Time 3.
Latent Transition Probabilities Between Assessment Timepoints 1 to 3, Based on the Estimated Model (Full Measurement Invariance), Collapsing Timepoint 2.
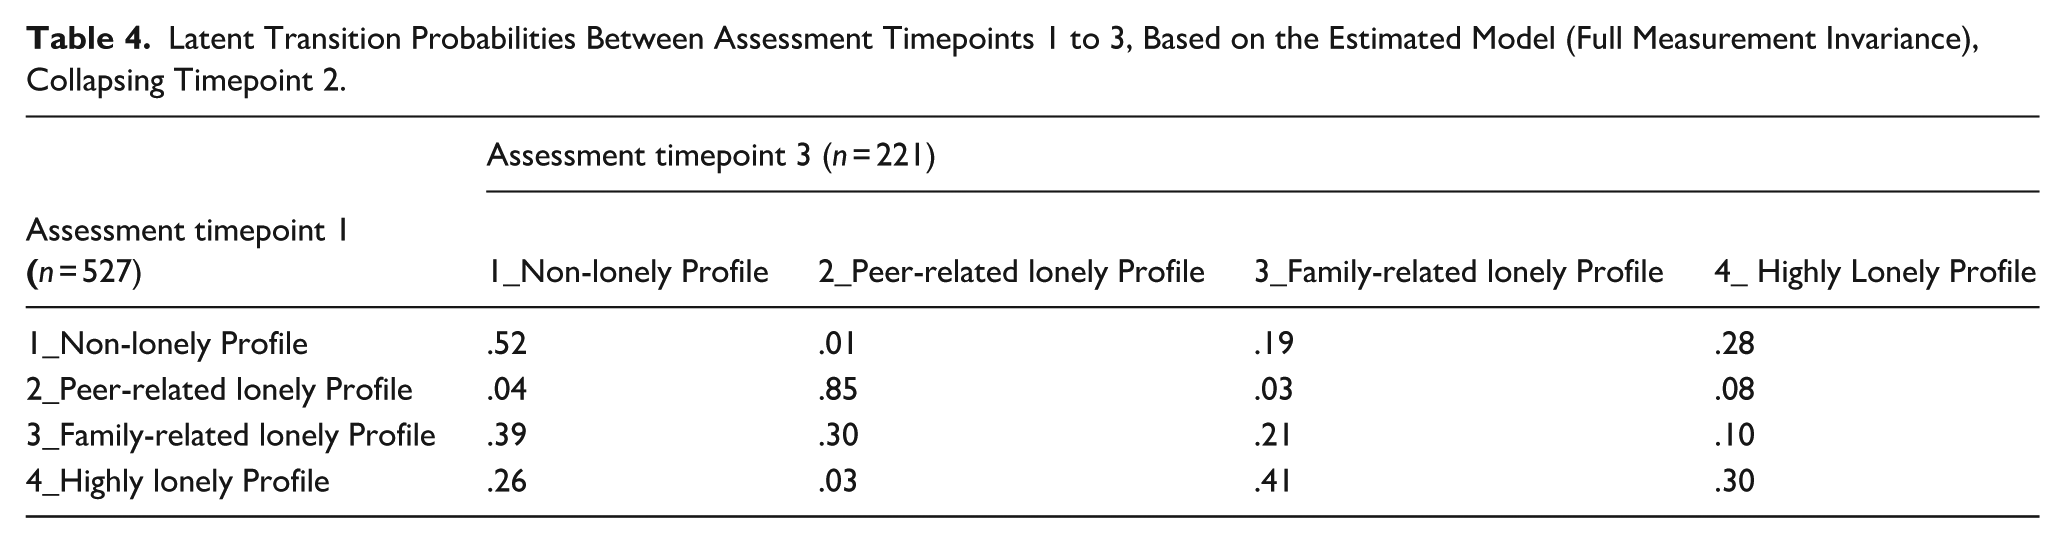
In general, adolescents with a history of loneliness were more likely to experience loneliness at later timepoints, even if they experienced periods without loneliness. However, adolescents who experienced loneliness specifically in the family context at Time 1 showed a different pattern. Although they could transition to any of the loneliness profiles by Time 3, they were less likely to move into the most severe loneliness profiles, with only a 10% probability of transitioning to the loneliest profiles.
LTA Model With Covariates
Although the measurement model was initially considered without covariates, they were later incorporated into the second-order LTA model to examine differences in latent profile membership and transitions across the assessment timepoints. LTA regression models for each covariate were analyzed independently, with the Highly lonely profile serving as the reference group. The regression coefficients for each covariate are presented in Table 5.
Regression Coefficients and Odd Ratios of Latent Profile Membership at Assessment Timepoint 1 and Across Time Transitions Among Latent Profiles..
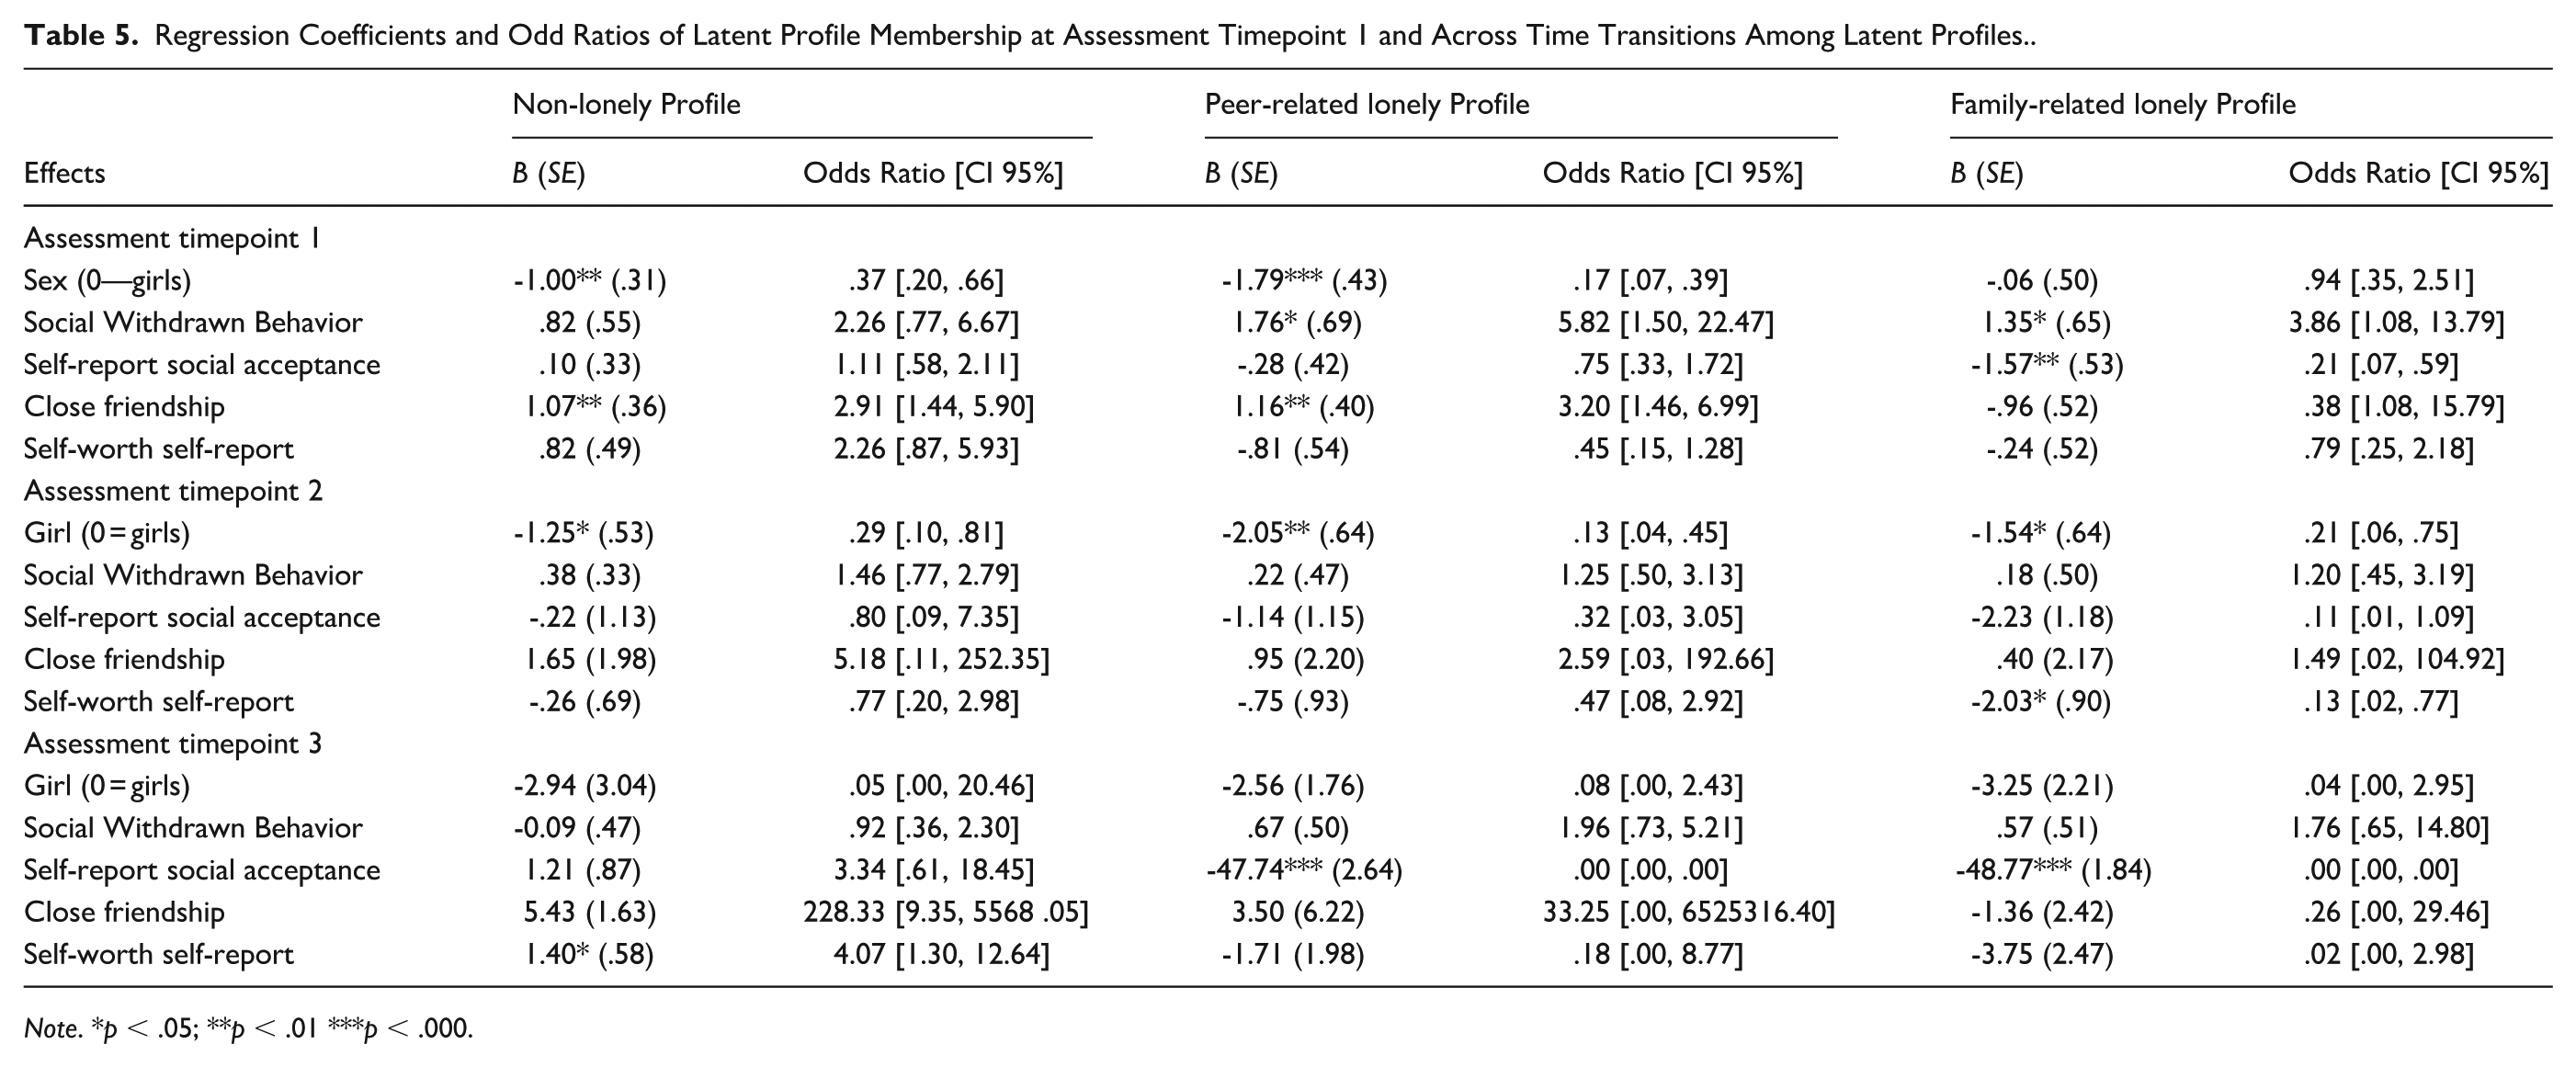
Note. *p < .05; **p < .01 ***p < .000.
The logistic regression coefficients for sex at the first assessment timepoint indicated that being a girl (as opposed to a boy) was associated with lower odds of belonging to the Non-lonely and Peer-related lonely profiles, compared to the Highly lonely profile (β = −1.00, p < .01 and β = −1.79, p < .001, respectively). At the second assessment timepoint, these coefficients remained significant and extended to include the Family-related lonely profile. However, at the third assessment timepoint, no significant sex differences were observed, indicating that boys and girls were equally likely to belong to any of the loneliness profiles at that time.
Regarding the other covariates, social withdrawal significantly predicted membership in the Peer-related and Family-related lonely profiles only at the first assessment timepoint (β = 1.76 and β = 1.35, respectively; both p < .05). Adolescents perceived by peers as more socially withdrawn had higher odds of belonging to these profiles relative to the Highly lonely profile. At subsequent timepoints, social withdrawal is no longer significantly distinguished by profile membership.
Similar findings emerged for adolescents’ self-perceived ability to initiate and maintain close friendships. This covariate was only significant at Time 1, where the logistic regression coefficients indicated that higher friendship skills increased the odds of belonging to both the Non-lonely (β = 1.07, p < .01) and Peer-related lonely (β = 1.16, p < .01) profiles relative to the Highly lonely profile. These results suggest that stronger friendship skills may serve as a protective factor against chronic loneliness. No significant associations were found at Times 2 and 3.
At Time 1, a significant negative regression coefficient (β = −1.57, p < .01) indicated that higher self-perceived social acceptance reduced the odds of belonging to the Family-related lonely profile relative to the Highly lonely profile. No significant effects emerged at Time 2, suggesting that social acceptance did not differentiate between loneliness profiles at that point. However, at Time 3, highly significant negative coefficients (β = −47.74 and β = −48.77, both p < .001) indicated that adolescents with higher levels of social acceptance were substantially less likely to belong to the Peer-related or Family-related lonely profiles, compared to the Highly lonely profile.
No significant differences in self-worth were observed at Time 1. At Time 2, a significant negative effect (β = −2.03, p < .05) indicated that higher levels of self-worth decreased the likelihood of belonging to the Family-related lonely profile compared to the Highly lonely profile. At Time 3, a significant positive coefficient (β = 1.40, p < .05) suggested that adolescents with higher self-worth were more likely to belong to the Non-lonely profile rather than the Highly lonely profile.
Discussion
Using an analytic strategy that combines LPA and LTA, this study examined the heterogeneity of loneliness by acknowledging its multidimensional nature and the possibility that adolescents’ loneliness experiences may shift over time.
Adolescents’ Loneliness Profiles by Assessment Timepoints
Across three consecutive timepoints, our results conceptually replicate prior findings (Ribeiro et al., 2022), reinforcing the idea that loneliness is best understood as a multidimensional experience occurring across different relational contexts. At each of the three assessment point, four distinct and homogeneous groups of adolescents were identified, each characterized by specific patterns of loneliness: the Non-lonely profile (low levels of social and emotional loneliness in both peer and family relationships), the Peer-related lonely profile (high social and emotional loneliness only in relationships with peers), the Family-related lonely profile (high social and emotional loneliness only in relationships with family), and the Highly lonely profile (high social and emotional loneliness in both peer and family contexts). These profiles were meaningfully differentiated based on both the type of loneliness (social vs. emotional) and the relationship context (peers vs. family), supporting the view of loneliness as a nuanced and multifaceted construct. Consistent with previous studies (Eccles et al., 2020; Vanhalst, Goossens, et al., 2013), our results support the notion that loneliness during adolescence is a heterogeneous experience. They also provide further evidence for the co-occurrence of multiple forms of loneliness within the same individuals during this developmental period (Maes et al., 2016; Shevlin et al., 2014; Vanhalst, Goossens, et al., 2013).
As expected, the majority of adolescents in our sample did not report substantial levels of loneliness. However, a small subgroup consistently exhibited high levels of loneliness across time (3%, 9% and 11% in three assessment timepoints, respectively). Prior research has estimated that between 11% and 20% of youth report feeling lonely “sometimes” or “often” (Qualter et al., 2015), and longitudinal studies suggest that 3% to 22% may experience persistent or chronic loneliness (Qualter et al., 2013; Vanhalst, Goossens, et al., 2013; Vanhalst, Rassart, et al., 2013). Our findings are in line with these estimates and highlight the importance of identifying and supporting adolescents who may be at risk for enduring loneliness.
Globally these findings support the multidimensional model of loneliness (e.g., Goossens et al., 2009; Maes et al., 2016) and provide evidence for the existence of different facets of loneliness (quantitative and qualitative deficits in relationships) reflecting unmet distinct relational provisions (Weiss, 1973). Moreover, our findings also showed empirical evidence for the coexistence of different forms of loneliness that occur naturally during adolescence (Maes et al., 2016; Shevlin et al., 2014). Social and emotional are two complementary types of loneliness but not interchangeable.
Stability and Changes Among Loneliness Profiles Over Time
Although scarce, some studies have applied LTA to examine loneliness over time, primarily in adult populations (e.g., Hammond et al., 2022). However, to our knowledge, research using this method while accounting for the multidimensional nature of loneliness, particularly during adolescence, remains virtually non-existent. Therefore, our study offers a meaningful contribution to understanding the developmental course of loneliness in this developmental stage.
Our results revealed that the Non-lonely profile was the most stable across assessment timepoints. This profile showed the highest stability between the first and second assessments, with most adolescents maintaining their profile at Time 2 (78%). Stability slightly increased in the transition to Time 3 (82%). Consistent with previous studies (e.g., Hutten et al., 2021; Qualter et al., 2013; Vanhalst, Goossens, et al., 2013), these results suggest that most adolescents are able to navigate the developmental changes and challenges that characterize adolescence, without experiencing persistent loneliness.
Peer-related lonely profile also showed high stability between the first and second assessments timepoints (66%). However, stability decreased from second to third assessments (60%), with high probability of transitioning toward the Non-lonely (19%), and a similar probability of transitioning toward the Family-related lonely (12%) and Highly lonely profiles (10%). Conversely, the Family-related lonely profile exhibited only moderate stability in the transition to second assessment timepoint (38%), with most adolescents assigned to this profile at Time 1 shifting to the Highly lonely profile (38%) at Time 2. Although this profile became more stable between Time 2 and Time 3 (66%), a notable percentage (18%) still transitioned into the Highly lonely profile. This tendency to move toward broader and more severe loneliness over time does not align with the general trend of decreasing or stable loneliness seen in other profiles. This finding suggests that family-related loneliness may place adolescents at risk of progressing to broader, more intense feelings of loneliness over time. Our findings align with the Evolutionary Theory of Loneliness (Cacioppo & Cacioppo, 2018), which posits that loneliness in foundational relationships (e.g., family) can lead to broader social isolation due to heightened social threat sensitivity and impaired social repair mechanisms. It is also important to note that one possible explanation for this result may lie in the developmental changes characteristic of adolescence, particularly in the parent-adolescent relationship. As adolescents seek greater autonomy and begin to redefine and renegotiate their roles within the family (Bowker et al., 2021), perceived emotional distance or misunderstandings between adolescents and their parents may increase (e.g., Smetana, 2011), possibly increasing vulnerability to feelings of loneliness (Danneel et al., 2018). Consequently, transitions from family-related loneliness to more or chronic loneliness may reflect the cumulative impact of evolving family dynamics during this sensitive developmental period. Thus, this tendency may reflect the central role of family bonds in adolescent social and emotional development, and how disruptions in these bonds can generalize to other relational contexts.
Finally, our results showed that the Highly lonely profile had the lowest stability in the transition between Time 1 and Time 2 (33%), with a high percentage of adolescents transitioning to the Non-lonely profile (42%) and some moving to the Family-related lonely profile (26%). Between Time 2 and Time 3, however, the stability of the Highly lonely profile increased slightly (39%). While a notable portion still transitioned to the Non-lonely profile (44%), some adolescents (15%) moved into the Family-related lonely profile.
Although the Non-lonely profile demonstrated the highest overall stability, the Highly lonely profile showed a pattern of increasing stability across time. The growing stability of the Highly lonely profile over time may reflect a negative cycle, as described by the Evolutionary Theory of Loneliness (Cacioppo & Cacioppo, 2018). According to this theory, when loneliness becomes long-lasting, it can negatively affect how people think and feel, make them less trusting, and increase their sensitivity to rejection or social threats. These changes make it harder to build or repair relationships. The fact that adolescents in the Highly lonely profile became more stable over time raises concerns about the risk of enduring loneliness and its cascading effects on mental health and socio-emotional development. These results show how important it is to identify and support lonely adolescents early, before their feelings become chronic and more resistant to change.
Our findings revealed notable patterns of transitions between loneliness profiles, especially toward the family-related loneliness profile. Overall, the Non-lonely profile showed the greatest stability. While adolescents in other profiles were more likely to shift, typically into lower-loneliness profiles, those in the family-related loneliness profile were more likely to transition into the Highly lonely profile, suggesting increased future vulnerability. This pattern may signal heightened risks for mental health issues, social difficulties, and long-term relational challenges (Cacioppo et al., 2014).
Our study also examined whether early experiences of loneliness have lasting effects. Our results showed that the adolescents’ loneliness profile at the first assessment timepoint predicted their profile membership at the third assessment, even when transitions to other profiles occurred in between. Adolescents with a history of loneliness were more likely to remain lonely later, even if they experienced periods without loneliness.
Early experiences of loneliness increase vulnerability to future loneliness feelings, by shaping how adolescents perceive and engage in future social relationships. Early loneliness has been found to undermine social competence and increase sensitivity to rejection or social threat (Cacioppo & Cacioppo, 2018; Qualter et al., 2013), potentially triggering a maladaptive cycle in which lonely adolescents avoid social opportunities or interpret interactions negatively (Vanhalst, Goossens, et al., 2013). These mechanisms can reduce trust, making more difficult to form or maintain relationships (Spithoven et al., 2017). This supports the idea that loneliness in adolescence may follow a discontinuous way (Geukens et al., 2022; Mund et al., 2020), reinforcing the importance of early detection and intervention.
Such findings about the long-term impact of initial loneliness feelings are possibly unique in literature and represent an important contribution to understanding the discontinuous nature and developmental course of adolescent loneliness.
Effects of Intrapersonal Covariates on the Transitions
Taking advantage of the flexibility of LTA, our study investigated the role of several intrapersonal covariates in shaping changes in adolescents’ experiences of loneliness. Specifically, we examined how sex, self-perceived social acceptance, self-worth, friendship competence, and peer-perceived social withdrawal were associated with transitions between loneliness profiles over time. By including these covariates, we aimed to clarify individual differences in the developmental trajectories of loneliness throughout adolescence.
The regression results highlighted how individual characteristics influenced adolescents’ profile membership across time, especially during the first assessment timepoint. Sex differences emerged as a consistent predictor: being girl, but not boy, significantly decreased the odds of belonging to the Non-lonely and Peer-related lonely profiles compared to the Highly lonely profile. This finding suggests that girls may be more vulnerable to intense or chronic feelings of loneliness during early adolescence, consistent with prior research indicating that girls often report higher levels of emotional sensitivity and interpersonal stress (e.g., Rose & Rudolph, 2006).
Moreover, friendship competence and peer-perceived social withdrawal were significant predictors only during the transition from Time 1 to Time 2. Adolescents who rated themselves as more competent in forming and maintaining close friendships were more likely to belong to the Non-lonely and Peer-related lonely profiles, suggesting that strong interpersonal skills may act as a protective factor against more severe forms of loneliness early in adolescence. This is consistent with past research showing that adolescents with high friendship competence tend to experience more supportive relationships and are less vulnerable to emotional difficulties (Buhrmester, 1990; Parker et al., 2006). In contrast, adolescents who were perceived by peers as socially withdrawn were more likely to be classified into Peer-related or Family-related lonely profiles. This finding aligns with previous research indicating that social withdrawal is associated with diminished peer involvement (e.g., Spithoven et al., 2017) and lower levels of perceived social support (e.g., Rubin et al., 2009), which may increase vulnerability to relational loneliness. Social withdrawal is linked to fewer peer interactions, lower peer status, and increased risk for loneliness and internalizing problems (Coplan & Armer, 2007; Rubin et al., 2009). Importantly, socially withdrawn youth may face difficulties in initiating and maintaining meaningful relationships, which may contribute to sustained feelings of loneliness in both peer and family contexts. However, by the third assessment timepoint, no significant friendship competence and social withdrawn behavior differences were observed in the likelihood of belonging to any of the loneliness profiles.
Perceived social acceptance showed both early and later effects. At Time 1, it significantly decreased the likelihood of being in the Family-related lonely profile, and at Time 3, adolescents with higher social acceptance were substantially less likely to be in either the Peer- or Family-related lonely profiles, compared to the Highly lonely profile. These findings suggest that feeling accepted by peers may offer long-term protection against various forms of loneliness.
Finally, self-worth, a significant predictor of loneliness (e.g., Danneel et al., 2020; Vanhalst, Goossens, et al., 2013), showed delayed effects. While no significant associations were found at Time 1, higher self-worth at Time 2 decreased the odds of belonging to the Family-related lonely profile, and at Time 3, it increased the likelihood of being in the Non-lonely profile. This developmental pattern implies that improvements in self-worth overtime may support emotional resilience and more satisfying social relationships.
Taken together, these findings demonstrate that sex, social-emotional skills, and internal perceptions of social connectedness are important in understanding who is most vulnerable to loneliness. The time-specific effects underscore the importance of early identification and intervention, particularly for girls and socially withdrawn youth, to prevent persistent loneliness and its long-term consequences.
Limitations and Further Research
Despite the innovations and strengths of the present study, some limitations should be acknowledged. First, the current findings should be replicated using more representative samples that include greater heterogeneity in terms of cultural, socioeconomic, and demographic backgrounds. Second, participant attrition between the first and final assessment points may limit the generalizability of our findings. Future research should aim to replicate these findings using larger samples and incorporate more detailed attrition analyses to assess potential dropout effects. Third, data was collected only three times over three consecutive years. This relatively short timeframe may limit conclusions about long-term trajectories of loneliness across adolescence. More frequent assessments or extended follow-ups could help identify more nuanced patterns.
Finally, another limitation of the present study is the absence of family-related predictors of loneliness. Although we assessed several intrapersonal and peer-related characteristics, we didn’t include variables directly related to the family context, such as attachment patterns, parenting styles and practices, or communication styles. Given that family-related loneliness showed a tendency to transition into broader and more chronic loneliness profiles, future research should incorporate such dimensions to better understand the mechanisms underlying these transitions.
Supplemental Material
sj-docx-1-jbd-10.1177_01650254251392370 – Supplemental material for Stability and changes in loneliness profiles across adolescence: The effects of intraindividual characteristics on the transitions across time
Supplemental material, sj-docx-1-jbd-10.1177_01650254251392370 for Stability and changes in loneliness profiles across adolescence: The effects of intraindividual characteristics on the transitions across time by Olívia Ribeiro, Kenneth H. Rubin and António J. Santos in International Journal of Behavioral Development
Footnotes
Acknowledgements
The authors acknowledge all adolescents who participated in the study, as well as the schools and teachers. The authors also thank all the members of the research team for their assistance and support.
Declaration of Conflicting Interests
The authors declared no potential conflicts of interest with respect to the research, authorship, and/or publication of this article.
Funding
The authors disclosed receipt of the following financial support for the research, authorship, and/or publication of this article: This work is funded with national funds from FCT—Fundação para a Ciência e Tecnologia, I.P., in the context of the R&D Unit: —William James Center for Research (FCT), PTDC/PSI-PDE/098257/2008 and SFRH/BD/134132/2017. UID/04810/2025.
Ethical Considerations
All procedures performed in the current study were in accordance with the recommendations of APA Ethical Guidelines, and with the 1964 Helsinki declaration and its later amendments, ensuring the privacy and confidentiality of participants’ information. It is also approved by the University Ethical Committee.
Informed Consent
Informed consent was obtained from the parents or guardians of all participants in the study and assent was obtained from participants.
Supplemental Material
Supplemental material for this article is available online.
References
Supplementary Material
Please find the following supplemental material available below.
For Open Access articles published under a Creative Commons License, all supplemental material carries the same license as the article it is associated with.
For non-Open Access articles published, all supplemental material carries a non-exclusive license, and permission requests for re-use of supplemental material or any part of supplemental material shall be sent directly to the copyright owner as specified in the copyright notice associated with the article.