
Abstract
This study uses large-scale longitudinal data to identify distinct trajectories of TV consumption and computer use across childhood to early adolescence and examine their relationships with academic performance and socioeconomic status (SES). Data were drawn from the UK’s Millenium Cohort Study sweeps at ages 3, 5, 7, and 11 years (total N = 16,260). Using latent profile analysis, we identified six trajectories of computer use and six trajectories of television consumption, across the ages of 5 to 11 years. We then tested their associations with academic performance and SES using multinomial logistic regression and multigroup modeling. We found that children with non-normative trajectories of television consumption had poorer academic performance. We also found that children with very low levels of television/computer use had poorer academic performance, and were more likely to come from lower-SES backgrounds. We conclude that below-average levels of screen time may primarily be an indication of households’ inability to afford multiple television sets or computers, with limited access to resources being shown to contribute to the SES attainment gap. Furthermore, as computer usage becomes more integrated into children’s lives and education, those unable to access or use digital technology are at a relative disadvantage to their peers.
Anxieties around the risks of excessive screen time among children have received substantial media attention (Crosby Medlicott, 2021; Kleinman, 2025; Sridhar, 2024; Vardy, 2024). A large body of research focuses on the relationship between screen time and emotional and mental health problems in young people (Bohnert & Gracia, 2023; Twenge & Campbell, 2018). There is also research on screen time and physical health, with screen time correlating with a range of health issues, including obesity (Hancox & Poulton, 2006), attentional problems (Christakis et al., 2004), poor sleep patterns (Lan et al., 2020), and myopia (Lanca & Saw, 2020).
However, less is known about how screen time relates to the development of children’s academic performance. Adelantado-Renau et al.’s (2019) meta-analysis synthesized the evidence on the cross-sectional associations between time spent on screen media and academic performance in children and adolescents. The authors found that, while overall screen media consumption had no association with academic performance, some screen-based activities including television viewing and video game playing were negatively associated with academic performance, particularly among adolescents. Recently, Skvarc and colleagues (2021) investigated the relationship between different forms and functions of screen time on child academic performance within a sample of Australian and New Zealand children. They also found mixed results, with TV viewing having a negative relationship, using screen media for homework purposes having a positive relationship, and other types of screen time—recreational Internet use, social media, gaming, playing music or movies, or creative activities—having no significant association with academic performance. These mixed results across studies suggest that more research is needed to unpack how specific types of screen time relate to academic performance, and that there is a gap for understanding the longitudinal relations between the two factors.
Accordingly, there is relatively little research that systematically observes how screen time develops as children age between childhood and adolescence. Prior longitudinal research has tended to focus on screen time trajectories across adolescence (Zhu et al., 2023) or among preschool-age children (Fitzpatrick et al., 2025; Trinh et al., 2020). Studies of screen time trajectories in early childhood have shown an association between high levels of screen use and poorer executive function (Fitzpatrick et al., 2025) and revealed higher-consumption trajectories to be correlated with lower SES and ethnic minority households (Trinh et al., 2020). Research across children of school age has largely been limited to examination of the relationship between screen time and health behaviors (Yan et al., 2017), physical activity (Krist et al., 2020), and psychosocial well-being (Sidiq et al., 2025; Wang et al., 2024).
This study moves beyond the research on social, emotional, and physical health and screen time to explore how screen time develops across childhood and early adolescence with a focus on the relationship between screen time and academic achievement. Finally, cognizant of social inequalities in access to digital devices and the often-found linear relationship between socioeconomic status (SES) and academic achievement (Chzhen et al., 2022), the study examines these developmental patterns and their association with academic achievement according to children’s family SES.
Screen Time and Age
Children’s consumption of media and use of digital technology has increased hugely over a relatively short period of time. In 2023, 63% of 5- to 15-year-olds used a tablet to go online, up from 45% in 2014 and just 8% in 2012, while smartphone use among the same age group increased from 22% in 2012 to 71% in 2023 (Ofcom, 2024). Even among younger children, those aged 8 to 11 are spending around 13 hr a week watching TV, the same amount of time going online and around 10 hr a week using a mobile phone (Ofcom, 2019).
The rapid increase in availability and use of screen-based technology has sparked concern over what impact this may have on children’s cognitive development, mental well-being, and physical health outcomes. In 2023, the UK parliament launched an inquiry to look at the impact of screen time on children’s education and well-being and concluded that “screen time should be minimal for younger children and better balanced with face-to-face socialisation and physical activity for older ones.” (Education Committee, 2024). Internationally, the World Health Organization’s (WHO, 2019) guidelines for the amount of screen time children should be allowed, ranges from no screen time for under-2s, 1 hr per day for those aged 2 to 4, and 2 hr per day for the over-5s.
Despite these guidelines suggesting different optimal amounts of screen time for different age groups, there is relatively little known about how different types of screen time develop across childhood and adolescence. While higher consumption of screen media has been found to be associated with poorer executive function (Fitzpatrick et al., 2025) and emotional regulation (Cerniglia et al., 2020) in early childhood, and with lower levels of psychosocial well-being (Sidiq et al., 2025; Wang et al., 2024) and poorer health behaviors (Krist et al., 2020; Yan et al., 2017) in later childhood, there is little academic agreement on what constitutes a detrimental level, or what impact different types of media consumption of trajectories of screen use across childhood have.
Screen Time and Academic Achievement
While the impact of screen time on children’s mental and physical health is a key ongoing area of research, comparatively less is known about the role media consumption and screen use might play in cognitive development and academic performance. Some research has associated prolonged screen time with adverse cognitive development in children (Zimmerman & Christakis, 2005). However, there is also evidence that online learning and digital educational communities can be beneficial for children in school (Hurwitz & Schmitt, 2020; Li & Atkins, 2004). In relation to academic achievement, the evidence is also inconclusive: While certain screen-based activities—most notably, watching TV and video gaming—have been found to be detrimental for academic performance (Adelantado-Renau et al., 2019), there is no consensus that overall screen use is negatively associated with academic achievement or that certain contexts, content, or purposes of screen media cannot in fact be beneficial for learning (Adelantado-Renau et al., 2019; Skvarc et al., 2021).
Precipitated by school closures during the COVID-19 pandemic, the use of educational technology has become more commonplace, with schools introducing online learning platforms, digital curriculum content, and technology to deliver both live remote lessons and pre-recorded lessons online (Tobin, 2023). Students with access to digital devices are able to use these to complete homework, search for information, and read news sites. Among younger children, there is evidence to suggest that access to digital devices can support learning development, with educational content promoting language development (Madigan et al., 2020) and touchscreens supporting fine motor skills (Bedford et al., 2016). Across these contexts, the content and frequency of media consumption, as well as the level of parental supervision, appear to be key moderating factors in the relationship between screen time and children’s cognitive outcomes (Kostyrka-Allchorne et al., 2017; Parkes et al., 2013).
Screen Time and Socioeconomic Status
Socioeconomic educational inequalities are a source of concern and the subject of much academic critique (Ball, 2021; Lupton & Hayes, 2021). The “attainment gap” between the poorest learners (often defined as those eligible for free school meals) and their more affluent peers has persisted for more than 20 years and progress toward reducing it remains stubbornly slow (Education Policy Institute [EPI], 2019; Farquharson et al., 2022). As the use of technology becomes more and more integral to the educational experience, unequal access is likely to exacerbate educational inequalities, depriving lower-SES groups of the ability to develop digital skills sets and benefit fully from technological advances. This issue was highlighted by the COVID-19 pandemic which exposed a socioeconomic “digital” divide, whereby unequal access to technologies, such as tablets, computers, and mobile phones, meant that children from poorer households spent less time learning during school closures (Andrew et al., 2020; Green, 2020).
While unequal access to technology has the potential to widen the socioeconomic attainment gap, there is little evidence on how SES influences consumption patterns for TV and digital technology across early-to-mid childhood and how this may moderate its impact on children’s academic outcomes. Bohnert and Gracia (2023) have explored the role that SES plays in shaping the effects of digital use in relation to young people’s socioemotional development, finding that low-SES adolescents spend more time on digital devices and experience greater negative effects of technology use on their socioeconomic well-being. Their study further indicated that, while learning-oriented digital activities improve academic outcomes for high-SES adolescents, this was not the case for low-SES adolescents. Greater understanding of why, how, and when this relationship develops can inform policies to reduce the attainment gap via interventions at specific ages and guidance for schools and parents in relation to children’s screen usage patterns.
This Study
This study examines the issue of how children’s screen time relates to academic achievement and SES using exploratory and deductive analysis of longitudinal cohort study data. This combination of approaches aims to add to knowledge on the relationship between SES, media consumption, and academic performance by answering three main research questions (RQs). First, RQ1 asks how does children’s television consumption and computer use develop across early childhood to early adolescence? This period, covering children’s primary education, is often a time of increasing exposure to media, both within and outside of school contexts. It is also a time that sees a widening of educational inequalities linked to children’s socioeconomic attainment status. Accordingly, RQ2 asks how SES is related to children’s developmental trajectories of screen time? Furthermore, both SES and screen time have been shown to be associated with academic performance, creating an opportunity to examine their intersection in children’s development using longitudinal data. Our final two research questions address this issue. RQ3 asks what is the relationship between screen time trajectories with academic achievement at the end of primary school? Then, RQ4 asks to what extent is the association between screen time trajectory and academic performance moderated by SES? Together, these questions provide a multifaceted examination of how children’s screen time impacts their academic performance in the context of family SES.
Method
Participants and Procedures
The data used in the analysis are from the Millennium Cohort Study (MCS). The MCS is a British nationally representative cohort study of individuals born between 2000 and 2001, funded by the Economic and Social Research Council and run by the Centre for Longitudinal Studies. Data are collected in sweeps with 2- or 3-year intervals between sweeps. There are currently eight waves of data collected when cohort members were aged 9 months, and 3, 5, 7, 11, 14, 17, and 23 years. The MCS was developed as a multidisciplinary survey to capture the influence of early family context on child development and outcomes throughout childhood, into adolescence and adulthood (Centre for Longitudinal Studies [CLS], 2020). The MCS sample was drawn from a population of children identified through the universal Child Benefits register. Children from deprived backgrounds were oversampled, as were children from areas of high ethnic minority concentration (CLS, 2020). Design weights are supplied by Centre for Longitudinal Studies and are different depending on whether the analysis is conducted for a single country within the United Kingdom, or for the United Kingdom as a whole. Weights in later waves of the study are further adjusted for non-response. In this study, appropriate weights are implemented using STATA’s in-built “svyset” package (StataCorp., 2025).
This study utilizes data from four waves of the MCS, following cohort members through early childhood to early adolescence (ages 3 to 11). The data were drawn from the age-3 sweep (N = 15,808), age-5 sweep (N = 15,460), age-7 sweep (N = 14,043), and age-11 sweep (N = 13,469). The total sample used in the analysis was 10,512 (girls N = 5,200, boys n = 5,312).
Attrition is a key concern for longitudinal analysis, with drop-out between waves of data collection potentially introducing biased inferences if not at random. Respondents with missing data on TV or computer use for all waves are excluded from analysis (N = 2,983; 15.5%). Further analysis of missingness on these variables revealed no systematic attrition on the basis of sex or ethnicity (once survey weights were applied), while respondents from the lowest SES background were significantly less likely to respond to questions about the amount of time spent watching TV or using a computer. This is important to bear in mind when interpreting the analysis, with screen time likely to be underestimated for low-SES students, potentially leading to an attenuation of the relationship between SES and screen time trajectories.
Measures
Screen Time
At each wave, children’s screen time was captured through two items. These asked the main parent to state how long the child spends watching television (TV) (Item 1) and uses a computer (Item 2) “on a normal weekday during term time.” Response items comprise a 7-point ordinal scale: 1 = None, 2 = Less than an hour, 3 = 1 to 2 hr, 4 = 2 to 3 hr, 5 = 3 to 5 hr, 6 = 5 to 7 hr, and 7 = 7 or more hours.
Academic Achievement
Academic achievement was assessed by the children’s teachers at the end of primary school in the age 11 years sweep. Teachers were asked to rate each child’s ability in seven subjects (English, maths, science, art and design, music, physical education, and information and communication technology [ICT]) on a 5-point scale: 1 = well above average, 2 = above average, 3 = average, 4 = below average, and 5 = well below average. 1 The current analysis uses ratings of teachers in core subjects of English, maths, and science—in addition to ICT, which is hypothesized to be correlated with students’ frequency of use of computers.
Socioeconomic Status
SES was represented in this study using three variables. The first variable was parents’ occupational status when children were aged 3 years. The status of cohort members’ main parent was coded by the study team according to the ONS NS-SEC classification, and for this study, this variable was recoded into three analytic classes representing “low” (routine and manual occupations), “medium” (intermediate occupations), and “high” (higher managerial, administrative and professional occupations) SES (Office for National Statistics [ONS], 2010).
In addition to occupational status, we also included parental educational level and family income as indicators of SES. Parental education was coded according to the national vocational qualification (NVQ) framework by the study team into a categorical variable. In this study, we calculated estimates in relation to a reference group of children with parents without any formal education. Family income (OECD equivalized, weekly) was log-transformed to obtain a continuous variable that approximates a normal distribution.
Analysis Plan
RQ1 (what are the trajectories of screen time across childhood and early adolescence) was addressed using growth mixture modeling (GMM) in Mplus version 8.7. Adopting a person-centered approach, GMM assumes distinct trajectories exist in the data set and classifies individuals into trajectories that have good internal homogeneity, for the number of trajectories that the researcher specifies (Muthén & Muthén, 2000). Following the GMM procedure, a linear growth curve model was applied to the screen time variables collected at ages 5, 7, and 11 years, to generate a growth curve across time. Next, we modeled a series of one to nine trajectories to identify the optimal number of trajectories for the data set. The optimal number of trajectories was identified by comparing model fit statistics, as recommended by Nylund et al., (2007). Optimal fit is identified by having higher Entropy, lower Akaike information criteria (AIC), Bayesian information criteria (BIC), and sample-size adjusted BIC, and significant values of the Lo-Mendel Rubin and Vong Lo-Mendel Rubin likelihood ratio tests (LMR and VLMR). The GMM was computed separately for TV use and computer use. For both analyses, a six-class solution provides the best fit for the data (see appendix for full results of the GMM analysis).
Next, to answer RQ2 (the relationship between screen time trajectories and SES), we used multinomial logistic regression in Stata to associate SES with the screen time trajectories. Multinomial logistic regression provides estimates of relative risk for respondents to belong to a trajectory class compared with the normative reference class. Significant relative risk ratios (RRRs) above 1 indicate greater likelihood to belong to a group (vs. a reference group), while RRRs below 1 indicate lower likelihood for membership in a group. We identified the “normative” trajectory for TV use, and for computer use, based on which trajectory had the largest number of cases compared with the other individual trajectories. This provided us with a reference group to use in the multinomial logistic regression to generate comparisons. We included controls for child’s sex (male/female), ethnic group (White/mixed or multiple ethnic groups/Indian/Pakistani or Bangladeshi/Black/other ethnic group 2 ), and cognitive ability (low/medium/high), as assessed at age 3 years, to assist in isolating the effect of SES on trajectory membership.
To answer RQ3 (the relationship between screen time trajectories and academic achievement), we then employed ordinal least squares (OLS) regression to examine whether screen time trajectories predicted achievement in four school subjects at the end of primary education. To answer RQ4 (the moderating role of SES in the relationship between screen time trajectories and academic achievement), we added SES as a covariate, after controlling for the child’s sex, ethnic group, and cognitive ability.
Results
Screen Time Trajectories
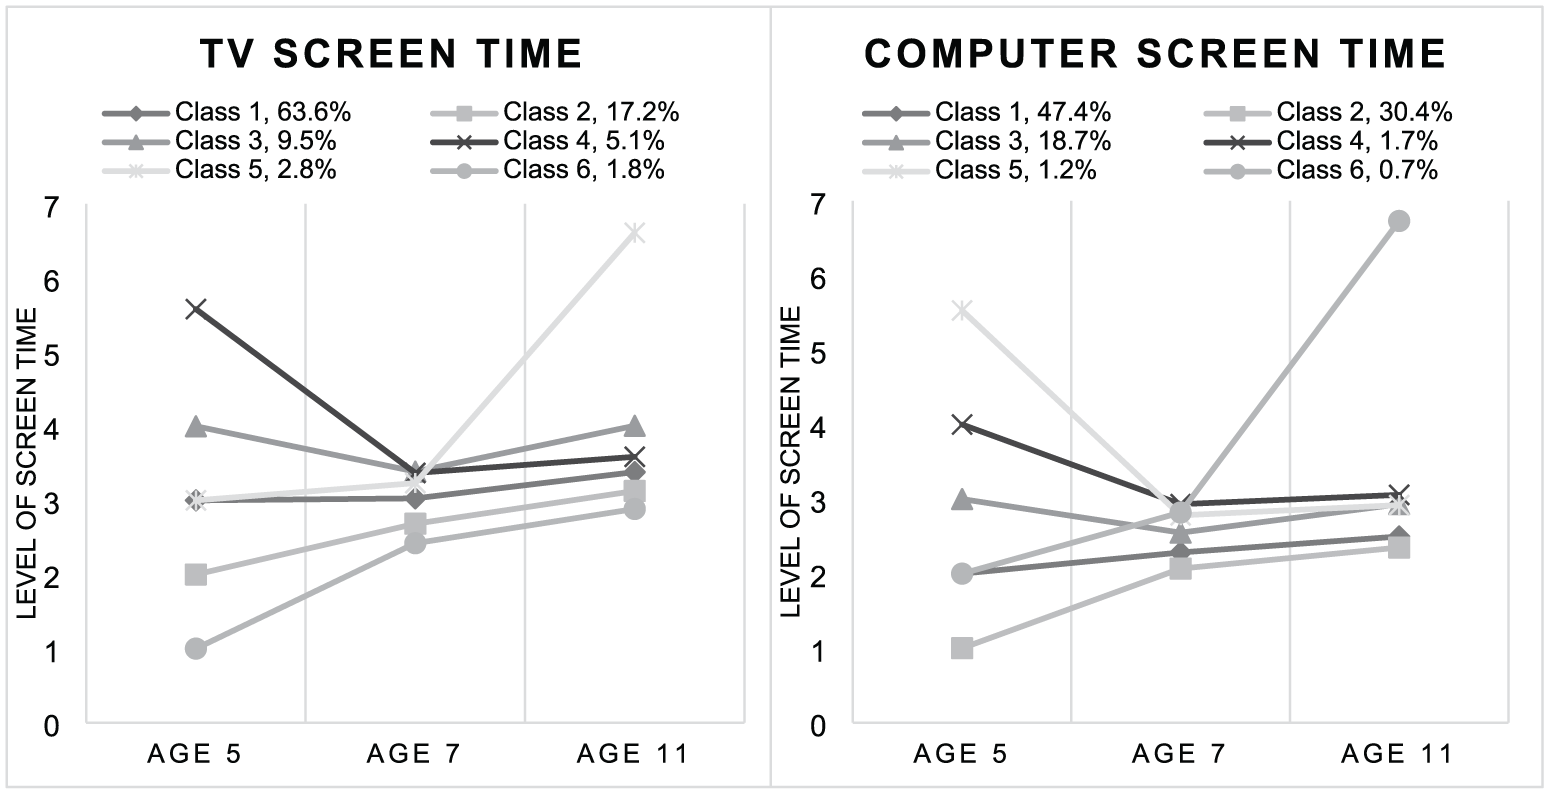
The GMM for both TV screen time and computer screen time found a six-class solution to be the best fit for the data (Table 1). Figure 1 illustrates screen time trajectories showing the six classes for TV screen time on the left panel and those for computer screen time on the right panel.
Model Fit Statistics.
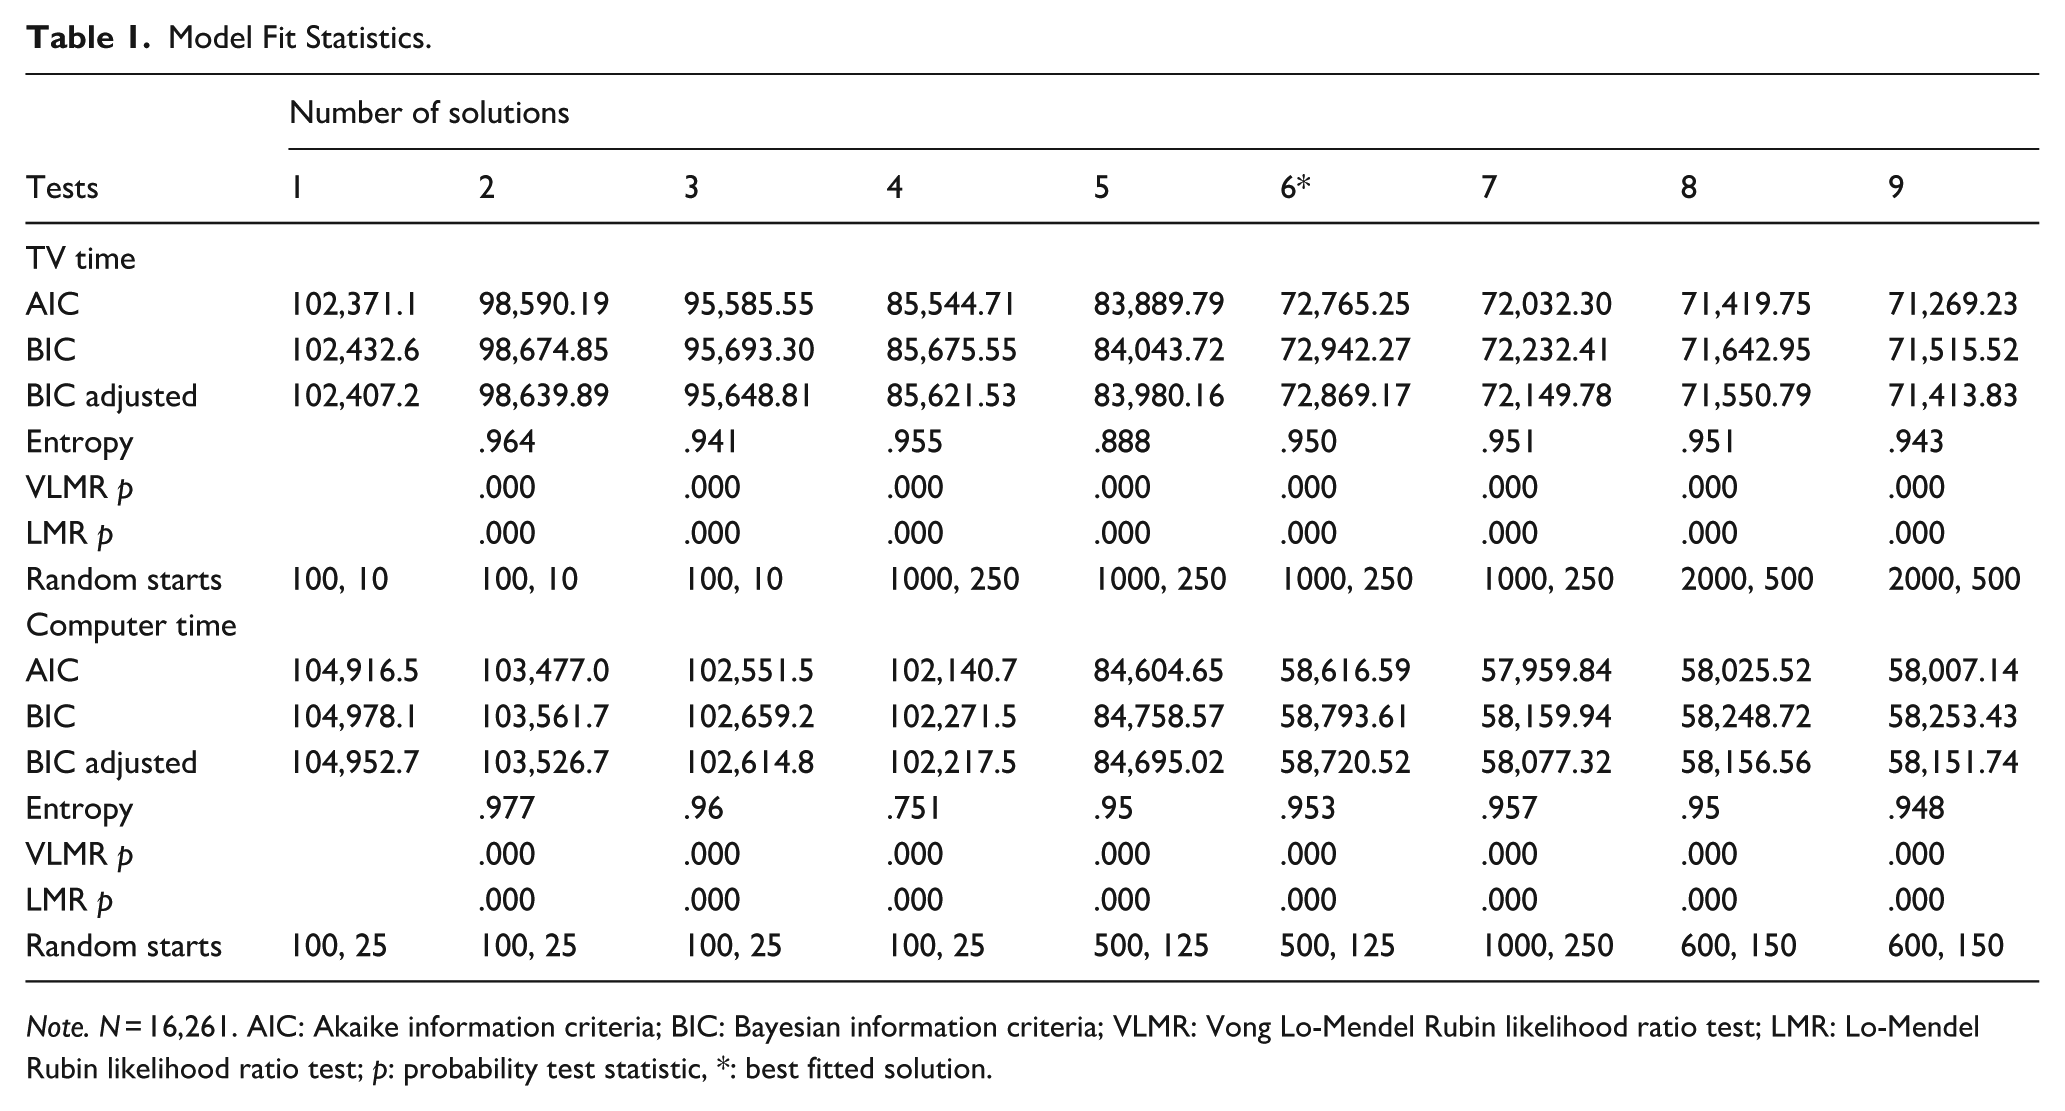
Note. N = 16,261. AIC: Akaike information criteria; BIC: Bayesian information criteria; VLMR: Vong Lo-Mendel Rubin likelihood ratio test; LMR: Lo-Mendel Rubin likelihood ratio test; p: probability test statistic, *: best fitted solution.
TV and Computer Screen Time Trajectories.
TV Trajectories
For TV consumption, the normative trajectory (Class 1) comprised more than half of respondents (63.6%) and can be described as a moderate level of screen time, which remained broadly constant across early-to-mid childhood (moderate, constant). Around a sixth (17.2%) of children were in Class 2 (low, but increasing), and 9.5% in Class 3—moderate-to-high, falling. Trajectory Classes 4, 5, and 6 were relatively much smaller in size (around 5% or less), although these comprised some of the more extreme consumption patterns. Class 4 includes children who have high levels of TV screen time at Age 5, but whose consumption falls to more normative levels as they get older (high, falling); Class 5, by contrast, comprises respondents who have moderate levels of screen time at Age 4 but whose consumption becomes significantly much higher by Age 11 (moderate, increasing). The smallest class (Class 6) consistently consumes TV at much lower levels than their peers across all time points, although there is still a notable increase across time points (very low, increasing).
Computer Trajectories
The right panel shows the six trajectory classes revealed by the GMM for computer screen time. Once again, there was a normative class (Class 1) representing a plurality—although this time not a majority—of respondents (47.4%). These children consistently had moderate-to-low computer usage across early-to-mid childhood (moderate-to-low, constant) according to their parents’ reports. Just under a third of children (30.4%) comprised Class 2, with very low computer screen time at age 5 years, which increased at ages 7 and 11 years, while remaining below that of their peers (very low, increasing). A third class represented almost a fifth of respondents (18.7%), and this group included those with moderate levels of computer usage remaining constant across all time points (moderate, constant). As with TV screen time, the final three classes (4, 5, and 6) were much smaller in size, comprising in total less than 4% of the sample. Classes 4 and 5 start with, respectively, moderate-to-high and very high computer usage at Age 5 before consumption fell by Age 7 and remained moderate across mid-childhood. Class 6, by contrast, comprised children whose computer usage was relatively low at Age 5, but increased significantly across time points to very high levels by Age 11 (moderate-to-low, increasing to high).
Screen Time Trajectories by SES and Other Background Characteristics
Once the distinct screen time trajectories were identified, it was important for us to understand to what extent children’s background characteristics were related to membership of one trajectory or another. This enabled us to understand whether there was any systematic relationship between socio-demographic group and the way in which certain groups consume television and computer media across childhood. Results of the multinomial logistic regression models for TV and computer screen time trajectories are presented in Tables 1 and 2. We included background variables indicating respondents’ sex, ethnicity, socioeconomic status—as defined by parents’ occupational status, parental educational level, and family income—and cognitive ability at age 3 years.
Multinomial Logistic Regression Models for TV Trajectories.
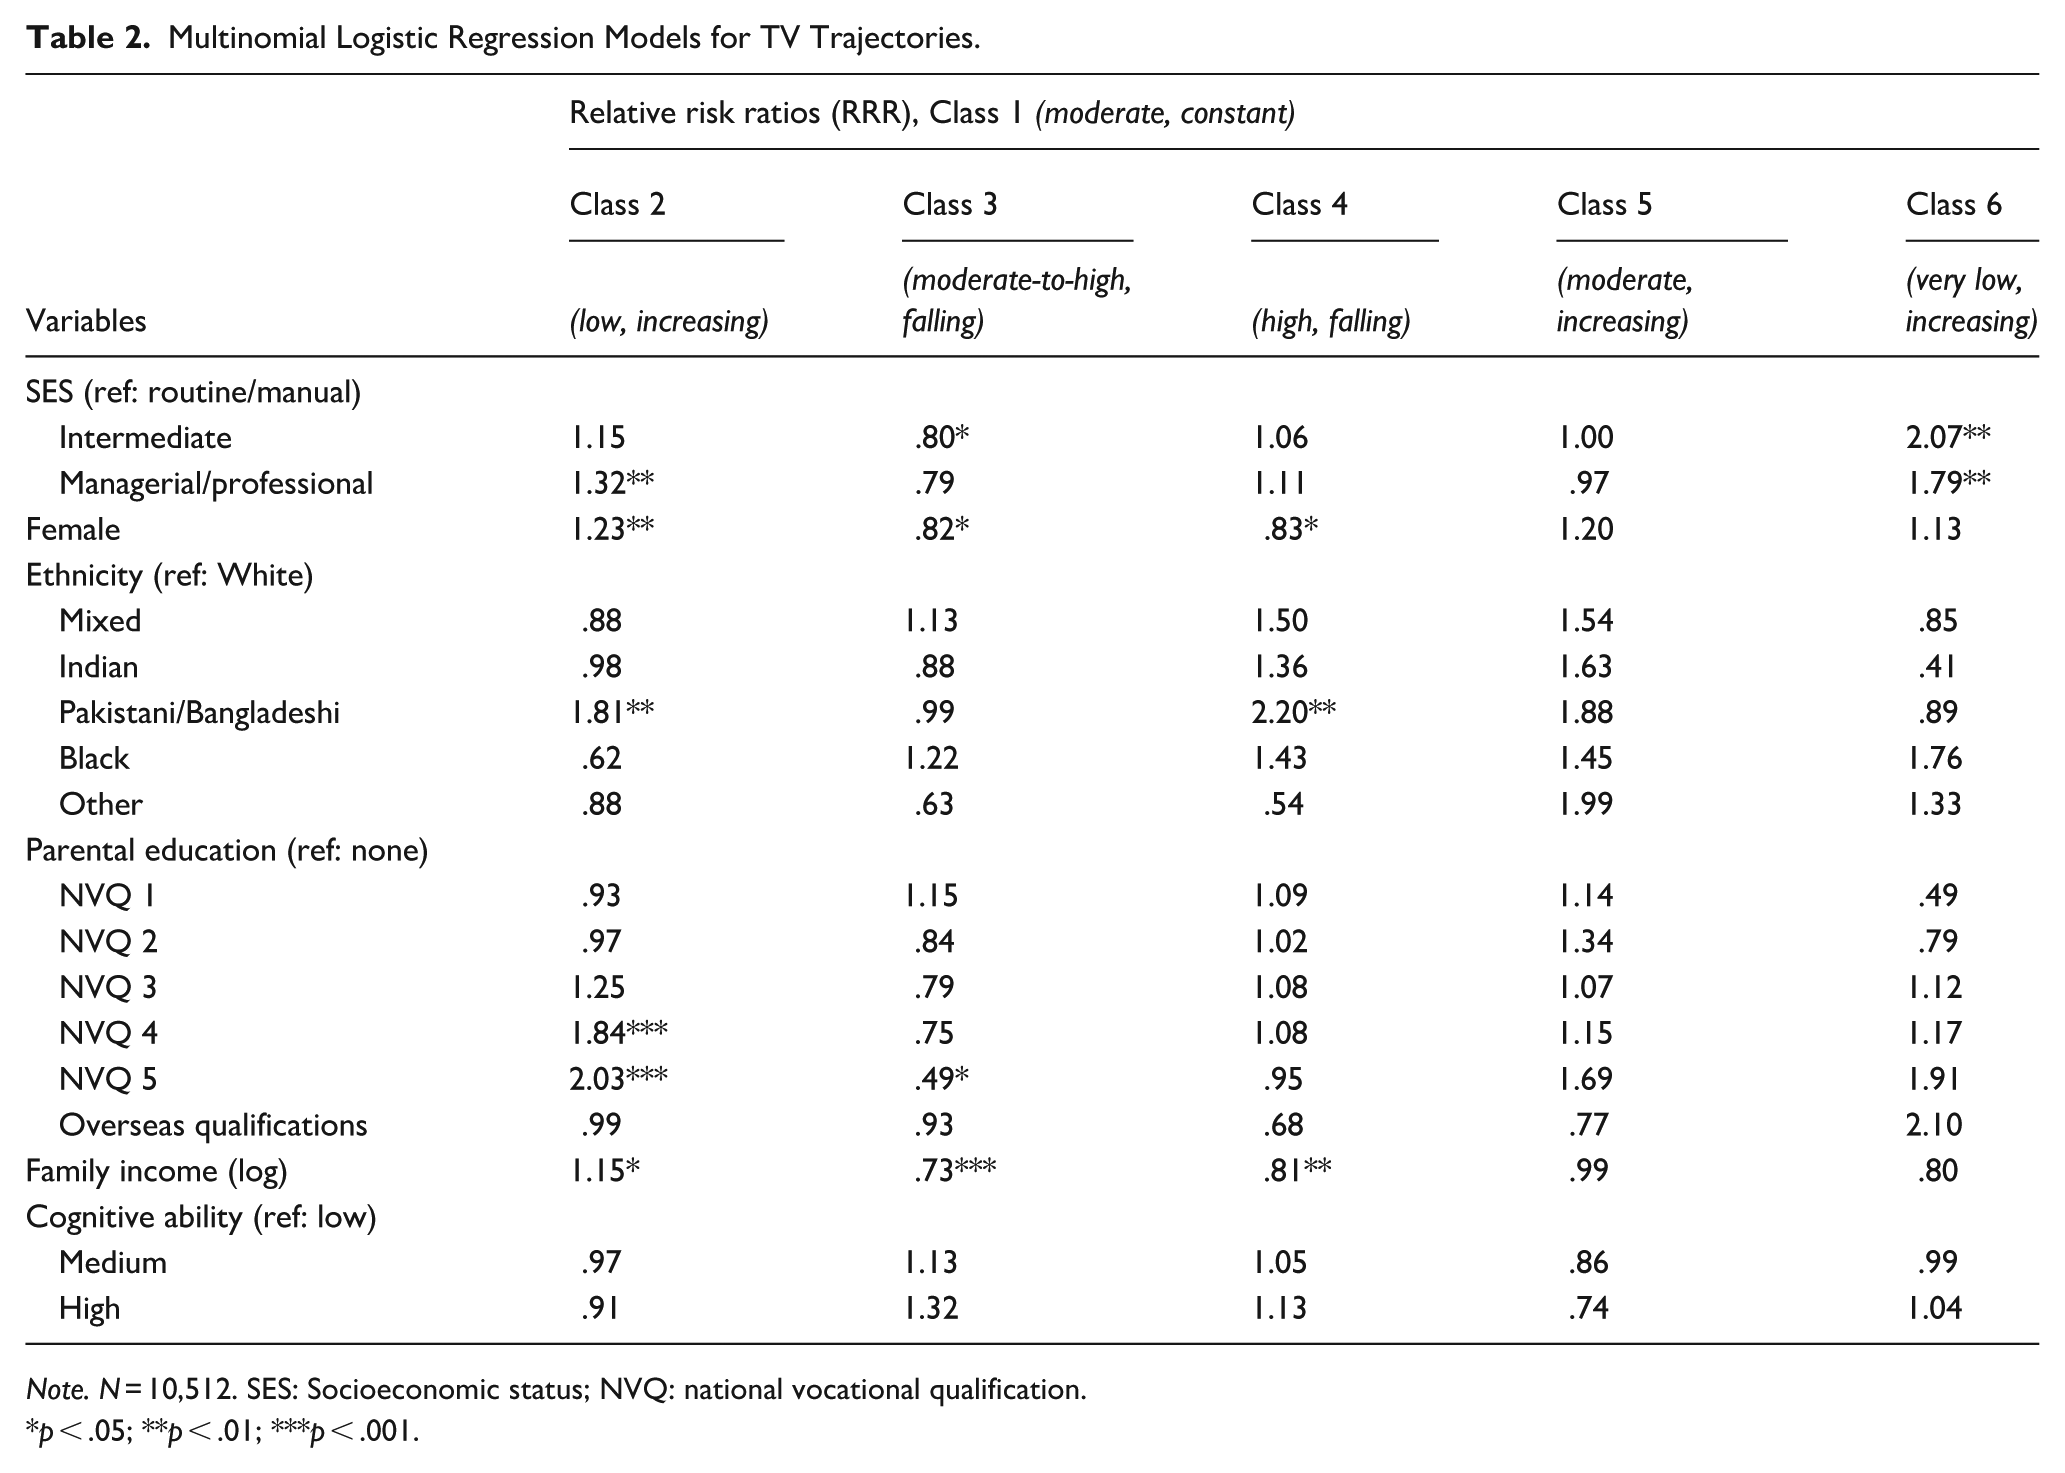
Note. N = 10,512. SES: Socioeconomic status; NVQ: national vocational qualification.
*p < .05; **p < .01; ***p < .001.
TV Trajectories
The model for TV screen time trajectories (Table 2) reveals that girls and Pakistani/Bangladeshi children were more likely to belong to Class 2 (low, increasing) compared with Class 1 (moderate, constant). Membership of this class was also associated with higher-SES groups—those whose parents had managerial or professional occupation, those with more highly educated parents, and those with higher family income levels.
Class 3 (moderate-to-high, falling), by contrast, was more likely to contain boys, with lower income groups more likely to belong to Class 3 compared with the reference group. While SES, as defined by occupational or education measures, indicated lower likelihood to belong to Class 3 for higher-SES groups, statistical significance was only achieved for those whose parents were in intermediate (as compared to routine and manual) occupations.
Factors predicting membership of Class 4 (high, falling) were similar to those for Class 3—boys and those with lower family incomes were more likely to be in Class 4, compared with the reference group. RRRs for ethnic groups also indicated that Pakistani/Bangladeshi children were significantly more likely to belong to Class 4, while other ethnic minority groups (i.e., Mixed, Indian, and Black) also had RRRs greater than 1.
While none of the background factors included in the model statistically significantly predicted membership of Class 5 (moderate, increasing), compared with Class 1, the highest RRRs were for ethnic minority groups—Other (RRR = 1.99, p = .23), Pakistani/Bangladeshi (RRR = 1.88, p = .13), and Indian (RRR = 1.63, p = .21).
Higher-SES groups, as defined by occupational status, were more likely to belong to Class 6 (very low, increasing) than the reference group. In particular, children with parents in “intermediate” occupations were twice as likely to be in this group than children with parents in routine or manual jobs. Those with parents in the highest managerial/professional SES group were also significantly more likely to be in Class 6 compared with the lowest SES group but the RRR was not as large.
Cognitive ability grouping did not appear to predict membership of any TV trajectory class in any of the models.
Computer Trajectories
Turning to the model for computer screen time (Table 3), we see that, compared with Class 1 (moderate-to-low, constant), Class 2 (very low, increasing to moderate) was more likely to include girls and less likely to include higher income groups. This class was also less likely to include those from Black or Mixed backgrounds than White children.
Multinomial Logistic Regression Models for Computer Use Trajectories.
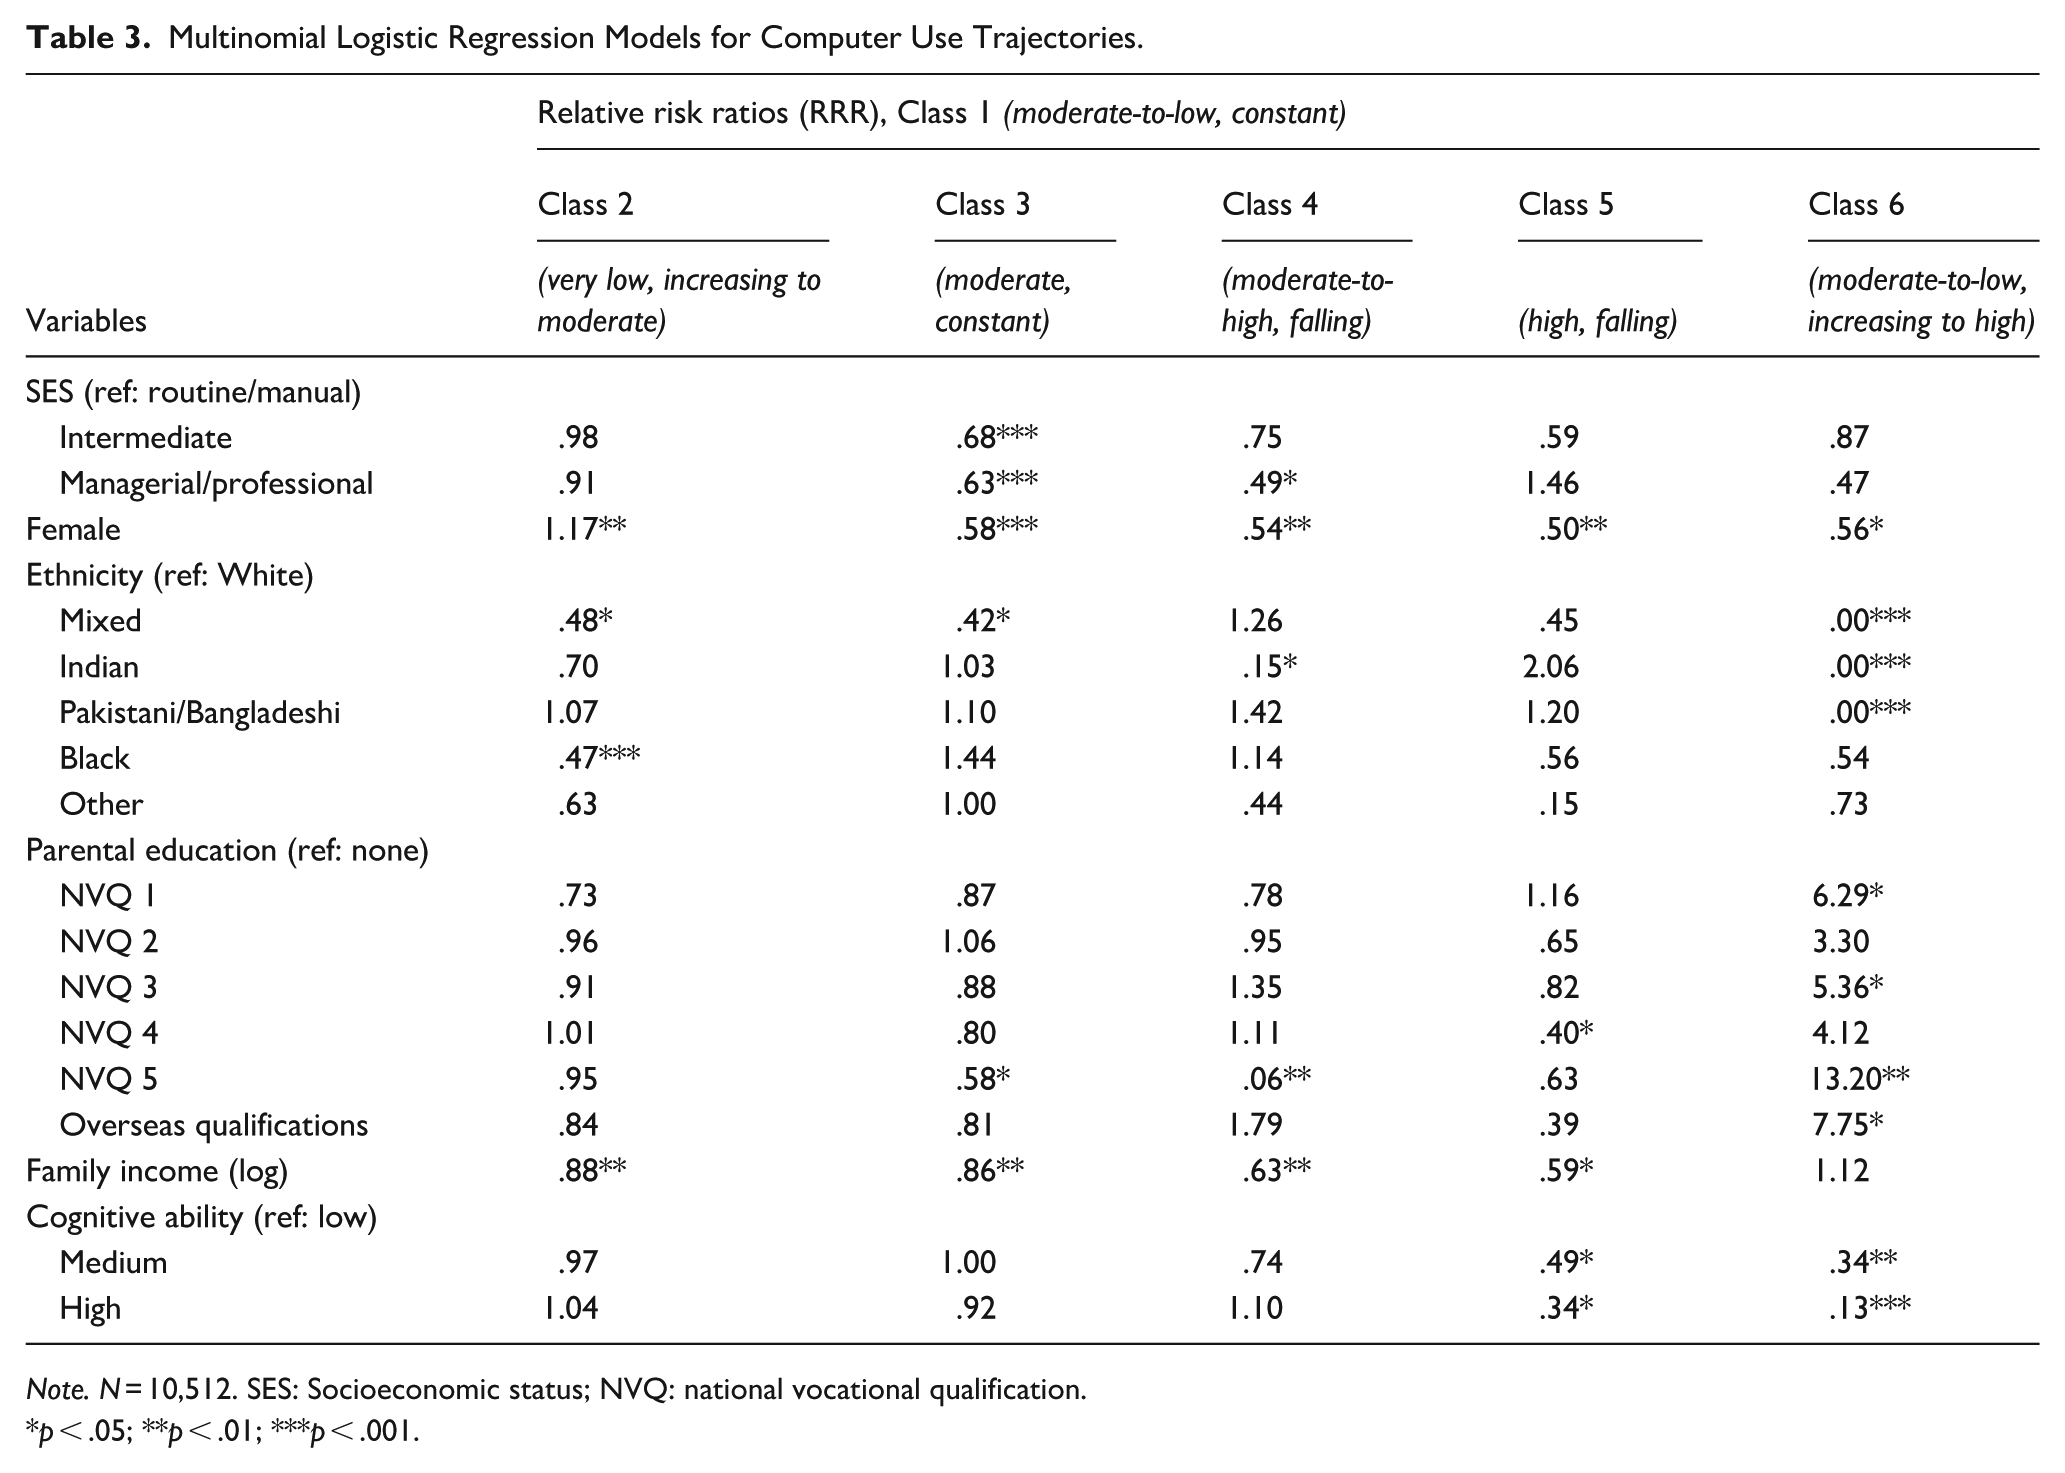
Note. N = 10,512. SES: Socioeconomic status; NVQ: national vocational qualification.
*p < .05; **p < .01; ***p < .001.
Class 3 (moderate, constant) was more likely to include children from low-SES backgrounds (less likely to include children whose parents have intermediate or managerial/professional occupations), with family income also negatively correlated with membership of this trajectory class. Girls were less likely to belong to this class, as were children with mixed ethnicity and those with university-educated parents.
Low-SES and low-income groups were less likely to belong to Class 4 (moderate-to-high, falling), compared with the normative reference group, as were children from an Indian background. Children with university-educated parents compared with children whose parents had no formal education were only 6% as likely to be in this trajectory class compared with Class 1 (RRR = .06, p = .004).
Class 5 (high, falling) was more likely to include boys, while children with parents educated at NVQ4 level were less likely than parents with no qualifications to belong to this trajectory class. Family income was negatively correlated with membership of Class 5, as compared with Class 1. It was also more likely to contain children with low cognitive ability.
There were no children from mixed, Indian, or Pakistani/Bangladeshi background in the smallest class, Class 6 (moderate-to-low, increasing to high). This class was less likely to contain girls than the reference group. While there was no significant relationship between membership of this class and occupational status or family income, there was a strong relationship with parental education—those with parents educated to degree level were 13 times more likely to be in this group than were children with uneducated parents. Interestingly, despite this, this group was much less likely to contain children with medium or high cognitive ability, as compared to low cognitive ability. Nonetheless, it is important to bear in mind that this class was the smallest, which may exaggerate the impact of individual respondents in the analysis.
Academic Achievement
Having established that children from certain backgrounds were more likely to follow specific screen time trajectories, we next examined whether membership of different trajectory classes was associated with academic achievement in four school subjects. Our models also estimated the interaction effect of SES 3 with trajectory class membership to assess whether the relationship between screen time trajectory and academic ability was different for children from different socioeconomic backgrounds.
TV Trajectories
Figure 2 presents findings of the regression models on English, maths, science, and ICT performance with regard to TV screen time trajectories. The models show that students in all trajectory classes had lower academic performance across all four subjects, compared with the normative (moderate, constant) trajectory. However, the effects were not statistically significant for children in Class 2 (low, increasing) or Class 4 (high, falling) and, for Class 5 (moderate, increasing), only science achievement achieved statistical significance at the p < .10 level. For students in Class 3, the magnitude of the detrimental effect of this screen time trajectory (moderate-to-high, falling) was similar but also achieved statistical significance at the p < .10 or p < .05 level.
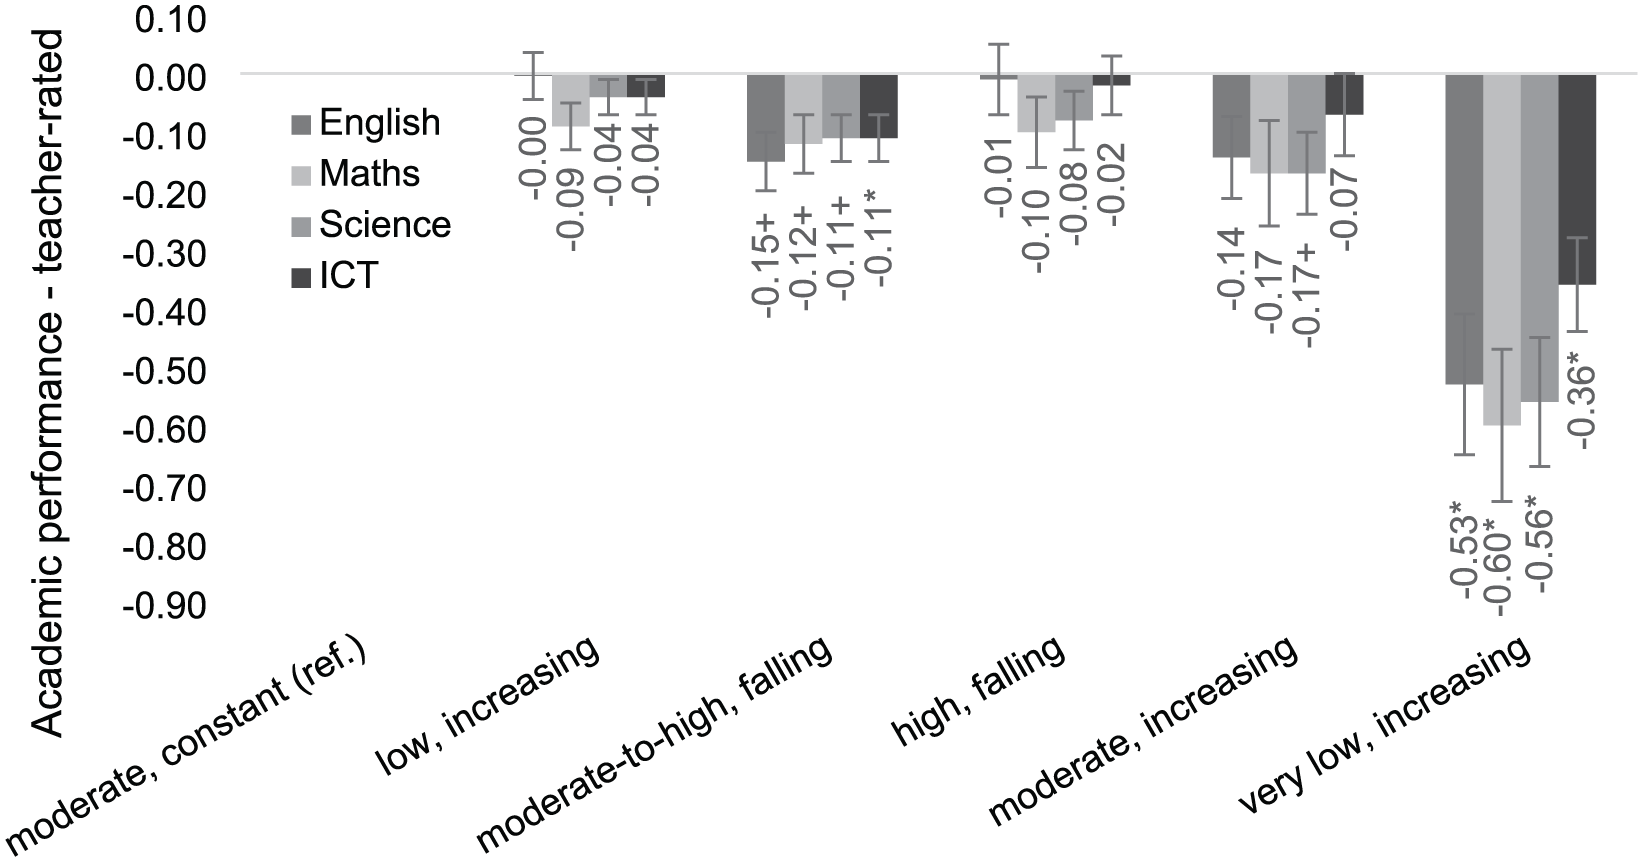
Effect of TV Trajectories on Academic Achievement.
The largest effects can be seen for the smallest, Class 6 group, who scored between .36 and .6 points lower for their academic performance, compared with the normative reference class. Although this group experienced an increasing screen time trajectory across early-to-mid childhood, they remained the group with the lowest consumption of television relative to their peers.
Interaction effects between trajectory membership and SES were largely not statistically significant (see Appendix 1, Table 4). However, for students in Class 6, SES did moderate the relationship between screen time trajectory class and academic ability in English, maths, and science. As shown in Figure 3, students in this trajectory class whose parents worked in routine or manual occupations were assessed by their teachers as having lower academic achievement in these subjects, while no statistically significant effect was seen for children from higher-SES backgrounds.
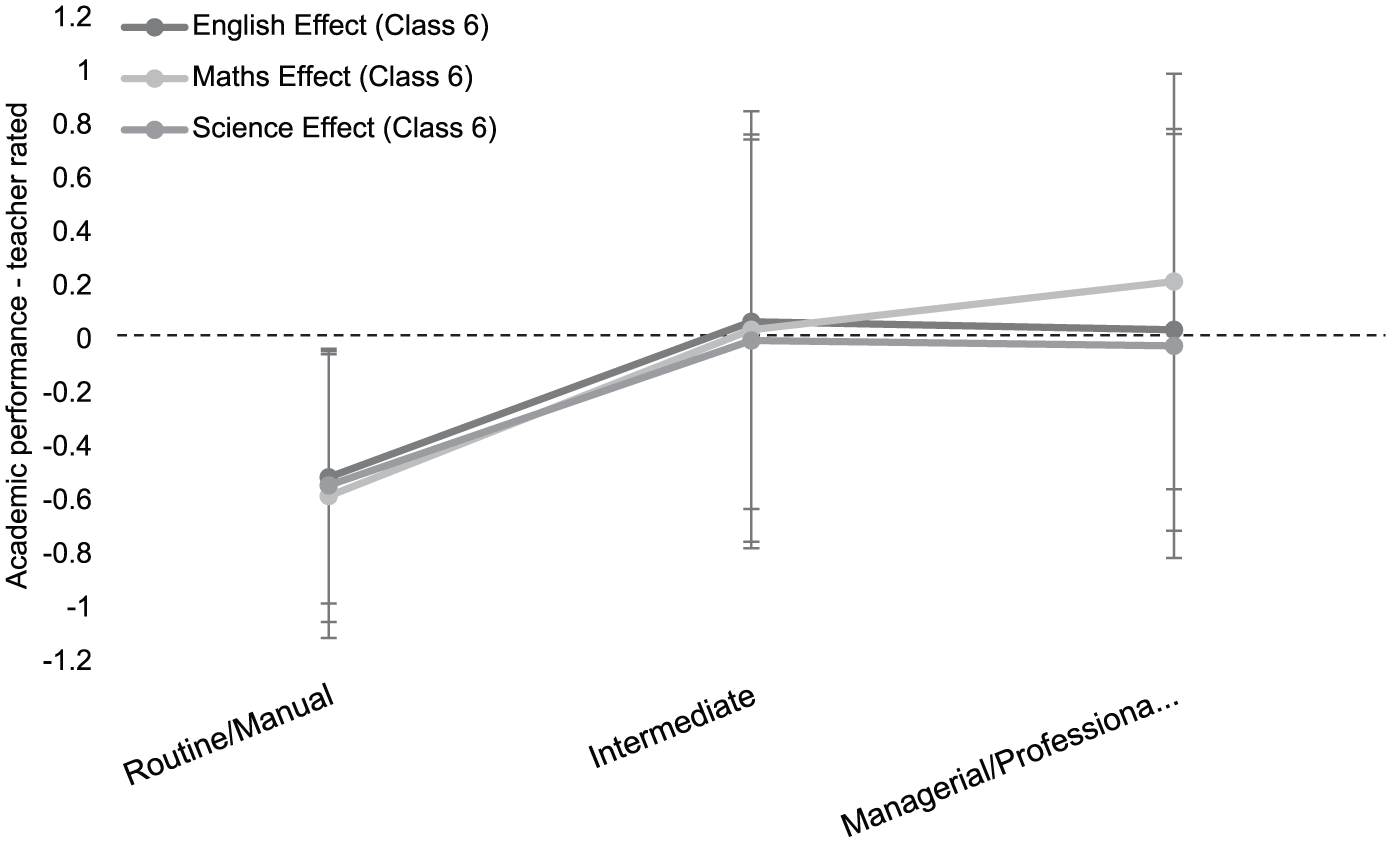
Interaction Effect on English, Maths, and Science of Class 6 (Very Low, Increasing TV) with SES.
Computer Screen Time
While the detrimental effect of non-normative TV screen time trajectories was apparent, the findings of the models predicting academic performance by computer screen time trajectories provided more of a mixed picture (Figure 4). The main effects of the models were much smaller compared with the results of the TV trajectory models, and for most of the trajectory classes, no statistically significant differences emerged in comparison with membership of the normative reference class. Membership of Class 2 (very low, increasing), however, was associated with .17-point reduction in maths ability (p < .01) and a .10-point reduction in science ability (p < .05), compared with students in Class 1 (moderate-to-low, constant). Having a constant screen time trajectory even slightly higher than the norm (Class 3: moderate, constant vs. Class 1: moderate-to-low, constant) was associated with a marginally significant fall in maths ability (β = −.03, p < .10), although in other subjects there was no statistically significant difference or even a marginally positive effect. As shown in the full table (Appendix 1, Table 5), none of the interaction effects for Class 2 or Class 3 membership with SES were statistically significant, indicating that SES did not moderate the relationship between these screen time trajectories and academic performance.
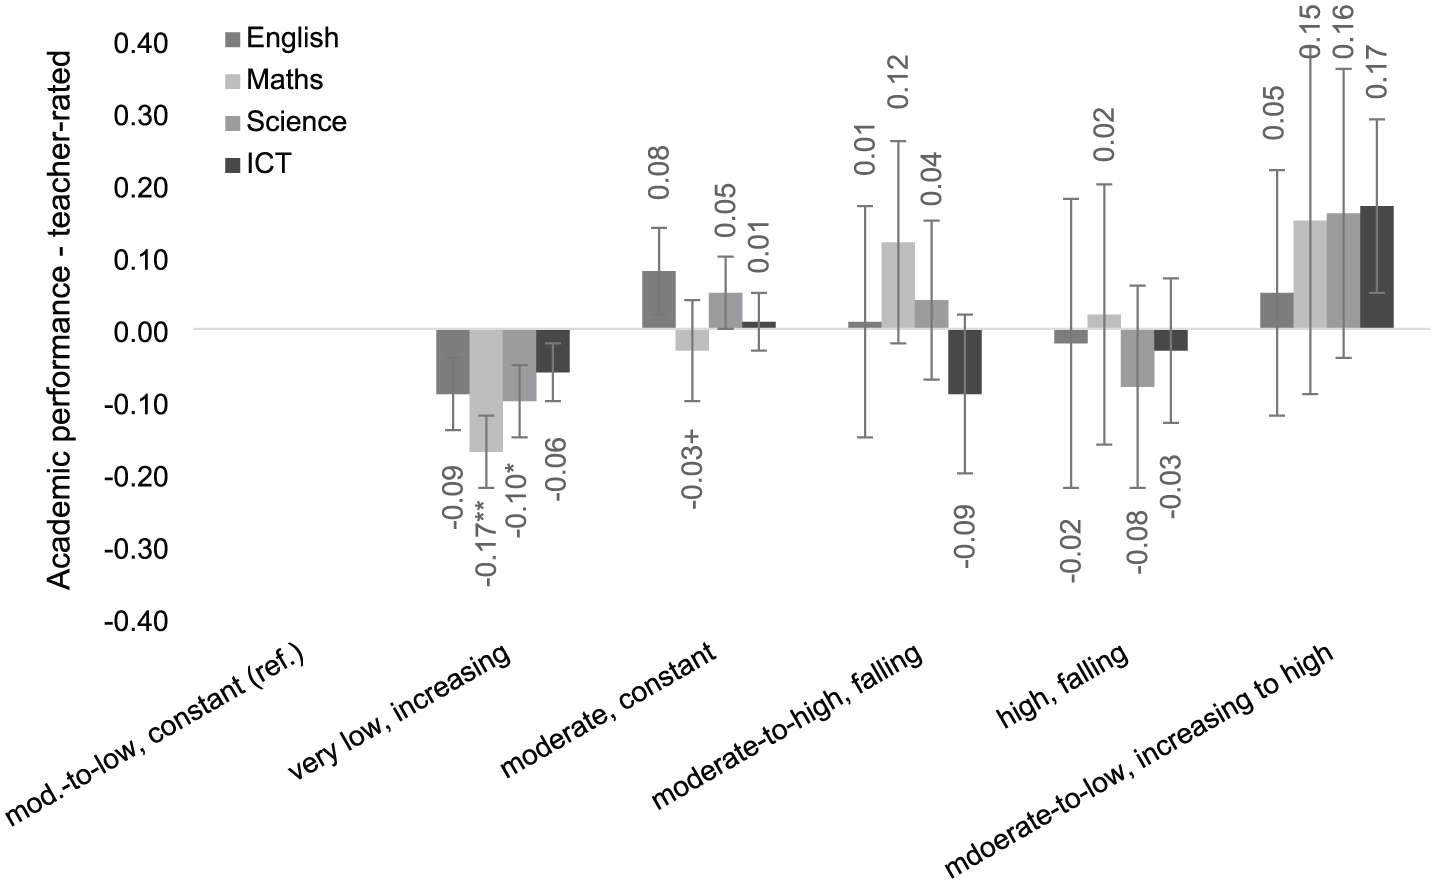
Effect of Computer Trajectories on Academic Achievement.
Discussion and Conclusion
In summary, our analysis of screen time patterns across childhood to early adolescence identified six distinct trajectories for both TV and computer usage. Regarding TV screen time, most children’s (63.6%) consumption of TV remained relatively constant, at between 1 and 3 hr per week during term time (the TV normative class). Similarly, for computer use, around half of children (47.4%) had consistently moderate-to-low consumption—between 1 and 2 hr per week—across the same time period (the computer normative class). Other identified trajectory classes contained a smaller proportion of children and described trajectories that deviated from the norm to a greater or lesser degree. Some of the more extreme trajectories contained a very small proportion of children, yet these were still useful for helping us understand the relationship between trajectories and the other study variables.
Background characteristics, such as gender, ethnicity, and SES were moderately predictive of some trajectory groups; for example, girls were more likely to belong to classes with lower TV and computer consumption than boys, while Pakistani/Bangladeshi children’s TV screen time trajectories were more likely to be at higher or lower levels than the normative class. Interestingly, cognitive ability as measured at Age 3 was not related to trajectories of TV consumption, while for computer screen time, students in the lower cognitive ability group were significantly more likely to be in trajectory classes with more extreme patterns of consumption—higher at Age 5 (Class 5) or higher at Age 11 (Class 6).
In relation to academic ability, students in all TV screen time trajectory classes had lower performance across all four subjects, compared with the normative (moderate, constant) trajectory. This might indicate that moderate consumption of TV exerts a somewhat protective effect on primary-school-aged children—in line with Przybylski and Weinstein’s (2017) goldilocks hypothesis, which found that a moderate level of digital technology use is beneficial for young people’s mental well-being. This is especially intriguing, given that the most pronounced detrimental effect is seen for those in the smallest Class 6 group, which, although experiencing increasing screen time across early-to-mid childhood, remain the group with the lowest screen time relative to their peers.
While it might be concluded that very low consumption of TV is a potential risk factor in and of itself, our moderation analysis further showed that the negative impact of membership of this trajectory class only applied to students from low-SES backgrounds, with no significant difference seen for those from more well-off families. This pattern of very low consumption may instead be providing an indicator of access to media consumption. What we note as an association between below-average levels of screen time with lower levels of academic performance may primarily be an indication of households’ inability to afford multiple TV sets or computers, which restricts children’s ability to spend time on their devices (e.g., in their bedrooms). Limited access to resources is a well-established mechanism through which the SES attainment gap functions to hinder the academic achievement of students from less well-off backgrounds (Bradley & Corwyn, 2002; Crosnoe et al., 2010; Kaye, 2024).
The association between screen time and academic performance was less clear in relation to using computers. As with the TV screen time analysis, it is the group with the lowest use of computers who had the greatest detrimental effect in relation to their performance in maths and science (although not, interestingly, in ICT). While the effect sizes were much smaller for the computer screen time analysis, this time no interaction effect is seen, indicating that this relationship was not moderated by students’ SES background. Again, this may invoke a goldilocks effect, especially as computer usage becomes more integrated into children’s everyday lives and school education, with those unable to access or use digital technology being placed at a disadvantage relative to their peers. However, more research is needed to verify this both in a UK context, and in relation to academic as well as other developmental outcomes.
Limitations and Further Research
The findings should be considered in relation to the study limitations, while also pointing to several potential paths for future research. One limitation is that our outcome variable of academic achievement represented teacher-rated achievement of the child in comparison with an “average pupil” and, while this is useful as a normative and contextualized assessment of a child’s learning, the measure is not standardized and could be subject to teachers’ subconscious prejudices (Gillborn, 2006; Hartas, 2011). Further research might seek to assess the relationship between screen time trajectories on standardized achievement tests. A second limitation is that although our screen time trajectory classes provide an insight into the media consumption patterns of this cohort of children, the trajectory classes cannot be generalized to either the population at large or to other cohorts in the UK context. Identification of a “normative” trajectory for TV and computer screen time allows for an analysis of “alternative” patterns of consumption, although it must be acknowledged that some of the most extreme trajectories comprise relatively small groups of respondents, and we advocate for further research to corroborate these findings. In addition, because data were available at only three time points, we were unable to test alternative functional forms of growth (e.g., quadratic trajectories), which may have provided a more nuanced representation of change over time. A further limitation is that in our models SES is treated as a fixed effect, whereas in reality socioeconomic circumstances often change over time for families; although this is a common methodological approach, it should be borne in mind when interpreting the results. Finally, in relation to the inferences we have drawn from our results, there is the potential for omitted variable bias, and future research may wish to include further factors such as parenting styles and number of TV sets/computers in the household to disentangle the specific effects of screen time from those of SES.
While our research provides important evidence in relation to the quantity of children’s screen time, we cannot make any conclusions about the quality or variety of the content being consumed, which is likely to be at least as important (Puzio et al., 2022). Moreover, our analysis of children born in the early 2000s is already outdated, with advances in digital device technology and changing patterns of consumption of television, gaming and social media (e.g., a shift toward more short-form content, greater access to handheld devices, and greater proliferation of user-generated content) already potentially leading to significant changes in how media consumption impacts upon children’s development and outcomes. This important area of research needs to keep up with the pace of technological advancements and patterns of use to inform evidence-based guidelines and regulation to support families and young people to safely navigate their media consumption.
Footnotes
Appendix 1
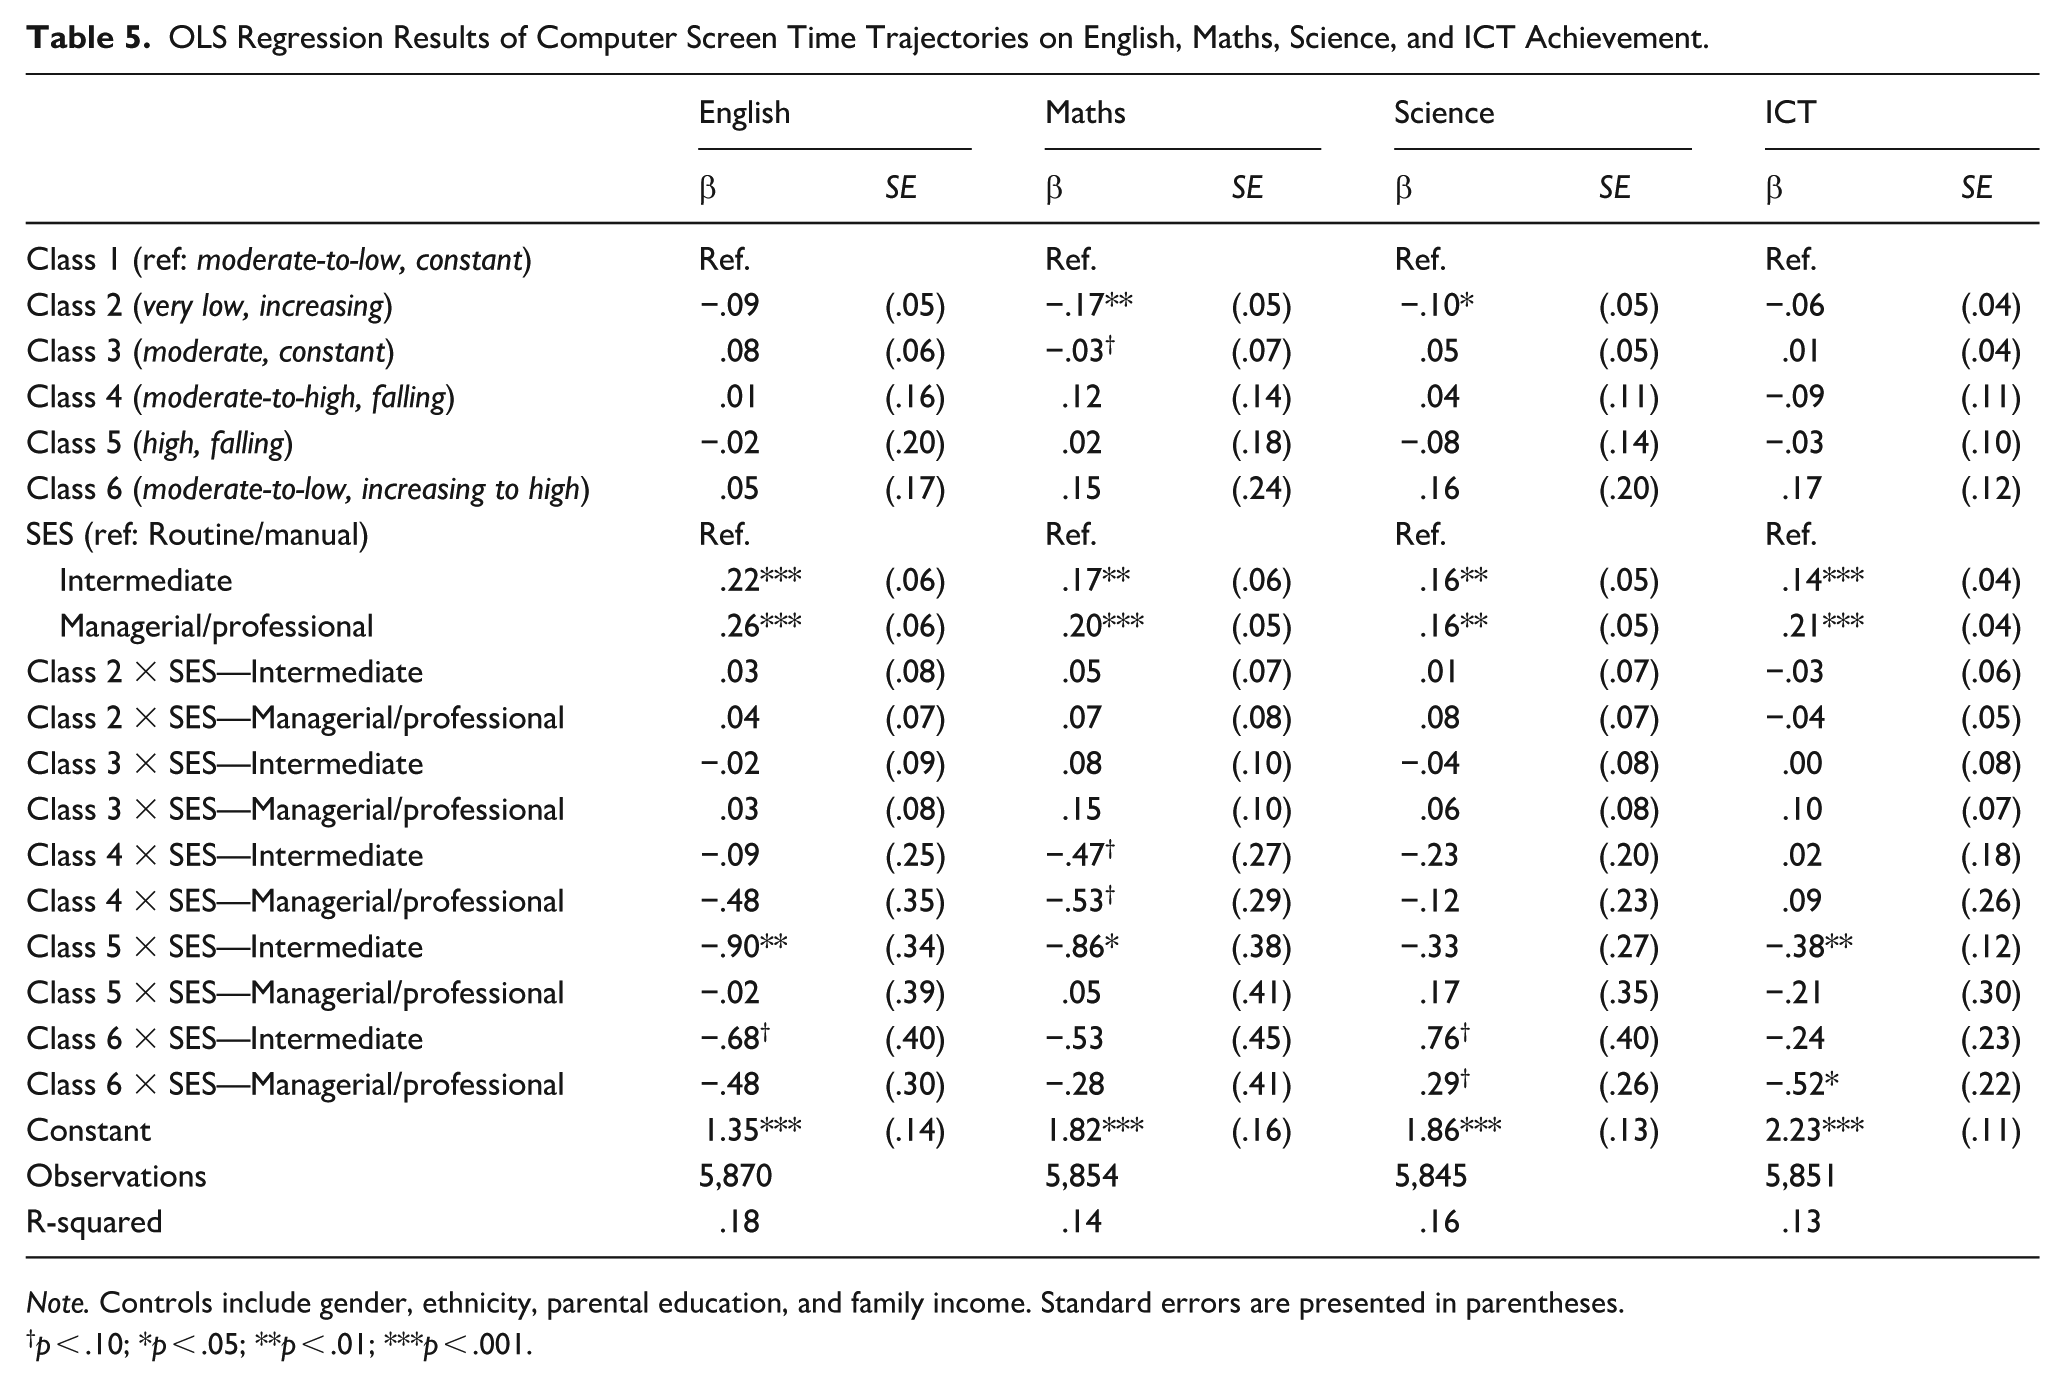
OLS Regression Results of Computer Screen Time Trajectories on English, Maths, Science, and ICT Achievement.
| English | Maths | Science | ICT | |||||
|---|---|---|---|---|---|---|---|---|
| β | SE | β | SE | β | SE | β | SE | |
| Class 1 (ref: moderate-to-low, constant) | Ref. | Ref. | Ref. | Ref. | ||||
| Class 2 (very low, increasing) | −.09 | (.05) | −.17** | (.05) | −.10* | (.05) | −.06 | (.04) |
| Class 3 (moderate, constant) | .08 | (.06) | −.03 † | (.07) | .05 | (.05) | .01 | (.04) |
| Class 4 (moderate-to-high, falling) | .01 | (.16) | .12 | (.14) | .04 | (.11) | −.09 | (.11) |
| Class 5 (high, falling) | −.02 | (.20) | .02 | (.18) | −.08 | (.14) | −.03 | (.10) |
| Class 6 (moderate-to-low, increasing to high) | .05 | (.17) | .15 | (.24) | .16 | (.20) | .17 | (.12) |
| SES (ref: Routine/manual) | Ref. | Ref. | Ref. | Ref. | ||||
| Intermediate | .22*** | (.06) | .17** | (.06) | .16** | (.05) | .14*** | (.04) |
| Managerial/professional | .26*** | (.06) | .20*** | (.05) | .16** | (.05) | .21*** | (.04) |
| Class 2 × SES—Intermediate | .03 | (.08) | .05 | (.07) | .01 | (.07) | −.03 | (.06) |
| Class 2 × SES—Managerial/professional | .04 | (.07) | .07 | (.08) | .08 | (.07) | −.04 | (.05) |
| Class 3 × SES—Intermediate | −.02 | (.09) | .08 | (.10) | −.04 | (.08) | .00 | (.08) |
| Class 3 × SES—Managerial/professional | .03 | (.08) | .15 | (.10) | .06 | (.08) | .10 | (.07) |
| Class 4 × SES—Intermediate | −.09 | (.25) | −.47 † | (.27) | −.23 | (.20) | .02 | (.18) |
| Class 4 × SES—Managerial/professional | −.48 | (.35) | −.53 † | (.29) | −.12 | (.23) | .09 | (.26) |
| Class 5 × SES—Intermediate | −.90** | (.34) | −.86* | (.38) | −.33 | (.27) | −.38** | (.12) |
| Class 5 × SES—Managerial/professional | −.02 | (.39) | .05 | (.41) | .17 | (.35) | −.21 | (.30) |
| Class 6 × SES—Intermediate | −.68 † | (.40) | −.53 | (.45) | .76 † | (.40) | −.24 | (.23) |
| Class 6 × SES—Managerial/professional | −.48 | (.30) | −.28 | (.41) | .29 † | (.26) | −.52* | (.22) |
| Constant | 1.35*** | (.14) | 1.82*** | (.16) | 1.86*** | (.13) | 2.23*** | (.11) |
| Observations | 5,870 | 5,854 | 5,845 | 5,851 | ||||
| R-squared | .18 | .14 | .16 | .13 | ||||
Note. Controls include gender, ethnicity, parental education, and family income. Standard errors are presented in parentheses.
p < .10; *p < .05; **p < .01; ***p < .001.
Author Contributions
Conceptualization (NK and JS), data curation (NK), formal analysis (NK and JS), methodology (NK and JS), project administration (NK), visualization (NK), and writing—original draft (NK, JS).
Funding
The authors received no financial support for the research, authorship, and/or publication of this article.
Declaration of Conflicting Interests
The authors declared no potential conflicts of interest with respect to the research, authorship, and/or publication of this article.