
Abstract
The lack of a valid and interpretable score to track early child development over time is a primary reason for neglecting child development in policymaking. Many instruments exist, but there is no accepted method for comparing their scores across different ages, samples, and instruments. This paper aims (1) to enhance the Development Score (D-score), a unidimensional scale for early child development, to compare measurements across ages, samples, and instruments, (2) to develop a conversion key that enables the transformation of measurements obtained from existing instruments into a D-score, and (3) to investigate two new measures designed to optimize the quantification of the D-score. Study 1 gathered data from 51 sources in 32 countries among 66,075 children using 18 instruments with 2,211 items. Subject matter experts used the output of the Study-1 true score equating model to create the Global Scales for Early Development Short Form (GSED SF) and Long Form (GSED LF). Study 2 collected additional data on the GSED LF and GSED SF in three countries among 4,374 children. The Study-2 model enables the conversion of measurements into a D-score for 20 different instruments. We propose the D-score as a unifying evaluation unit to reduce fragmentation, simplify measurement, and enhance comparability.
Keywords
Introduction
Problem Description
The foundations of sustainable development are embedded in children’s early development from birth to age 3 years (Black et al., 2017). During this period, sensitivity to adversities and nurturing caregiving, heightened by rapid brain development, has long-lasting effects on human capital, including health, well-being, and economic capacity. Although the impact of caregiving interventions on children’s early development has been well-documented in low- and middle-income countries (LMIC; Black et al., 2023), many countries neglect early child development. There are relatively few programs to advance children’s early development, and few governments are aware of the status of their infants’ and toddlers’ early development (Shawar & Shiffman, 2017).
The lack of a valid and interpretable score to track young children’s development across time and contexts is a primary reason for the neglect of children’s development. Children’s early development advances very quickly, so items required to measure a given construct (e.g., language) at earlier ages are no longer appropriate for older ages, necessitating more sophisticated items. Furthermore, some aspects of development are considered to be culturally-bound (Super & Harkness, 1997), requiring instruments that are aligned to different cultural contexts. Indeed, a World Bank toolkit (Fernald et al., 2017) identified 147 instruments for measuring early child in LMIC. While there is significant overlap in the underlying constructs measured, the instruments differ in score definition, making comparisons across instruments difficult and suggesting the need to check for measurement invariance (Putnick & Bornstein, 2016; van de Schoot et al., 2012). In addition, as the science of early development advances, new and improved instruments appear. Multiple measures of the same construct are an inherent issue of developmental research (McArdle et al., 2009) that could be remedied by a valid and interpretable score to measure childhood development across time, contexts, and instruments.
The multiple overlapping domains that comprise early child development—language, motor, cognition, social-emotional, and adaptive behavior—present another challenge. Although these domains are unique, they are interdependent, reflecting a common underlying latent construct, and in most children develop in a predictable ordinal pattern that is relatively invariant across countries (Ertem et al., 2018; Kärtner et al., 2020; Villar et al., 2019). A single comprehensive scale that incorporates representation from all domains would facilitate comparisons over time and across populations.
Child development instruments vary by their intended use. Population-level instruments measure children’s development from a population perspective, as reflected in the United Nations Sustainable Development Goals (SDGs; UNESCO Institute for Statistics [UIS], 2018). Without a single, easy-to-interpret scale, governments are unable to monitor changes in the proportion of the population that is developmentally on or off track, or target interventions to populations in greatest need. Program-level instruments measure the impact of interventions on groups targeted for interventions, while individual-level instruments identify developmental performance in individual children. A single comprehensive scale of children’s early development is needed to facilitate monitoring across populations, assess the impact of interventions, track individual children’s progress across ages, and collate data in meta-analyses.
Objectives
In this article, we propose a solution for measuring early child development through a recently derived scale that allows tracking development over time and contexts quantifying the impact of interventions, and comparing effects across sources. Our aims are as follows:
To enhance the Development Score (D-score), a unidimensional scale for early child development, to compare measurements across ages, samples, and instruments;
To develop a conversion key that enables the transformation of measurements obtained from existing instruments into a D-score;
To investigate two new measures designed to optimize the quantification of the D-score.
The D-score
The Developmental Score (D-score) captures a subset of skills from the five core developmental domains—language, motor, cognition, social-emotional, and adaptive behavior—during the first 3 years of life. It unifies early development into a single linear construct by conceptualizing advances in observable behaviors as manifestations of an innate, underlying process. The D-score taps into dynamic processes that drive early child development by focusing on the subset of developmental skills that share common variance across domains and contexts. This process reflects changes in brain structure and function combined with environmental interactions (Immordino-Yang et al., 2018), contributing to the formation of competencies.
The D-score is a single latent construct for early child development represented through a linear scale with interval properties. Using longitudinal data from 2,151 Dutch children aged 0–2 years, Jacobusse et al. (2006) and van Buuren (2014) proposed the D-score and developed a chart for monitoring early child development over time, similar to growth charts for height and weight. Weber et al. (2019) extended the D-score to an international context using longitudinal data from over 36,000 children across 11 low-, middle-, and high-income countries, with multiple samples and instruments. This extension allows for the comparison of child development across different samples, even when the instruments and child ages in those samples differ.
This study aims to enhance the comparability of child development measurements by incorporating caregiver-reported instruments into the D-score framework. Caregiver-reported instruments rely on the observations and insights of parents or primary caregivers, who are often best positioned to provide detailed and nuanced information about the child’s day-to-day activities. These instruments are easy to administer, flexible, and cost-effective, but they may be sensitive to bias and show high variability among reporters (Fernald et al., 2017, p. 52). They are widely used in low- and middle-income countries, where direct assessment is often not feasible. The study by Weber et al. (2019) was limited to direct assessments. Combining caregiver-reported and direct assessments provides the most comprehensive and accurate evaluation of a child’s developmental status.
This study is part of the Global Scales for Early Development (GSED) project, led by the World Health Organization (WHO; Cavallera et al., 2023). The GSED project aims to develop a robust, universal, and psychometrically sound instrument to measure the development of children aged 0–3 years, which can be used to monitor development at the population level and assess program effectiveness.
One of the hallmarks of the physical sciences is the definition of the International System of Units (SI units), which enables multiple instruments and principles to measure the same quantity. The availability of the D-score as a standard unit to measure early child development addresses barriers that have contributed to the neglect of child development in low- and middle-income countries, reducing the field’s fragmentation and enhancing the ability to generate appropriate policy, programmatic, and individual priorities (Shawar & Shiffman, 2017).
Research Design
The research was conducted in two successive sub-studies: Study 1 and Study 2. Study 1 extended the existing D-score model (Weber et al., 2019) to include caregiver-reported data, aiming to construct a common scale that combines direct assessment and caregiver-reported instruments. Based on the results from Study 1, the GSED team developed two new instruments using caregiver-reported and direct assessment items (McCray et al., 2023). Study 2 involved recalibrating the model from Study 1 using newly collected data. This article presents the data, methods, and results for Study 1, followed by those for Study 2.
Study 1
Study 1: Data
Study 1 analyzed existing cross-sectional and longitudinal data summarizing children’s early developmental performance using multiple instruments from three consortia: Infant and Young Child Development (IYCD; Lancaster et al., 2018), Caregiver Reported Early Development Instruments (CREDI; McCoy, Waldman, et al., 2018) and Global Child Development Group (GCDG; Weber et al., 2019). The data included 51 sources (studies) from 31 countries with child-level responses on 2,221 developmental items from 18 instruments (see Table 1). The average number of items administered per visit was 43.1. There were 4,314,146 responses in total. Study 1 used “visit” as the analytic unit.
Overview of Instruments Used in the Study.
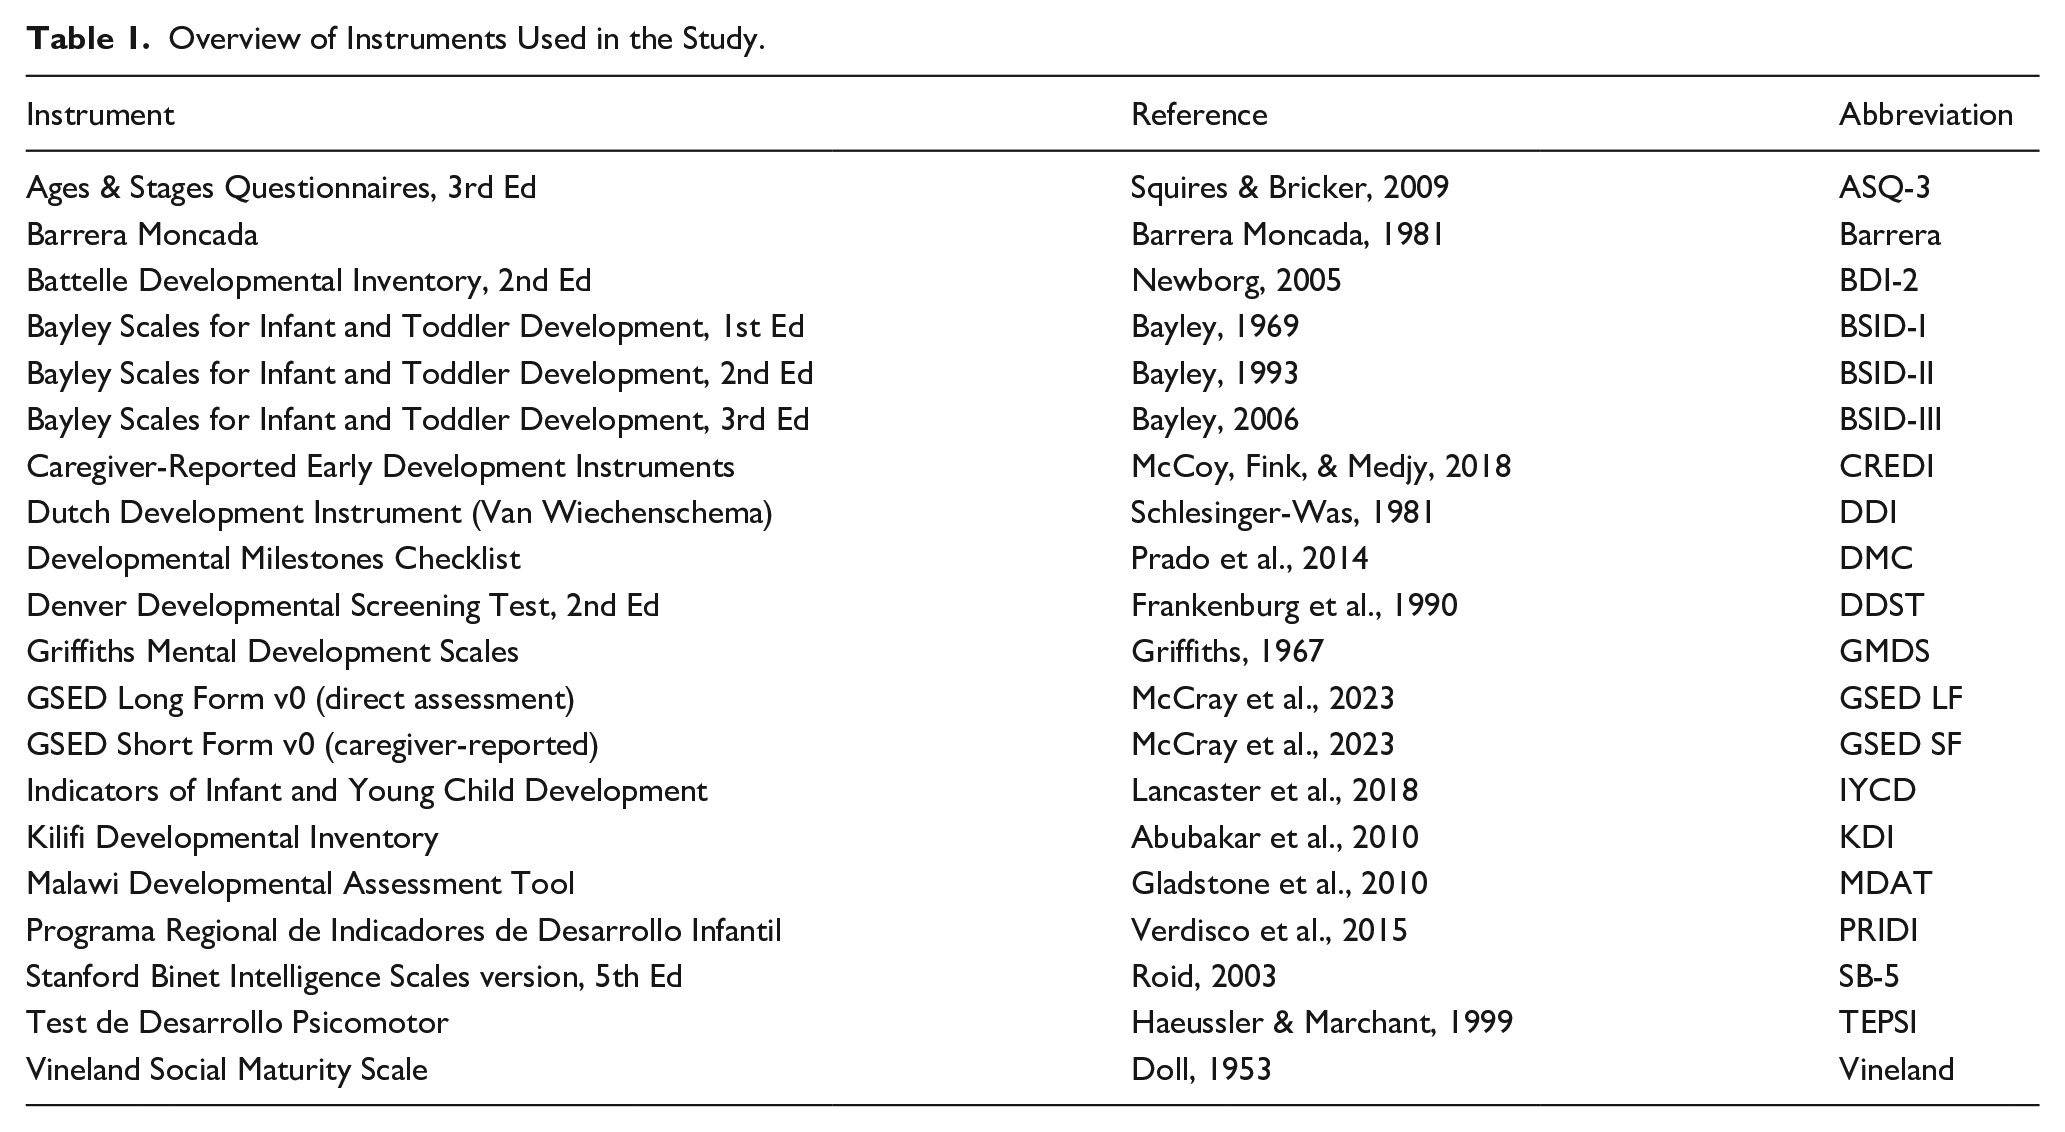
Most instruments collected dichotomous PASS/FAIL scores per item. Some used an additional category (e.g., “NOT YET,” “SOMETIMES”), including the Bayley Scales of Infant and Toddler Development III (BSID-III; Bayley, 2006), the Dutch Development Instrument (DDI; Laurent de Angulo, 2008), the Battelle Developmental Inventory (BDI; Newborg, 2005), and the Regional Project of Indicators of Child Development (PRIDI; Verdisco et al., 2015). We recoded such responses into binary 0/1 scores by replacing the FAIL or NOT YET categories with 0 and other observed responses with 1.
For Study 1, as it is a secondary data analysis of de-identified data, no IRB approval was required in accordance with TNO guidelines. Therefore, IRB approval was not sought for this study.
Study 1: Methods
Item Linking
Each child development instrument produces an observed raw score, the sum of milestones passed. Ideally, we could compare these raw scores directly. However, the instruments differ in the number of items administered, the age range of participants, and the content of the items, making direct comparisons of raw scores impractical. Instead, we applied true score equating, which leverages the overlap between instruments to place each measurement onto a common scale. This procedure differs greatly from using the raw scores directly (Price, 2017).
Figure 1 is a linkage table that marks the instruments used by each source. The data are similar to the common-item nonequivalent groups design described by Kolen and Brennan (2014). In this design, the same items are administered to different groups of children, which are nonequivalent due to differences in age, ability, or other characteristics. The items shared between the groups serve as a link.
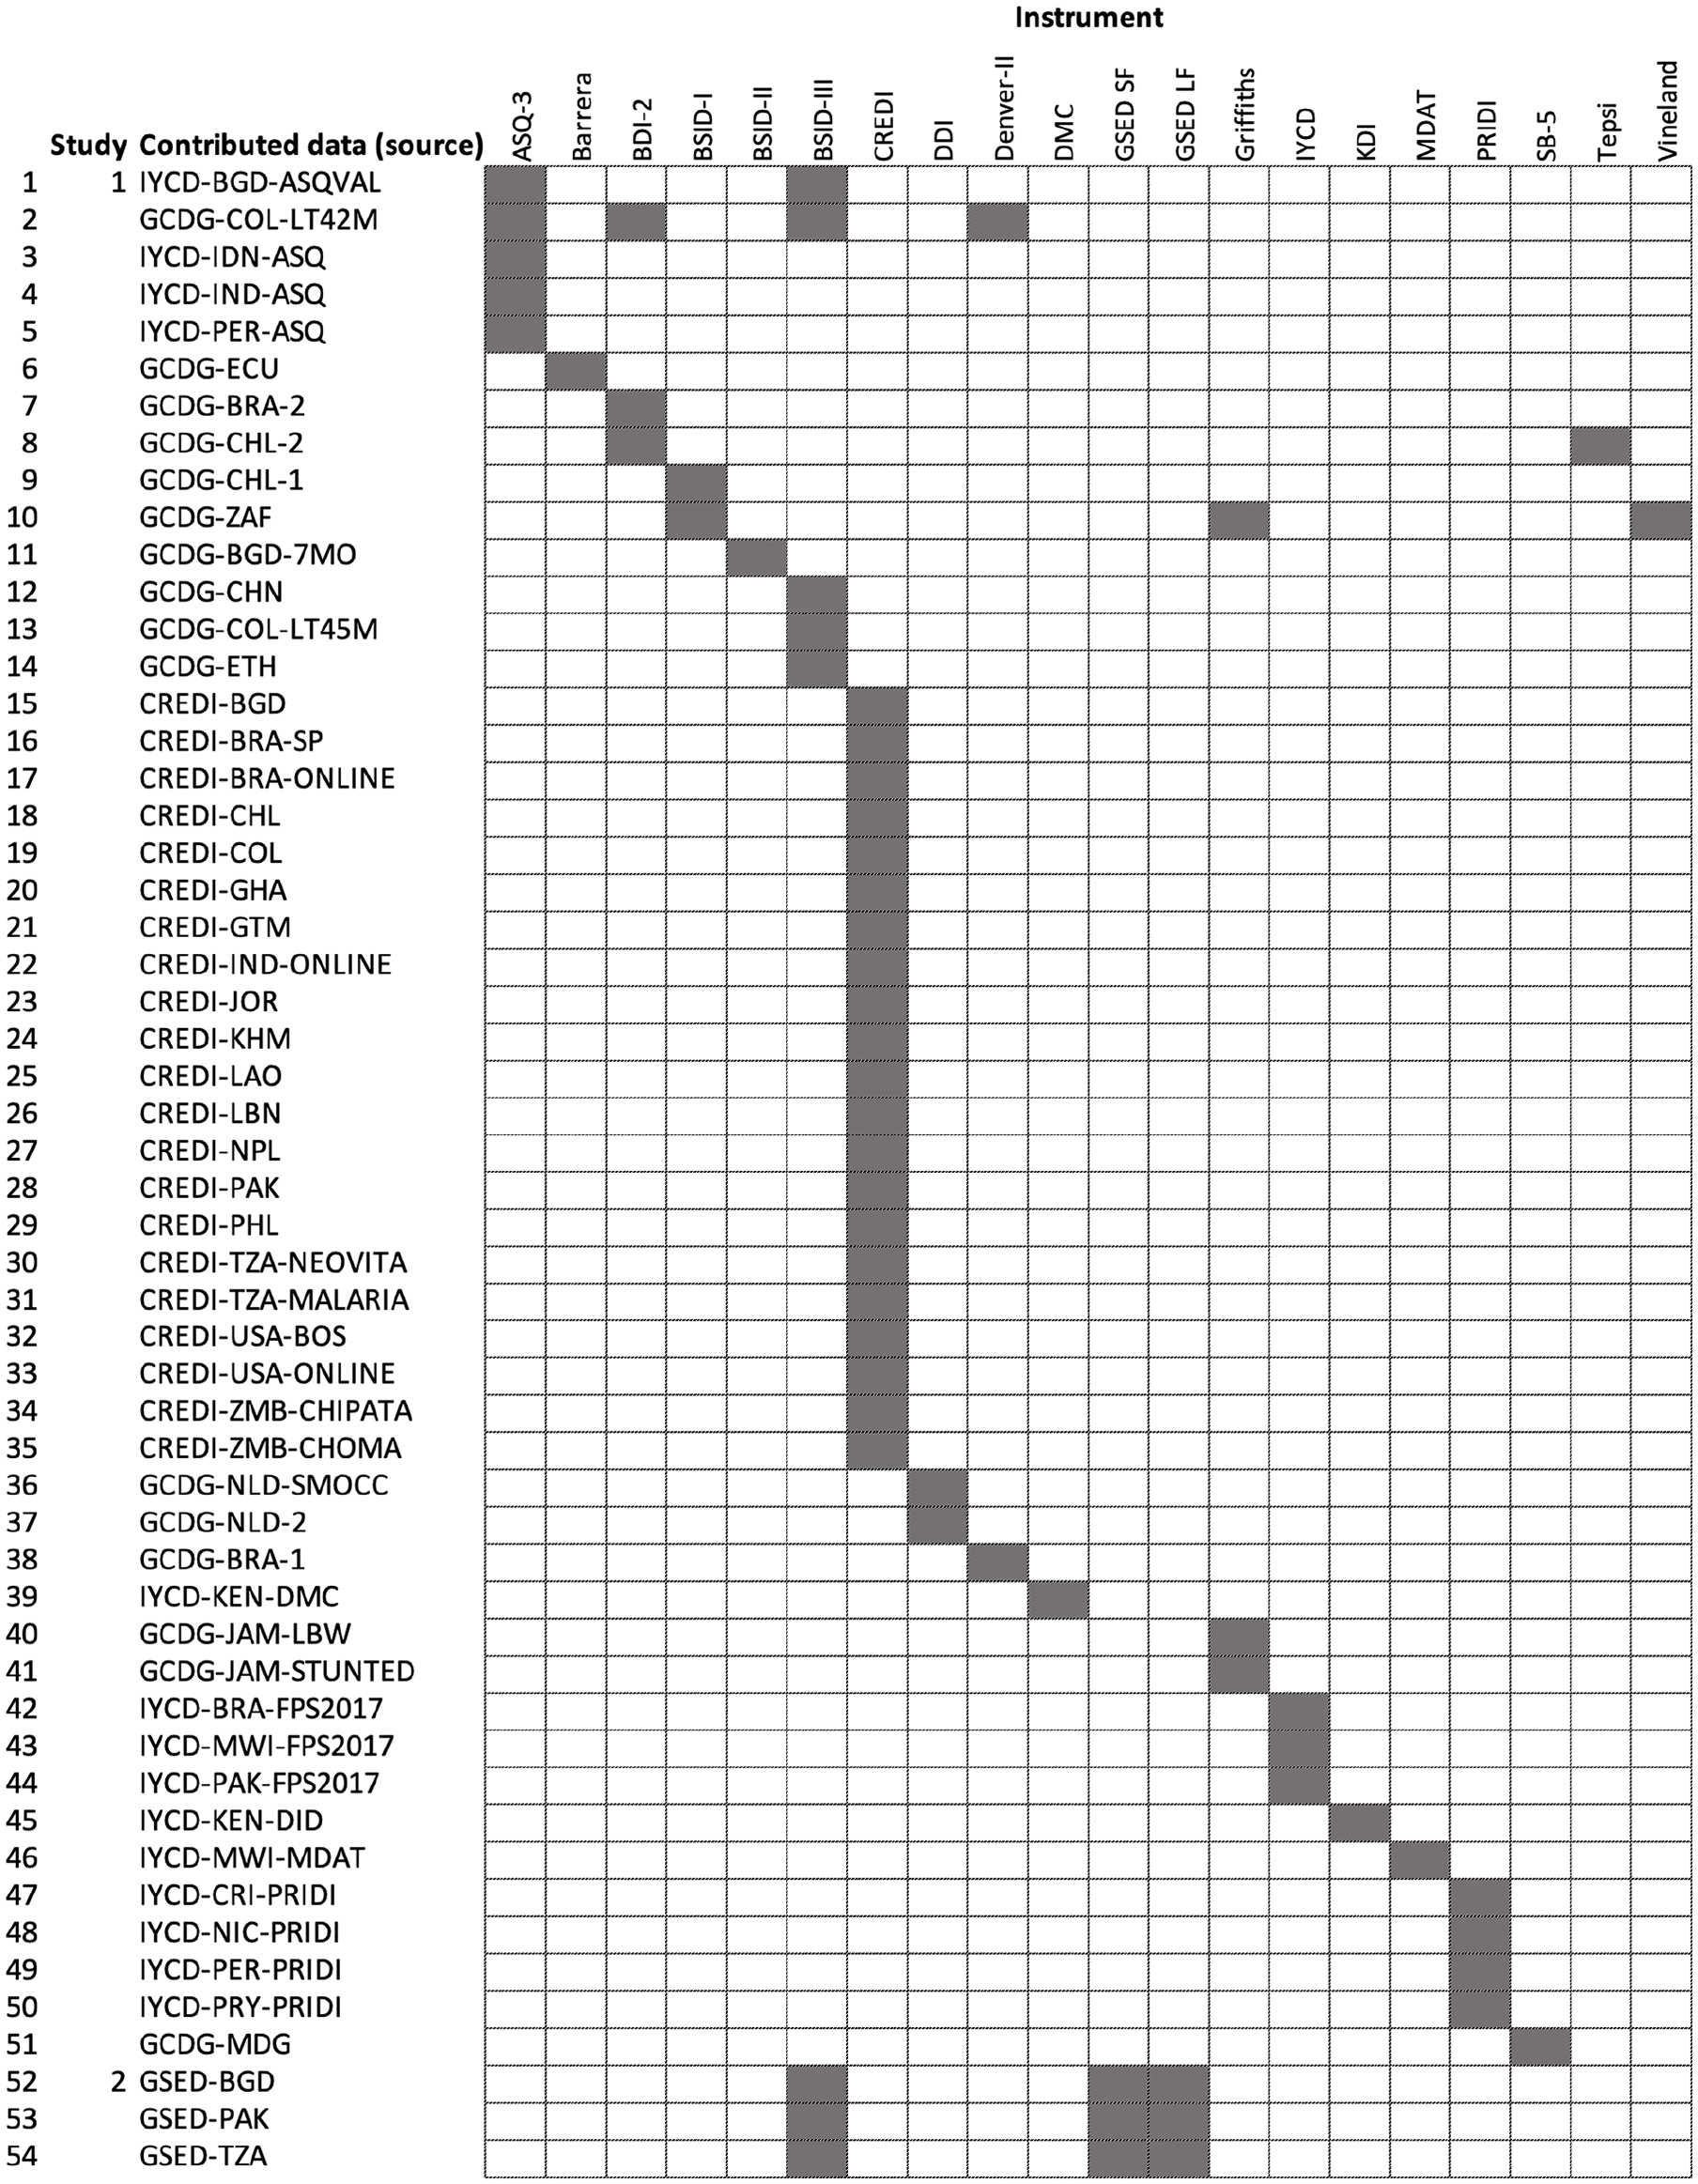
Linkage Diagram Showing How Instruments and Sources Are Connected. Two sources or instruments are connected if one can travel from one to the other by a series of rook moves using dark fields only.
Early child development instruments contain many similar items. For example, most instruments assess whether the child “can stand” or “can say two words.” However, the wording and context of these items can differ across instruments and settings. For example, the item “pulls to stand” may be phrased in various ways: “raises self to standing position” (from BSID-III, see Table 1 for acronyms), “pulls up to standing position” (DDI), “pulls to stand” (DDST), “pulls self while holding on to object into a standing position” (DMC), and “pulls self to stand/trying to get to standing” (MDAT). Thus, even when items assess the same skill, it is unclear whether they are equivalent. This problem of comparing the incomparable (Wainer, 1999) is inherent to existing data, yet it is seldom explicitly addressed.
We can frame the problem operationally as, “How do we determine whether similar items can be placed into the same column of the data?” The answer involves making assumptions and, where possible, testing them. To address the issue, we implemented the following procedure. First, we engaged subject matter experts in child development to classify similar items from different instruments into equate clusters, which are sets of items that measure the same skill (McCray et al., 2023). We then identified and evaluated a subset of these equate clusters that exhibited similar measurement properties across instruments. Using this subset, we linked the instruments through a restricted Rasch model.
Restricted Rasch Model
Rasch (1960) studied a similar problem, as he aimed to monitor progress throughout a child’s entire school career using tests that varied by class, with easier tests for lower grades. His model linked tests administered in successive grades through shared items. The Rasch model is a probabilistic model that estimates both the ability of persons and the difficulty of items on the same scale. It is widely used in educational testing and health research (Wright & Masters, 1982) and is a cornerstone of modern test theory (Embretson & Reise, 2000).
Various authors have applied the Rasch model to developmental data. Jacobusse et al. (2006) found an excellent fit between the Rasch model and the success rate of developmental milestones from the Dutch Development Instrument (Laurent de Angulo, 2008). The result was confirmed using multiple instruments and multiple studies (Weber et al., 2019). Others used similar strategies to create measurement scales with the same instrument (Andrich & Styles, 2004; Boom et al., 2007; Cheung et al., 2008; Drachler et al., 2007; Durrant et al., 2020; Loizillon et al., 2017; van Buuren, 2014). The Rasch model is parsimonious, yields an interval scale, functions well with sparse data, and separates the ability from the difficulty parameters. The last property is essential for our purposes, as it ensures that the estimated difficulty parameters are independent of the calibration sample. This independence is crucial for deriving a conversion key that can be applied to any ability level.
The Rasch model has two types of parameters. Each item
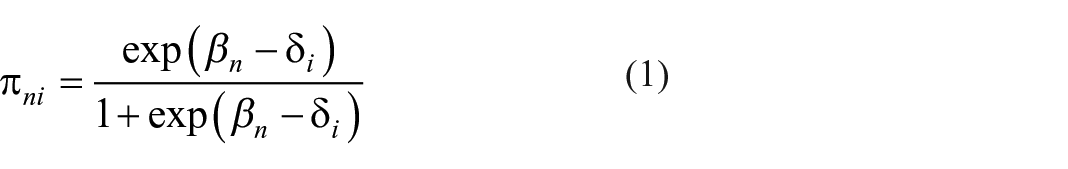
In other words, both the ability and difficulty parameters are expressed in logits. The difference
We created a restricted version of the Rasch model (1) that bridges instruments by applying equality constraints. Suppose that

Thus enforcing restriction (2) for a cluster effectively creates a virtual item
For a given set of item difficulties, we calculate the D-score and its standard error of measurement (SEM) by the Expected A Posteriori (EAP) method (Bock & Mislevy, 1982) using an age-dependent prior. The D-score is the expected value of the ability parameter
The mean of the item difficulties is set to zero, and the scale is defined in logits. To make the definition of the scale unit more interpretable and independent of the calibration sample, one may choose two anchor items, set their difficulties to some value and linearly transform the logit scale into the defined scale. The starting model used “Lifts head 45 degrees” to
The conversion key contains everything needed to calculate a D-score from the user’s data. It consists of (1) a table of item difficulty estimates from the Rasch model (the item bank), (2) a specification of the prior distribution of the D-score given age, (3) the quadrature points in the EAP method, and (4) the intercept and slope of the linear transformation from logit to D-score. D-scores calculated under the same conversion key are comparable. The software for calculating the D-score contains a few built-in keys, corresponding to different D-score models that have been developed over the years. Each key is identified by a name. To calculate the D-score, the user is expected to convert the item names in their data into a standard format and to supply the relevant key name.
Criteria to Evaluate Model Fit
Fitting the restricted Rasch model to data requires two modeling decisions:
Determine the subset of items to be included in the model.
Determine the subset of equate clusters for which the restriction (2) is applied.
Since equate clusters contain items, the two modeling tasks are interdependent, so we need to address them simultaneously.
Selecting items is a standard task in Rasch modeling using infit and outfit statistics (Wright & Masters, 1982). The outfit statistic is the
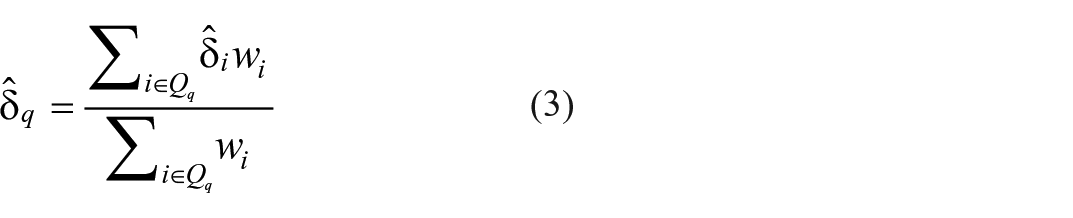
Selecting equate clusters is a nonstandard task. Some equate clusters are more homogeneous regarding their locations and shapes of the ICCs. We will label equate clusters under restriction (2) as active. Only active equate clusters have a virtual item that anchors instruments. If item difficulties or slopes within an equate cluster are heterogeneous, the estimates are left free. The equate cluster is then called inactive and there is no virtual item that connects instruments. We do not know a priori if an equate cluster should be active or inactive. To aid in deciding between active and inactive, we plotted the ICCs of the items in the equate cluster. Active equate clusters should have ICCs close together. We used equate infit and equate outfit as a measure of the homogeneity of the equate cluster. Equate infit and outfit are calculated as the sum of squared residuals relative to the virtual item divided by the number of item scores in the equate cluster (Eekhout et al., 2024).
Various strategies exist to increase equate cluster homogeneity: break up equate clusters (e.g., the analysis finds a subgroup of homogeneous items), remove poorly fitting items, split equate clusters, or remove instruments and sources from the analysis. If these actions are ineffective, the cluster is too heterogeneous to bridge instruments and should remain inactive.
Modeling Steps
We combined the GCDG data (Weber et al., 2019) with the CREDI (McCoy, Waldman, et al., 2018) and IYCD (Lancaster et al., 2018) data, and fitted a series of Rasch models on selected items and equate clusters. The analyses included only items with a minimum of 10 responses in both PASS and FAIL categories to circumvent computational problems. We removed 2,163 records (2.2%) with inconsistent patterns identified by person infit > 3 or person outfit > 3. We used an upper bound item infit
Modeling was performed in three steps. Step 1 added 239 caregiver-reported items from the CREDI and IYCD instruments to the starting model and tested which fitted the Rasch model. We re-estimated the difficulty parameters for all items (free model) and compared the solution with the alternative model that estimated only the parameters of the 239 new items (fixed model). Step 2 re-entered and tested 102 caregiver-reported items that were discarded during Step 1 but that fitted a separate 2-parameter IRT model. This step relaxed the entry criteria for caregiver-reported items as infit
Study 1: Results
Table 2 shows the number of visits by source, age, and study. The combined data contain a total of 100,153 visits made by 66,075 unique children.
The Number of Visits (Administrations) and Instruments Used by Source and Age Were Assembled From Existing Data (Study 1).
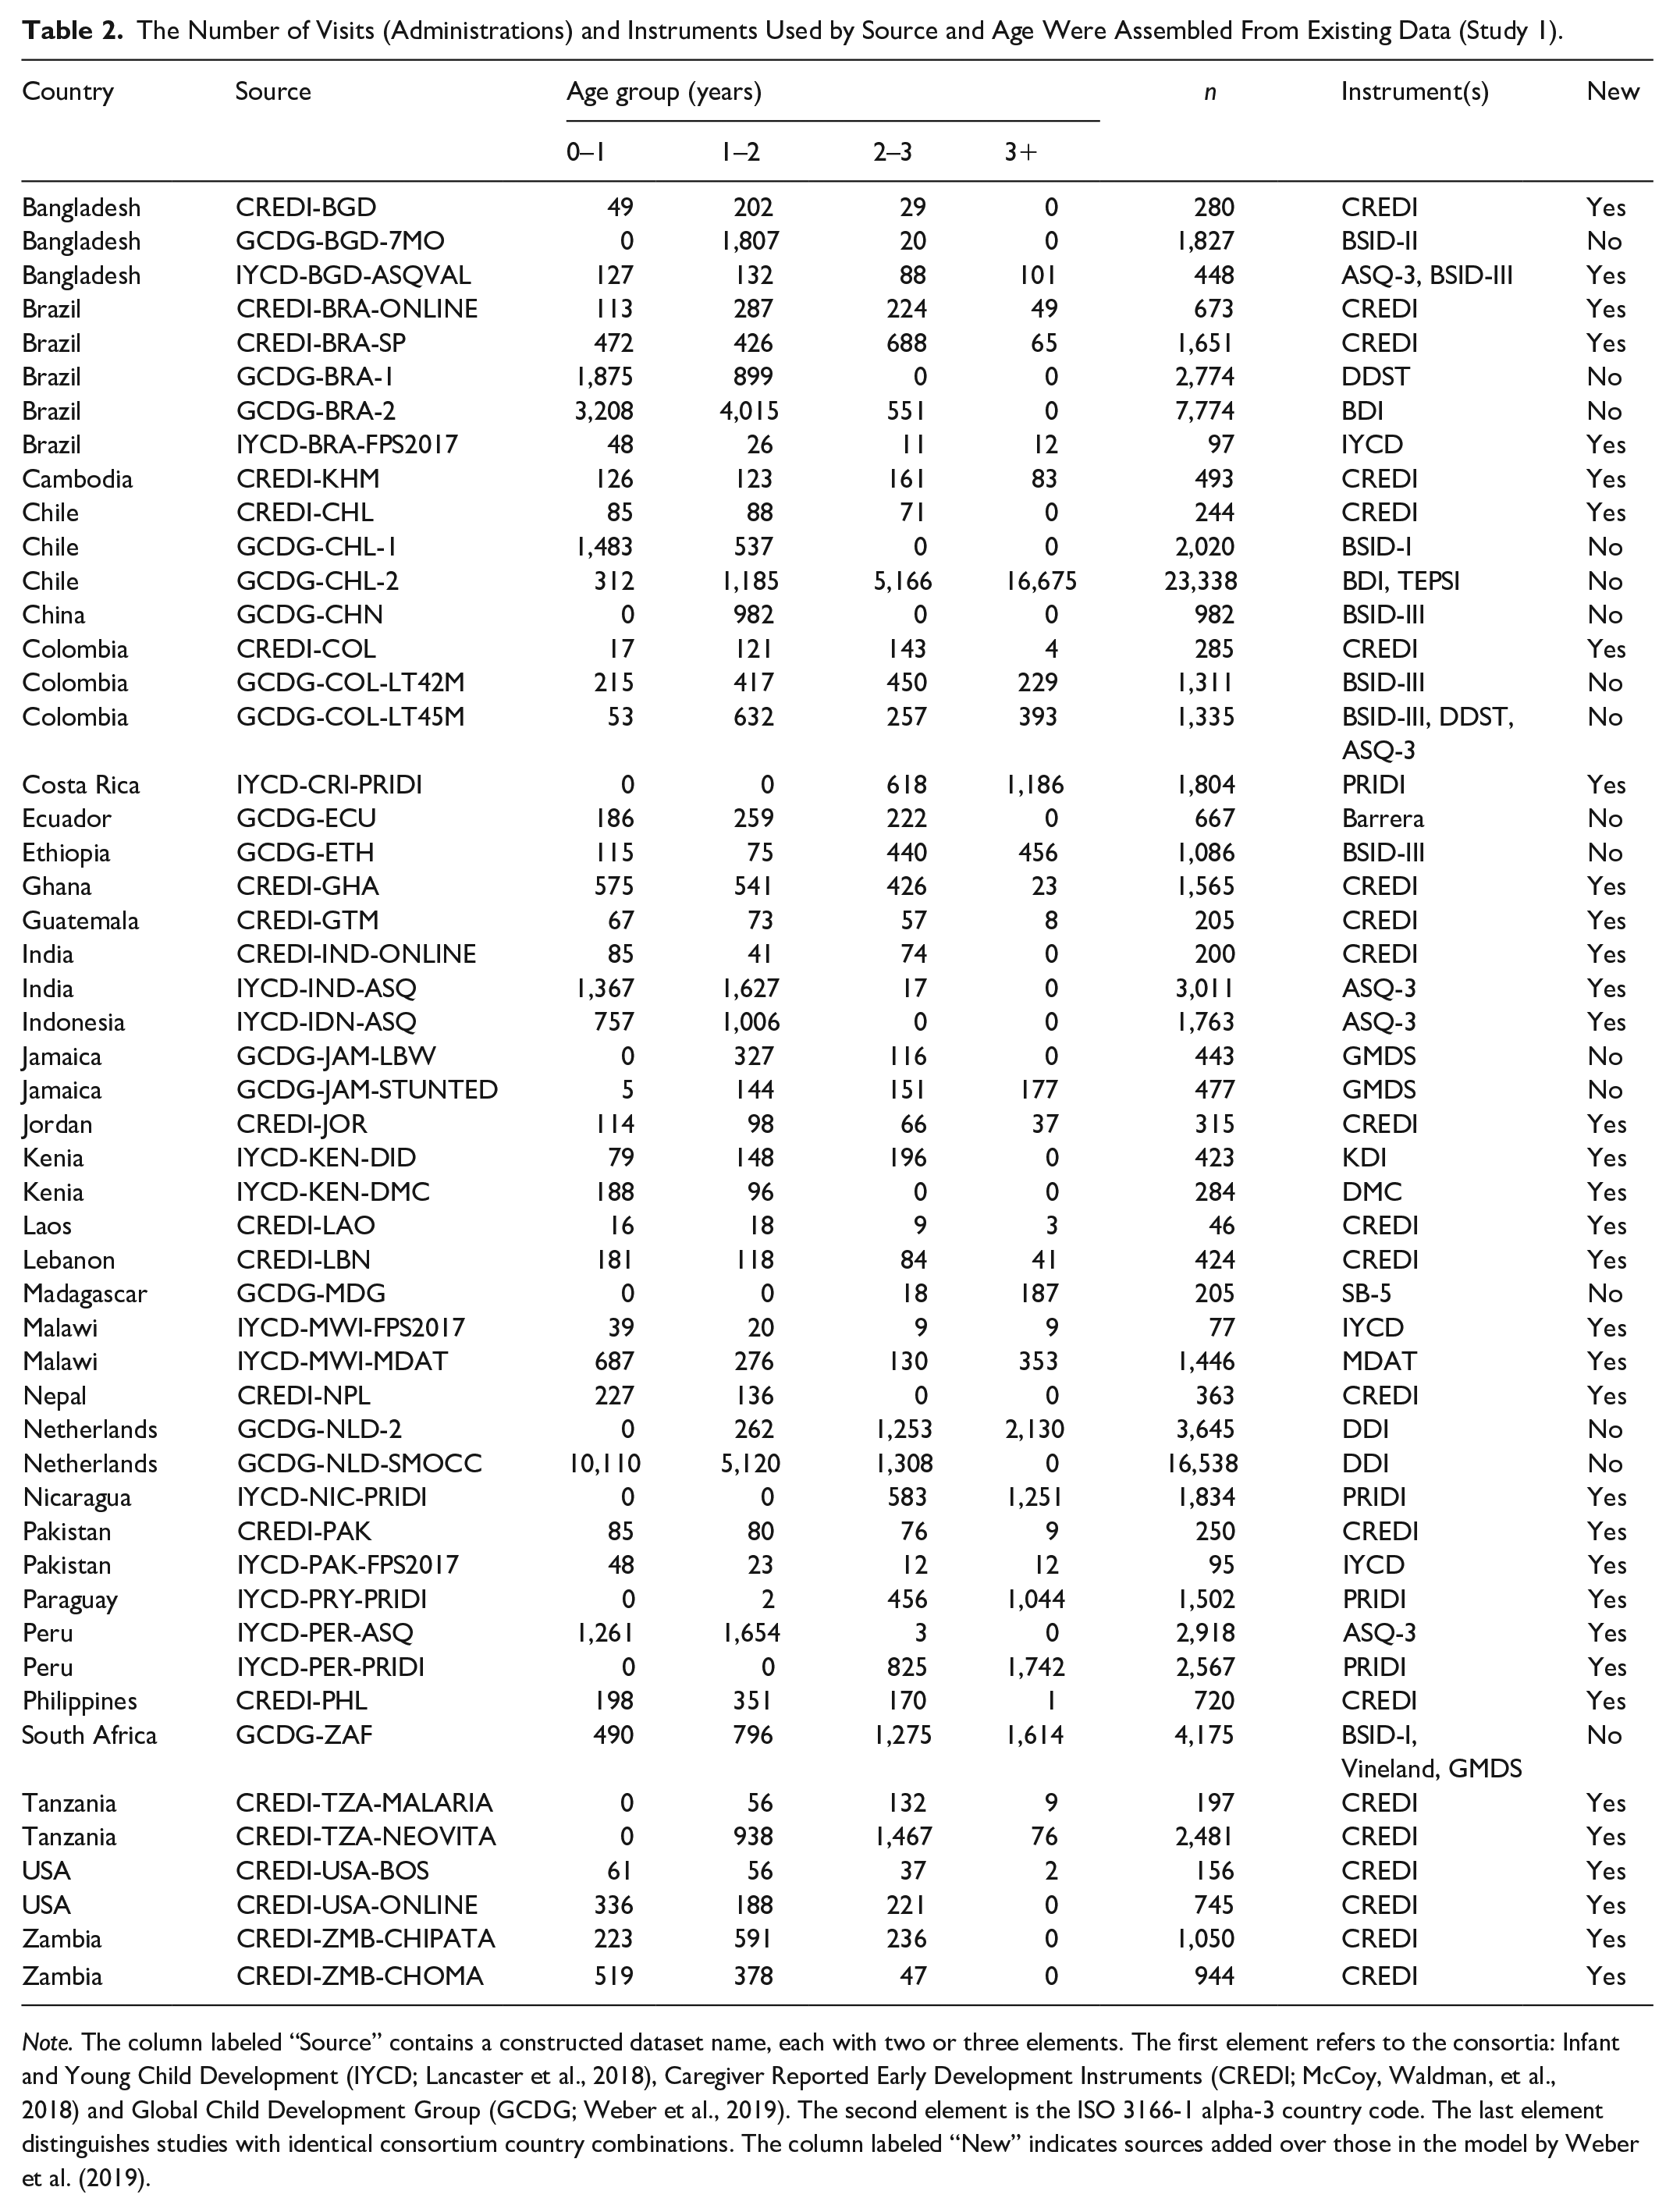
Note. The column labeled “Source” contains a constructed dataset name, each with two or three elements. The first element refers to the consortia: Infant and Young Child Development (IYCD; Lancaster et al., 2018), Caregiver Reported Early Development Instruments (CREDI; McCoy, Waldman, et al., 2018) and Global Child Development Group (GCDG; Weber et al., 2019). The second element is the ISO 3166-1 alpha-3 country code. The last element distinguishes studies with identical consortium country combinations. The column labeled “New” indicates sources added over those in the model by Weber et al. (2019).
Based on the starting model with 565 items and 18 virtual items, we implemented Steps 1–3 by fitting sequential 45 Rasch models. The workflow for a subset of 15 of these models is documented as a Shiny application at https://tnochildhealthstatistics.shinyapps.io/dmodel/, which allows the user to explore the results of the Rasch models, including the item and person fit statistics, the ICCs, and the equate cluster fit statistics. The final model contained 807 items and 17 virtual items, including 62 (out of 149) CREDI items and 55 (out of 90) IYCD items. The accompanying key is called gsed1912, an abbreviation of the project gsed, the year 2019, and month 12. This key was used to inform the construction of the GSED SF and GSED LF measures (McCray et al., 2023).
The extension of the starting model with caregiver-reported items from the CREDI and IYCD worked well for ages > 6 months. However, as we will show later, using the key gsed1912 to estimate the D-score led to substantial differences between caregiver-reported and direct assessment items for ages < 6 months.
Study 2
Study 2: Data
Following the GSED research protocol (Cavallera et al., 2023), Study 2 collected new data for children aged 0–41 months on the newly constructed GSED LF (direct assessment, 155 items) and GSED SF (caregiver-reported, 139 items) in Bangladesh, Pakistan, and Tanzania. These countries are part of a diverse group of seven nations, representing low-, middle-, and high-income settings, which will validate the GSED LF and SF. Children younger than 6 months were oversampled to capture their rapid developmental pace. The SF was conducted at home during a separate visit occurring before the LF administration, with 96% of the LF assessments occurring within 2 days, and 98.7% within 7 days of the SF.
In addition, the direct assessment Bayley Scales for Infant and Toddler Development (BSID-III; Bayley, 2006) were collected for a random sample of children. The LF and BSID-III were administered at the same location on different days in a randomized sequence. This article uses the BSID-III data to further strengthen item linkage between the new LF and SF instruments and the items collected in Study 1.
The GSED study received ethical approval from the WHO (protocol GSED validation 004583, approved on 20 April 2020), as well as site-specific IRB approvals. As the work involved de-identified and pre-existing data, no further IRB approval was required for this analysis.
Study 2: Methods
Person Linking
We organized each child’s individual item responses from the first SF, LF, and BSID-III assessments into a single row, creating a wide matrix. This matrix comprised 4,374 rows (one for each child) and 620 columns (representing 139 SF items, 155 LF items, and 326 BSID-III items). All children were measured on the SF, 4,318 on LF and SF, and 478 with all three instruments. The missing observations for LF were due to dropout, mostly because the caregiver could not attend the LF visit or the child felt ill. On average, a child was scored on 44.9 items for SF, 40.2 items for LF, and 76.9 items for BSID-III. All item responses were recorded as binary PASS/FAIL scores. In the terminology of Kolen and Brennan (2014), these data form a single group design for three instruments, with counterbalancing of LF and BSID-III.
We fitted Rasch models to the combined wide matrix for the SF and LF items. Assuming that a child’s ability remains stable over a 2-day period, the estimated item difficulties for the SF and LF are on the same scale. One SF item (“clenched fists”) was removed due to poor fit. The resulting model, which includes 138 SF items and 155 LF items for a total of 293 items, is referred to as the core model.
Extending the Core Model by Item Linking
During instrument construction, each item in the SF and LF was matched to an existing item from key gsed1912 (McCray et al., 2023). The matching process resulted in 287 common items between the new instruments (SF and LF) and the existing instruments in gsed1912. We used these links to extend the core model by (1) including the Study 2 BSID-III items that were part of key gsed1912, (2) adding the Study 1 data for all items present in the gsed1912 key, (3) identifying and testing equate clusters for item linking, and (4) restricting the difficulty estimates of the 293 GSED items to their value in the core model. The final model contains 818 items and six virtual items. Relative to key gsed1912, the model adds 11 new items and reduces the number of virtual items from 17 to 6. We could remove 11 virtual items due to the intentional overlap created by the Study 2 data. Since many GSED items were either directly copied or subtly adapted from other instruments, aligning the GSED items with the corresponding entries in the data automatically established connections between these instruments. This approach significantly reduced the necessity for additional model constraints. We set two anchor items “Lifts head 45 degrees” to
Unidimensionality
A central assumption of the Rasch model is that all items measure the same latent trait. To evaluate unidimensionality, we fitted separate Rasch models for the three LF item groups, corresponding to gross motor (49 items), language (52 items), and fine motor behavior (54 items), and compared the estimated difficulties with those from key gsed2406. For a truly unidimensional scale, we expect the two sets of difficulties to be linearly related.
One potential concern is that items from one developmental domain may fit the D-score model better than others, leading to an imbalance in the representation of developmental domains. McCray et al. (2023) collected domain votes from experts for 770 items. Domain imbalance would manifest when some domains fit the model significantly better than others. We calculated domain fit measures as the mean item infit and outfit per domain.
Preliminary Standards
We created a subset of children who had not experienced prior exposure to major known biological and environmental risk factors as defined in Cavallera et al. (2023), containing 2,295 children. We calculated two D-scores per child (separate for SF and LF), and constructed age-conditional preliminary standards following the recommendations Borghi et al. (2006). Age was transformed as
Study 2: Results
Data
Table 3 shows the number of children by country, age group, and instrument. The combined data contain a total of 4,374 children.
Number of Children and Instruments Used by Source and Age Assembled for Study 2.
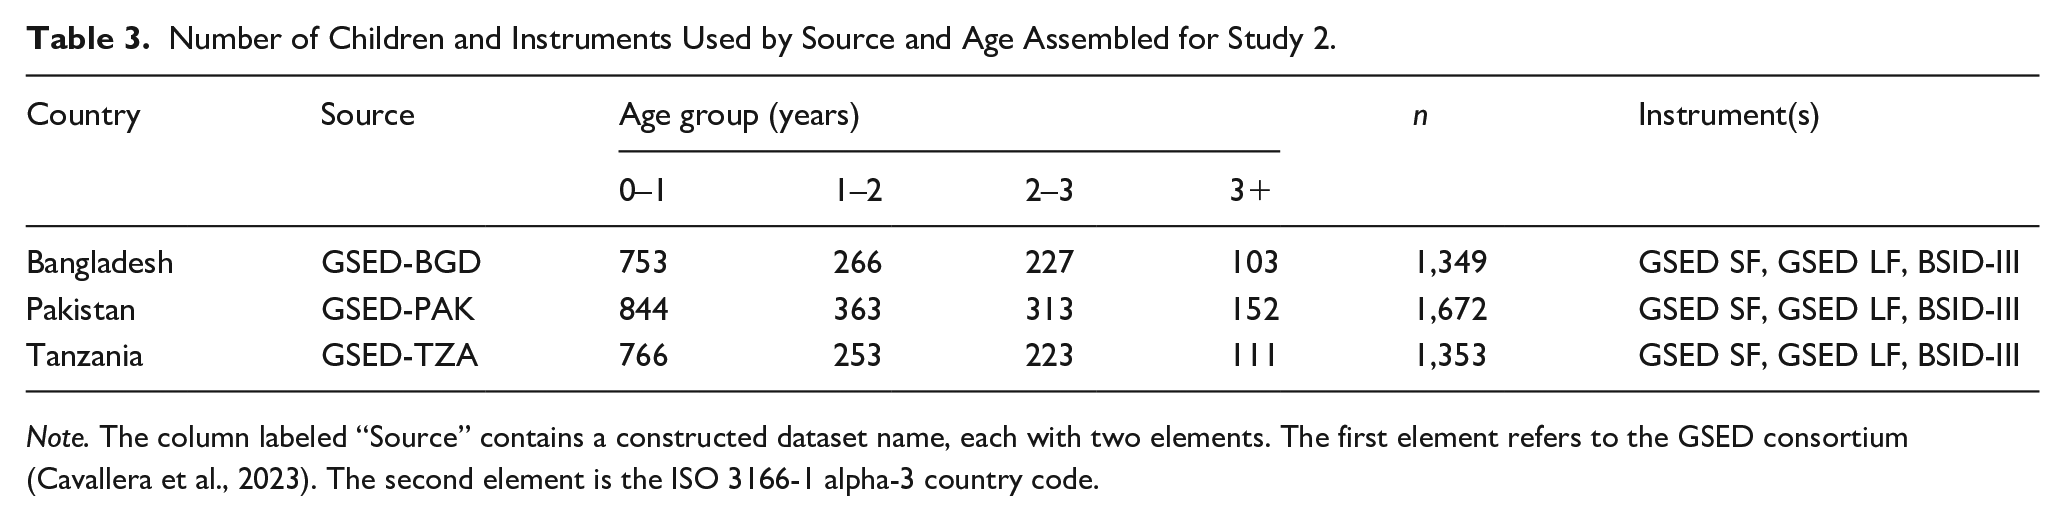
Note. The column labeled “Source” contains a constructed dataset name, each with two elements. The first element refers to the GSED consortium (Cavallera et al., 2023). The second element is the ISO 3166-1 alpha-3 country code.
Agreement Between SF and LF
Figure 2 contains two scatter plots of the D-score calculated from the LF and SF measured in the same children from Study 2. The left-hand plot uses the gsed1912 key, created by the Study 1 model, to calculate the D-score. For the LF, the gsed1912 key measures the D-score reasonably well across the spectrum. However, the SF values are slightly higher than the LF values, and the range covered by the SF is severely compressed at the lower end of the scale. This difference between SF and LF is unlikely to be genuine since both align reasonably well at higher values. Our explanation for this discrepancy is that the gsed1912 key contains no virtual items below the D-score value of 30, meaning that caregiver-reported and direct assessment data were essentially unconnected below 6 months. See the supplementary material for details on the virtual items.
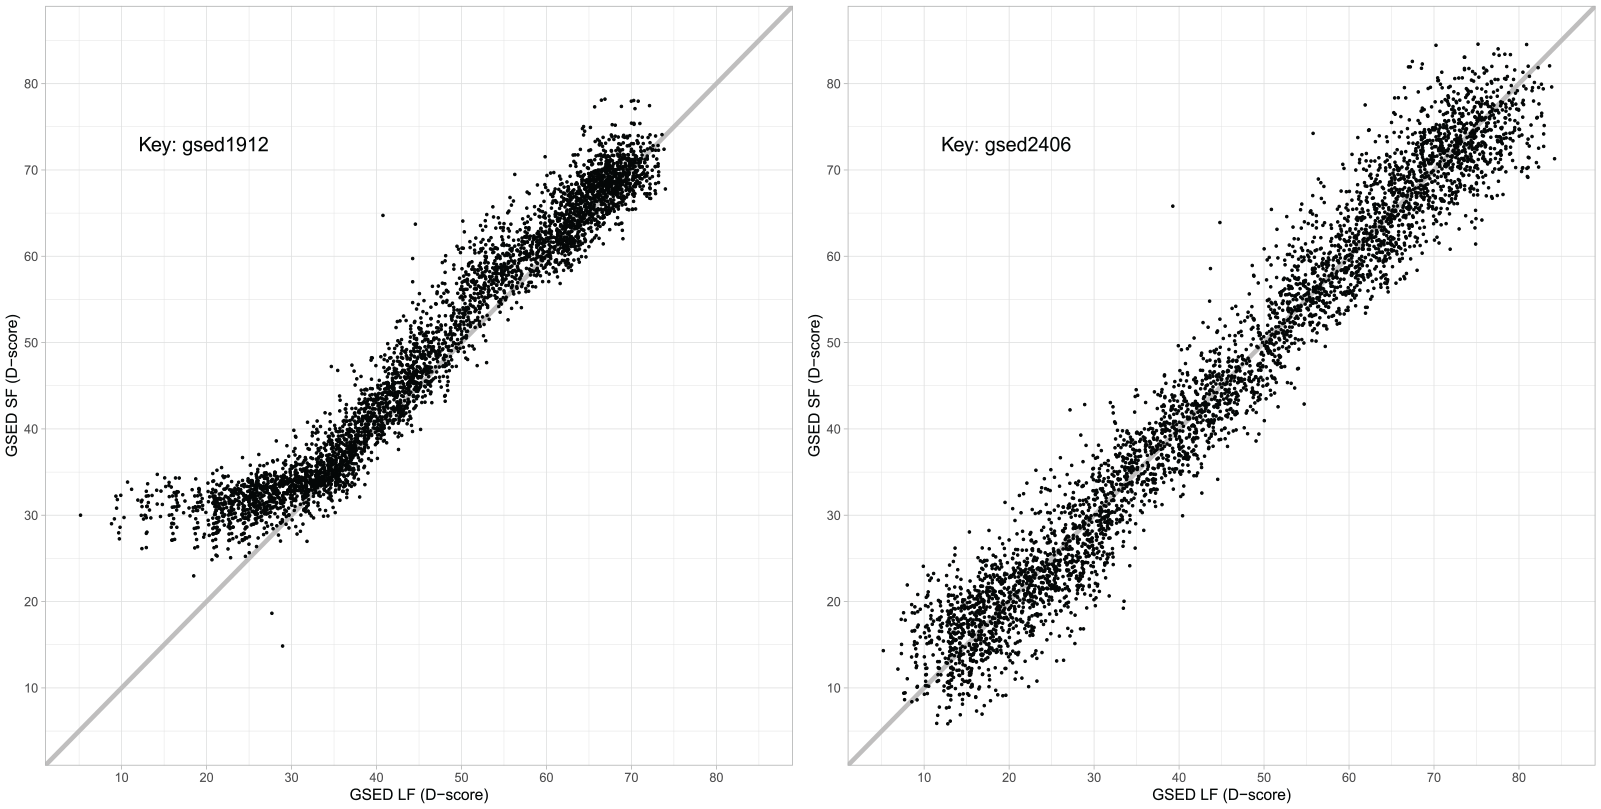
Relation Between the D-Scores From the GSED Long Form (GSED LF) and GSED Short Form (GSED SF) for 4,374 Children Aged 0–41 Months From Bangladesh, Pakistan and Tanzania. The measurements are identical in the left- and right-hand plots, but the keys differ. The key on the left is gsed1912, while the key on the right is gsed2406.
The right-hand plot in Figure 2 shows the same children, but with the key gsed1912 (from Study 1) replaced by key gsed2406 (from Study 2). The D-score estimates from LF and SF are now almost perfectly aligned along the diagonal, illustrating that both instruments measure the same latent trait. Ideally, all points should be on the diagonal. The spread reflects the measurement error of the LF and SF. Overall, key gsed2406 corrects the deficits of key gsed1912.
Model Diagnostics
Figure 3 plots the infit and outfit for key gsed2406 by item, by virtual item, and by person. Many fit statistics are below 1, indicating excellent empirical fit. The mean item outfit and infit are 0.684 and 0.842, respectively. The infit and outfit statistics for the six virtual items are satisfactory. Most person fit statistics are below 1.5, with mean person outfit of 0.772 and mean person infit of 0.872, indicating good person fit.
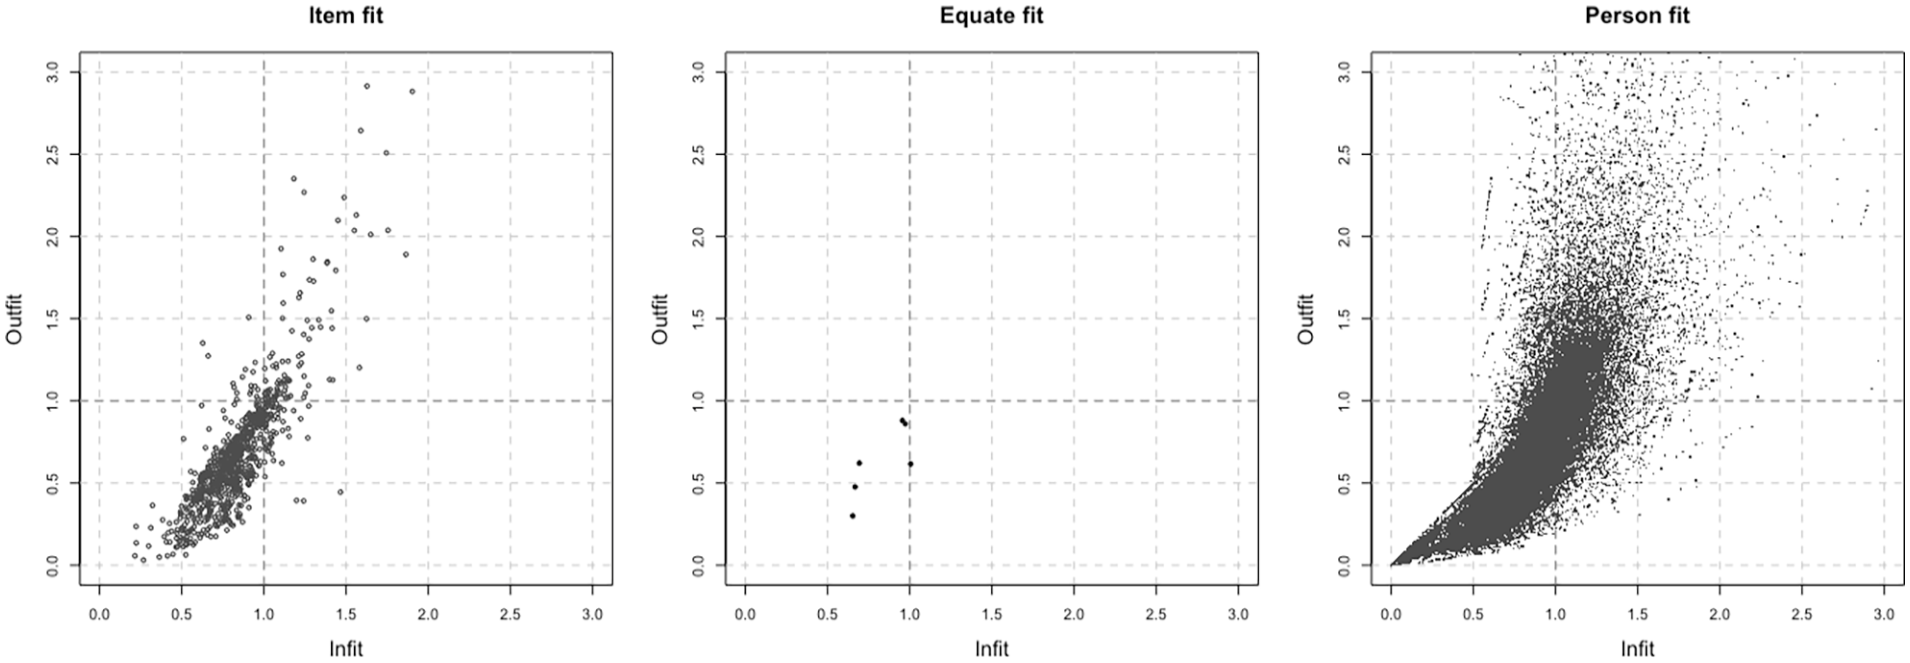
Infit and Outfit For Items, Active Equate Clusters and Persons for Key gsed2404.
Equate Cluster Homogeneity
Figure 4 illustrates the type of graph used to evaluate the quality of equate clusters. This graph studies the validity of bridging the CREDI, BSID-II, GMDS, and SF instruments by a virtual “two-word sentences” item. The graph shows the empirical probability of passing items against the D-score in 26 sources. These curves spread around the value of 60 (at 50% pass) and are roughly parallel. The dotted gray curve visualizes the virtual item for the cluster, created by restricting the difficulties of the cluster items to be identical as in equation (2). The equate infit and outfit values of 0.66 and 0.53 indicate that the empirical ICC’s show higher discrimination than the virtual item. The figure displays the typical pattern found for virtual items.
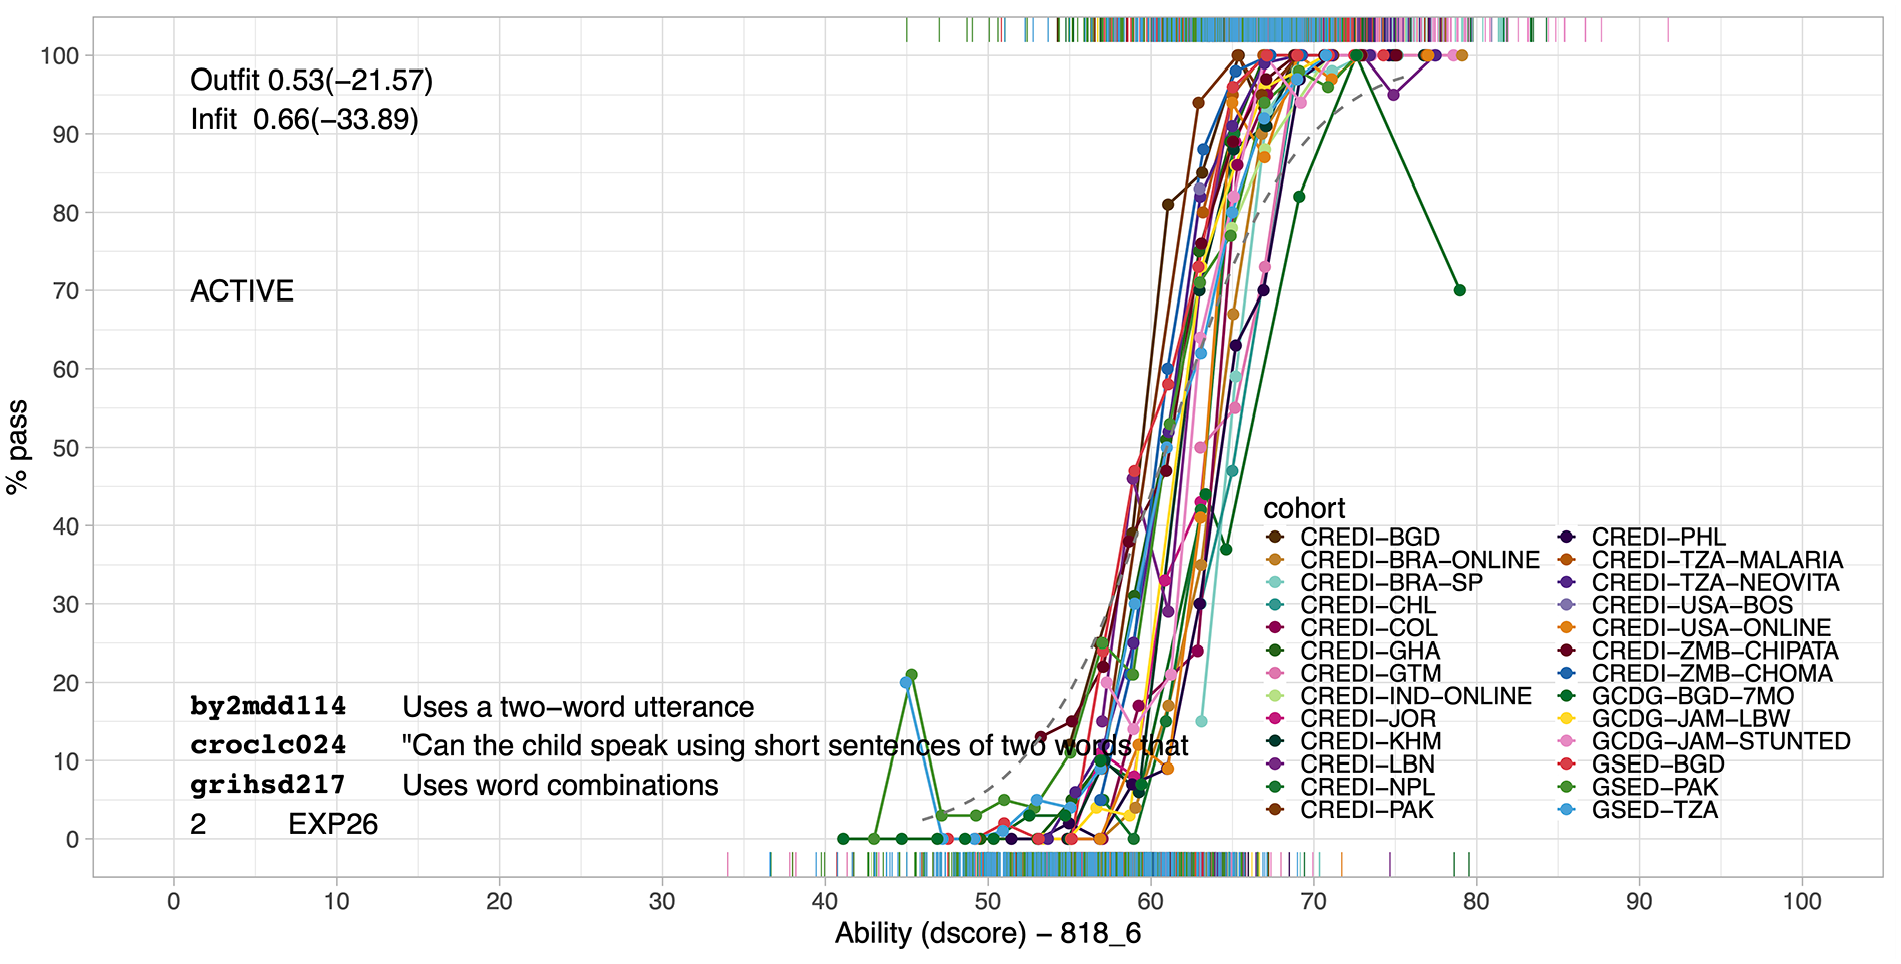
Example of Diagnostic Plot for Evaluating Equate Fit. The solid (in the online version: colored) curves show the empirical probability to create sentences of two words as a function of the D-score from CREDI, BSID-II, and GMDS for sources using these instruments. The dotted gray curve is the virtual item.
Unidimensionality
Figure 5 plots the estimated item difficulty per subscale against those from key gsed2406. Although certainly not perfect, we interpret these results as overwhelmingly in favor of the unidimensional model, with correlations of 0.981, 0.987, and 0.999 for gross motor, language, and fine motor behavior, respectively.
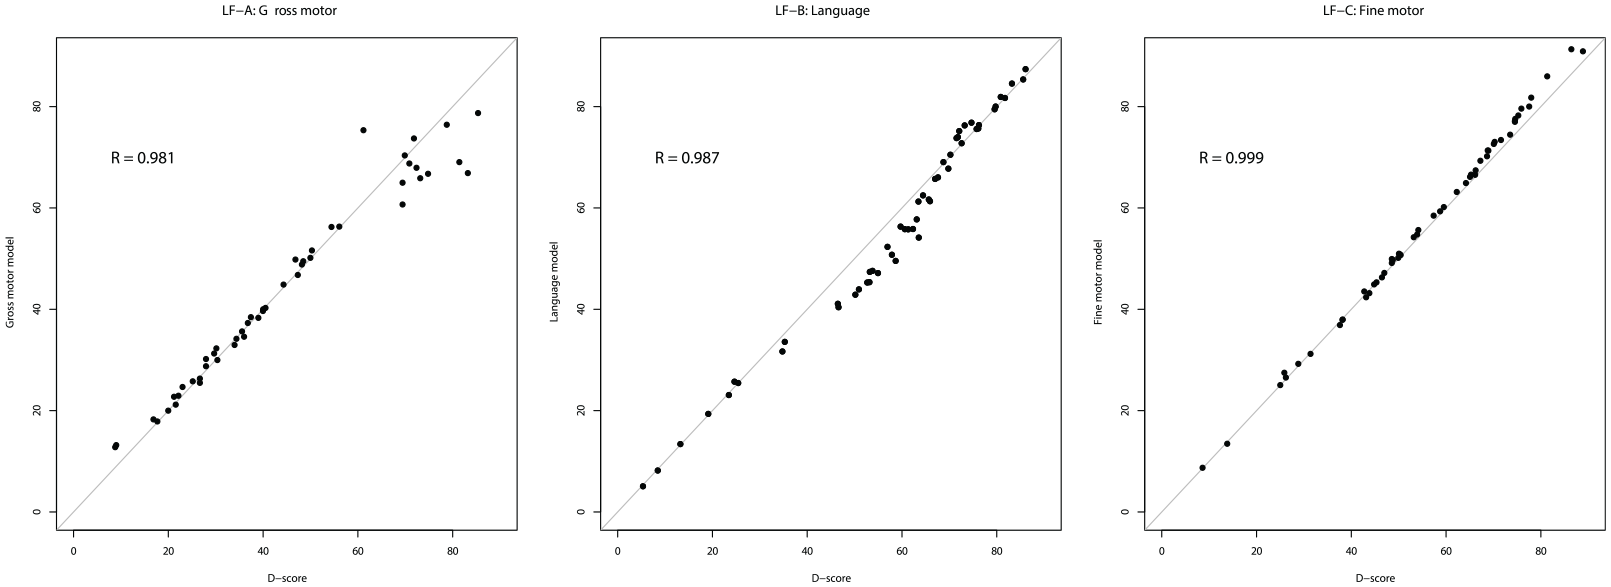
Item Difficulty Estimates From Separate Rasch Models Fitted to Each LF per Item Group (Vertical Axis) Compared With the Estimates From the Combined Key gsed2406.
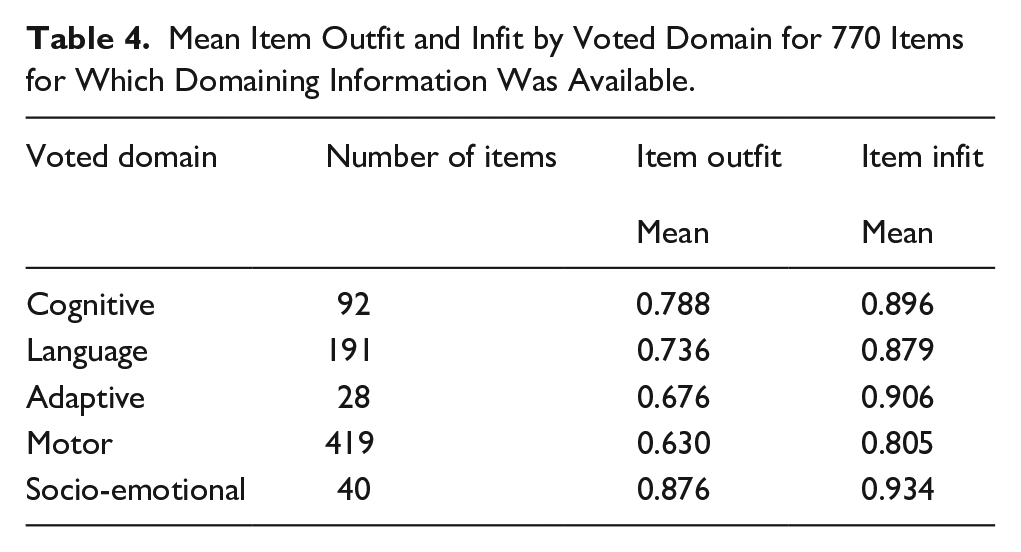
Table 4 shows the number of items, mean item outfit, and infit by domains derived by subject matter experts. The number of motor items is high because this category contains fine and gross motor behavior. Smaller values for infit and outfit indicate more discriminatory items. Most values fall in the range of 0.6–0.9 and suggest a good fit. Motor items fit best, but items from other domains are close. The results indicate that the D-score model represents all domains.
Mean Item Outfit and Infit by Voted Domain for 770 Items for Which Domaining Information Was Available.
Precision
The precision of the D-score estimate depends on the number of items administered and the difference between the child’s ability and the difficulty of the items. Figure 6 was calculated for observations from both Study 1 and Study 2. As expected, the most significant gains in precision come from administering the first 10–20 items. Improvement beyond 50 items is minimal. The standard deviation of the D-score by age is approximately 3.5. Using Cohen’s rule of thumb for large (0.8), medium (0.5), and small (0.2) effect sizes, we have drawn interpretation guides at 2.8 SD (large), 1.75 SD (medium), and 0.7 SD (small).
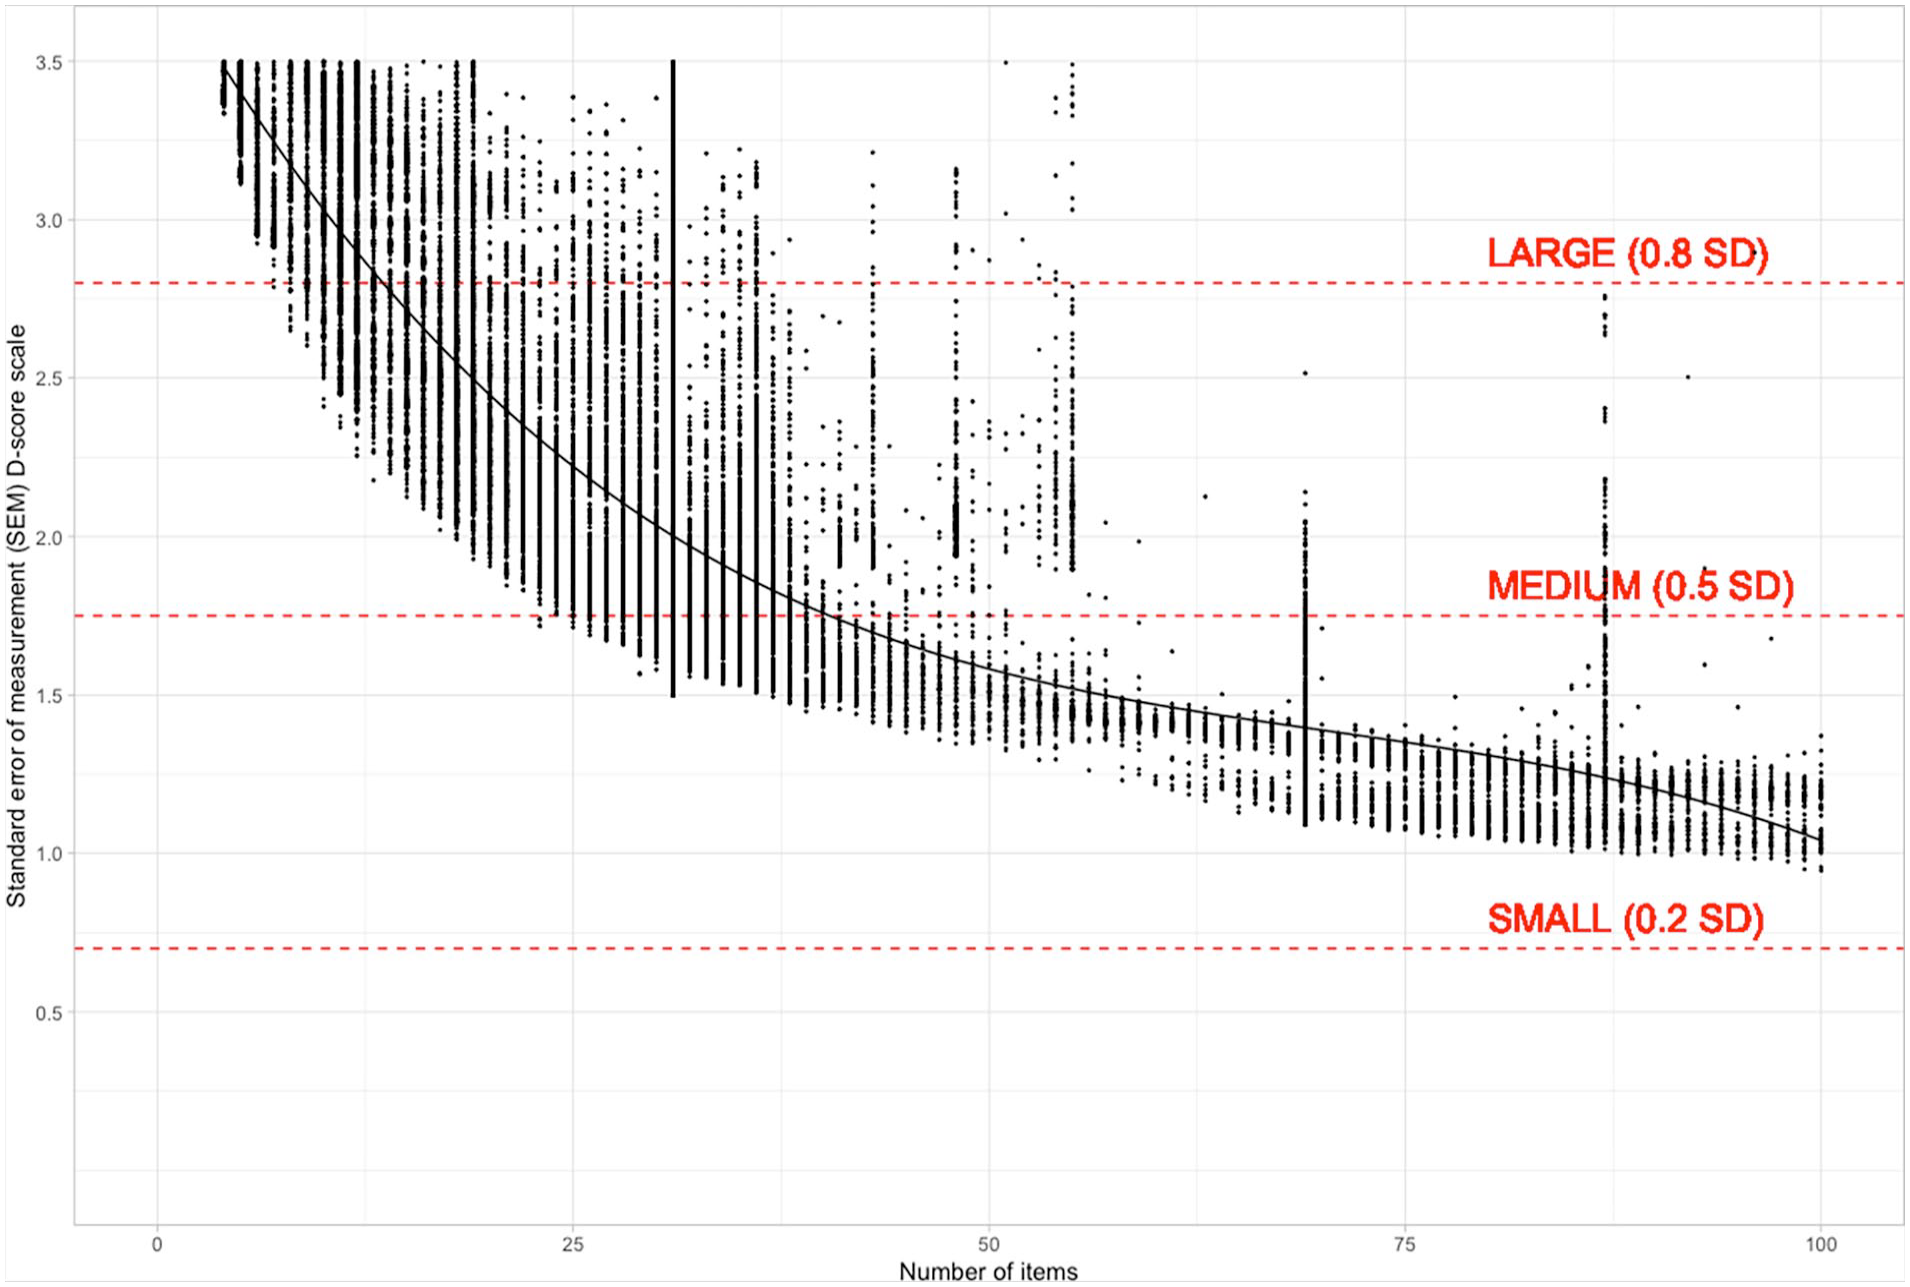
Relation Between the Number of Items and the Standard Error of Measurement (SEM) for the D-score (Key gsed2406).
D-Score by Age by Source
Figure 7 shows the distribution of the D-score by age for 49 sources (46 from Study 1 and 3 from Study 2). The blue lines in the background enhance comparisons and represent preliminary standards calculated from the three Study 2 sources. Floor and ceiling effects are visible for sources with few items, such as GCDG-ECU, IYCD-IDN-ASQ, and CREDI-ZMB-CHPATA.
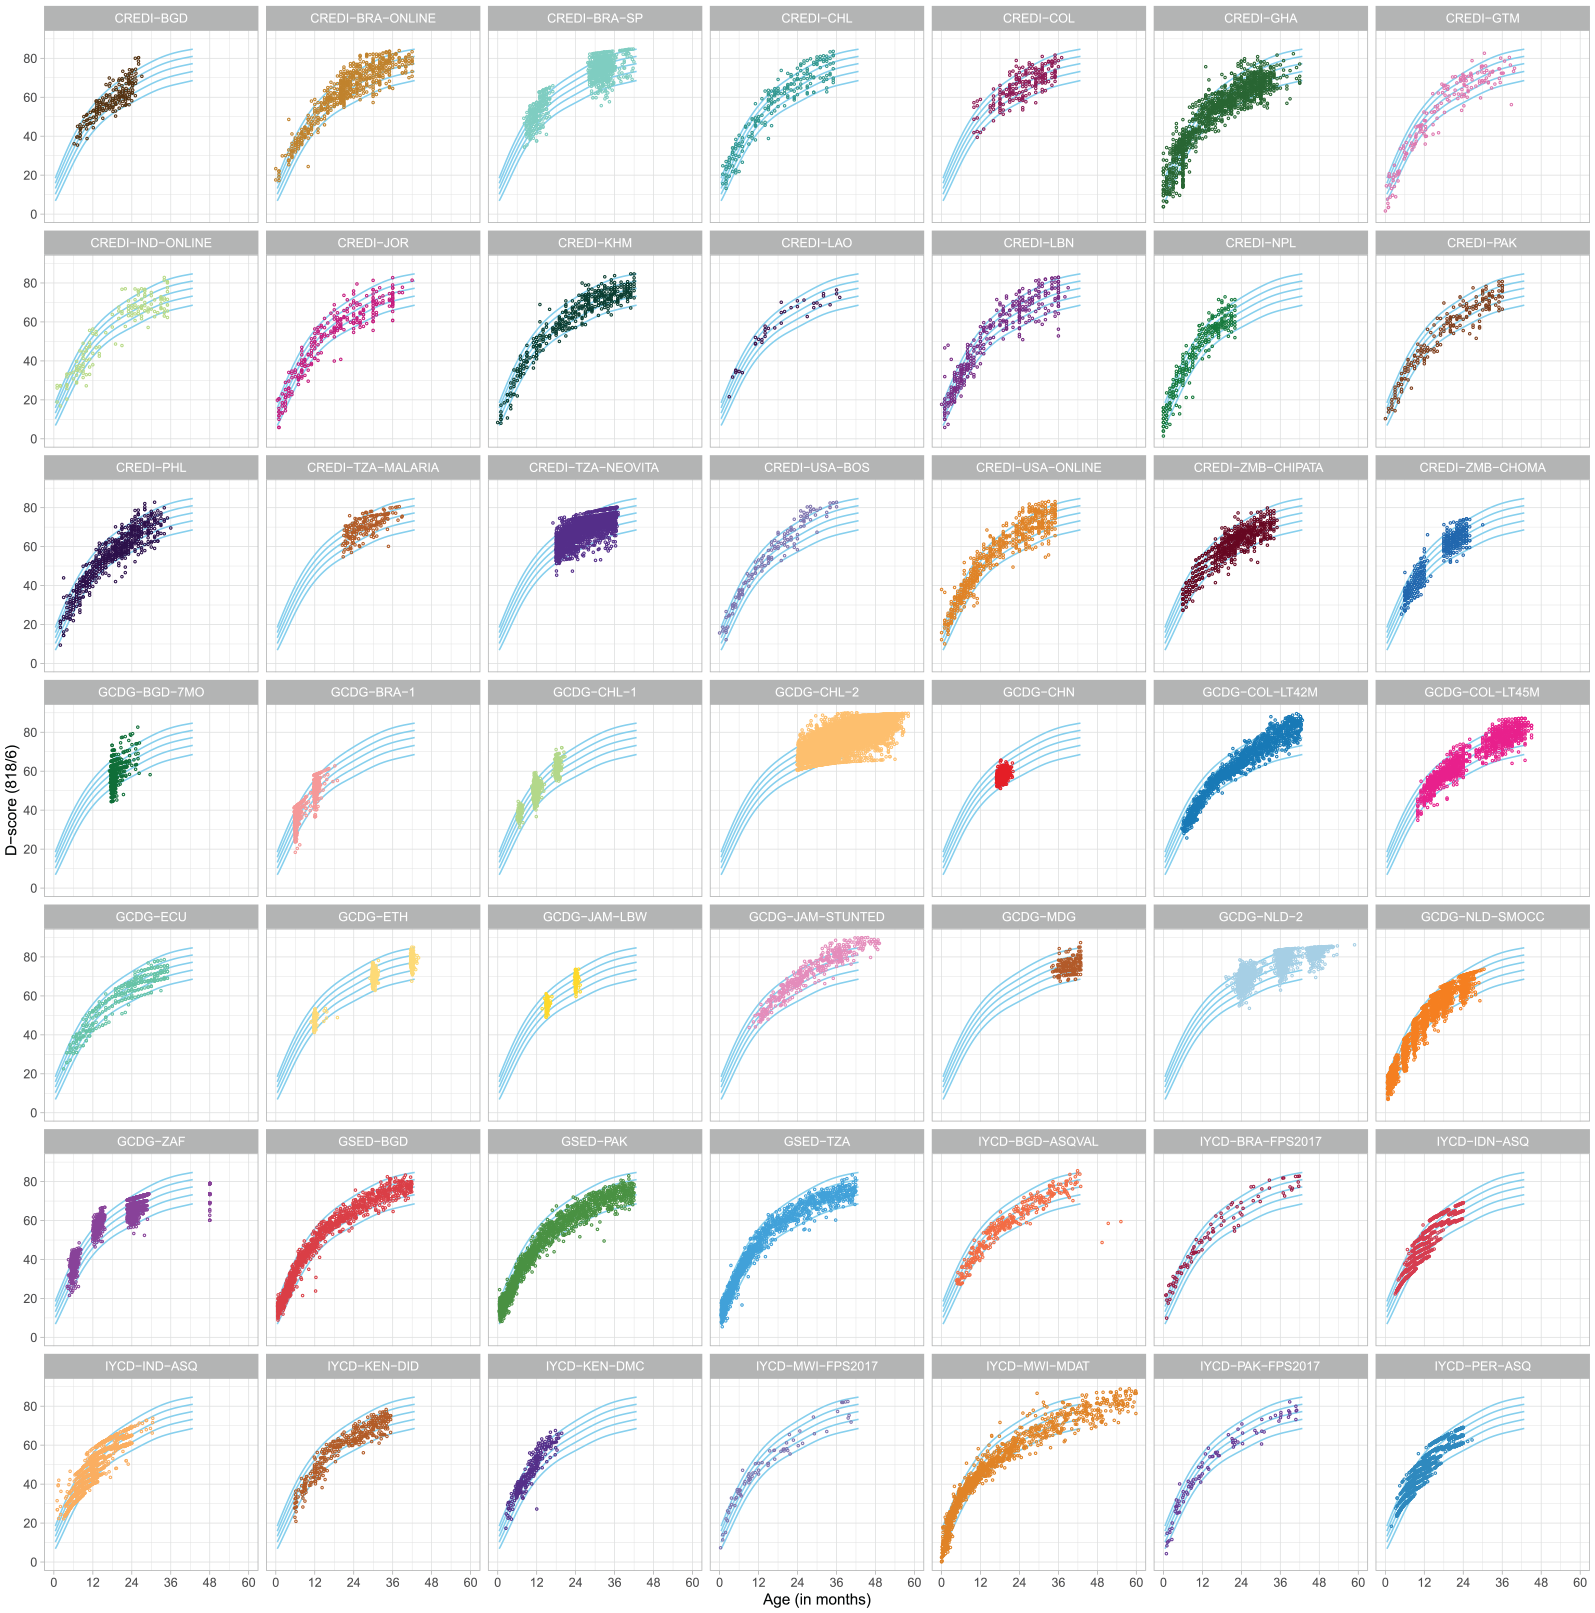
Distribution of the D-score by Age in 49 Sources, Sorted by Country. D-scores are calculated under key gsed2406. The reference lines in the background are age-conditional centiles at –2SD, –1SD, 0SD, +1SD, +2SD of the D-score distribution calculated from three Study 2 sources: GSED-BGD, GSED-PAK, and GSED-TZA.
As expected, the D-score increases with age across all sources. Despite the use of different instruments to collect the source data, the age-related patterns are strikingly similar across sources. The D-score allows developmental scores of children to be plotted on the same vertical axis, regardless of the instrument used for measurement.
The D-score’s interval scale enables the use of standard statistical summaries for numerical data to compare sources. Using the DAZ instead of the D-score (not shown) removes the effect of age, allowing for more fine-grained analyses relative to a shared reference.
Software
For fitting, evaluating, visualizing and deploying the D-score model we generalized the sirt::.pairwise.itemcluster() function (Robitzsch, 2020) to long format and added new functionality to support equate clusters. We used Shiny (Wickham, 2021) to evaluate, visualize, and communicate the analytical results.
We developed a public R package called dscore (van Buuren et al., 2024) for estimating the D-score and the SEM from the user’s data, key and population. Published item banks for keys gsed1912 and gsed2406 are available as key = “gsed1912” and key = “gsed2406,” respectively. Published references for calculating DAZ scores can be specified as population = “phase1” and population = “preliminary_standards.” The current recommendation (and default in dscore 1.9.0) is key = “gsed2406” and population = “preliminary_standards.” This recommendation will likely change once a WHO-endorsed key and standard become available.
Discussion
There is a pressing need for a single comprehensive scale to measure children’s early development. The D-score is a single latent construct representing childhood development for children aged 0–3 years. It captures a subset of skills from the core developmental domains that are believed to hold relevance across diverse cultures. Study 1 extended the D-score to include caregiver-reported data by linking items using virtual items. The resulting key, gsed1912, was used to construct the GSED SF and LF measures, which capture caregiver-reported and direct assessment development, respectively. However, the D-scores for these measures were not well aligned for children younger than 6 months. Study 2 improved the model by collecting additional data on the SF and LF, and by linking the SF, LF, and BSID-III data through person linking. Figure 2 shows that the D-scores from SF and LF are now well aligned across the entire range of the scale. The resulting key, gsed2406, was used to calculate preliminary age-conditional standards for the D-score.
Quality
Conventional ranges for evaluating infit and outfit are
After removing non-fitting items, the item fit, equate fit, and person fit indicate that the data fit the Rasch model. Note that some item pairs are effectively dependent, which leads to violations of the local independence assumption. For example, children cannot jump unless they stand. Thus, we never observe the combination “cannot stand, can jump” in reality, whereas in the dichotomous Rasch model, this combination has an (albeit tiny) positive probability. In principle, we could transform such a pair into a polytomous item and fit a partial credit model that effectively rules out impossible response patterns like “cannot stand, can jump.” However, doing so would complicate the formation of virtual items, and we would lose the dichotomous model’s attractive simplicity. He and Wheadon (2013) compared the application of dichotomous and the partial credit model for such ordered data and concluded that both procedures produce similar item and person estimates. We, therefore, adhered to the dichotomous Rasch model for all items.
We considered using the two-parameter logistic (2PL) item response model, which is more flexible than the Rasch model, can accommodate a broader range of items, and has been applied to develop early child development scales (Drachler et al., 2007; Loizillon et al., 2017; McArdle et al., 2009; Stenhaug et al., 2020). The 2PL model would have allowed more than 818 out of 2,221 items to enter the model, thereby increasing instrument coverage. However, this would come at the cost of measurement fidelity, as the additional items would not discriminate as well on the trait as the Rasch-selected items. In addition, the 2PL model doubles the number of item parameters, complicating the creation of virtual items and making estimation more complex because item and ability parameters do not separate as they do in the Rasch model. The 2PL model is also more challenging to explain and interpret for non-statisticians (Wright, 1992). Given that reported correlations between ability distributions from the Rasch model and the 2PL model are typically very high, ranging from 0.95 to 0.99, we chose to retain the simplicity and versatility of the Rasch model.
Advantages
A significant strength of the D-score is its ability to support multiple instruments, which is valuable because no single instrument can meet all measurement objectives. The current conversion key, gsed2406, supports 20 instruments. Some instruments, such as GSED SF, GSED LF, BSID-III, DDI, and MDAT, are well connected (see Table 1 for more details on instruments). Others, such as the GMDS, KDI, and DMC, are less well connected. Connections could be strengthened by including more data, especially at currently underrepresented age ranges. The D-score can be used alongside existing instruments to provide a comparable and more comprehensive picture of a child’s development. In addition, it can be used to monitor children over time and across cultures and contexts.
The D-score model can include new instruments, provided they are linked to the existing instruments in the key. Currently, the model covers an age range of 0–41 months. To extend the D-score model to older children, new items can be added and linked to the existing items. It is crucial to investigate whether a single number can accurately represent a child’s development at these older ages, when domains may become more differentiated. The model is modular and flexible, allowing it to be adapted to new instruments and data sources.
The importance of domains varies with age (McCray et al., 2023). The SF and LF contain more motor items during the first year, while cognition and language items are more prevalent between ages 1–3. The composition follows the pattern of children’s development, with crucial motor milestones preceding those in the language and cognitive domains. The D-score therefore reflects this dynamic nature of domain importance by age.
Limitations
The D-score is not a “one-size-fits-all” solution for measuring early child development. In particular, the D-score does not provide information on development within a given domain. The importance of the domain-specific scores depends on the objective of measurement. For population-based monitoring, an overall D-score may be adequate. Domain-specific scores can identify children suspected of specific delays or deficits and aid in assessing the impact of interventions on domain-specific skills. The D-score is less suited for those types of applications. Also, the D-score may not be inclusive of developmental skills that are valued differently across cultures, such as obedience or sharing. To capture such skills for given setting or intervention, we recommended supplementing the D-score with specialized instruments.
The data used to develop the D-score included children who were developing typically and children experiencing risks, such as undernutrition and poverty. The D-score may be less informative for children with disabilities (e.g., blindness, cerebral palsy) who may have mastered alternative learning methods. These children may have incongruent item response patterns that would be better evaluated by methods that enabled them to demonstrate their strengths in alternative ways.
Further Research
This article is part of the ongoing GSED project. The project aims to create two internationally standardized and validated measurements for assessing child development for children under age three at the population and program evaluation levels. Study 3 is currently underway and will furnish additional validation data in a broader range of countries (Cavallera et al., 2023). The resulting models, measures, and data will inform the final D-score scale, the final SF and LF, and the potential creation of cross-cultural standards for early child development.
Figure 5 suggests that a single measure for child development might suffice for many purposes. There are numerous methods to evaluate unidimensionality (Hattie, 1985; Price, 2017), necessitating more meticulous work using a variety of approaches. Given the significant implications for the field, extensive research is warranted to rigorously test unidimensionality. This remains a topic for further investigation.
Virtual items are essential for connecting different instruments and ensuring that the D-score is a unified scale. Our methodology for creating and testing virtual items is closely related to the detection of differential item functioning. While we found our approach to be simple and effective, it may not be the optimal way to link items due to its iterative nature, lack of control for Type I errors, and limited automation options. It could be interesting to explore recent approaches to linking (Chen et al., 2024; Halpin, 2024; Robitzsch, 2023) as alternative methodologies for creating virtual items.
Extending the D-score beyond three years of age is under consideration. One potential application of the D-score is quantifying SDG indicator 4.2.1 across the 0–5 years age range by linking to the current SDG indicator, the ECDI2030 (Cappa et al., 2021) from UNICEF (which applies to 2- to 4-year-old children). Beyond 5 years, the D-score might be extended to capture the intellectual, physical (e.g., pubertal stages [Marshall & Tanner, 1969]), and social development of older children. This task could be challenging as fewer holistic instruments for development beyond the early childhood period exist, possibly reflecting the increasingly differentiated nature of development with age.
Adaptive testing technology (Wainer et al., 2014), that is, the computerized selection of test items tailored to an individual based on their responses to previous items, is also being considered to collect data on early child development. Adaptive testing improves the efficiency of test administration and is feasible with current hand-held electronic devices. When supplemented with administration details, the conversion key forms in an integral part the item bank needed for computerized adaptive testing.
Conclusion
The proliferation of measurement instruments in early child development is a mixed blessing. While the availability of comprehensive instruments signals the field’s vitality, the multiple scores produced by these instruments are not easily comparable. This hinders comparisons across populations, monitoring change, and evaluating treatments across different age groups, potentially leading to a disjointed approach and insufficient prioritization of the crucial first 1,000 days.
The D-score represents a significant step toward a unified scale. It simplifies measurement, enhances comparability, and reduces inconsistency. Wider adoption of the D-score could integrate a variety of applications, from individual tracking of children to high-level monitoring and evaluation of early childhood programs and policies, ultimately fostering a more cohesive and effective approach to early childhood development.
Supplemental Material
sj-docx-1-jbd-10.1177_01650254241294033 – Supplemental material for Enhancing comparability in early child development assessment with the D-score
Supplemental material, sj-docx-1-jbd-10.1177_01650254241294033 for Enhancing comparability in early child development assessment with the D-score by Stef van Buuren, Iris Eekhout, Gareth McCray, Gillian A. Lancaster, Marcus R. Waldman, Dana C. McCoy, Melissa Gladstone, Vanessa Cavallera, Tarun Dua and Maureen M. Black in International Journal of Behavioral Development
Footnotes
Acknowledgements
GSED Team (alphabetic order)
1. Salahuddin Ahmed, MBBS, Projahnmo Research Foundation, Dhaka, Bangladesh
2. Dr Abdullah Baqui, MBBS, PhD, Johns Hopkins Bloomberg School of Public Health, Baltimore, Maryland, USA
3. Farzana Begum, MSc, Department of Peadiatrics, Aga Khan University, Karachi Pakistan
4. Prof Maureen M. Black, PhD, Department of Pediatrics, University of Maryland School of Medicine, Baltimore, MD, USA and RTI International, Research Park, NC, USA
5. Dr Alexandra Valeria Maria Brentani, PhD, Dept. of Pediatrics, University of Sao Paulo Medical School, Brazil
6. Dr Vanessa Cavallera, MD, MPH, World Health Organization (WHO), Brain Health Unit in Department of Mental Health and Substance Use, Av. Appia 20, 1202 Geneva, Switzerland
7. Dr Symone Detmar, PhD, Msc, Department of Child Health, Netherlands Organization for Applied Scientific Research TNO, Leiden, The Netherlands
8. Dr Tarun Dua, MD, World Health Organization (WHO), Brain Health Unit in Department of Mental Health and Substance Use, Geneva, Switzerland
9. Arup Dutta, MBA, Center for Public Health Kinetics, New Delhi, India
10. Dr Iris Eekhout, PhD, MSc, Department of Child Health, Netherlands Organization for Applied Scientific Research TNO, Leiden, The Netherlands
11. Prof Günther Fink, PhD, Swiss Tropical and Public Health Institute, Basel, Switzerland
12. Prof Melissa Gladstone, MD, International Child Health and Neurodevelopmental Pediatrics, Department of Women and Children’s Health, Institute of Translational Medicine, University of Liverpool, Alder Hey Children’s NHS Foundation Trust, UK
13. Katelyn Hepworth, MA, University of Nebraska-Lincoln, College of Education and Human Sciences, NE, USA
14. Andreas Holzinger, MA, BA, Innovations for Poverty Action (IPA), Abidjan, Côte d’Ivoire
15. Prof Magdalena Janus, MBBS, FCPS, MSc, Offord Center for Child Studies, McMaster University, Hamilton ON, Canada
16. Prof Fyezah Jehan, MBBS, FCPS, MSc, Department of Peadiatrics, Aga Khan University, Karachi Pakistan
17. Prof Fan Jiang, MD, PhD, Department of Developmental and Behavioral Pediatrics, National Children’s Medical Center, Shanghai Children’s Medical Center, affiliated to School of Medicine Shanghai Jiao Tong University, China
18. Romuald Kouadio E Anago, MA, BA, Innovations for Poverty Action (IPA), Abidjan, Côte d’Ivoire
19. Dr Patricia Kariger, PhD CEGA (Center for Effective Global Action), School of Public Health, University of California, Berkeley, California, USA
20. Raghbir Kaur, MPH, DMD, MS, Consultant World Health Organization (WHO), Brain Health Unit in Department of Mental Health and Substance Use, Geneva, Switzerland
21. Dr Samuel Nzale Kembou, PhD, MA, BA, Innovations for Poverty Action (IPA), Abidjan, Côte d’Ivoire
22. Dr Rasheda Khanam, MBBS, MPH, PhD, International Center for Maternal and Newborn Health, Department of International Health, Johns Hopkins University Bloomberg School of Public Health, Baltimore, MD, USA
23. Prof Gillian A. Lancaster, PhD, MSc, BSc (Hons), Clinical Trials Unit, School of Medicine, Keele University, UK
24. Michelle Pérez Maillard, MSc, Consultant World Health Organization (WHO), Brain Health Unit in Department of Mental Health and Substance Use, Geneva, Switzerland
25. Dr Dana C. McCoy, PhD, Harvard Graduate School of Education, Cambridge, MA, USA
26. Dr Gareth McCray, MA, MRes, PhD, Research Associate, School of Primary, Community and Social Care, Keele University, Keele, UK
27. Dr Mariana Pacifico Mercadante, MD, Dept. of Pediatrics, University of Sao Paulo Medical School, Brazil
28. Dr Susanne Martin Herz, Division of Developmental Medicine, Department Pediatrics at University of California San Francisco (UCSF)
29. Prof Muhammad Imran Nisar, MBBS, MSc, Department of Peadiatrics, Aga Khan University, Karachi Pakistan
30. Ambreen Nizar, BDS, MSc, Department of Peadiatrics, Aga Khan University, Karachi Pakistan
31. Rebecca Norton, Consultant World Health Organization (WHO), Brain Health Unit in Department of Mental Health and Substance Use, Geneva, Switzerland
32. Dr Hilary Abigail Raikes, MPH, PhD, University of Nebraska Medical Center, College of Public Health, Omaha, NE, USA
33. Dr Arunangshu Dutta Roy, MBBS, Projahnmo Research Foundation, Dhaka, Bangladesh
34. Dr Marta Rubio-Codina, PhD, Inter-American Development Bank, Washington, D.C., USA
35. Dr Sunil Sazawal, MBBS, MPH, PhD, Center for Public Health Kinetics New Delhi, India
36. Jonathan Seiden, EdM, Harvard Graduate School of Education, Cambridge, MA, USA
37. Dr Fahmida Tofail, MBBS, PhD, International Centre for Diarrhoeal Disease Research Icddr,b, Dhaka, Bangladesh
38.Prof Stef van Buuren, PhD, Department of Child Health, Netherlands Organization for Applied Scientific Research TNO, Leiden, The Netherlands
39. Eline Vlasblom, Msc, Dept. Child Health, Netherlands Organization for Applied Scientific Research TNO, Leiden, The Netherlands
40. Dr Marcus R. Waldman, PhD, College of Public Health, Omaha, NE, USA
41. Dr Ann Weber, PhD, MPH, School of Public Health, University of Nevada, Reno, NV, USA
42. Dr Yunting Zhang, PhD, Child Health Advocacy Institute, National Children’s Medical Center, Shanghai Children’s Medical Center, affiliated to School of Medicine Shanghai Jiao Tong University, China
43. Dr Jin Zhao, MD, PhD, Department of Developmental and Behavioral Pediatrics, National Children’s Medical Center, Shanghai Children’s Medical Center, affiliated to School of Medicine Shanghai Jiao Tong University, China
44. Mr Arsène Zongo, MA, BA, Innovations for Poverty Action (IPA), Abidjan, Côte d’Ivoire
Author Contributions
All authors contributed substantively to this work. SvB and IE conceptualized the paper; SvB drafted the manuscript; SvB, IE, MW, GM, and GL performed the statistical analyses; GM and GL collected domain-related data; MG, DMc, MB, VC, and TD provided subject-matter expertise and suggested alternative models. All authors read and approved the final manuscript submission. The GSED Team group author is the consortium of which the present study forms a part.
Disclaimers
The author is a member of the World Health Organization. The author alone is responsible for the views expressed in this publication, and they do not necessarily represent the decisions, policies or views of the World Health Organization [Applies to Cavallera V, Dua T, Kaur R, Pérez Maillard M, and Norton R]. The views presented here do not represent the Inter-American Development Bank, its board of directors, or the countries it represents [Applies to Rubio-Codina M].
Data Sharing
The study used a mix of existing data and new data. The Bill & Melinda Gates Foundation facilitated data sharing. The original study owners made anonymous data available to BMGF under a mutual Memorandum of Understanding (MOU). Data from a subset of 10 GCDG studies is published as the childevdata R package (van Buuren et al., 2021). For access to other data, contact the original study owners for CREDI (McCoy, Waldman, et al., 2018), GCDG (Weber et al., 2019), IYCD (Lancaster et al., 2018) and GSED (Cavallera et al., 2023).
Funding
The author(s) disclosed receipt of the following financial support for the research, authorship, and/or publication of this article: This work was supported (in alphabetical order) by the Bernard van Leer Foundation and the Bill & Melinda Gates Foundation. The funders provided financial support. The World Health Organization led the manuscript’s design, implementation, and writing.
Ethics Approval
For Study 1, as it is a secondary data analysis of de-identified data, no IRB approval was required in accordance with TNO guidelines. Therefore, IRB approval was not sought for this study. Study 2 received ethical approval from the WHO (protocol GSED validation 004583, approved on 20 April 2020), as well as site-specific IRB approvals. As the work involved de-identified and pre-existing data, no further IRB approval was required for this analysis.
Registration Details
Registration details Open Science Framework on 19 November 2021 (DOI 10.17605/OSF.IO/KX5T7); identifier: osf-registrations-kx5t7-v1.
Supplemental Material
Supplemental material for this article is available online.
References
Supplementary Material
Please find the following supplemental material available below.
For Open Access articles published under a Creative Commons License, all supplemental material carries the same license as the article it is associated with.
For non-Open Access articles published, all supplemental material carries a non-exclusive license, and permission requests for re-use of supplemental material or any part of supplemental material shall be sent directly to the copyright owner as specified in the copyright notice associated with the article.