
Abstract
To illuminate individual differences in the development of attention-deficit hyperactivity disorder (ADHD) symptoms in the general population, psychometric measures are needed that can capture general population-level symptom variation reliably, validly, and comparably from childhood through to the transition to adulthood. The ADHD subscale of the Social Behavior Questionnaire (SBQ-ADHD) provides a candidate for a measure that can meet this need. We thus evaluate the psychometric properties of the SBQ-ADHD as administered in adulthood (ages 20 and 24) to a large normative sample, as well as the cross-informant (parent-teacher-self-reports) and developmental (ages 7–24) measurement invariance of a core SBQ-ADHD item set. Results support score internal consistency reliability, gender measurement invariance, and criterion validity. Scores from the core item set showed some evidence of non-invariance, providing insights into how ADHD symptoms may manifest and/or be perceived differently by different informants/in different contexts and at different ages. Our findings overall support the use of the SBQ-ADHD items for developmental studies of ADHD symptoms from childhood to adulthood.
Attention-deficit hyperactivity disorder (ADHD) is defined by symptoms of attention difficulties and/or hyperactivity/impulsivity (American Psychiatric Association, 2013). When symptoms are severe and impairing, a clinical diagnosis of ADHD may be merited; however, symptoms—both phenotypically and etiologically—lie on a continuum, making the availability of dimensional measures of ADHD symptoms important for research into their influences, development, treatment, and outcomes (e.g., Groen-Blokhuis et al., 2014; Murray, Eisner, Obsuth & Ribeaud, 2017; Murray, Eisner & Ribeaud, 2017). Indeed, measures of ADHD symptoms as a domain of psychosocial development have been used to gauge the psychosocial health of the young population and to evaluate the impact of policies and universal interventions on child development (e.g., Black & Martin, 2015; Malti et al., 2011) and measures of ADHD symptoms are commonly included in non-clinical longitudinal cohorts (Murray, Booth, Ribeaud & Eisner, 2018; Murray, Speyer, et al., 2021; Murray, Ushakova, et al., 2021; Riglin et al., 2021). ADHD symptoms have traditionally been associated with childhood; however, it is now widely accepted that symptoms also affect adults (Kessler et al., 2010). Moreover, ADHD symptoms can show substantial change and individual differences in change over the course of development (Caye et al., 2016). This means that there is a need for measures that are capable of tracking their change from childhood to adulthood. The purpose of the present study was thus to evaluate the psychometric properties of a dimensional measure of ADHD symptoms designed to capture general population-level variation in symptoms from childhood to adulthood. Building on previous validation work that has examined the properties of the scale scores in childhood and adolescence (e.g., Murray, Booth, Eisner, Ribeaud, et al., 2019; Murray, Booth, Ribeaud & Eisner, 2018; Murray, Eisner, Obsuth & Ribeaud, 2017; Murray, Eisner & Ribeaud, 2017; Murray, Obsuth, et al., 2019; Murray, Ribeaud, et al., 2019), we use a large longitudinal normative sample to examine the factorial validity, reliability, and criterion validity of scores in adulthood, as well as the extent to which they show measurement invariance across development and informant.
Historically, the majority of the focus of ADHD research has been on childhood; however, there is growing recognition that ADHD symptoms also affect adults. At this stage of development, ADHD symptoms may be associated with impairments at work, with driving, in social and romantic relationships, and carry an increased risk of criminal behavior and problematic substance use and gambling (e.g., Asherson et al., 2012). The acknowledgment of the prevalence and impact of adulthood ADHD symptoms has prompted increased efforts to develop and adapt ADHD symptom measures for adulthood. For example, prominent measures such as the Connors Adult ADHD Rating Scales (CAARS; Conners et al., 1999), Adult ADHD Self-report Scale (ASRS; Kessler et al., 2005), and the Adult ADHD Clinical Diagnostic Scale (ACDS; Kessler et al., 2010) and their revisions (Christiansen et al., 2012; Silverstein et al., 2019; Ustun et al., 2017) specifically aim to capture ADHD symptoms as they manifest in adults and adulthood contexts (also see Sandra Kooij et al., 2008, for a discussion of other adult ADHD measures).
However, there is also a strong need for measures of ADHD symptoms that not only produce reliable and valid scores in adulthood but also comparable scores that can be interpreted in a similar way from childhood to adulthood. That is, there is a need for measures that produce measurement invariant scores across different stages of development (Murray, Speyer, et al., 2021). Such measures are critical for illuminating ADHD from a developmental perspective. For example, they are needed to map the normative of trajectories of inattention and hyperactivity/impulsivity and to identify predictors and outcomes of following different trajectories, for example, remitting versus stable versus late-onset trajectories (Murray et al., 2020; Murray, Hall, et al., 2021; Pingault et al., 2011; Sasser et al., 2015). If measures of ADHD symptoms do not produce comparable scores across different developmental stages, observed symptom developmental trajectories may partly or wholly reflect measurement differences rather than true differences (Murray, Obsuth, et al., 2019).
There are a number of challenges associated with producing measures of ADHD symptoms that can be used to assess symptoms in all of children, adolescents, and adults, foremost of which is that symptom manifestations may change considerably over the course of development (Kessler et al., 2010). For example, inattention tends to be more persistent over development than hyperactivity, creating differences in overall symptom profiles between childhood and adolescence (Kessler et al., 2010). Similarly, overt hyperactive behaviors such as difficulty remaining seated may be replaced by internal restlessness (Weyandt et al., 2003). One recent study using data from Avon Longitudinal Study of Parents and Children (ALSPAC) examined the frequency of different ADHD symptoms at ages 7, 15, and 25 and found differences across development. At age 7, the three most common symptoms were “fidgets,” “talks excessively,” and “easily distracted”; at age 15, they were “easily distracted,” “difficulty organizing,” and “avoids concentration tasks”; and at age 25, they were “difficulty calming down/relaxing,” “difficulty organizing,” and “easily distracted” (Niina et al., 2022). The contexts of symptoms also change (e.g., from classroom to workplace). As such, items that can capture changes in ADHD symptoms over the course of development in a comparable manner will typically have to be generic with respect to context. Finally, adults may develop compensatory strategies for their symptoms, including exerting the additional autonomy they have to shape/select their environments based on symptoms (Asherson et al., 2012).
These considerations can create a conflict between capturing developmentally specific manifestations of symptoms and administering developmentally invariant scales that provide comparable scores across different life stages. One possible solution is to identify a core set of items that is developmentally invariant to use as anchors and supplement these with developmentally specific items at different stages. Although finding invariant items may be challenging, simulation studies have suggested that only a relatively small subset of items need to be measurement invariant to provide comparable scores at the level of latent means, provided that the non-invariant items can be identified and their non-invariance modeled (e.g., Pokropek et al., 2019).
A closely related issue is that informants typically change over the course of development. In childhood, typically teachers and parents are considered best placed to report on childhood symptoms. This is based on the idea that young people with ADHD symptoms may be prone to under-reporting symptoms (Yeguez & Sibley, 2016). Later in development, however, as young people gain greater independence and transition out of school, there will be a greater reliance on self-reports. This creates issues of comparability of scores across childhood, adolescence, and adulthood and may result in spurious developmental differences between these stages (Kan et al., 2014). However, analogous to the issue of changing symptom manifestations over development, this issue could be addressed by identifying a core set of invariant items across informants.
Finally, a challenge in measuring ADHD symptoms in adulthood is sex or gender differences in the manifestation of symptoms at this stage of development. In general, ADHD symptoms in females appear to be more prominently inattentive; more closely associated with internalizing issues such as anxiety and depression (as opposed to the externalizing symptoms that more commonly co-occur in males); and overall less well detected given the historical focus on ADHD and its measurement in a framework that conceptualized it primarily as a male condition (Williamson & Johnston, 2015). As such, it cannot be assumed that measures of ADHD will provide comparable, measurement invariant, scores across males and females (Murray, Speyer, et al., 2021). Rather, ADHD symptoms may manifest differently and/or interact with the different patterns of co-occurring issues in males and females, with the profiles of the latter potentially less well captured by existing measures.
Given the need for dimensional measures of ADHD symptoms that can provide scores across wide developmental spans, including adulthood and across males and females, we here evaluate a core set of ADHD symptom items from the Social Behavior Questionnaire (SBQ; Tremblay et al., 1991) as candidates for a brief measure of ADHD symptoms that can be used from childhood to adulthood in research contexts. These items represent good candidates for several reasons. First, their wording is general in that they do not refer to developmentally specific behaviors or contexts (e.g., difficulties concentrating at school; problems in romantic relationships). Second, there are teacher-, self-, and parent-reported versions that can be potentially harmonized to overcome the difficulty of changing informants over development (see, for example, Murray, Ribeaud, et al., 2019 for a discussion of the parent and teacher reports). Third, they have previously shown evidence of reliable and valid scores across a range of ages, including measurement invariance across adolescence, and resistance to response shifts in the context of interventions (Murray, Booth, Eisner, Ribeaud, et al., 2019; Murray, Eisner, Obsuth, & Ribeaud, 2017; Murray, Eisner, & Ribeaud, 2017; Murray, Obsuth, et al., 2019). This makes them good candidates for measures of ADHD symptoms in longitudinal observational and intervention follow-up studies.
However, though several studies have used these items to explore the impacts of ADHD symptoms in adulthood (Murray, Lavoie, et al., 2021; Murray, Wong, et al., 2021; Speyer et al., 2022), none have yet provided a psychometric validation for this developmental stage, nor explored their developmental invariance with earlier stages of development. To evaluate the extent to which the items can meet this need, we evaluate (1) their psychometric properties in adulthood, including factor structure, internal consistency, gender invariance, and criterion validity and (2) their invariance across ages and informants based on parent-reported data at ages 7, 9, and 10; teacher-reported data at ages 7, 8, 9, 10, 11, 12, 13, and 15; and self-reported data at ages 13, 15, 17, 20, and 24.
Methods
Participants
Participants were from the Zurich Project on Social Development from Childhood to Adulthood (z-proso) based in Zurich, Switzerland (Ribeaud et al., 2022). Z-proso is a longitudinal cohort study of development currently spanning ages 7–24. The first wave of data collection was in 2004 and participants have been followed up at regular intervals since. We used data from all waves, with the adult SBQ data coming from the most recent two measurement waves, at ages 20 and 24 (N = 1157–1180; ~52% female) and the core SBQ-ADHD item set data coming from all main data collection waves (ages 7, 8, 9, 10, 11, 13, 15, 17, 20, 24). Data for ages 7–20 were collected before the COVID-19 pandemic and the data for age 24 were collected after its onset but after the lockdown periods had ended. Sample size was fixed and determined based on the available N from the z-proso dataset. Sample sizes for the analytic sample for each measurement occasion are provided in Table 1.
Ns by Gender at Each Measurement Instance.
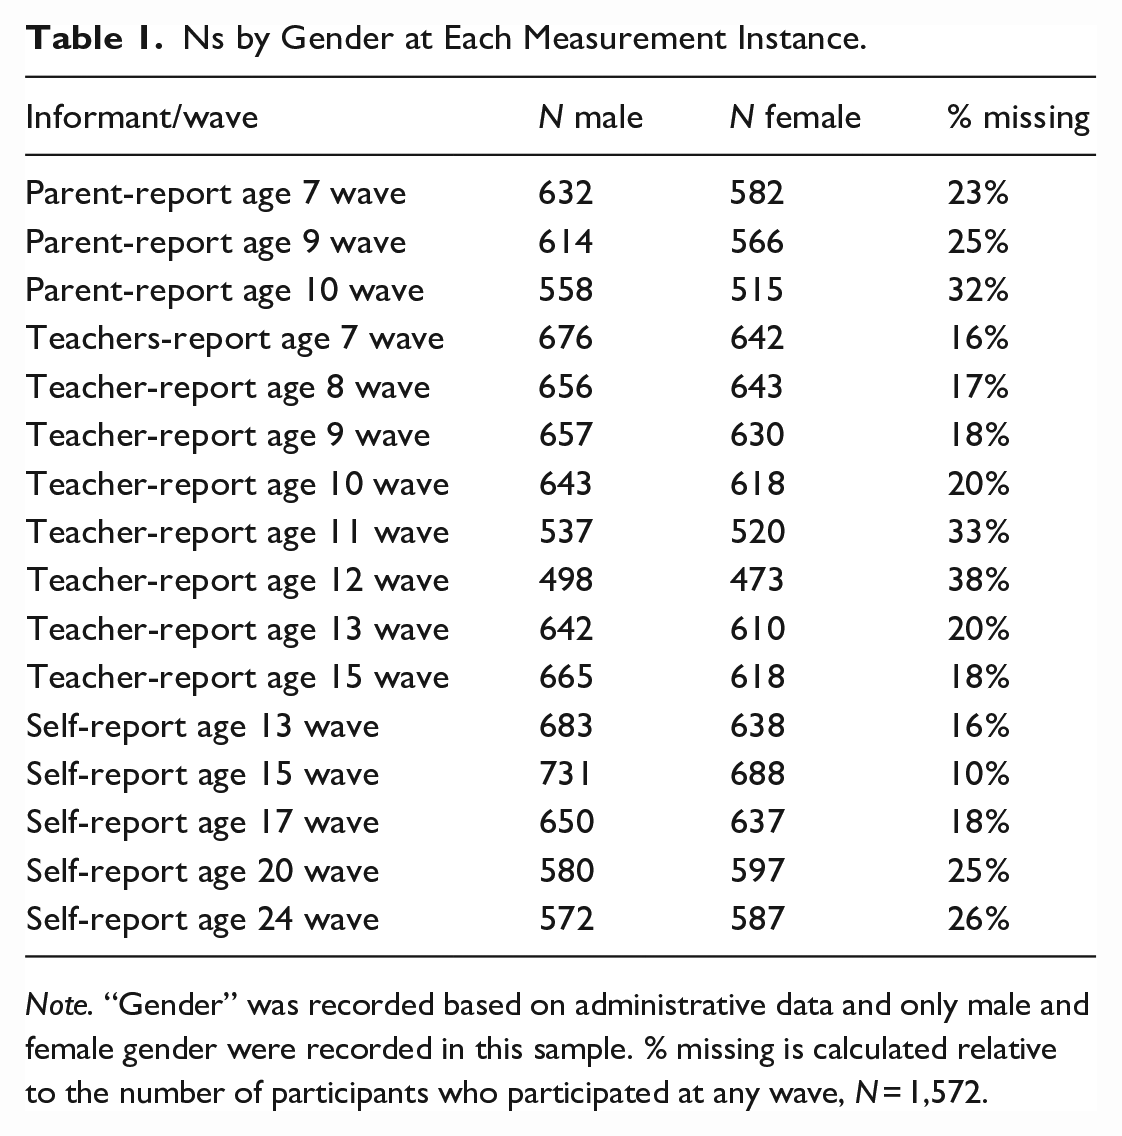
Note. “Gender” was recorded based on administrative data and only male and female gender were recorded in this sample. % missing is calculated relative to the number of participants who participated at any wave, N = 1,572.
Ethics
The data collection for the current study was approved by The Ethics Committee of the Faculty of Arts and Social Sciences of the University of Zurich (Approval Nr. 2018.2.12 for wave 8 [aged 20] and approval Nr. 21.12.13 for wave 9 [aged 24]).
Measures
SBQ-ADHD
The SBQ-ADHD scale is a subscale from the Social Behavior Questionnaire (Tremblay et al., 1991). It includes nine items measuring symptoms of inattention, hyperactivity, and impulsivity. Symptoms covered are restlessness, being easily distracted, difficulties concentrating, doing things without thinking, being forgetful, inattention, being hectic and fidgety, being unable to settle for long, and internal restlessness. The items were selected from a pool of SBQ ADHD items based on being reviewed for developmental appropriateness for a wide age span. The internal restlessness item was added based on previous evidence that ADHD symptoms are more likely to manifest in this manner in adulthood, as compared to more overt expressions in childhood. Item responses are recorded on a 5-point Likert-type scale from never to very often. These items were administered at the age 20 and 24 waves of data collection.
A set of four core items from the SBQ-ADHD was also examined across development and informants (teachers, self-reports, and parent-reports). These items were those that had been administered to all informants. These items were the items referring to restlessness, difficulties concentrating, inattention, and being hectic and fidgety. Parent-reported data was available at ages 7, 8, 9, 10, and 11, self-report data was available at ages 13, 15, 17, 20, and 24, and teacher-reported data was available at ages 7, 8, 9, 10, 11, 13, and 15.
Criterion Validity Measures
Criterion validity measures were selected based on previous research demonstrating links between ADHD symptoms and aggression (Murray, Wong, et al., 2021), anxiety (Melegari et al., 2018), depression (Riglin et al., 2021), delinquency (Baggio et al., 2018), substance use (Erskine et al., 2016), low self-control (Schoepfer et al., 2019), and stress (Salla et al., 2019).
Several types of aggression were measured using the SBQ aggression subscales. Oppositional aggression and physical aggression were measured with three items each and reactive, proactive, and indirect (social) aggression were measured with four items each. Responses are recorded on a 5-point Likert-type scale from never to very often.
Anxiety was measured using the SBQ anxiety subscale. This includes four items with responses recorded on a 5-point Likert-type scale from never to very often.
Depression was measured using the SBQ anxiety subscale. This includes nine items with responses recorded on a 5-point Likert-type scale from never to very often.
Delinquency was measured at age 20 using a variety index, that is, the sum of the incidence of seven delinquent acts in the previous 12 months: stealing at home, shoplifting goods worth less than 50CHF, shoplifting goods worth more than 50CHF, vehicle theft, fare dodging, vandalism, and assault. Variety indices are considered advantageous over frequency-based scores because they avoid composite scores being disproportionately driven by frequent but minor offenses (Sweeten et al., 2013).
Tobacco use was measured with a single item asking respondents to report their consumption in the last 12 months on a 6-point scale: 1 = never, 2 = once, 3 = 2 to 5 times, 4 = 6 to 12 times (monthly), 5 = 13 to 52 times (weekly), and 6 = 53 to 365 times (daily).
Self-control was measured at age 20 using an adapted 10-item version of Grasmick’s Low Self-control scale (Arneklev et al., 1993; Longshore et al., 1996). It measures self-control in terms of impulsivity, risk-seeking, preference for physical over cognitive activity, temper, and self-centeredness. Responses are recorded on a 4-point scale from fully untrue to fully true.
Stress was measured at age 20 using an abbreviated four-item version of the Perceived Stress Scale (Cohen, 1988). Responses are recorded on a 5-point Likert-type scale from never to very often.
Statistical Procedure
R code for all analyses is provided at: https://osf.io/uhxqa/. This includes the full model specifications for all confirmatory factor analysis (CFA) and structural equation model (SEM) models described below.
Exploratory Factor Analysis
We began by exploring the dimensionality of the adult ADHD SBQ items based on the age 20 data. We did this as a first step because past research has suggested some ambiguity around the factor structure of the SBQ. In particular, earlier studies have suggested that either a one-factor model or a higher-order model with differentiated inattention and hyperactivity/impulsivity factors could be more suitable for the subscale as administered to children and adolescents (Murray, Booth, Obsuth, et al., 2018), but they did not conduct extensive psychometric investigations. Furthermore, no studies have previously empirically examined the dimensionality of the nine-item scale administered to adults.
We first checked the factorability, linearity of relations, and univariate normality of the observed variables. We used parallel analysis with principal components analysis (PA-PCA), the minimum average partial test (MAP), and the inspection of a scree plot to guide the number of factors to retain. Where the number of factors to retain was ambiguous, we inspected the solutions for different numbers of factors and drew on substantive and practical considerations (e.g., whether lower numbers of factors blurred substantively important distinctions or higher numbers of factors resulted in “minor factors”). On selecting an optimal number of factors, we used a “minimum residuals” (minres) factor extraction approach but checked that our findings were not substantially different using other extraction methods. If more than one factor was suggested, we used an oblique (oblimin) rotation to allow the factors to be correlated.
Confirmatory Factor Analysis
Following the development of a factorial structure for the SBQ-ADHD scale informed by exploratory factor analysis (EFA), we fit a CFA model in the age 20 and age 24 data. Neither dataset was independent of the EFA dataset; therefore, these analyses were not treated as an attempt to “confirm” the factor structure, which will be necessary in future independent samples. Rather, a CFA approach was used to (1) provide a suitable framework to implement the measurement invariance analyses and (2) provide complementary information to the EFA on an optimal model (e.g., examining modification indices and expected parameter changes [EPCs] to identify local mis-specification after selecting a basic factorial structure). Latent variable scaling and identification were achieved by fixing the latent factor variances to 1 and the model was fit in lavaan using maximum likelihood estimation. The CFA was considered to fit well if the comparative fit index (CFI) and Tucker–Lewis index (TLI) were >.95 and if the root mean square error of approximation (RMSEA) and standardized root mean residual (SRMR) were <.05. We also checked that all loadings were >|.30| and statistically significant at p < .05. If the model did not fit well according to CFI, TLI, RMSEA, and SRMR, we examined modification indices (MIs) and EPCs to gain insights into possible sources of mis-fit.
Nomological Network Analysis
A nomological network was constructed from the SBQ-ADHD and criterion validity measures. The associations were estimated within a SEM in which a measurement model was specified for each construct and the covariances between the constructs estimated. The measurement model for delinquency used a “variety index” approach in which an observed composite score was formed by summation of individual binary-coded delinquent behaviors. Variety indices are considered an optimal way to form composite delinquency scores because they avoid the issue of scores mostly reflecting minor offenses that individuals may engage in often, for example, not paying for public transport (Sweeten et al., 2013). This was then included in the SEM as a single-indicator latent variable. Similarly, tobacco use was measured using a single item which was included as a single-indicator latent variable in the model. The measurement models for all other constructs were unidimensional latent factor models. All latent variables were scaled by fixing their variance to 1.
Gender Invariance Analysis
The invariance of the SBQ across males and females was tested at age 20 and separately at age 24 using the final CFA model developed as described above. A multi-group CFA approach was used in which successive additions of cross-group constraints were tested, beginning with a configural model and adding loading constraints to test metric invariance, intercept constraints to test scalar invariance, and residual variance constraints to test residual invariance. Configural invariance was accepted based on a multi-group model with minimal constraints required for identification fitting reasonably well based on the same criteria as discussed above. Metric, scalar, and residual invariance were evaluated based on the criteria offered by Chen (2007). For our sample size, these criteria suggest that metric invariance does not hold if the addition of loading constraints results in a fit deterioration of CFI ⩾ .010, RMSEA ⩾ .015, and SRMR ⩾ .030; scalar invariance does not hold if there are fit deteriorations of CFI ⩾ .010, RMSEA ⩾ .015, and SRMR ⩾ .010 with intercept constraint additions; and residual invariance does not hold if CFI ⩾ .010, RMSEA ⩾ .015, SRMR ⩾ .010, with residual variance constraint additions. If invariance did not hold at a given level, a partial invariance model was sought by iterative release of equality constraints, guided by modification indices and EPCs.
Developmental and Informant Invariance Analysis
To test developmental and cross-informant invariance, we fit a configural model in which latent factors were defined for ADHD measured by each available informant at each wave. Given that each set of informant/wave scores can be viewed as a repeated measurement instance for each individual, we followed an invariance approach based on longitudinal invariance testing (e.g., Kim & Willson, 2014; Little, 2013; Murray, Speyer, et al., 2021). The model thus included 16 ADHD latent factors; one for each informant/wave combination shown in Table 1. There was only one wave in which all three informants provided data and several waves in which only one informant provided data, in line with many developmental studies, which change informants according to the age of participants.
In the configural model for identification purposes, the mean and variance of the latent factor for parent reports age 7 were fixed to 0 and 1, respectively, while the means and variances of all other factors were freely estimated. In addition, the loading and intercept for the first indicator was fixed to equality over informants/ages, in line with recommendations for identifying the configural model in longitudinal invariance settings (Widaman et al., 2010). The parent age 7 factor thus acts as a reference factor and provides a simple interpretation for latent mean and variance parameters for the wave/informant factors (i.e., as differences from this baseline). All item residual variances were free to vary in this model.
Other parameters were also added to capture covariances anticipated between the items over and above those due to the latent ADHD factors. First, residual covariances were permitted for the same items measured across informants at the same wave to capture item-specific variance shared across informants. Second, residual covariances between the items reported by the same informant across adjacent waves were specified to capture item-specific variance shared across proximal time-points. Third, the previously identified residual covariances between items within the same wave/informant report were included. A simplified version of the configural model displaying the key features of the specification is shown in Figure 1.
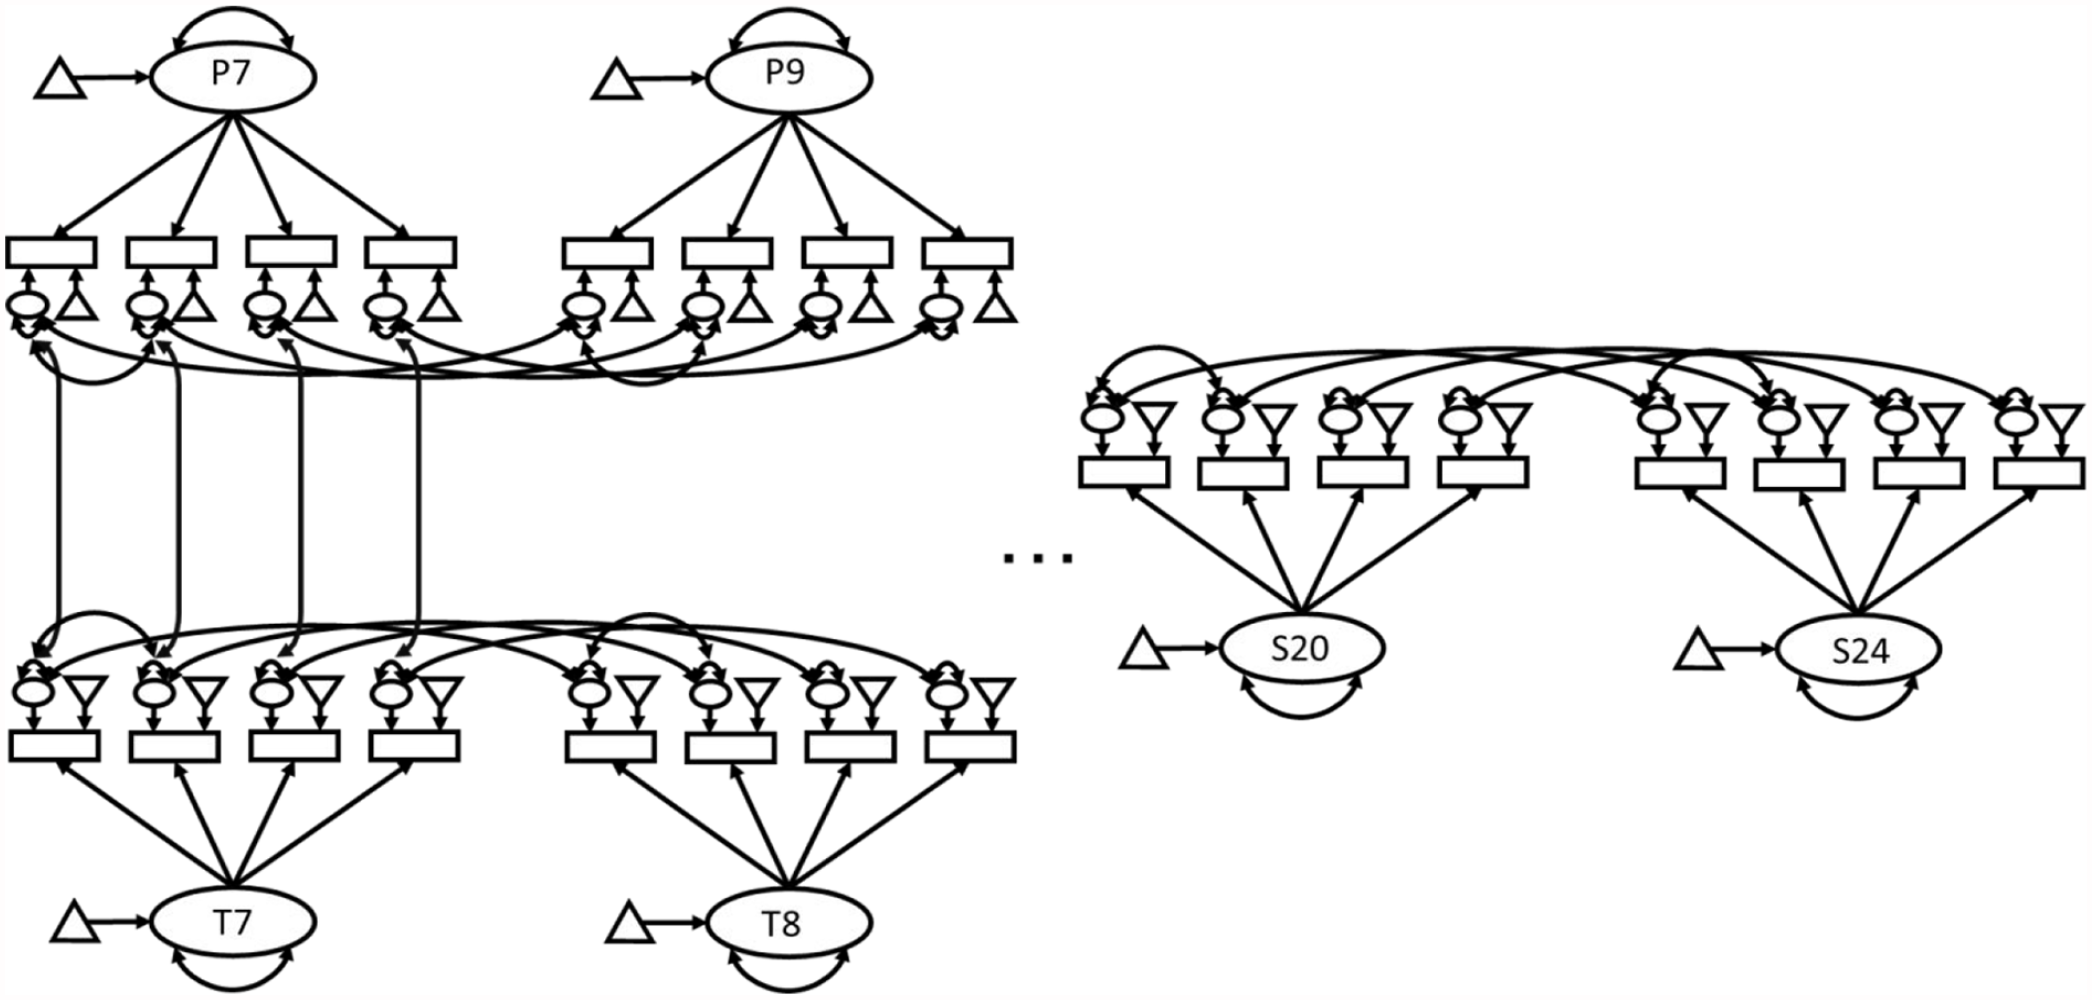
Longitudinal and Multi-Informant Model. Figure shows a reduced version of the longitudinal and cross-informant model fit to the data, with T7 and P7 showing the model for teacher and parent reports at age 7; T8 and P8 showing teacher and parent reports at age 8; and S20 and S24 representing self-reports at age 20 and 24, respectively. Each latent variable represents the ADHD scores for an informant (teacher, parent, or self-report) at a given wave (age 7, 8, 9, 10, 11, 12, 13, 15, 17, 20, or 24). Table 1 provides the full list of wave/informant combinations. Residual covariances were included between the same item at adjacent waves reported by the same informant as well as between the same item measured by different informants at the same wave. Finally, residual covariances were included between two items within the same latent variable based on the earlier analyses used to develop the configural model. Not shown in the diagrams are the identifying constraints.
To test for metric and scalar invariance, cross-informant/age loading and intercept constraints were added to the model and assessed as described in the gender invariance section. Partial invariance models were sought if full invariance at a given level could not be achieved. We took this approach because primary interest was not in separating variance shared between versus unique to informants or waves but to illuminate whether measures taken at different waves and based on different informant approaches could be interpreted in a comparable manner.
Missingness Treatment
Full information maximum likelihood (FIML) estimation was used to deal with missing data in the CFA and SEM analyses. This provides unbiased estimates under an assumption of missing at random (MAR).
Results
EFA
Visual inspection of univariate histograms and loess lines for the relations between each pair of observed variables suggested that the observed data approximated multivariate normality (see Figures S1 and S2 of Supplementary Materials). A Kaiser–Meyer–Olkin (KMO) test yielded an overall KMO value of .89, with all variables showing KMO values > .84, supporting the factorability of the data. Parallel analysis, MAP, and inspection of a scree plot all suggested one dimension to retain. The scree plot is shown in Figure 2.
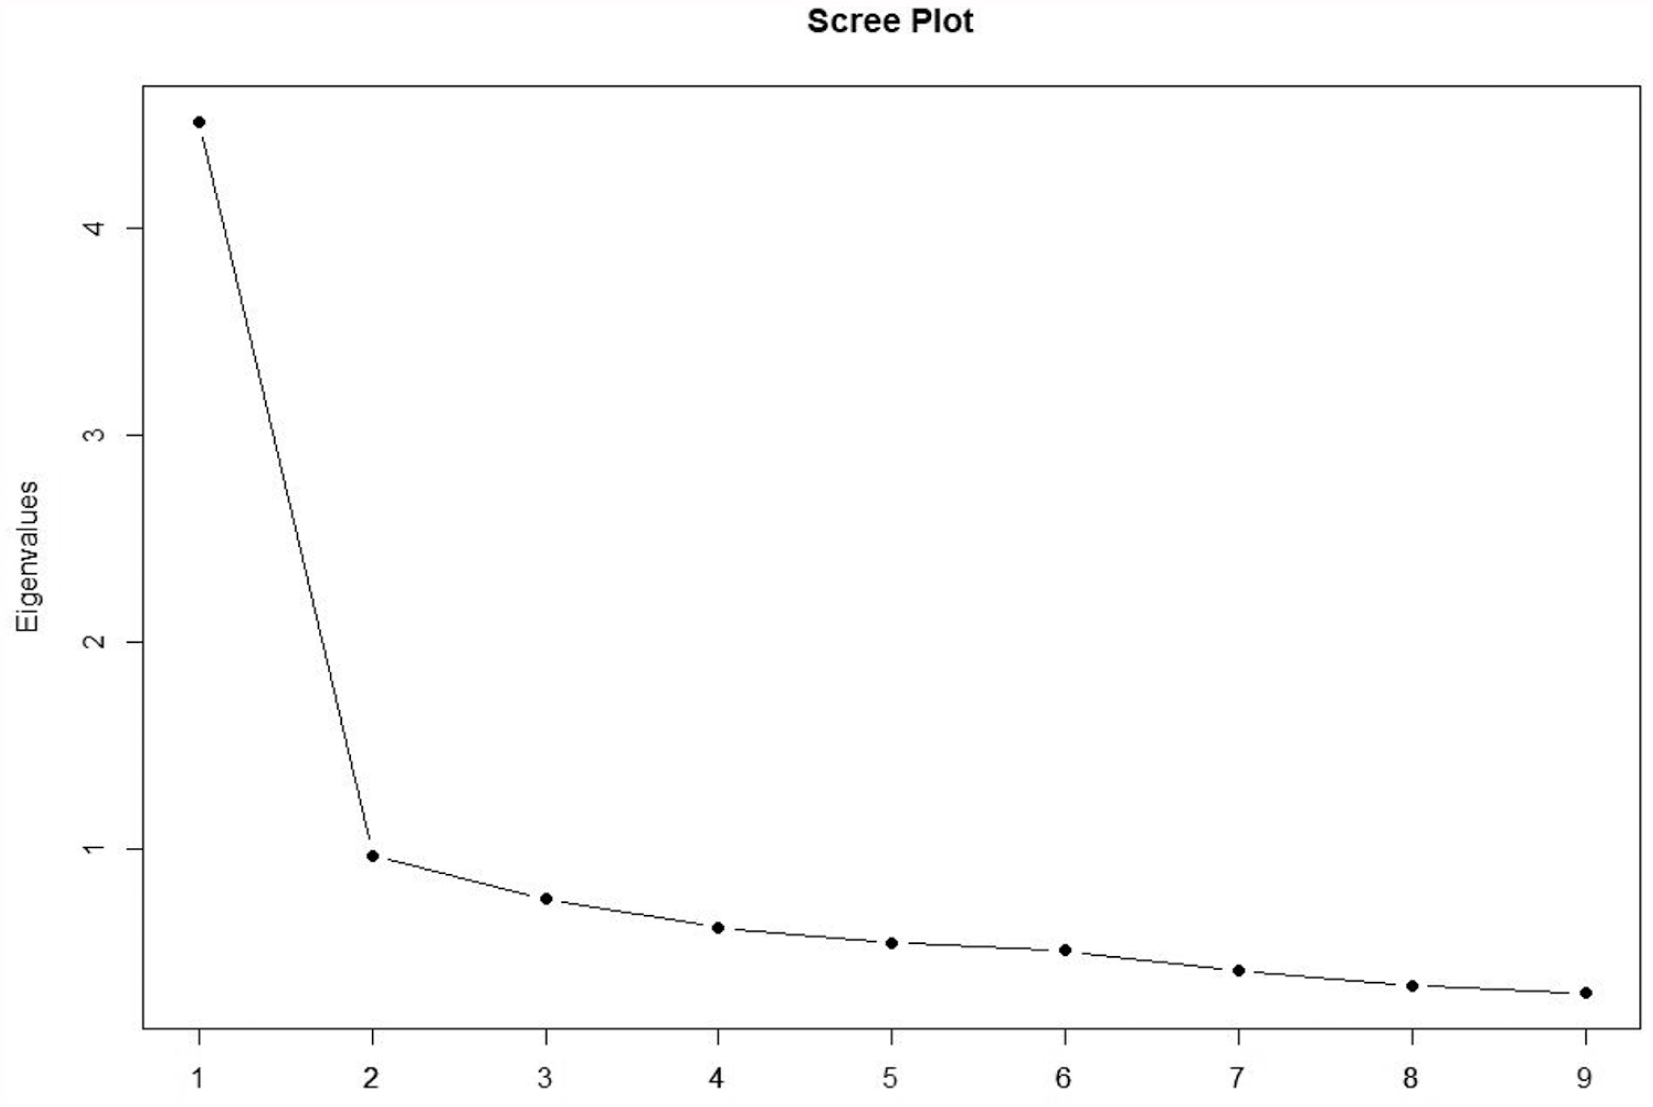
Scree Plot for ADHD Items.
The factor loadings for the minres solution are provided in Table 2. The highest loading items referred to being inattentive, having difficulties concentrating, and being easily distracted; however, all were above |.50|. The pattern of loadings supported the interpretation of the underlying latent factor as a general ADHD symptoms factor.
EFA Loadings for the SBQ-ADHD Items.
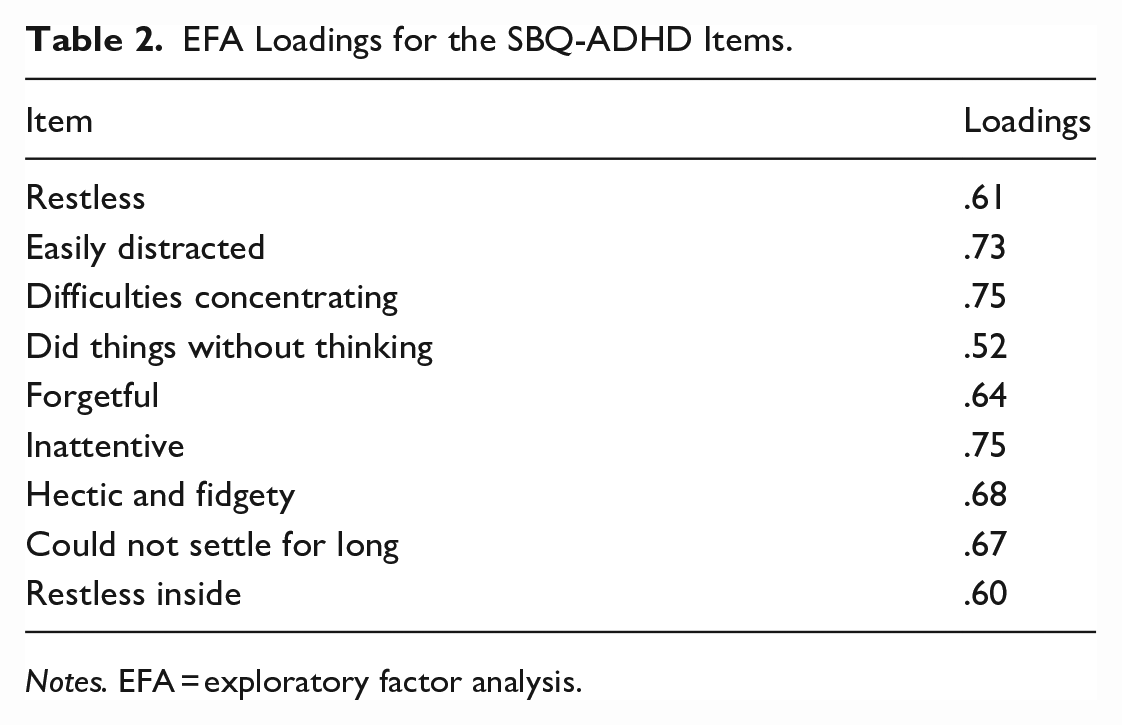
Notes. EFA = exploratory factor analysis.
CFA
Based on the above-described EFA, we fit a one-factor CFA to the age 20 data to gain complementary information about the optimal factor structure for the SBQ-ADHD scale. The initial model did not fit well according to conventional standards for good fit (CFI = .89, TLI = .85, RMSEA = .12, 90% confidence interval [CI]: [.12, .13], SRMR = .05). Inspection of modification indices and EPCs suggested that fit could be improved with the addition of residual covariances between items “restless” and “hectic and fidgety” and between items “easily distracted” and “concentration difficulties.” Given that the first pair of items measure closely related hyperactivity symptoms and the second pair measure closely related inattention symptoms, it was judged justifiable from a substantive perspective to add the suggested residual covariances. Doing so improved the model fit such that the model, on balance, met conventional standards for good fit (CFI = .97, TLI = .95, RMSEA = .07, 90% CI: [.06, .08], SRMR = 0.04). The structure of the model fit to the data including this residual covariance is shown in Figure 3. Taken together, the evidence from the EFA and CFA suggested that the SBQ-ADHD is more unidimensional than multidimensional but that some items share covariance in excess of that which is due to their common dependence on an underlying general ADHD dimension. The standardized loadings for this model are provided in Table 3.
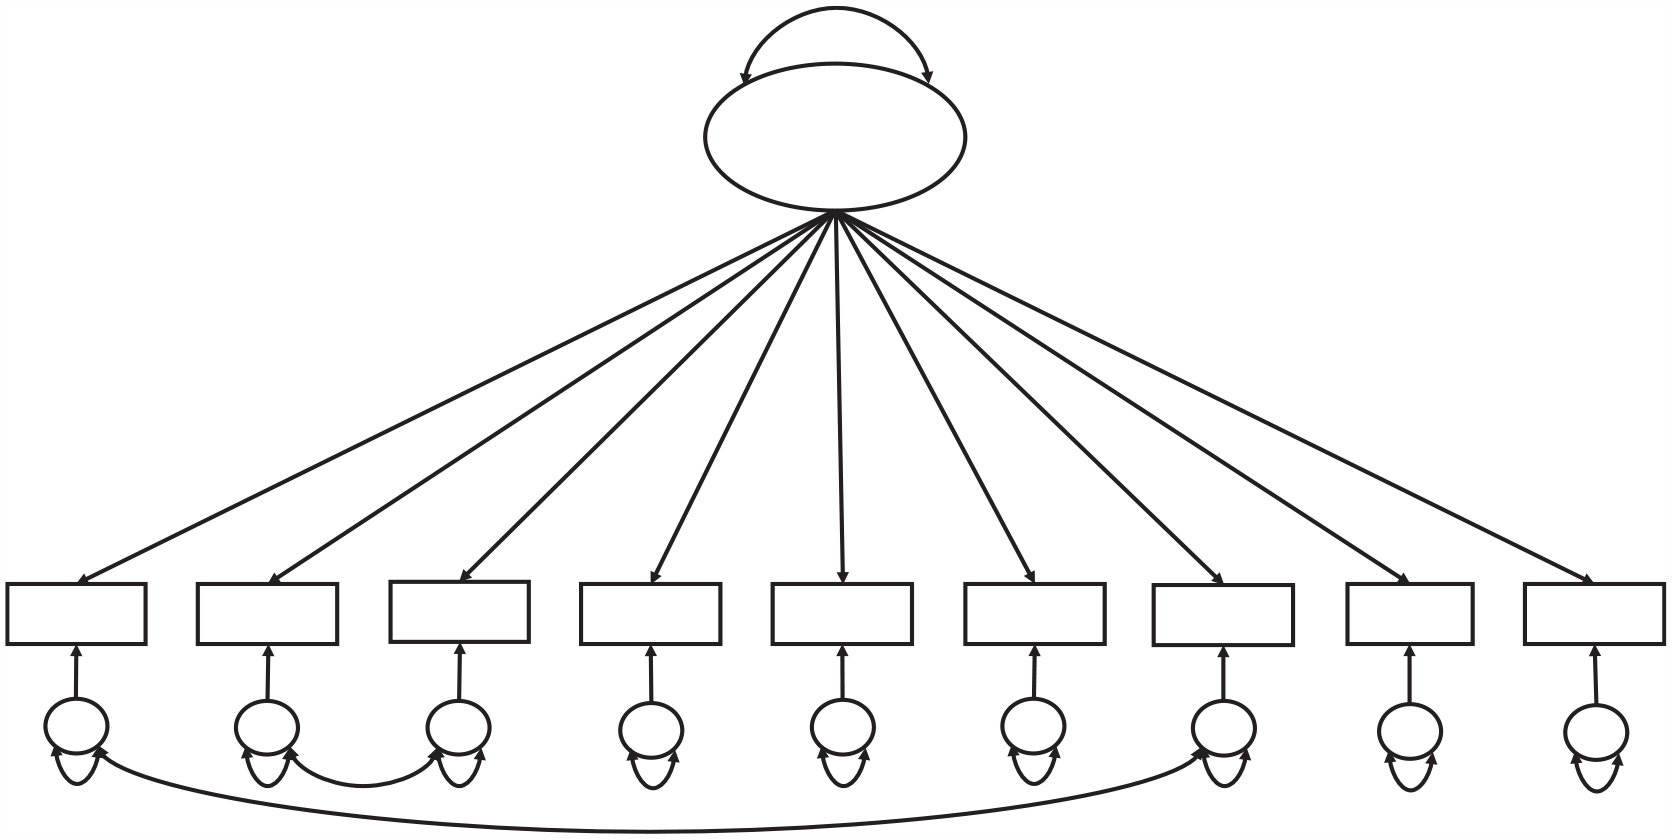
Single Group CFA Model Fit at Ages 20 and 24. Figure shows the structure of the final model fit to the data at ages 20 and 24, including residual covariances between the restless and hectic/fidgety items and between the easily distracted and the concentration difficulties items. CFA = confirmatory factor analysis.
CFA Loadings for the SBQ-ADHD Items.
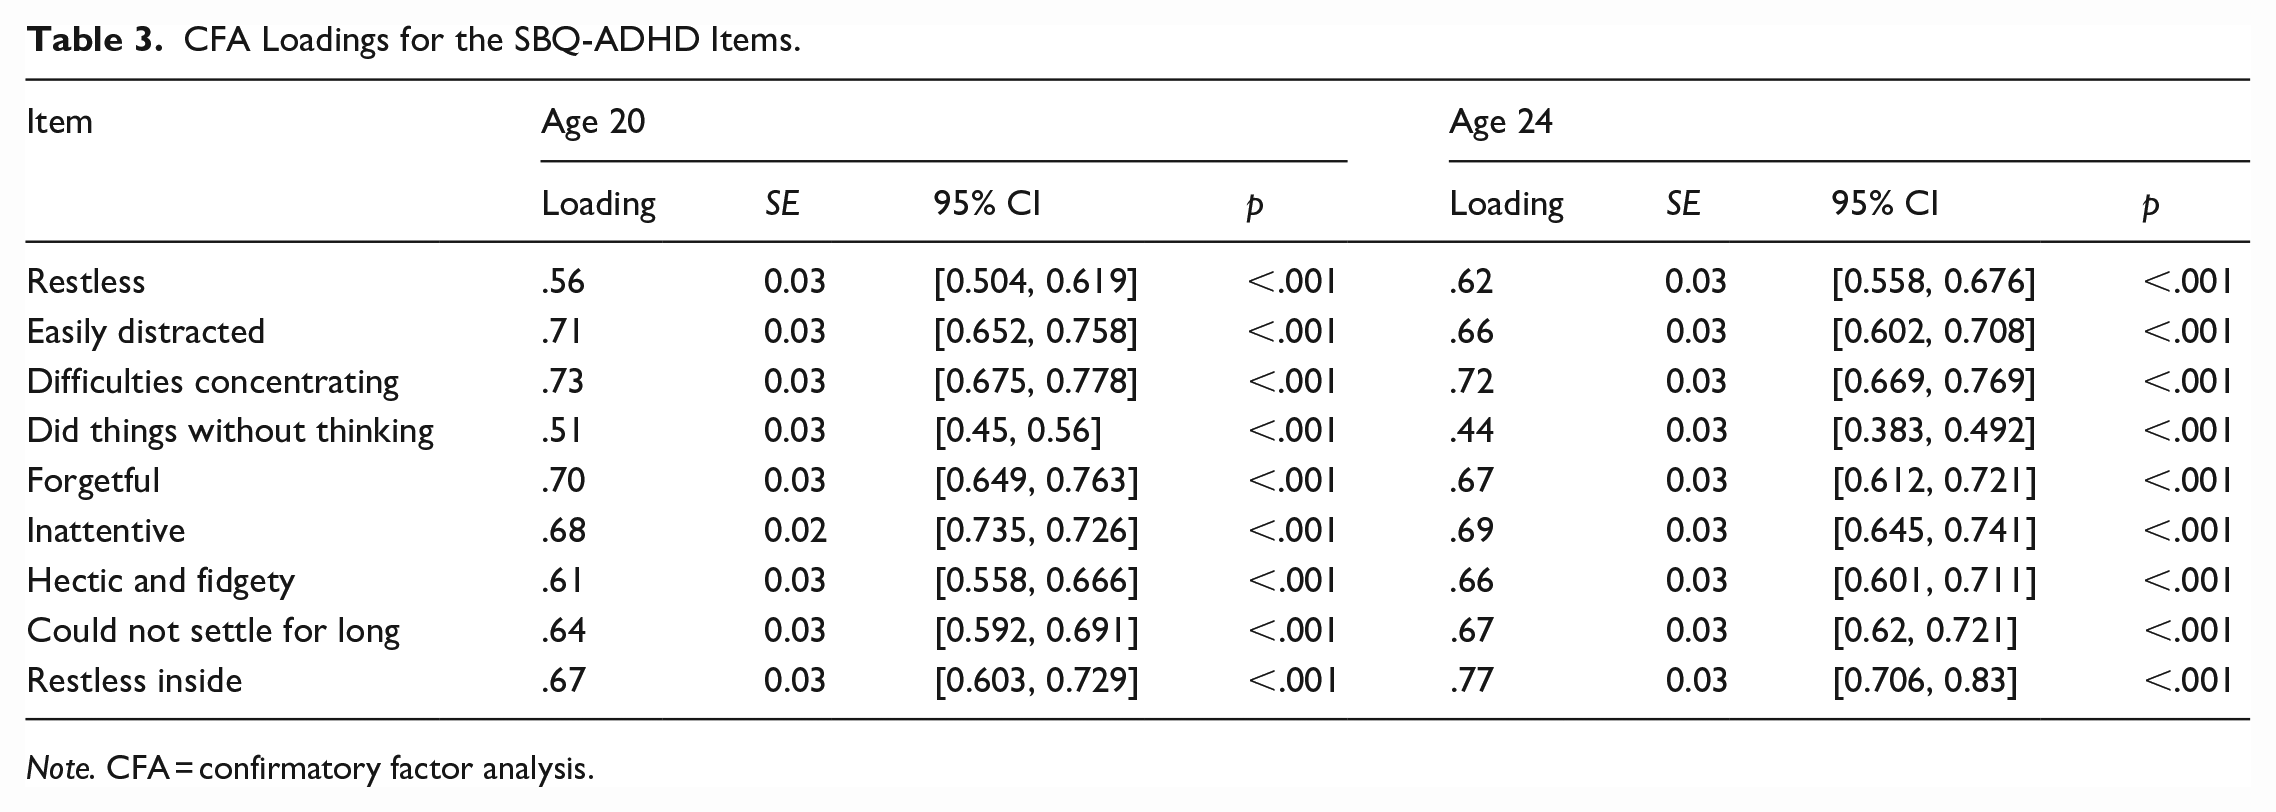
Note. CFA = confirmatory factor analysis.
The final CFA model developed in the age 20 data was then fit to the age 24 data. Prior to fitting this model, we examined the normality and linearity of the items scores/their relations to confirm no serious assumption violations (see Figures S3 and S4 of Supplementary Materials). The model fit overall well by conventional standards (CFI = .96, TLI = .95, RMSEA = .08, 90% CI: [.07, .09], SRMR = .03). The standardized loadings are provided in Table 3. All were .47 or above and statistically significant. The residual covariances added based on the age 20 CFA were statistically significant and indicated a correlation between the “restless” and “hectic and fidgety” items of r = .50 and between the “easily distracted” and “concentration difficulties” items of r = .37.
Internal Consistency Reliability
The omega total values for the SBQ-ADHD at age 20 and 24 were, respectively, .87 and .88, suggesting good internal consistency reliability.
Criterion Validity Associations
The correlations between age 20 SBQ-ADHD scores and the criterion validity measures are provided in Table 4. The strongest associations were observed with anxiety, depression, and stress. All associations were positive and significant except with tobacco use and physical aggression (which was non-significant).
Criterion Validity Associations.
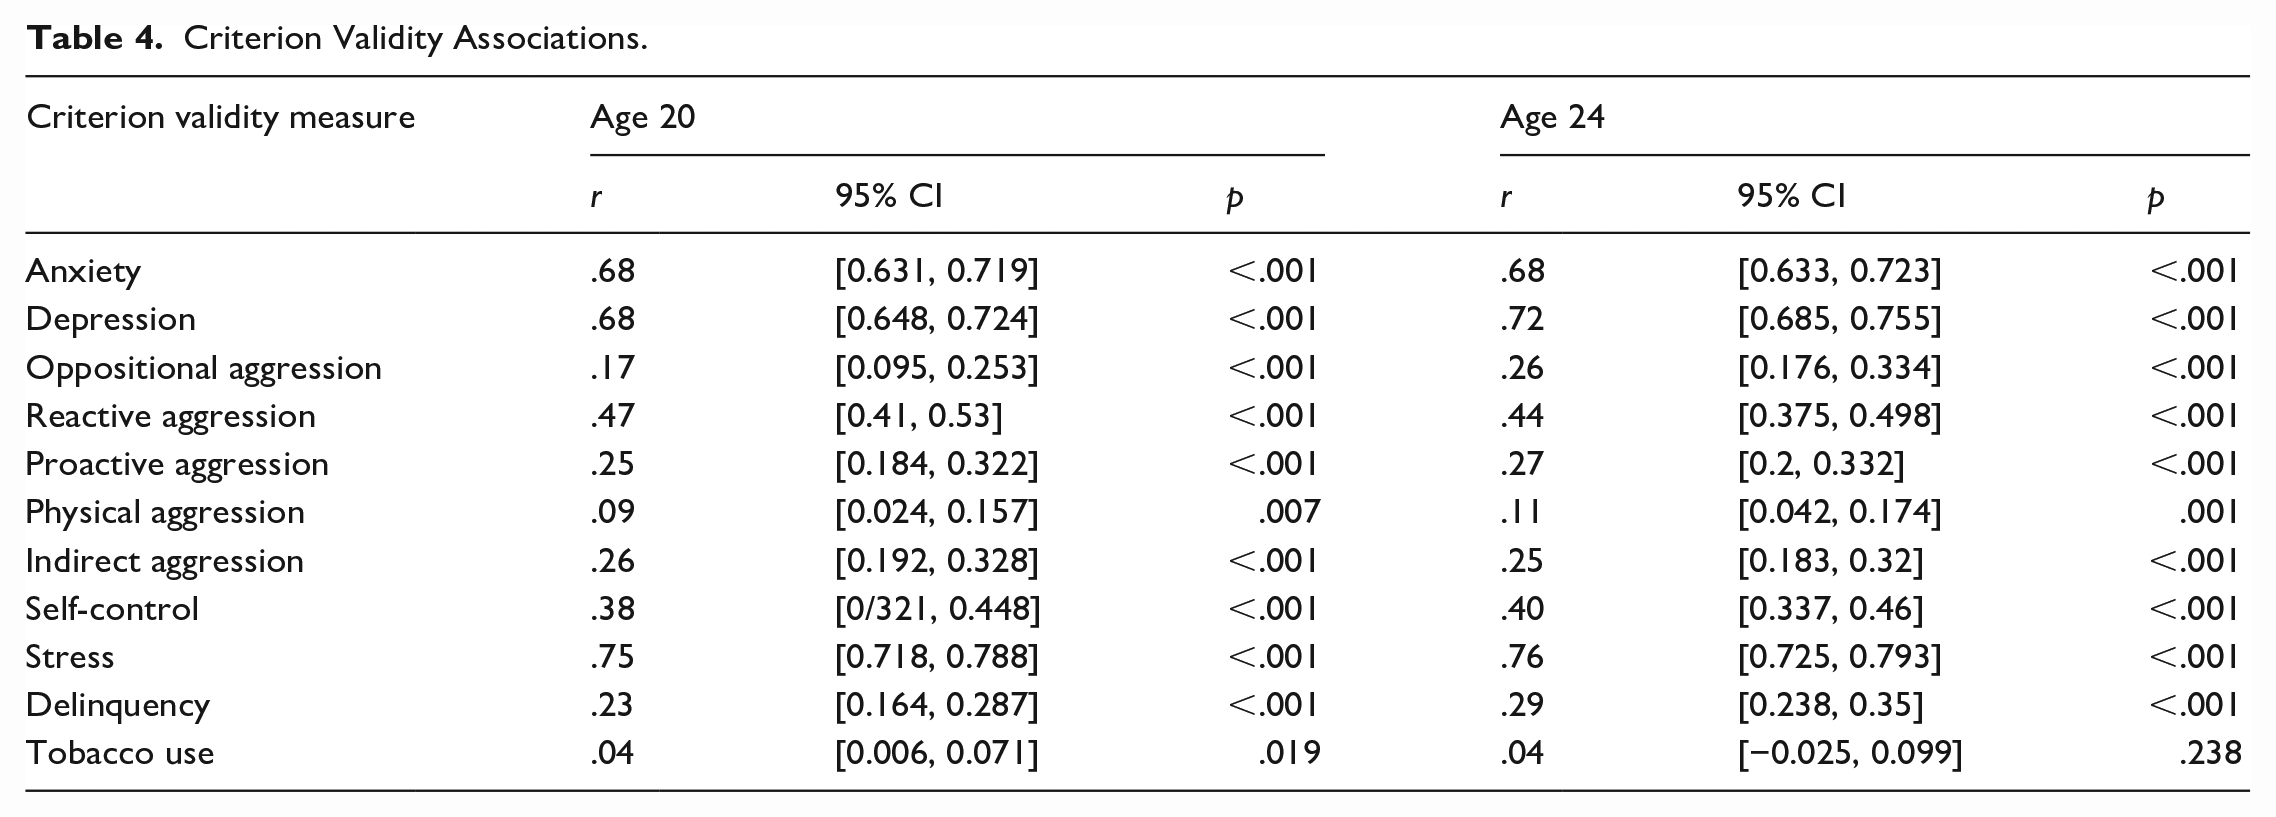
The correlations between the age 24 SBQ-ADHD scores and the criterion validity measures are provided in Table 3. The pattern of associations was very similar to that at age 20. All were positive and significant except with tobacco use.
Gender Invariance Analysis
The fits for the configural, metric, scalar invariance, and residual models fit separately to the age 20 and age 24 data are provided in Supplementary Table S1. The model shown in Figure 3 was used as the basis for the configural model. These suggested that invariance held up to the residual level for the age 20 data, with configural: CFI = .965, TLI = .949, RMSEA = .071, SRMR = .036; metric: ΔCFI = −0.001, ΔRMSEA = −0.005, ΔSRMR = 0.004; scalar: ΔCFI = −0.008, ΔRMSEA = 0.003, ΔSRMR = 0.004. The omega total values for the male and female subsamples at age 20 were .86 and .88.
For the age 24 data, fit statistics suggested that configural (CFI = .960, TLI = .943, RMSEA = .078, SRMR = .036) and metric invariance (ΔCFI = 0.000, ΔRMSEA = −0.005, ΔSRMR = 0.005) held; however, the deterioration in CFI with the addition of cross-group intercept constraints (ΔCFI = −.0012, ΔRMSEA = 0.005, ΔSRMR = 0.007) slightly exceeded the .010 threshold suggested by Chen (2007). Given that the “restless inside” item showed a large intercept difference in the metric invariance model, we released the intercept constraint on this item to attempt to achieve partial invariance. On the release of this constraint, partial scalar invariance held (ΔCFI = 0.004, ΔRMSEA = −0.002, ΔSRMR = −0.002). Adding residual variance constraints to this model (allowing the residual variance of “restless inside” item to freely vary across groups) did not result in deteriorations in fit in excess of Chen’s (2007) criteria (ΔCFI = 0.005, ΔRMSEA = −0.0012, ΔSRMR = 0.000). It was, therefore, concluded that partial residual invariance held for the age 24 data. At age 24, they were also .86 and .88 for males and females, respectively.
Developmental and Cross-Informant Invariance of a Core Item Set
We began by fitting single group (informant/time point) CFAs to evaluate the fit of a single-factor model to the core set of four ADHD indicators from the SBQ-ADHD; however, the fit for this model was generally poor for the majority of time points/informants. This was unsurprising given that this core item set included two of the items where a residual covariance was indicated in the full adult ADHD scale administered at age 20 and 24. Indeed, inspection of modification indices and EPCs for each single group CFA model tended to identify this parameter for inclusion. The model fits for the models including this residual covariance are provided in Supplementary Table S3. These suggested that the addition of the residual covariance between the “restless” and “hectic and fidgety” items provided an appropriate configural model for further invariance testing. The structure of the final CFA model fit for each informant/time-point combination is shown in Figure 4. The omega reliabilities for this model fit to each informant/time-point combination are provided in Supplementary Table S3. All were above the .70 threshold considered the minimum for acceptable reliability except that for parent-reported symptoms at age 7, which had omega = .69.
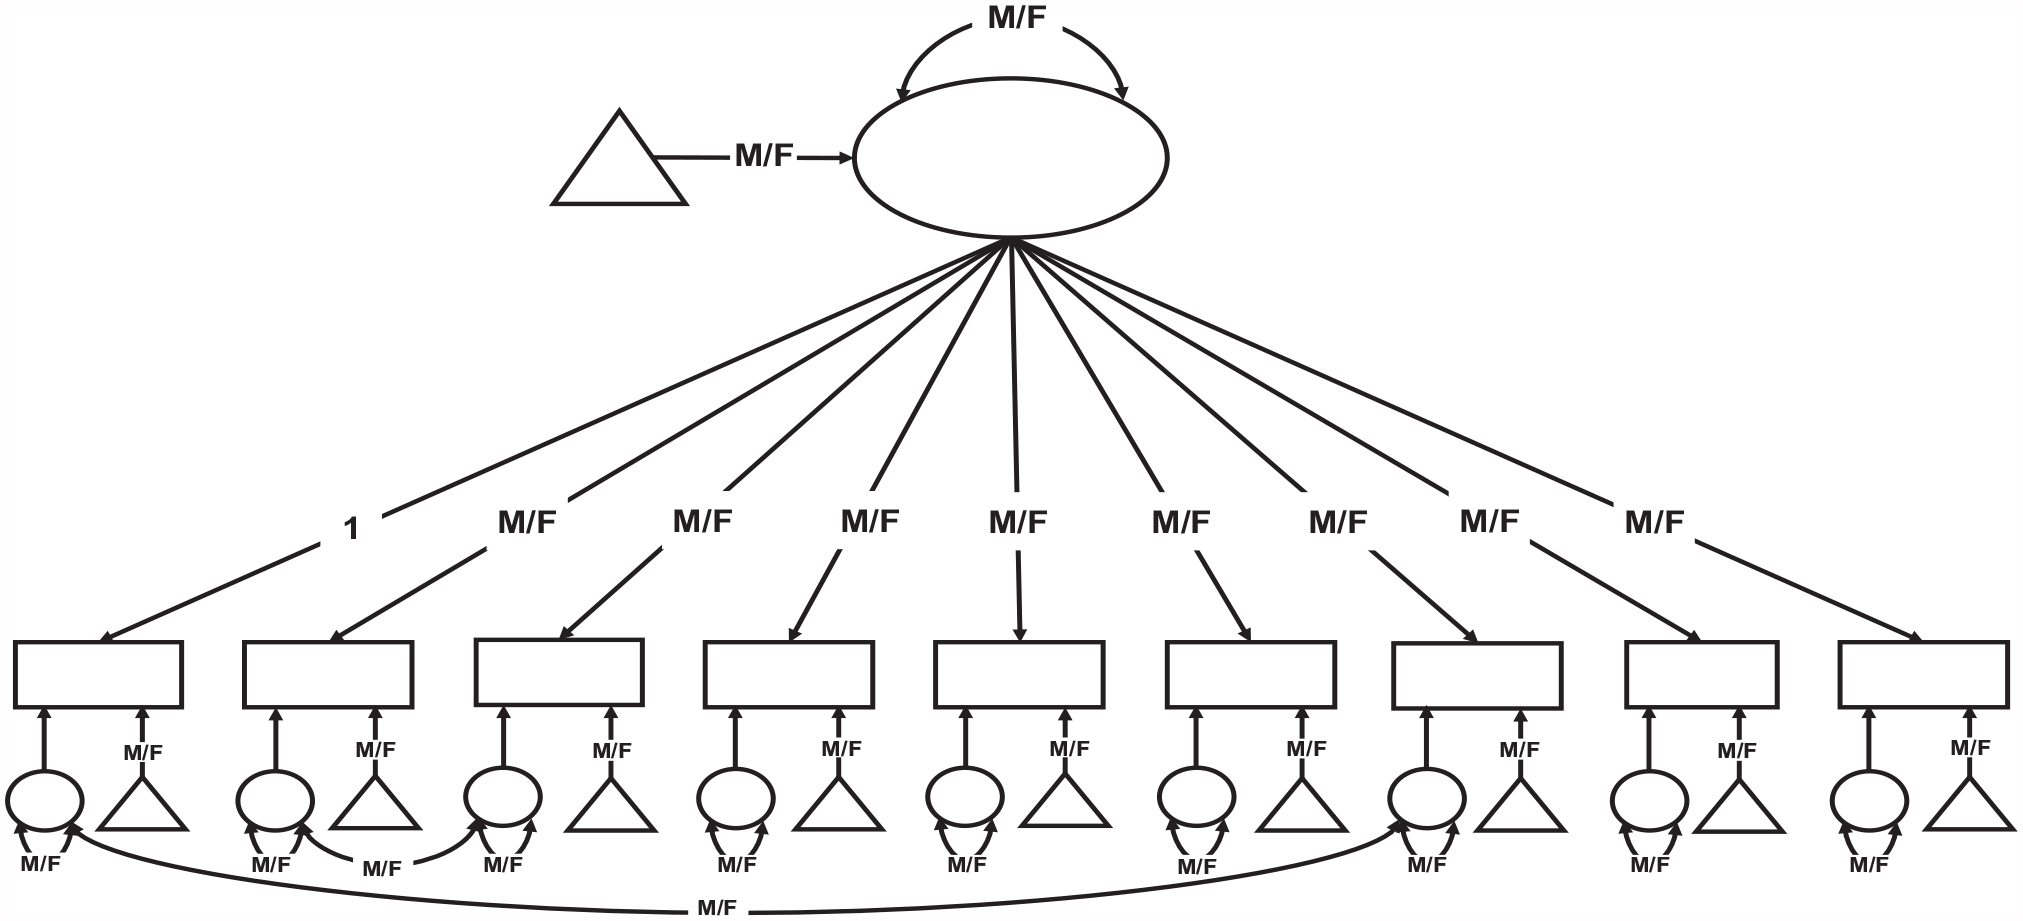
Configural Model for Gender Invariance Analyses. Figure shows the configural model for the gender invariance analyses fit to the data at ages 20 and 24 separately. The parameters labeled “M/F” were allowed to vary across male and female groups and the loading of the first item was fixed to 1 in both groups. Constraints were successively added to this model to test measurement invariance at the metric, scalar, and residual levels.
Using this model as the basis for the configural model, measurement invariance across time/informant was tested. Model fit statistics for each model in the series is provided in Table 5. These also indicate which constraint was freed at each stage. The configural model showed acceptable fit according to conventional standards (CFI = .932, TLI = .922, RMSEA = .037, SRMR = .066) and configural invariance was therefore judged to hold. The addition of metric invariance constraints led to deterioration in fit greater than Chen’s (2007) criteria (ΔCFI = −.011, ΔRMSEA = .003, ΔSRMR = .050). It was necessary to iteratively release four loading constraints until partial metric invariance could be achieved (ΔCFI = −.010 ΔRMSEA = .003, ΔSRMR = .047). The addition of scalar invariance constraints to this model again resulted in a deterioration in fit in excess of Chen’s (2007) criteria (ΔCFI = −.026, ΔRMSEA = .006, ΔSRMR = −.004). Partial scalar invariance was achieved with the iterative release of the intercept constraints on seven items (ΔCFI = −.008, ΔRMSEA = .002, ΔSRMR = −.003). The partial scalar model parameters resulting from the process of constraint release are provided in Supplementary Table S4.
Fit Statistics for Measurement Invariance Analyses Across Time/Informants.
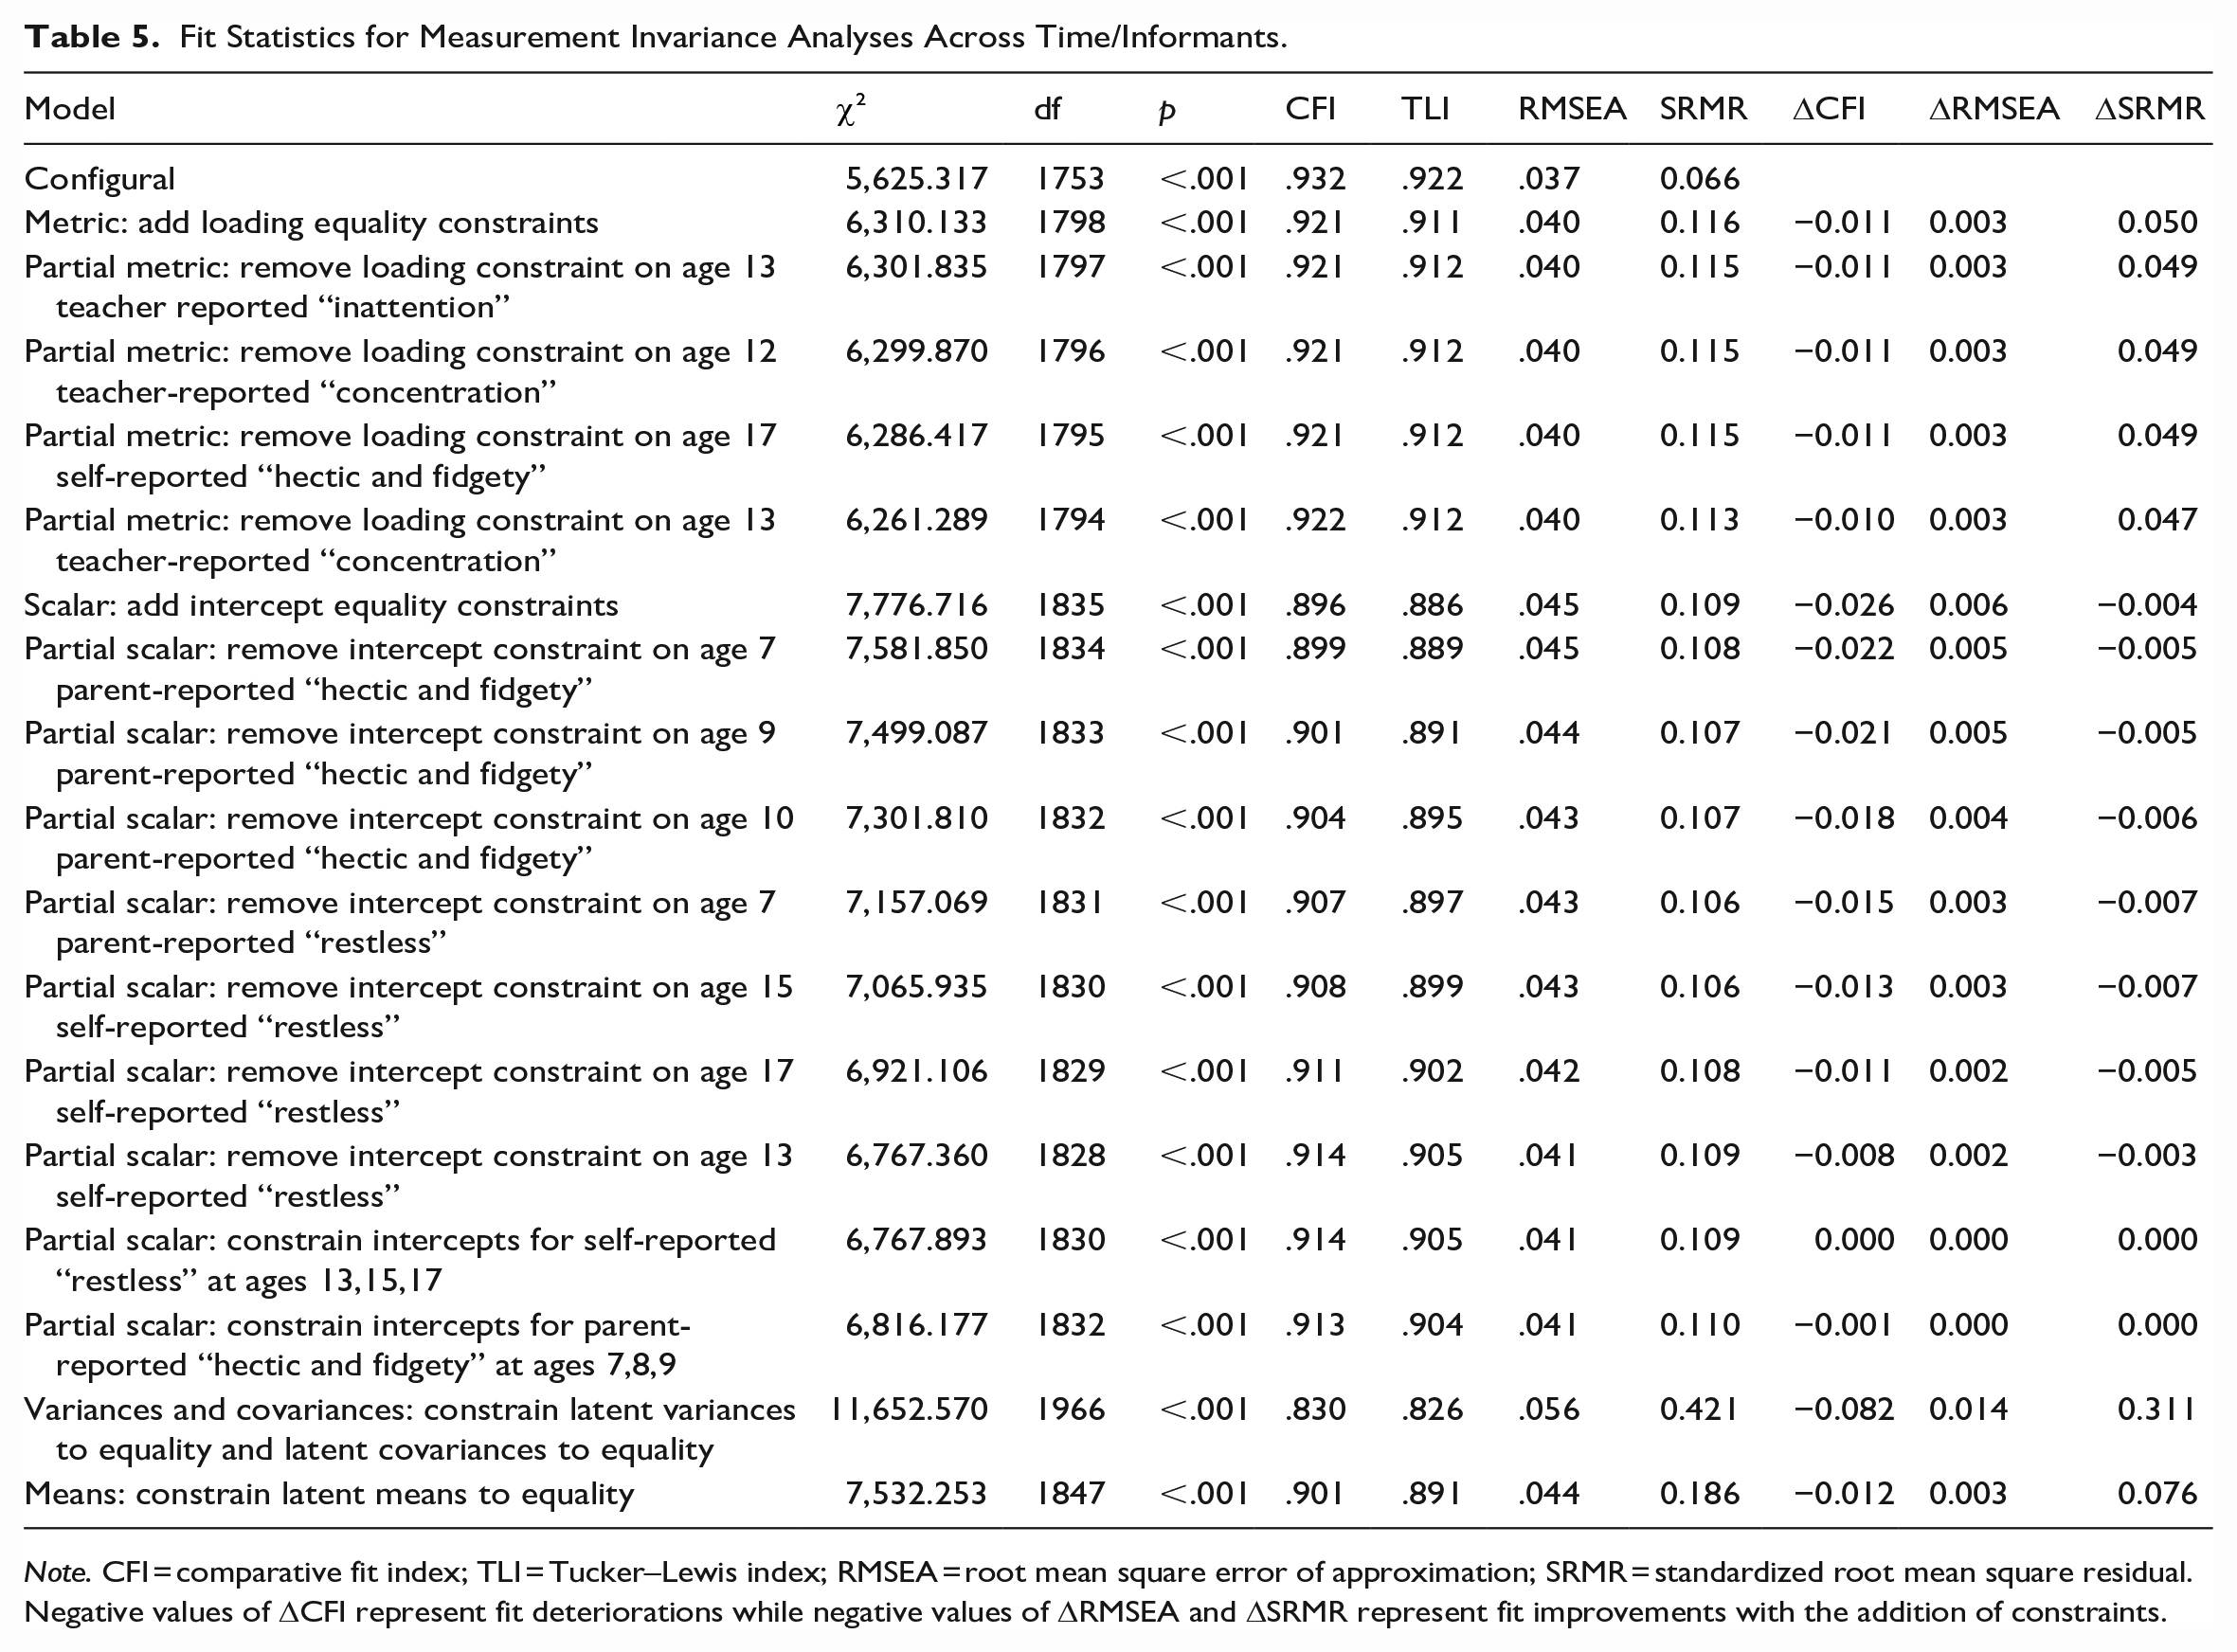
Note. CFI = comparative fit index; TLI = Tucker–Lewis index; RMSEA = root mean square error of approximation; SRMR = standardized root mean square residual. Negative values of ΔCFI represent fit deteriorations while negative values of ΔRMSEA and ΔSRMR represent fit improvements with the addition of constraints.
Despite the need to release a large number of constraints, previous simulation studies based on population models similar to our empirical model have provided evidence suggesting that largely unbiased latent mean comparisons may still be possible under such partial invariance models (Pokropek et al., 2019). Although partial scalar invariance could be achieved, we did not proceed to add residual invariance constraints because of the large number of constraints that had already been released to achieve invariance at this stage. Within a latent variable model, residual invariance is not required to compare latent means and variance over informants/time; partial scalar invariance is sufficient for the former and partial metric for the latter.
Additional Invariance Analyses
We conducted a series of additional invariance analyses to explore whether a more parsimonious model could be regained, while also providing further insights into developmental and informant differences/similarities in item functioning. We examined the model parameters from the partial scalar model presented in Supplementary Table S4 to identify any clusters of parameters that were similar in magnitude and for which there would be theoretical or methodological justification for imposing equivalence constraints.
First, we explored whether the intercepts for the self-reported “restless” item could be constrained to equality across ages 13, 15, and 17. This is justified on the grounds that these items pertain to the same informant and developmental period (adolescence) and they showed a similar parameter magnitude when freely estimated (Supplementary Table S4). Second, we examined whether the intercepts of the parent-reported “hectic and fidgety” item across ages 7, 8, and 9 could be constrained to equality, with an analogous justification. As the fit statistics for these two models in Table 5 show, it was possible to impose these constraints without any substantial deterioration in fit. The parameters for this model are provided in Supplementary Table S5. The estimated patterns of latent means (Supplementary Table S5) suggested that the lowest symptom levels were reported by parents at age 7 and the highest levels tended to be reported in adolescence and adulthood by young people themselves. The latent variances suggested that self-reports in adolescence and adulthood tended to show lower individual differences than teacher reports in childhood and adolescence (parent reports in childhood were intermediate between the two). The correlations between the latent constructs from this model are provided in Supplementary Table S6. These were generally highest within informants and over adjacent waves.
Based on adopting this model as the final model, we then tested the equality of latent means, variances, and covariances across informant/time. We imposed variance/covariance invariance first with latent variances equal across time and informant accompanied by latent covariances equal across time and informant. This led to a substantial deterioration in fit (Table 5). This is not surprising given that the covariances within informants and across more similar time lags are likely to be more similar to each other. We then imposed mean invariance on a model with latent variances and covariances free to vary across time/informant. This led to a smaller but still substantial deterioration in fit, implying a lack of equality of latent means across informants/time.
Discussion
In the current study, we evaluated the SBQ-ADHD as a brief measure of ADHD symptoms in adulthood that can be validly compared in its scores from school entry age to adulthood. We thus examined both the extent to which the scale yields valid and reliable scores when administered in adulthood and the extent to which it evidences measurement invariance across ages/informants. Data gathered at ages 20 and 24 suggested a unidimensional structure for the scale (with two residual covariances to account for excess covariation between two sets of symptoms), high internal consistency reliability overall and in each gender subsample, criterion validity, and gender measurement invariance up to the residual level for age 20 and partial residual level for age 24. Developmental/informant invariance analysis suggested that a number of items were non-invariant at certain ages and/or for certain informants; however, means and variance comparisons may be supported within a partial measurement invariance model.
The patterns of non-invariant items provide some insights into the challenges and implications of measuring ADHD symptoms across development and informants. Loadings tended to be non-invariant particularly around the transition to adolescence, with stronger loadings for the concentration and inattention items at age 11 and 12, respectively, by teacher report and a slightly stronger loading for the restless item at age 17 by self-report compared to other ages/informant reports. Adolescence is well known to be a critical period of development both in general and with respect to ADHD symptoms (Murray, Booth, Eisner, Auyeung, et al., 2019; Murray, Hall, et al., 2021; Murray, Ushakova, et al., 2021), and it is likely that ADHD symptoms could take on a different meaning at this time. For example, there is a normative increase in behaviors that are characteristic of ADHD, such as sensation-seeking, emotional regulation issues, and impulsive behavior among young people in general in the transition to adolescence (Murray, Zhu, et al., 2021; Shulman et al., 2016; Steinberg et al., 2008). The particular pattern we observed in this study may relate to the impact of increased academic demands and the fact that teachers as informants may be well placed to observe these.
The “hectic and fidgety” and “restless” items most frequently appeared among the parameters flagged for intercept constraint release. The intercept was higher for the “restless” item in adolescence by self-report and the intercept for the “hectic and fidgety” item was higher in childhood by parent report These differences imply that these symptoms may be poor candidates for developmentally invariant items, which may reflect the fact that hyperactive behaviors such as fidgeting tend to become less overt over development, making them less informative markers. Similarly, physical restlessness may come to be replaced with a restless cognitive-affective internal state later in development. However, it should be noted that the “hectic and fidgety” item also fails to follow best practices in item construction in being double-barreled (Lietz, 2010) and the fact that it refers to multiple separate markers (hectic, fidgety) may compound loading variations across development and informants. Future revisions of the scale could potentially replace this item with an item that may show better developmental invariance. An immediate suggested improvement and our recommendation would be to replace this item with the simpler item “fidgety.” Other options that could be explored might include descriptors that could encompass either internalized or externalized hyperactivity, such as “antsy,” or behaviors such as “excessive talking” that may not show such strong developmental shifts as physically hyperactive behaviors.
Finally, based on the latent factor variances, self-reports in adolescence and adulthood tended to show smaller individual differences than teacher reports in childhood and adolescence (parent reports in childhood were intermediate between the two). This may reflect the different reference frames of these informants. Teachers, for example, are likely to observe the behaviors of a wide range of children and adolescents over their years of teaching, whereas adolescents may implicitly primarily compare themselves to others of a similar age and background. Young people also tended to self-report the highest level of ADHD symptoms and teachers the lowest (with parents again intermediate between the two). This may reflect that young people observe themselves across all contexts and have privileged access to their internal states meaning that they can report on behaviors/symptoms that other informants may not observe. However, reference frames could also play a role in this if informants are making implicit comparisons to different underlying populations.
Taken together, our invariance findings highlight the considerable challenge of achieving developmentally invariant items from childhood to adulthood. They suggest that differences in the measurement of ADHD symptoms across development are liable to arise and imply that longitudinal studies modeling symptom development from childhood to adulthood should do so within the context of an appropriate latent measurement model that takes account of non-invariance. Although there are a large number of studies examining longitudinal symptom trajectories of ADHD symptoms (e.g., Caye et al., 2016), the testing of longitudinal invariance and modeling of any non-invariance identified is not common practice. Only a handful of studies have previously examined longitudinal invariance in ADHD measures over development. While these have generally supported longitudinal or age group invariance, this has typically been for a more limited developmental span (Murray, Obsuth, et al., 2019; Murray, Speyer, et al., 2021) or based on a comparison of age groups rather than tracking the same individuals over time (Dobrean et al., 2021). It is also rare to consider developmental invariance in the development and validation of measures. However, for areas such as ADHD symptoms, which can show substantial developmental change and heterogeneity of change across individuals, it is important for this to be considered in measure development.
Considering the measurement of ADHD symptoms in adulthood, the full nine-item SBQ-ADHD (which includes the four core items assessed across informant and age) showed favorable psychometric properties when administered at ages 20 and 24. This adds to the previous evidence for the reliability and validity of its scores in childhood and adolescence (Murray, Booth, Eisner, Ribeaud, et al., 2019; Murray, Eisner & Ribeaud, 2017; Murray, Eisner, Obsuth, & Ribeaud, 2017), suggesting that it could provide brief valid and reliable dimensional measures of ADHD symptoms, with a core set of items that can be anchored in such a way as to be comparable with earlier developmental stages. As discussed above, not all items need to be invariant across all developmental stages to permit valid developmental analyses and some variation across developmental stage can be considered a positive as it suggests the scale is sensitive to developmental changes (Little, 2013; Pokropek et al., 2019). The brevity of the SBQ-ADHD is a particular advantage for collecting ADHD symptom data in large-scale studies, including studies that may not have a specific focus in ADHD but that wish to include brief measures of symptoms. Given the increasing recognition that ADHD symptoms can be present and impact functioning in a wide variety of ways in adulthood, there may be increased demand for brief measures of adult ADHD symptoms in the near future.
Limitations
Although the current study provides evidence for favorable psychometric properties for the SBQ-ADHD items, further validation will be required, in particular, against gold standard measures of ADHD symptoms in adulthood and across different country and cultural settings. We also did not have separate calibration and validation samples in which to develop and then test the factor structure for the SBQ; therefore, validation of the factor structure in independent datasets would be very valuable. This is particularly pertinent to the issue of adding a residual covariance between two items and it will be important to assess if the need to do so replicates in other samples. Future studies may also wish to deal with this residual covariance in alternative ways, such as through item parceling.
In terms of missing data, we used FIML estimation, which provides unbiased parameter estimates under the assumption of MAR (Rubin, 1976). The MAR assumption is more likely to be met when suitable auxiliary variables are included in the model; however, we encountered practical difficulties with this. For example, gender—which was one of a handful of the relatively complete variables in the dataset that is known to be related to ADHD—could not be included as an auxiliary variable due to the need for such variables to have a continuous measurement scale. While this would not have been an issue where it included in the main model as a predictor, this would have altered the interpretation of the estimates by making them conditional on gender.
In terms of our measurement invariance analyses, though consistent with items having the same meaning across development/gender/informant, establishing invariance does not guarantee this. As such, further qualitative analyses will be helpful to illuminate possible differences in how different informants and self-reporters of different genders and ages understand the items. The validation of invariance across developmental stages will also need to be extended to cover later stages of adulthood. Given that young adults without ADHD may over-report symptoms, while young adults with ADHD may under-report symptoms, it will also be valuable to evaluate a parent-report version of the SBQ-ADHD for adulthood (Sibley et al., 2012). It is also important to note that given that the SBQ-ADHD is not designed to be a screening or diagnostic measure, but to provide a continuous measure of ADHD symptom levels, it does not measure associated functional impairment (see, for example, Canu et al., 2020, for a discussion of the measurement of functional impairment). Finally, though not specific to the SBQ-ADHD, another general challenge associated with measuring ADHD is overlap between ADHD symptoms and domains of mental health issues such as anxiety and depression (American Psychiatric Association, 2013). This makes it challenging to achieve adequate coverage of relevant symptoms of ADHD while also ensuring specificity.
Conclusion
The nine-item SBQ-ADHD scale showed favorable psychometric properties when administered to a normative sample at ages 20 and 24, including a high level of gender measurement invariance. This suggests that it can be used to obtain valid and reliable ADHD symptom scores in adult community-ascertained samples. A four-item SBQ-ADHD core item set showed evidence of non-invariance across informants/ages when tested across ages 7–24 in self-, teacher-, and parent-informant reports, especially an item referring to “hectic and fidgety” behavior. This highlights the need to test and model measurement non-invariance in developmental studies of ADHD symptoms. The SBQ-ADHD set could be used in childhood-to-adulthood developmental studies of ADHD provided that developmental trajectories are modeled within a suitable latent variable partial measurement invariance model.
Supplemental Material
sj-docx-1-jbd-10.1177_01650254241268865 – Supplemental material for Psychometric evaluation of a brief measure to capture general population-level variation in ADHD symptoms from childhood through the transition to adulthood
Supplemental material, sj-docx-1-jbd-10.1177_01650254241268865 for Psychometric evaluation of a brief measure to capture general population-level variation in ADHD symptoms from childhood through the transition to adulthood by Aja Louise Murray, Josiah King, Zhuoni Xiao, Denis Ribeaud and Manuel Eisner in International Journal of Behavioral Development
Footnotes
Acknowledgements
We are grateful to the research assistants and participants of the z-proso study.
Declaration of Conflicting Interests
The author(s) declared no potential conflicts of interest with respect to the research, authorship, and/or publication of this article.
Funding
The author(s) disclosed receipt of the following financial support for the research, authorship, and/or publication of this article: Funding from the Swiss National Science Foundation (Grants 405240-69025, 100013_116829, 100014_132124, 100014_149979, 100014_149979, 10FI14_170409/1, 10FI14_170409/2, 10FI14_198052/1), the Jacobs Foundation (Grants 2007-720, 2010-888, 2013-1081-1), the Jacobs Center for Productive Youth Development, the Swiss Federal Office of Public Health (Grants 2.001391, 8.000665), the Canton of Zurich’s Department of Education, the Swiss Federal Commission on Migration (Grants 03-901 (IMES), E-05-1076), the Julius Baer Foundation, and the Visana Foundation is gratefully acknowledged. The research described within this report was additionally supported by a Medical Research Foundation (MRF) grant (Reference: MRF-001-0014-RG-MURR-C0932).
Supplemental Material
Supplemental material for this article is available online.
References
Supplementary Material
Please find the following supplemental material available below.
For Open Access articles published under a Creative Commons License, all supplemental material carries the same license as the article it is associated with.
For non-Open Access articles published, all supplemental material carries a non-exclusive license, and permission requests for re-use of supplemental material or any part of supplemental material shall be sent directly to the copyright owner as specified in the copyright notice associated with the article.