
Abstract
Callous-unemotional (CU) traits predict behavioral problems in adolescence. But little is known about early modulatory factors. Behavioral Inhibition (BI) in particular has been suggested to protect against the development of CU-traits. This temperamental predisposition is characterized by heightened environmental sensitivity. The current prospective longitudinal study examined whether BI at 15 months of age predicted lower CU-traits across development to age 21. A longitudinal sample of normatively developing children (n = 125) was used. BI was assessed at 15 months using a standard stranger/robot paradigm. CU-traits were assessed at 2, 5, 9, 12, 14, 17, and 21 years with parent, teacher, and self-reports. Developmental pathways across all available data points were examined using Bayesian mixed models and k-means cluster analysis. Infant BI predicted lower CU-traits across development for girls, suggesting that BI buffers the long-term development of CU-traits for girls. CU-traits peaked in early adulthood. Boys scored higher and showed higher increases in CU-traits than girls from childhood onward. There was no gender difference regarding infant BI. Together, the findings demonstrated gender differences in the development of CU-traits, with a protective role of BI for girls. These results shed new light on the developmental trajectories and protective factors of CU-traits and provide starting points for interventions aiming at increasing children’s responsiveness to external cues to prevent antisocial traits and conduct problems.
Keywords
Callous-unemotional (CU) traits are defined by restricted feelings of empathy, remorse and guilt, shallow affective expressions, as well as indifference toward accomplishments in school and relationships. Although CU-traits are normally distributed in the population, they are highly related to conduct problems and pose a risk for antisocial personality disorder later in life (see, for a comprehensive review, Frick et al., 2014a, 2014b). However, the normative development of CU-traits and its contributing factors are not yet well understood. It has been suggested that infant Behavioral Inhibition (BI) and its associated heightened sensitivity to environmental cues may buffer the development of CU-traits (Barker et al., 2011; Glenn et al., 2007; Goffin et al., 2018; Hirshfeld-Becker, Biederman, Henin, Faraone, Davis, et al., 2007; Hirshfeld-Becker, Biederman, Henin, Faraone, Micco, et al., 2007), but direct evidence from prospective longitudinal studies is lacking. Therefore, we investigated whether BI at 15 months predicted lower levels of CU-traits in a normative sample across development until 21 years of age.
CU-traits generally are considered a stable construct (see, for reviews, Frick et al., 2014a, 2014b). For example, many studies showed significant positive correlations between assessments of CU-traits across toddlerhood (Hawes & Dadds, 2007; Waller et al., 2012; Willoughby et al., 2011), across childhood and adolescence (Barker & Salekin, 2012; Barry et al., 2008; Munoz & Frick, 2007; Obradović et al., 2007; Pardini et al., 2007; van Baardewijk et al., 2011), as well as from adolescence into early adulthood (Blonigen et al., 2006; Forsman et al., 2008; Lynam et al., 2007). Other studies have shown distinct developmental trajectories marked by stable high, stable low, increasing, or decreasing levels of CU-traits in childhood (Fontaine et al., 2018, 2010; Klingzell et al., 2016), and from childhood into adolescence (Hawes et al., 2018). A peak in CU-traits has been considered a normal part of puberty (Essau et al., 2006; Lynam et al., 2009). These differential findings with respect to the stability of CU-traits might be explained by methodological differences, such as different statistical approaches and different informants of CU-traits (i.e., parent-, teacher- and self-reports). Given that CU-traits have shown to predict persistent antisocial behavior in both healthy children and children at-risk (MacMahon et al., 2010), it is crucial to understand the normative development of CU-traits and mechanisms contributing to deviant trajectories.
Despite the increased interest in CU-traits, little is known about the role of early temperament in the development of CU-traits (see, for reviews, Glenn, 2019; Ribeiro da Silva et al., 2020; Salekin, 2017; Viding & McCrory, 2018). The existing empirical evidence mainly points toward the significant contributions of biological factors, such as stress reactivity and genetics, and environmental factors, such as parenting behavior and early trauma, in the development of CU-traits (Glenn, 2019; Ribeiro da Silva et al., 2020; Salekin, 2017; Viding & McCrory, 2018). Temperament, in turn, has been central in theoretical models aiming to explain misconduct, but has been less subject to empirical testing. Various theories of temperament (such as Asendorpf, 1989, 1990; Buss & Plomin, 1984; Goldsmith & Campos, 1986; Rothbart, 1989; Thomas & Chess, 1977) state that the development of conscience in early childhood can be hampered by a fearless and disinhibited temperament, which eventually leads to rule transgressions and aggressive behavior (for a review of these theories see Kochanska, 1993). Frick and Ellis (1999) inferred that a fearless and disinhibited temperament can likewise drive the development of CU-traits. The scarce prospective longitudinal research supports the crucial role of difficult temperament in the development of conscience and externalizing problems (Kim & Kochanska, 2021; Kochanska, 1997, 2002; Kochanska et al., 2008, 2010). Physiological indices of emotional responding in toddlers who scored high on CU-traits later in life indicated hyperactivity (e.g., Mills-Koonce et al., 2015; Willoughby et al., 2014). In turn, behavioral assessments of emotional responding showed that fearless and disinhibited temperament either alone or as a moderator predicted CU-traits and externalizing disorders (Barker et al., 2011; Goffin et al., 2018; Hirshfeld-Becker, Biederman, Henin, Faraone, Micco, et al., 2007). Therefore, a more fearful and inhibited temperament might serve as a buffer for the development of CU-traits.
BI is a reliable, well-established temperamental predisposition, which might be inversely related to the development of CU-traits. BI is defined by fearful reactions and avoidance tendencies toward unfamiliar stimuli, situations, and people (Kagan et al., 1984), related to a hyperactive physiological stress system and predictive of social anxiety disorder (Clauss & Blackford, 2012; Fox et al., 2005; Spence & Rapee, 2016). Research on constructs closely related to either BI or CU-traits suggest that BI could also have a buffering role in the development of CU-traits (Barker et al., 2011; Glenn et al., 2007; Goffin et al., 2018; Hirshfeld-Becker, Biederman, Henin, Faraone, Davis, et al., 2007; Hirshfeld-Becker, Biederman, Henin, Faraone, Micco, et al., 2007). For example, Glenn and colleagues (2007) showed that fearful and inhibited temperament at age 3 was related to lower self-reported psychopathic traits at 28 years. However, to test whether BI can actually buffer the long-term development of CU-traits, prospective research on the developmental trajectories of CU-traits across childhood, adolescence, and early adulthood is needed.
Therefore, the goal of this study was to examine whether BI, early in life, predicted lower CU-traits across development until 21 years of age. BI was assessed at 15 months in terms of observer ratings during a lab visit. CU-traits were measured based on age-appropriate parent-, teacher- and self-reports at ages 2, 5, 9, 12, 14, 17, and 21 years, which were combined whenever possible to receive the most valid assessment (as recommended by Docherty et al., 2017). We expected that a higher BI would predict low CU-traits across development (e.g., Glenn et al., 2007; Kochanska, 1993). In addition, we contrasted two predominant hypotheses about the normative development of CU-traits, namely, of a normative peak in adolescence (e.g., Lynam et al., 2009) versus the notion of four developmental pathways (i.e., stable high, stable low, increasing, or decreasing; see, for example, Hawes et al., 2018). Because BI is usually more pronounced in girls (Kagan et al., 1988) and CU-traits in boys (Frick et al., 2014b), we controlled for gender (without a specific hypothesis). We tested our hypotheses in a prospective longitudinal study, in which we related BI in infancy to assessments of CU-traits across childhood and adolescence.
Method
Participants
This study was part of the Nijmegen Longitudinal Study (NLS), which began in 1998 in a community sample of 129 children (62 girls) and their primary caregivers. Participants were recruited via healthcare centers in the Netherlands, when the children were 15 months of age and were invited for further testing regularly thereafter (for more information on the recruitment procedure, see van Bakel & Riksen-Walraven, 2002). In the initial sample, 94% of mothers (n = 121) and 92% of fathers (n = 118) had a Dutch nationality. The primary caregiver (126 women) was on average 33 years old (SD = 4, range = 22–47) and had on average 16 years of education (range 8–18) ranging from low (primary school) to high (university degree). For this study, we used data collected at 15 months (n = 125), 28 months (referred to as “2 years” in the following, n = 112), 5 (n = 115), 9 (n = 116), 12 (n = 114), 14 (n = 84), 17 (n = 103), and 21 (n = 95) years of age. Ethical approval was obtained from the Committee on Research Involving Human Subjects of region Arnhem-Nijmegen for the data collections at age 14 (protocol CMO758.091.10/approval nr: 2010/420), at age 17 (protocol NL49289.091.14/approval nr: 2014/104) and at age 21 (protocol CMO2014/288/Ethics Committee Social Sciences of Radboud University [ECSW-2018-003/2OU.007316]). Earlier waves were conducted in accordance with the ethical guidelines (regulations at that time did not require official ethical approval). Participants and/or their parents gave informed consent to participate at each wave. Table 1 shows the sample characteristics and measurements used.
Items Measuring Callous-Unemotional Traits Across Questionnaire, Informant, and Age.
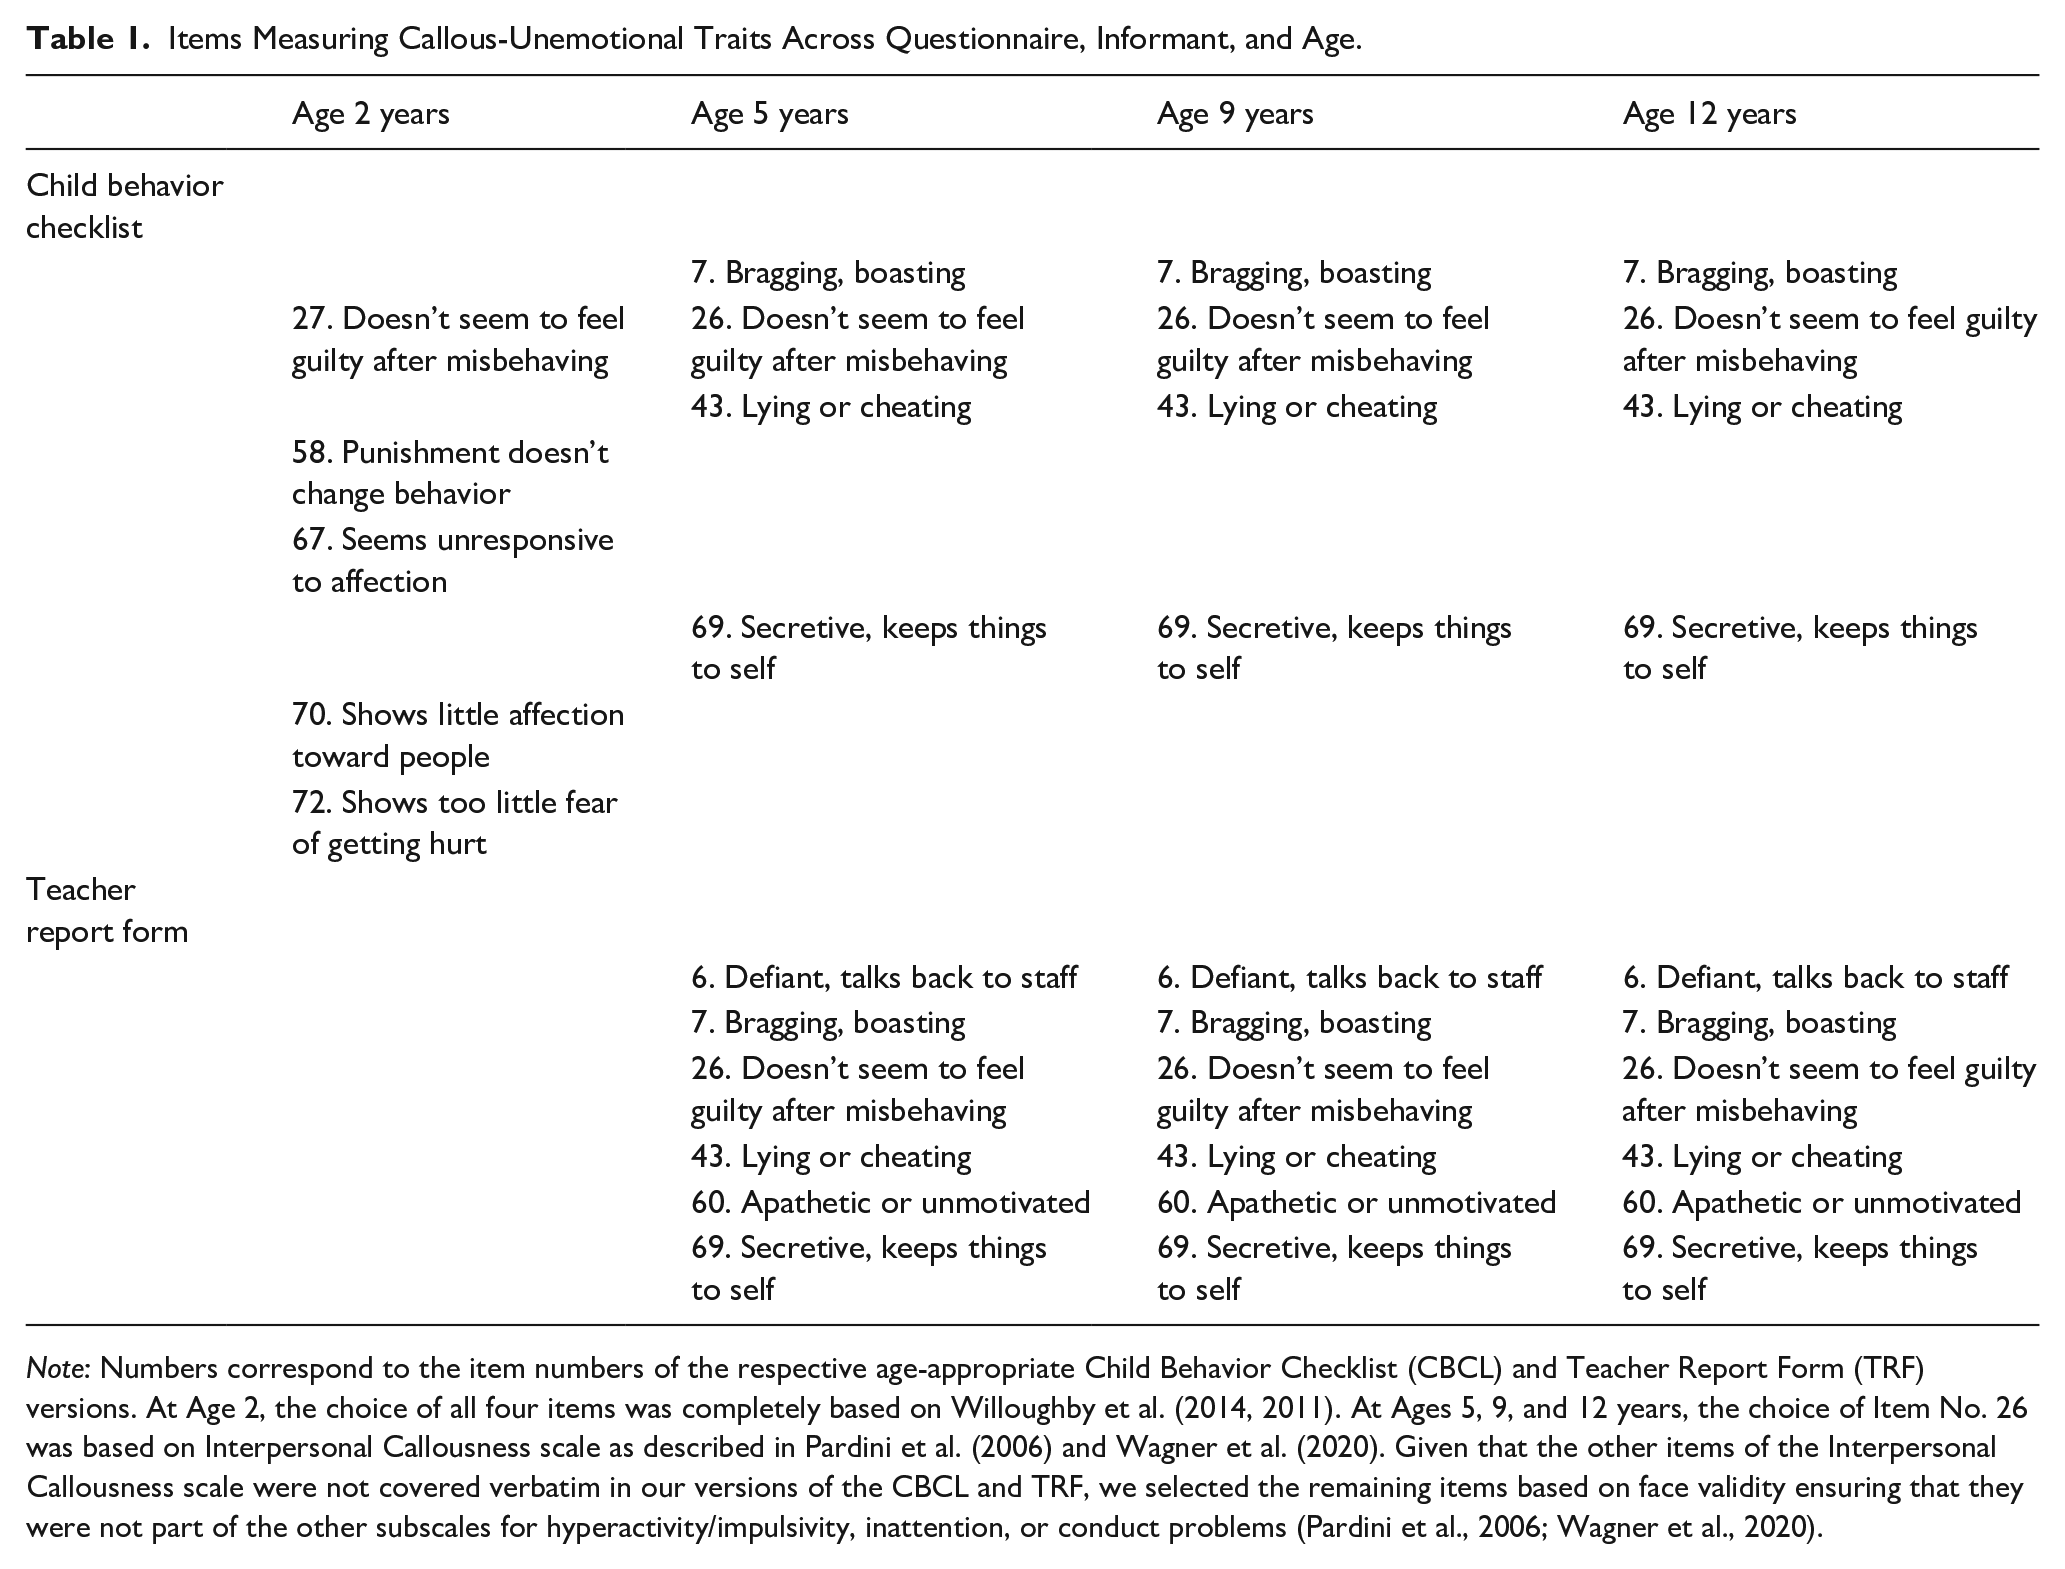
Note: Numbers correspond to the item numbers of the respective age-appropriate Child Behavior Checklist (CBCL) and Teacher Report Form (TRF) versions. At Age 2, the choice of all four items was completely based on Willoughby et al. (2014, 2011). At Ages 5, 9, and 12 years, the choice of Item No. 26 was based on Interpersonal Callousness scale as described in Pardini et al. (2006) and Wagner et al. (2020). Given that the other items of the Interpersonal Callousness scale were not covered verbatim in our versions of the CBCL and TRF, we selected the remaining items based on face validity ensuring that they were not part of the other subscales for hyperactivity/impulsivity, inattention, or conduct problems (Pardini et al., 2006; Wagner et al., 2020).
Procedures and Measures
Behavioral Inhibition (BI)
BI was assessed based on videotapes of the stranger/robot situation paradigm during the lab visit of mother and child at 15 months of age. The NLS used an adapted version of the stranger/robot situation (Mullen et al., 1993), which was originally included to measure the child’s cortisol reactivity. The stranger/robot paradigm took approximately 14 min in total, in which the child (1) engaged in free play (approximately 3 min), (2) encountered a female stranger (approximately 4 min), (3) was confronted with a moving robot (approximately 4 min), and (4) engaged in free play again (approximately 3 min). During the first free play session, the child was given age-appropriate toys and placed 1 m next to its primary caregiver, who was sitting on a chair, filling in questionnaires. After 3 min, a female research assistant (“stranger”) entered the room with a ladybird toy containing blocks. The stranger waited for 1 min at a distance of 0.3 m from the child, after which she initiated playful behavior with the child and the toys. After a total of 4 min, the stranger got a noisy mechanical robot (10 in. high) and placed it next to the child. The lights and sounds produced by the robot were controlled by another research assistant (“experimenter”) with a remote control, who was sitting behind a cabinet in the room. The stranger again tried to initiate playful behavior with the child and the robot. After a total of 4 min, the robot was turned off and put away. Before leaving the room, the stranger gave new age-appropriate toys to the child with which it was allowed to play for the remaining free play session of 3 min. The whole session was videotaped (van Bakel & Riksen-Walraven, 2004).
To measure BI, two trained observers independently rated the child’s behavior during both the stranger and the robot situation. That is, for both situations (1) the latency to the child’s first vocalization, (2) the latency to the child touching the toy (ladybird/blocks or robot, respectively), and (3) the total amount of time the child spent in close contact to the mother. If the difference between the ratings of the two observers was less than 5 s, they were averaged to one score. If the difference was larger than 5 s, a third rater made a decision. Inter-rater reliability was high for all ratings of the two situations (i.e., Intra Class Correlations above .9). The resulting six time specifications (i.e., first vocalization, touching the toy, and time spent close to mother, for the stranger situation and the robot situation, respectively) were divided by the total duration of the paradigm before they were standardized to z-scores within the sample and summed to one total score for BI (α = .61; Fox et al., 2001). BI could not be rated for five children because three of them did not participate in the lab session, one could not be seen on the videotape, and one did not move at all during the session.
Callous-Unemotional (CU) traits
CU-traits were assessed at 7 time points (2, 5, 9, 12, 14, 17, and 21 years). At each time point, age-appropriate measurements were filled in by parents, teachers, and/or children: the Child Behavior Checklist (2, 5, 9, and 12 years), the Teacher Report Form (5, 9, and 12 years) and the Inventory of Callous-Unemotional Traits (14, 17, and 21 years). The questionnaires used at ages 2, 5, 9, and 12 were not originally designed to measure CU-traits. The choice of items at these ages was based on previous research (Pardini et al., 2006; Wagner et al., 2020; Willoughby et al., 2014, 2011) and face validity. Further support for the final item selection stemmed from inter-rater reliabilities, internal consistencies, and test–retest reliabilities. An overview of the item selection at ages 2, 5, 9, and 12 is given in Table 1. See supplementary material for a summary of all psychometrical check-ups for the early item selection.
At each time point, all available reports of the different informants were combined as this has explicitly been recommended to increase the validity and reliability of CU-traits assessment (Docherty et al., 2017). For the analyses, proportions of maximum scaling (poms) scores were computed within time points. To do so, the difference between each participant’s score and the sample minimum was divided by the difference between the sample maximum and the sample minimum (range 0–1, see Little, 2013). This was done for each informant separately (i.e., parent, teacher, and child). Next, the separate reports were averaged to one score per time point. Poms scores are recommended for longitudinal research as they account for unequal numbers of items across reports and timepoints and thereby enable an unbiased comparison across timepoints (Moeller, 2015). Table 2 presents all raw scores and internal consistencies by age, questionnaire, and informant.
Descriptive Statistics of Behavioral Inhibition and Callous-Unemotional Traits by Age and Reporter.
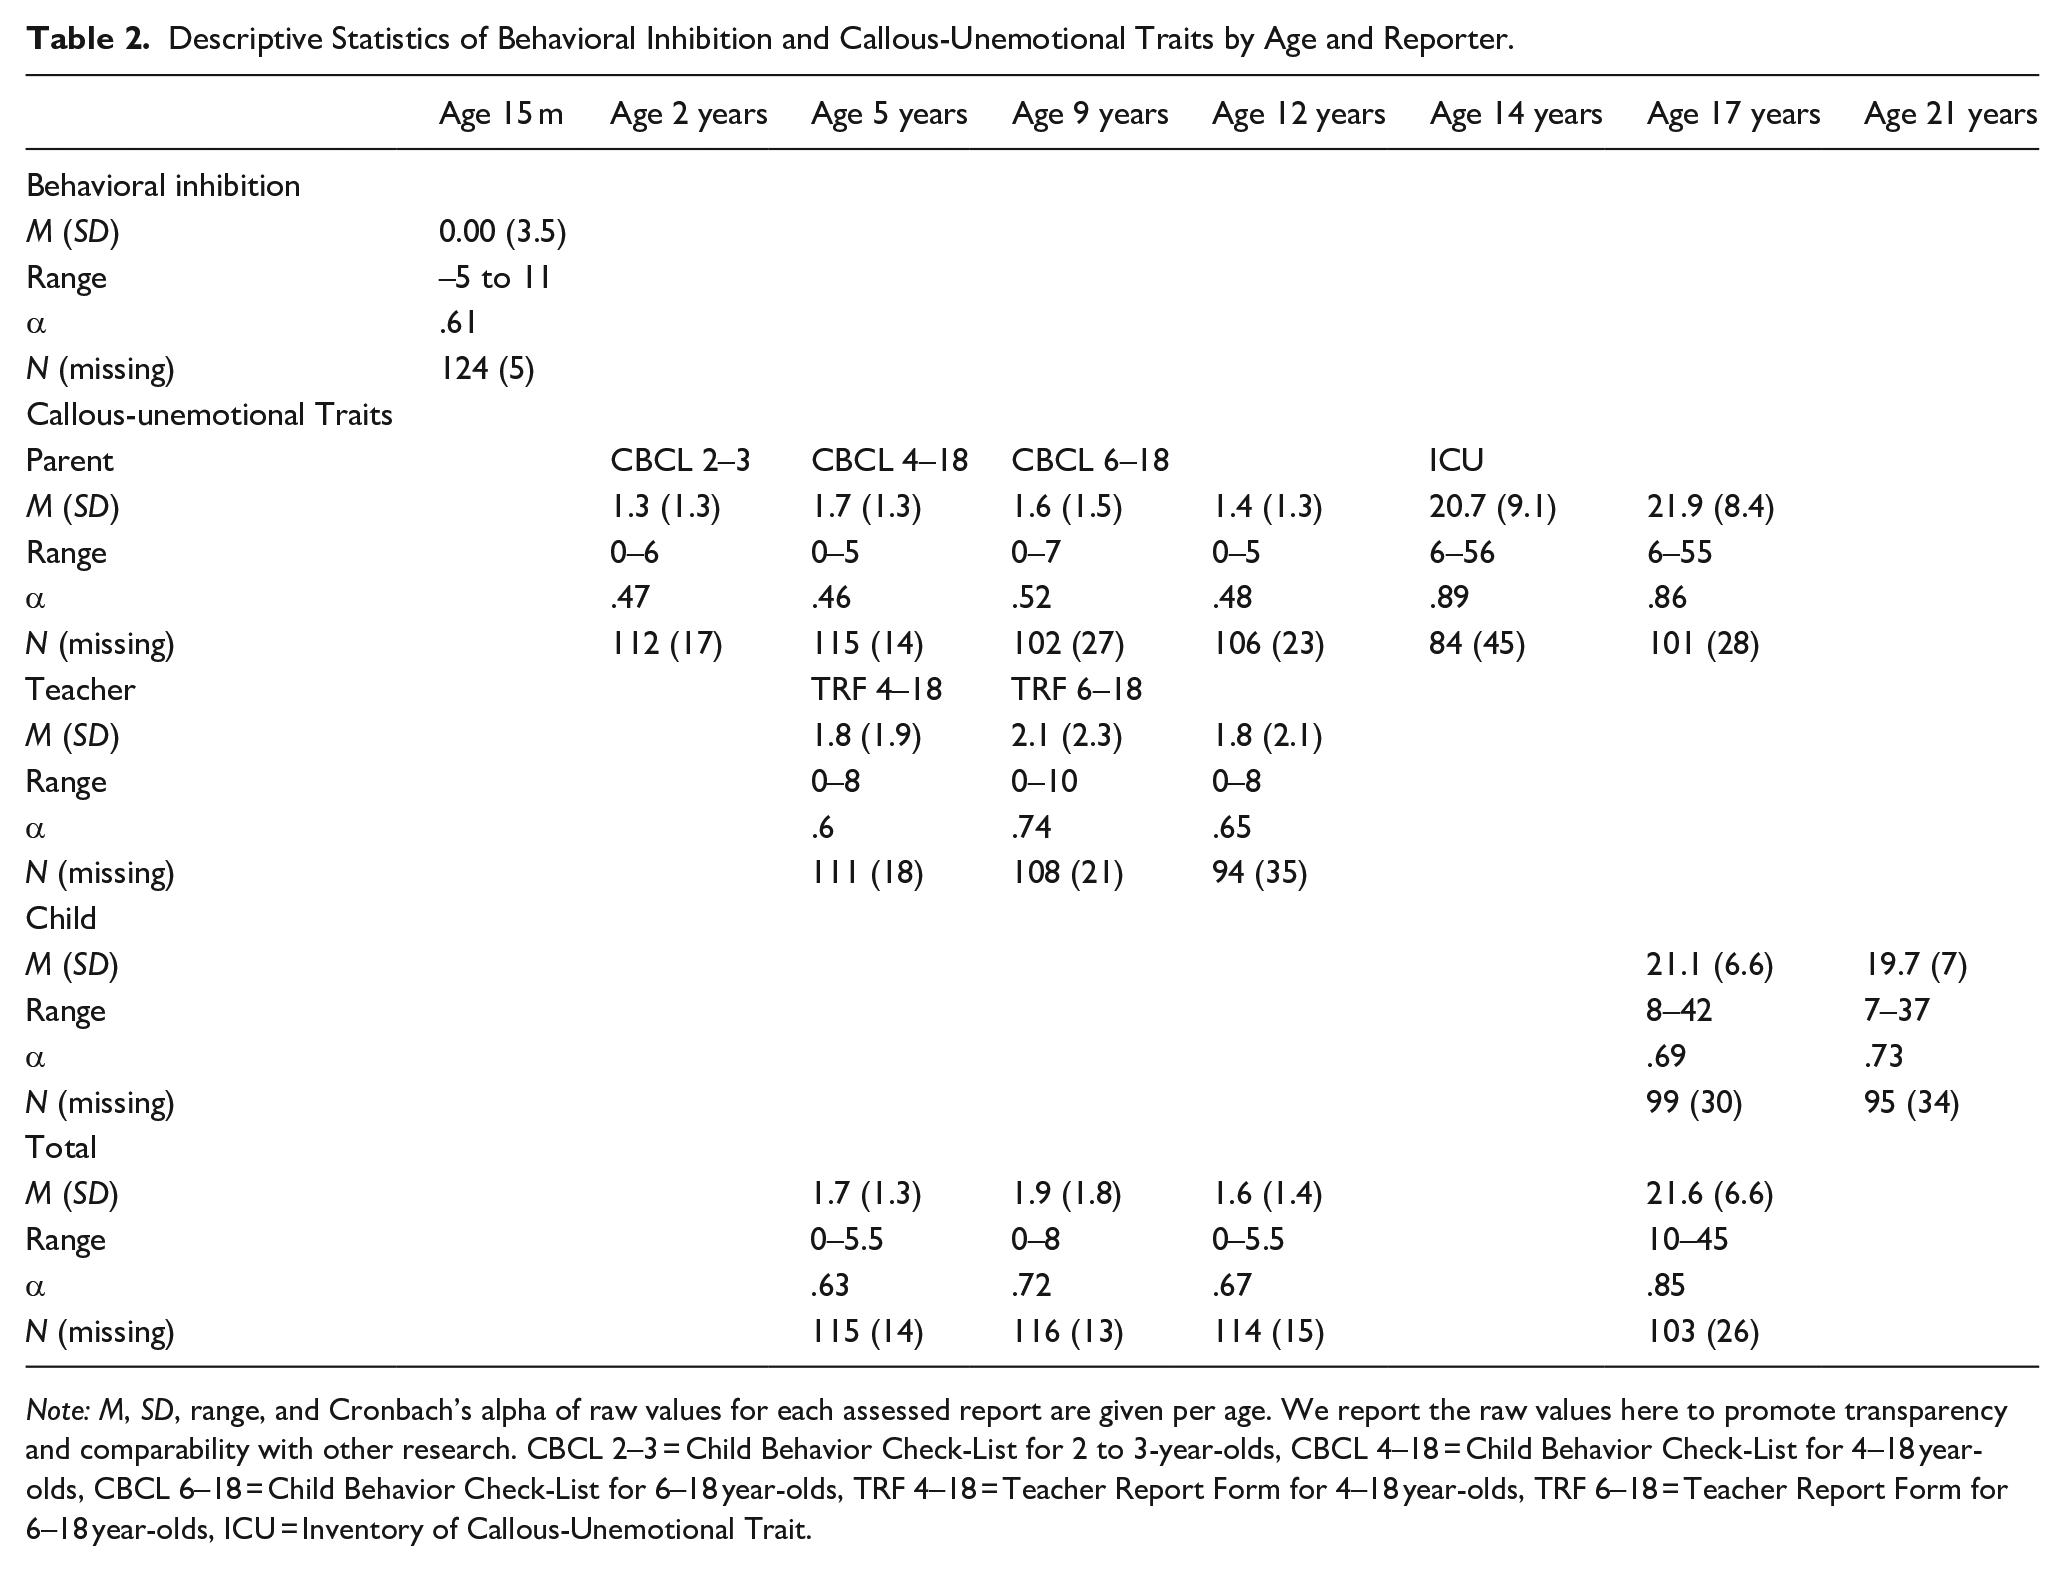
Note: M, SD, range, and Cronbach’s alpha of raw values for each assessed report are given per age. We report the raw values here to promote transparency and comparability with other research. CBCL 2–3 = Child Behavior Check-List for 2 to 3-year-olds, CBCL 4–18 = Child Behavior Check-List for 4–18 year-olds, CBCL 6–18 = Child Behavior Check-List for 6–18 year-olds, TRF 4–18 = Teacher Report Form for 4–18 year-olds, TRF 6–18 = Teacher Report Form for 6–18 year-olds, ICU = Inventory of Callous-Unemotional Trait.
CU-Traits at Age 2
At age 2, CU-traits were assessed based on 5 items of the Child Behavior Checklist for 2- to 3 year-olds (CBCL 2–3; Achenbach, 1991). Item selection was based on previous research, showing that these items reliably measure CU-traits in young children and can distinguish CU-traits from other externalizing behavior (Willoughby et al., 2014, 2011). On the CBCL 2–3, parents are asked to rate their child’s behavior in the past 2 months on a 3-point Likert-type scale ranging from 0 (not true) to 2 (very true or often true). Internal consistency at age 2 was low (α = .47).
CU-Traits at Ages 5, 9, and 12
At ages 5, 9, and 12, a proxy for CU-traits was calculated by combining 4 items of the Child Behavior Checklist for 4- to 18-year-olds (CBCL 4–18; Achenbach, 1991) or the Child Behavior Checklist for 6- to 18-year-olds (CBCL 6–18; Achenbach, 1991) with 6 items of the Teacher Report Form (TRF; Achenbach, 1991). Items were selected based on previous research that established separate CBCL and TRF scales for interpersonal callousness, hyperactivity/impulsivity, inattention, and conduct problems (Pardini et al., 2006; Wagner et al., 2020). One item of the interpersonal callousness subscale was covered verbatim in our versions of the CBCL and TRF, namely, “Doesn’t seem to feel guilty after misbehaving.” To ensure the measurement of callousness and not other constructs, the remaining items were not part of the scales for hyperactivity/impulsivity, inattention, or conduct problems (Pardini et al., 2006; Wagner et al., 2020). Face validity was established by selecting items that described unemotionality or uncaringness. Parent and teacher reports correlated significantly positively with each other, at age 5, r = .28, p < .001, age 9, r = .43, p < .001, and age 12, r = .28, p = .01, indicating inter-rater reliability. Internal consistencies of the composite scores at each age ranged from weak to acceptable (α ranging from .63 to .72). For the analyses, poms scores of the parent and teacher ratings were averaged into one CU-total score per child. If a child missed either parent or teacher report, the non-missing report was used (the same approach was used by Niermann et al., 2017, and suggested by Piacentini et al., 1992).
CU-Traits at Ages 14, 17, and 21
From age 14 onward, CU-traits were assessed with the Inventory of Callous-Unemotional Traits (ICU; Frick, 2004). The ICU consists of 24 items rated on a 4-point Likert-type scale from 0 (not at all true) to 3 (definitely true), and has three subscales: Callousness (e.g., “I do not care who I hurt to get what I want”), Uncaring (e.g., “I always try my best” reversed), and Unemotional (e.g., “I do not show my emotions to others.”). At age 14, only the parent report of ICU was included in the questionnaire battery at that time. For three participants, missing item scores were filled in by computing their mean item scores (one participant missed two items and two participants missed one item). At age 17, the poms scores from parent and child report were combined. One participant missed one self-report item for which the mean item score was filled in. If a child missed either parent or self-report, the non-missing report was used (Niermann et al., 2017; Piacentini et al., 1992). Parent and child reports correlated significantly positively with each other (r = .45, p < .001), supporting inter-rater reliability. At age 21, only self-reports were assessed. Internal consistencies of the ICU total scores ranged from acceptable to good (α ranging from .73 to .89).
Statistical Approach
Data processing and analyses were done in R (version 3.6.2; R Core Team, 2019) and RStudio (version 1.2.5033, RStudio Team, 2019). Bayesian linear mixed models were used to investigate whether BI predicted CU-traits. To address the hypotheses regarding the normative development of CU-traits (normative peak vs. four developmental pathways), we compared two models containing either predictors for both the normative peak and linear trajectories (full model) or the linear trajectories only (linear model). For these analyses, the function brm of the package brms (version 2.12.0; Bürkner, 2017, 2018) was used, which in turn employs the probabilistic programming language Stan (Carpenter et al., 2017). Brms allows for flexible model specifications, such as parameters at the population-level, parameters at the group level, and family specific parameters. The specified model is then fitted by Stan, which uses the algorithms Hamiltonian Monte Carlo (Duane et al., 1987; Neal, 2011) and the No-U-Turn Sampler (Hoffman & Gelman, 2014), facilitating the convergence of complex models.
In the full model, the fixed effects of age linear and age quadratic, as well as their interactions with BI were entered. The linear term for age was age as a standardized continuous predictor in the model. The quadratic term for age was created by squaring this variable. Gender was controlled by including it as a categorical predictor using sum-to-zero contrast coding. All underlying main effects and two-way interactions were included in the models. Random slopes for the linear and quadratic effects of age were specified, as well as a random intercept for each participant. For the linear model, everything was the same except that the quadratic predictor of age and all related interactions were not included. Models were run on all available data points, that is, 724 observations (participants across time points).
Models were run using the default priors, 5,000 iterations including 500 warm-ups and 8 chains. Rhat and diagnostic plots were examined to determine model convergence (indicated by Rhat values between .9 and 1.1; Bürkner, 2017, 2018). Different models using either Gaussian or student distributions were compared in terms of predictive accuracy to find the best fitting model. Predictive accuracy of the models was compared with the information criteria WAIC and loo (Vehtari et al., 2017). The model with the lowest WAIC and loo scores was accepted and interpreted. Statistical significance was inferred if the 95% posterior credible interval (CI) did not include zero (Somerville et al., 2019).
The normative development of CU-traits was further investigated by testing its stability over time, as well as distinct trajectories. The stability was tested with Pearson correlations between CU-traits across time points using the function corr.test of the package psych (version 1.8.12; Revelle, 2018). The hypothesized trajectories of CU-traits were examined with k-means cluster analysis using the function kml of the package kml (Genolini et al., 2015; Genolini & Falissard, 2011). In this approach, each participant is assigned to a cluster, after which the means of the clusters are computed and participants are reassigned to the closest mean. Mean computation of clusters and participant reassignment is repeated until a final cluster structure is found (i.e., no further changes occur). K-means cluster analysis has sufficient power if each cluster contains at least 20 participants (Dalmaijer et al., 2020). The main analyses of this project were preregistered in aspredicted.org (#44342; https://aspredicted.org/blind.php?x=hb9wt4).
Transparency Statement
Some deviations from the preregistration and additional statistical computations need to be explained. First, we originally planned to reverse the scores of the stranger/robot task to use it as an operationalization for Behavioral Disinhibition, as done previously (Hirshfeld-Becker, Biederman, Henin, Faraone, Micco, et al., 2007). However, to avoid confusion, we ultimately decided against using less established terminology for the same construct and decided to commit to the original measurement intention of the stranger/robot task. Second, the poms scores that were used (explained above) were not explicitly mentioned in the preregistration. To control for the different numbers of items between timepoints, we standardized the poms scores before the analyses. Third, here we report the results of an exploratory cluster analysis, which was not specified in the preregistration, as we realized that this approach is most appropriate (and feasible) to answer our research questions about developmental trajectories.
Results
CU-Traits as a Function of BI, Age, and Gender
As indicated by Rhat and diagnostic plots, all models converged without warnings. The full model with a student distribution had the best fit in terms of predictive accuracy (WAIC = −555.0 [45.8], loo = −542.1 [45.6]) and was used for further analysis.
The linear effect of age was significant at estimated regression coefficient [B] = 0.07 (0.01), and lower and upper bounds of the 95% posterior credible interval (95% CI = [0.05, 0.08]), indicating that CU-traits increased with age. The quadratic effect of age was also significant at B = 0.03 (0.01) and 95% CI = [0.02, 0.05]. As can be seen in Figure 1, CU-traits slightly dropped between 2 and 9 years after which they increased again up until 21 years, contrary to the hypothesized normative peak during puberty.
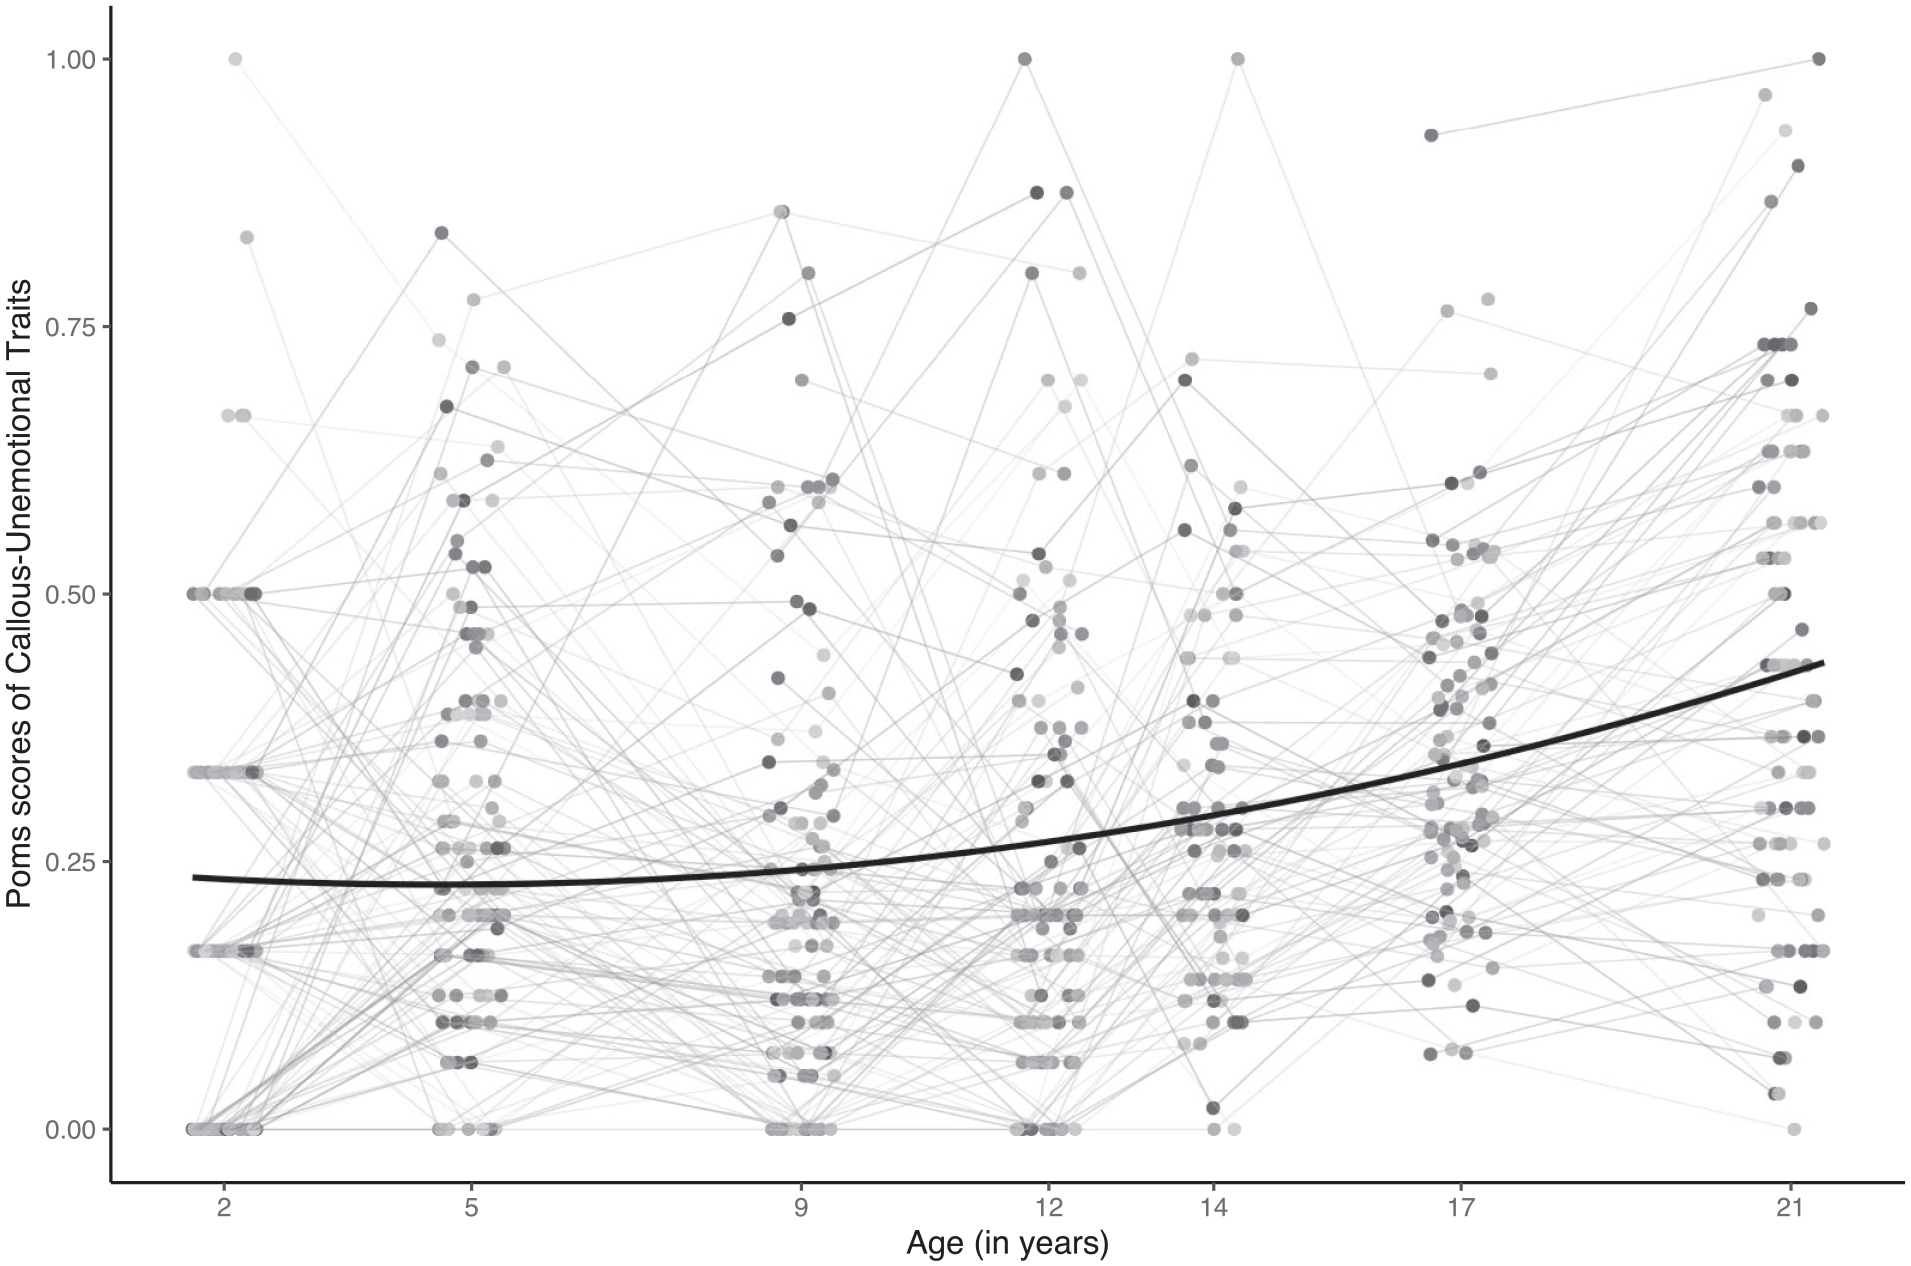
Plot of the Quadratic Effect of Age on Callous-Unemotional Traits, as Found by Using Bayesian Mixed Model Analysis (N = 118). The thick black line represents the significant main effect across the whole sample. The thinner gray-colored lines represent individual developmental pathways.
The main effect of gender was significant at B = −0.06 (0.01) and 95% CI = [−0.09, −0.03], indicating that CU-traits were significantly lower in girls than the overall mean. There also was a significant interaction between gender and age linear at B = −0.02 (0.01) and 95% CI = [−0.04, −0.01]. To further examine this interaction, we ran the model for girls and boys separately. Figure 2 shows the development of CU-traits as a function of gender.
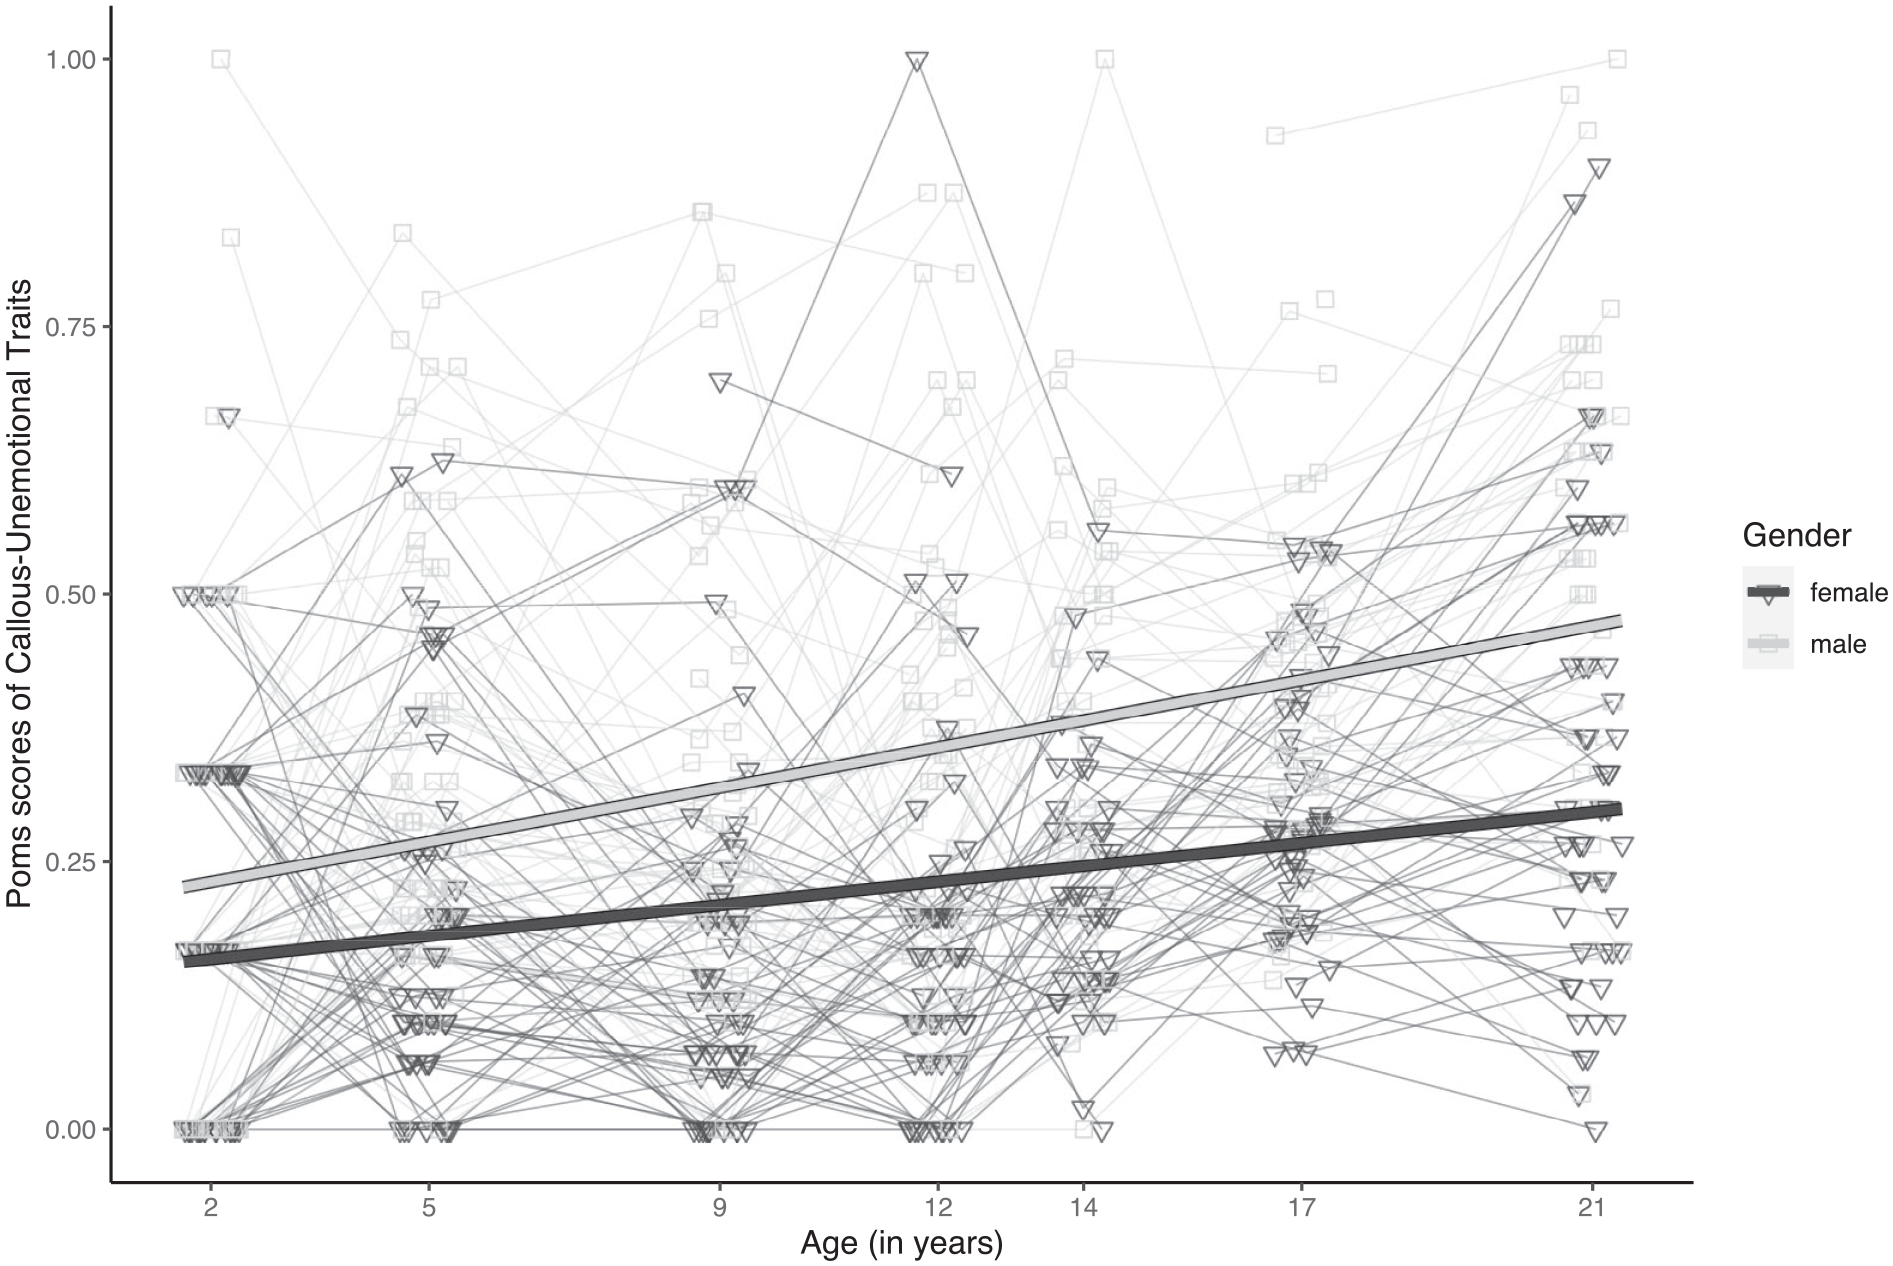
Plot of the Interaction Between Gender and the Linear Predictor of Age on Callous-Unemotional Traits, as Found by Using Bayesian Mixed Model Analysis (N = 118). Thick lines represent the significant increases in callous-unemotional traits across age for boys (light gray) and girls (dark gray). Individual developmental pathways of boys are represented by thinner light gray lines and squares, individual developmental pathways of girls are represented by thinner dark gray lines and triangles.
For girls, the linear effect of age was significant at B = 0.04 (0.01) and 95% CI = [0.02, 0.06], as well as the quadratic effect, B = 0.04 (0.01) and 95% CI = [0.02, 0.05]. This confirms the findings of the main model that CU-traits significantly increased in girls over time, and that a slight drop occurred during childhood followed by an increase. Furthermore, a main effect of BI on CU-traits, B = −0.01 (0.00) and 95% CI = [−0.02, −0.00], indicated that girls with higher BI at 15 months of age had lower CU-traits across development.
For boys, the linear and quadratic effects of age were also significant at B = 0.09 (0.01), 95% CI = [0.06, 0.11], and B = 0.03 (0.01), 95% CI = [0.01, 0.05], respectively, demonstrating that CU-traits followed the same pattern for boys as for girls: Increasing across development with a slight drop during childhood. The linear effect of age was larger for boys than for girls, indicating a steeper increase in CU-traits across development for boys. The effect of BI on CU-traits was not significant for boys at B = 0.00 (0.01) and 95% CI = [−0.01, 0.02].
Follow-Up Tests of the Link Between BI and CU-Traits
To rule out the possibility that BI shows a more general inverse relationship with CU-traits, reflecting the other side of the same coin rather than constituting a potentially protective factor, we employed two additional checks. First, we computed correlations between BI and CU-traits at all timepoints. BI did not correlate significantly with CU-traits at any timepoint in the total sample (all ps > .05; see Table 3) or for boys or girls separately (all ps > .05). Second, we examined whether gender differences (as found for the development of CU-traits) were already present in infancy for BI and CU by using Wilcoxon tests on the medians of BI and CU-traits as a robust alternative to independent t-tests. The Wilcoxon test is strongly recommended when the dependent variable is not normally distributed within each group (Kassambra, 2019). These tests indicated that BI at 15 months (p = .11) and CU at 2 years (p = .99) did not differ significantly for boys and girls. Only at the later assessments, medians of CU-traits differed by gender at 5, 9, 12, 14, 17, and 21 years of age, with boys scoring higher than girls at each time point (all ps < .05). For BI there were no later assessments. Together, these findings showed that BI and CU traits are independent constructs, each with a unique gender distribution. This strengthens the notion that infant BI can predict meaningful differences in the development of CU-traits by gender.
Correlations of Behavioral Inhibition and Callous-Unemotional Traits.
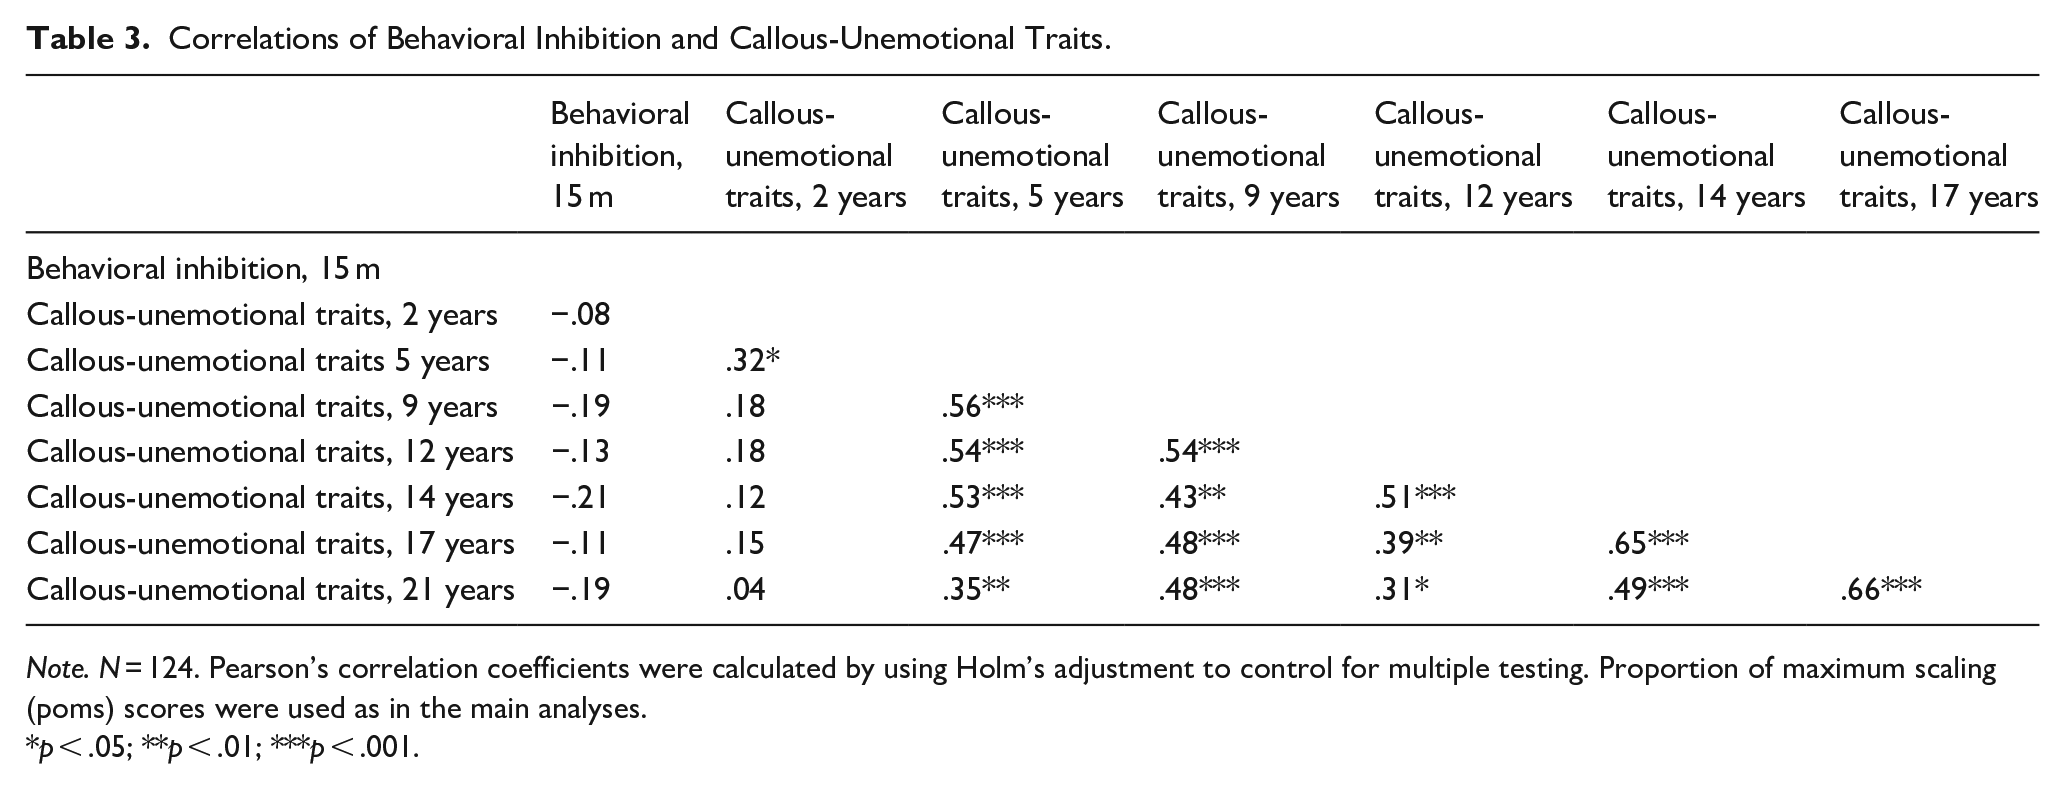
Note. N = 124. Pearson’s correlation coefficients were calculated by using Holm’s adjustment to control for multiple testing. Proportion of maximum scaling (poms) scores were used as in the main analyses.
p < .05; **p < .01; ***p < .001.
Stability of CU-Traits
Pearson’s correlations between all variables of interest are indicated in Table 3. At each time point, CU-traits correlated significantly and positively with CU-traits at the next time point (all ps < .05), indicating rank-order stability from each wave to the next. From 5 years onward, CU-traits also correlated significantly and positively with each of the following assessments (all ps < .05) showing that higher levels of CU-traits at one time point were related to higher CU-traits at all subsequent timepoints.
Developmental Trajectories of CU-Traits
To explore whether there were four different developmental trajectories present in our sample, we conducted a k-means cluster analysis. Based on the three selection criteria of the kml function, that is, the Calinski & Harabatz, Ray & Turi and Davies & Bouldin criteria (Genolini & Falissard, 2011), the optimal number of clusters was two. These two clusters described similar trajectories as found for the two genders using Bayesian mixed models, namely, a slower (Cluster A) and a steeper increase (Cluster B), respectively, in CU-traits across development (see Figure 3). Cluster A consisted of 70.6% of the sample (47 girls, 37 boys); Cluster B consisted of 29.4% of the sample (9 girls, 26 boys). Ten participants could not be assigned to a cluster because more than 5 data points were missing. Finally, we ran a generalized mixed-effects model to check whether gender predicted cluster belonging. Indeed, cluster membership differed as a function of gender, Estimate = −.65 (.22), p = .003. Girls were more likely to belong to Cluster A and boys were more likely to belong to Cluster B. In the light of our hypothesis of four developmental trajectories, we also examined whether our data could be clustered into four groups. The selection criteria for four clusters were worse than for two. Therefore, we rejected our hypothesis of four developmental trajectories.
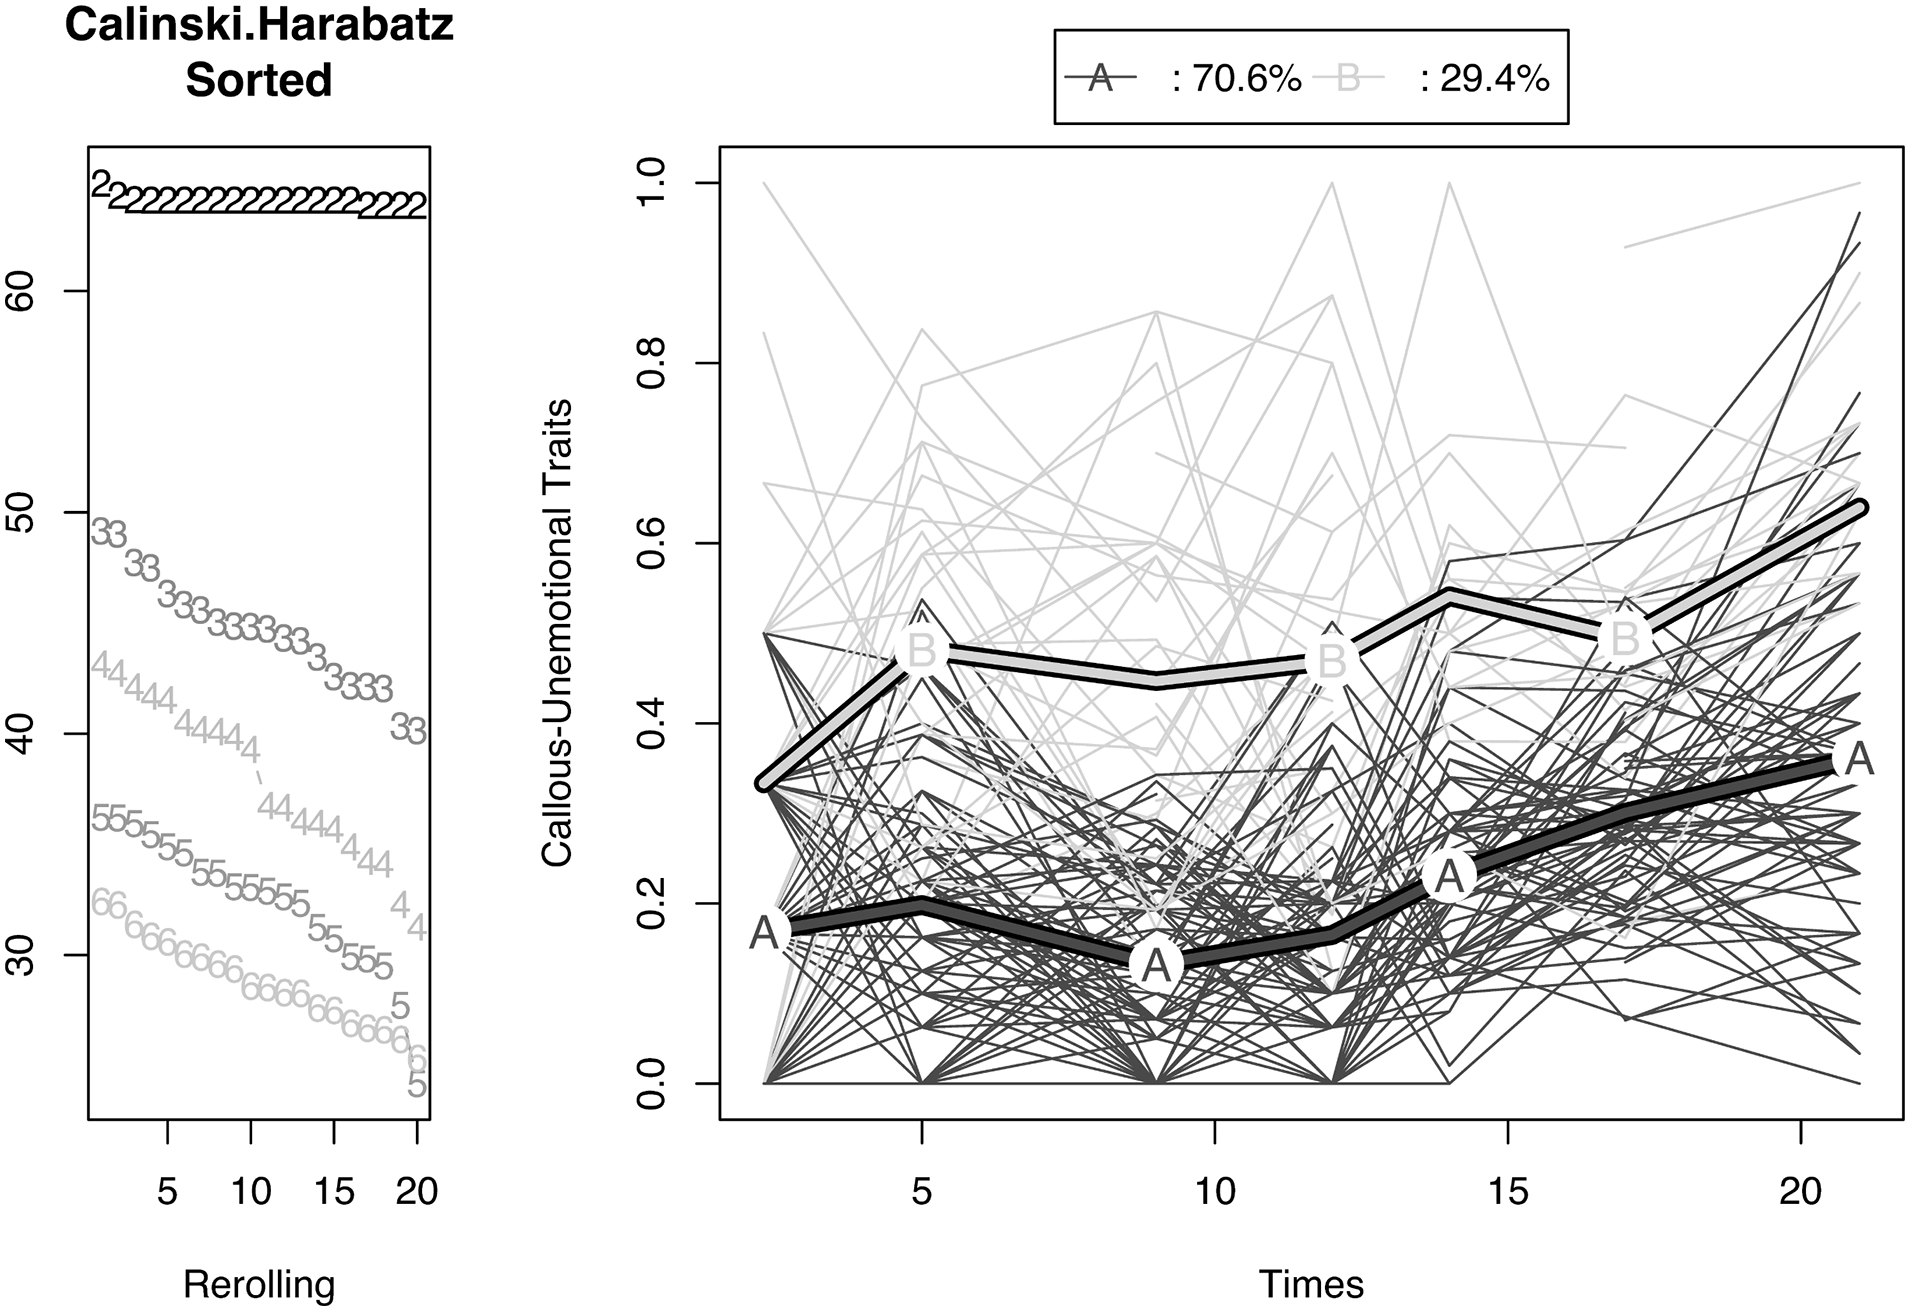
Plot of the k-Means Cluster Analysis (N = 118). The left panel shows the number of clusters that have been identified (i.e., 2, 3, 4, 5, 6) with the quality sorted as a function of the Calinski Harabatz selection criterion. That is, a higher position of the numbers indicates higher quality. The right panel shows the selected two clusters solution. The thick lines represent the average pathway of the two groups, that is, cluster A (dark gray, consisting of 70.6% of the sample) and cluster B (light gray, consisting of 29.4% of the sample). Thinner lines represent individual pathways belonging to the two clusters A (dark gray) and B (light gray).
Control for Missingness
As additional checks of our results, we ran the main model for complete cases only (n = 69). The results remained mostly the same. That is, the main effects were significant for age linear at B = 0.07 (0.01), 95% CI = [0.05, 0.09], age quadratic at B = 0.04 (0.01), 95% CI = [0.02, 0.05], and gender at B = −0.05 (0.01), 95% CI = −0.08, −0.02]. The interaction between gender and age linear was in the same direction but not significant at B = −0.02 (0.01), and 95% CI = [−0.04, 0.00]. This might be due to the smaller sample (32 boys, 37 girls). We also tested whether the effect of BI on CU-traits in girls remained significant, which was not the case at B = −0.01 (0.00) and 95% CI = [−0.01, 0.00]. The direction of all other effects remained the same.
Replication of the Model for Parent Reports Only
Although it is recommended in longitudinal studies to make benefit of the richness of available information of various age-appropriate measures, it can be helpful to explore whether findings hold when using one consistent measure over time. For two reasons we used the parent reports for this purpose: First, parent reports of CU-traits are the most preferable when other reports are lacking (i.e., Docherty and colleagues, 2017). Second, the model for parent reports alone included sufficient observations to test whether the findings would hold (Note that such a model for self-reports included 192 observations only [self-reported CU-traits were assessed at age 17 and 21; n = 106] and that such a model for teacher reports included 307 observations, which is also significantly less than the 607 observations across development for parent reports [teacher reported CU-traits were assessed at age 5, 9, and 12; n = 117].)
Therefore, we checked whether our findings would hold when running the full brms model for parent reports only and we could confirm that all three main findings held: the model for parent reports (parent reported CU-traits were assessed at ages 2, 5, 9, 12, 14, and 17; n = 118) included 607 observations. There were significant main effects for age linear, B = 0.03 (0.01), 95% CI = [0.01, 0.04], and gender, B = −0.06 (0.02), 95% CI = [−0.09, −0.02], again confirming a significant increase in CU-traits across time and gender differences. For girls only, the effect of BI on CU-traits was significant at B = −0.02 (0.01) and 95% CI = [−0.03, −0.00]. For boys only, the main effect of age linear on CU-traits was significant at B = 0.04 (0.01) and 95% CI [0.02, 0.06]. These results confirm our main analyses in terms of increasing CU-traits across development, as well as gender differences (i.e., boys score higher on CU-traits) and BI (i.e., girls with higher BI have lower CU-traits across development).
Discussion
The goal of this study was to investigate BI as an early life predictor of the development of CU-traits across development until 21 years of age in a normative sample. BI at 15 months was related to lower CU-traits across development in girls, supporting the hypothesis that early BI temperament may have a long-term buffering effect against antisocial traits and externalizing behavior (in girls). Regardless of BI, there was an adolescent onset curvilinear increase (u-shaped curve) of CU-traits up until adulthood. The increase was steeper for boys than for girls, with boys scoring higher on CU-traits from 5 years onward. Next to revealing new insights into early life predictors of CU-traits, these results indicate that the normative peak of CU-traits extends into early adulthood at age 21.
In line with our hypothesis, BI was related to lower CU-traits across development—but only in girls. Our findings align with and extend previous evidence for an inverse relationship between constructs closely related to either BI or CU-traits (Barker et al., 2011; Glenn et al., 2007; Goffin et al., 2018; Hirshfeld-Becker, Biederman, Henin, Faraone, Davis, et al., 2007; Hirshfeld-Becker, Biederman, Henin, Faraone, Micco, et al., 2007). Importantly, this relationship could not be explained by a general gender effect in BI or CU-traits. There was no gender difference in infant BI. BI also did not correlate with CU-traits at any point in development for boys or girls. This supports the notion that BI is not simply the opposite of CU-traits. In addition to being a risk factor for internalizing problems (Clauss & Blackford, 2012; Fox et al., 2005), BI might thus be a protective factor for externalizing problems in girls. Inhibited, fearful reaction tendencies might withhold girls from transgressing rules already in childhood, which in turn benefits the development of moral, socially adequate behavior. In addition, after wrongdoing, emotional and physiological hyper-reactivity might sensitize girls with higher BI to negative emotions and sanctions from peers, teachers, and parents, which also decreases antisocial behavior (Frick & Ellis, 1999; Kochanska, 1993). Previous research has shown that gender differences in BI only emerge in adolescence and suggest that this is because restraint is rather encouraged in girls, but less accepted in boys (Doey et al., 2014; Else-Quest et al., 2006). Fostering emotional expressiveness specifically in girls would then counteract the development of CU-traits, which are defined by unemotionality and uncaringness. Interestingly, with regard to CU-traits, no gender differences have been found early in life either (for review see Longman et al., 2016), but differences seem to emerge in adolescence (Essau et al., 2006).
In the current study, boys and girls increased in CU-traits across development to a different degree, with boys scoring significantly higher from childhood onward. Previous studies with children found similar developmental trajectories for boys and girls (Fontaine et al., 2010; Klingzell et al., 2016). The finding that boys scored higher and showed a steeper increase across development on CU-traits is consistent across studies (Frick, 2021; Lynam et al., 2009). Relatedly, the prevalence of externalizing disorders increases in both boys and girls across development, but are more common in boys and increase less in girls (Hamdi & Iacono, 2014)—the same pattern as for CU-traits. The increase in CU-traits for the complete sample up until adulthood is in line with studies showing that CU-traits and externalizing problems increase from late adolescence to early adulthood (Frick, 2021; Hamdi & Iacono, 2014).
We did not find evidence for the two predominant developmental patterns. First, we found no evidence for four different developmental trajectories (Hawes et al., 2018). Second, we found no peak in adolescence (e.g., Lynam et al., 2009; Pardini & Loeber, 2008), but rather a curvilinear increase from early adolescence to young adulthood. This may indicate an extended normative peak. Studies on CU-traits and aggressive personality traits in healthy participants have reported an increase in CU-traits until late adolescence (Frick, 2021) and decrease from early adulthood onward (Byrd et al., 2013; Roberts et al., 2001). The mean ICU scores in our sample were within the normative range at 14 and 17 years (Frick, 2021), but were higher at 21 years (compared with a community sample of 25-year-old men; Byrd et al., 2013). The relative rise in CU-traits at age 21 suggests that the normative peak in the development of CU-traits may occur later than previously assumed, namely, in early adulthood. An alternative explanation for the increase in CU-traits from adolescence onward could be the switch from parent and teacher report to self-report at 17 years. However, this would not explain that the main increase in CU-traits occurred as early as age 9 and it cannot explain the further increase at age 21.
This study had several strengths and limitations. Strengths were the unique data set covering numerous, repeated measurements across development until 21 years of age, which enabled us to link early temperament to individual CU-trajectories from childhood to early adulthood. Furthermore, BI was operationalized by a well-established task and rating scales (Fox et al., 2005). Also, CU-traits were measured with age-appropriate, longitudinal assessments. Unfortunately, our earlier assessments did not include a specific subscale for CU-traits and had low internal consistency. Difficulty to reliably assess characteristics during childhood is, however, a well-known problem in developmental psychopathology (Carter et al., 2004). Young children’s internal states can only be judged from the outside, which can be biased. We combined all available information on CU-traits to counteract this problem (Docherty et al., 2017), which led to an increase in internal consistencies. Further statistical checks also underlined the psychometric properties of our early assessments in terms of significant correlations between different reports (i.e., teacher, parent, self; inter-rater reliability) and significant correlations with the respective next measurement (test–retest reliability). Moreover, gender differences and the link to BI held when analyzing parent report alone, which is the most preferable report if no others are available (Docherty et al., 2017). Although these statistical check-ups provide support for the psychometric properties of our early assessments, it might be seen as debatable whether these questionnaires measure CU-traits conceptually. Therefore, the early assessments of CU-traits should be seen as a proxy. More research is needed to find the best possible, valid and reliable assessments of CU-traits early in life. Other problems for longitudinal research are missing data points and attrition. We minimized the influence of missingness by using all available data points for our main analyses. Additional analyses with complete cases only showed that the (direction of the) results remained the same. However, we do not know how CU-traits developed in participants who dropped out. If children with higher CU-traits are more likely to drop out, this stresses the need to follow-up risk groups to better understand deviant pathways. Finally, the current study focused on BI as a single, child-internal predictor of CU-traits. The development of CU-traits is equifinal, though, being determined by multiple, cultural, environmental, and biological factors (see, for reviews, Glenn, 2019; Ribeiro da Silva et al., 2020; Salekin, 2017; Viding & McCrory, 2018). Future studies, which assess more predictors of CU-traits, as well as their interplays, are highly desirable.
The current study poses new questions for future research. Our results indicate that a normative developmental drop in CU-traits might take place later in life. A better understanding of normative developmental pathways would not only enhance the identification of deviant pathways, but also the timing of prevention and intervention programs. Thus, future research should further examine the development of CU-traits across adolescence and young adulthood. A closer inspection of the moderators of the association between BI and the development of CU-traits would inform us which BI children are less likely to develop high levels of CU-traits. In particular, gender differences in CU-traits bear important implications for clinical practice. If CU-traits are driven by different predictors in boys and girls, clinicians may need to pay attention to different symptom profiles when forming diagnoses. Moreover, different interventions might be effective for boys and girls. For instance, interventions aiming at increasing children’s responsiveness to external cues to prevent antisocial traits and conduct problems may work for girls, but not for boys. Together, the role of age and gender in the development of CU-traits remains an important topic for future research.
This study offers new insights into the protective role of BI in the long-term development of CU-traits. Girls with a fearful, inhibited temperament might be less at risk for CU-traits and potentially accompanying externalizing problems. The curvilinear increase in CU-traits suggests an extension of the normative peak into early adulthood. In the long term, understanding normative and deviant developmental pathways of CU-traits and their association with early temperament can provide a starting point for the fine-tuning of age-appropriate, tailored prevention and intervention programs for externalizing behavior and specifically CU-traits.
Supplemental Material
sj-docx-1-jbd-10.1177_01650254221100245 – Supplemental material for Behavioral inhibition as an early life predictor of callous-unemotional traits
Supplemental material, sj-docx-1-jbd-10.1177_01650254221100245 for Behavioral inhibition as an early life predictor of callous-unemotional traits by Anna L. Dapprich, Anna Tyborowska, Hannah C. M. Niermann, Eni S. Becker, Antonius H. N. Cillessen and Karin Roelofs in International Journal of Behavioral Development
Footnotes
Acknowledgements
The authors thank all the participants and their families who participated in the Nijmegen Longitudinal Study.
Declaration of Conflicting Interests
The author(s) declared no potential conflicts of interest with respect to the research, authorship, and/or publication of this article.
Data Availability Statement
Data available on request from authors.
Ethical Approval Statement
The study was conducted according to the guidelines of the Declaration of Helsinki.
Funding
The author(s) disclosed receipt of the following financial support for the research, authorship, and/or publication of this article: K.R. was supported by a consolidator grant from the European Research Council (ERC_CoG-2017_772337) and European Union’s Horizon 2020 consortium grant (DynaMORE-777084).
Supplemental Material
Supplemental material for this article is available online.
References
Supplementary Material
Please find the following supplemental material available below.
For Open Access articles published under a Creative Commons License, all supplemental material carries the same license as the article it is associated with.
For non-Open Access articles published, all supplemental material carries a non-exclusive license, and permission requests for re-use of supplemental material or any part of supplemental material shall be sent directly to the copyright owner as specified in the copyright notice associated with the article.