
Abstract
Prior evidence suggests that subjective well-being (SWB) remains relatively stable across adulthood. However, longitudinal evidence is sparse except in Western societies such as North America and Western Europe. We examined age-related changes in SWB (life satisfaction, positive affect, and negative affect) among middle-aged and older Japanese. We applied multilevel growth models to 14-year seven-wave longitudinal data of a dynamic cohort study. A total of 3,890 participants aged 40–81 at first assessment were included in the analysis. The longitudinal results demonstrated differential trajectories of SWB. Life satisfaction exhibited an accelerated increase in middle age but decreased and leveled off in old age. Positive affect increased in midlife and declined in late life. Negative affect remained stable in middle age but increased in old age. Demographics, health, and methodological correlates did not fully account for age-related changes in SWB. Of note, increases in negative affect in old age remained evident even after controlling for the correlates. In conclusion, life satisfaction was stable across adulthood, which was not the case with positive and negative affect. We discussed the possible mechanisms in these observed trajectories of SWB, in particular, negative affect in late life.
Introduction
Populations are aging around the world. The average global life expectancy rose from 53 years in 1960 to 72 years in 2016 (The World Bank, 2017). Given this worldwide trend, there has been a growing interest in understanding how well individuals age. However, relatively little is known about how sociocultural contexts shape socioemotional aging such as mental health, social relationships, and cognition within and across countries (Fung, 2013; Karel et al., 2012). The vast majority of longitudinal evidence on socioemotional aging originates from Western societies such as North America and Western Europe. The purpose of the present study was to examine how well-being changes with aging in an Eastern society.
Subjective Well-Being (SWB) Across Adulthood
To understand how well individuals adapt to age-related challenges, researchers on life span development and aging have regarded SWB as a key indicator of psychological adaptation and successful aging (Baltes & Baltes, 1990; Rowe & Kahn, 1987). Namely, better levels of well-being indicate that individuals are capable of adapting to their lives and aging successfully. SWB is a multidimensional construct and is defined as individuals’ cognitive and emotional valuation of their lives (Diener et al., 2003). Empirical studies have used life satisfaction, positive affect, and negative affect as core measures of SWB (Diener et al., 1999). Diener and colleagues (1999) outlined that life satisfaction is regarded as the cognitive component of well-being, whereas positive affect and negative affect are considered as its emotional component.
Two opposing frameworks of well-being have been proposed (Diener, 1984): The bottom-up framework assumes that objective life circumstances (e.g., health and social relationships) predict well-being, whereas the top-down perspective assumes that individuals’ subjective evaluation of life circumstances determines well-being. In the bottom-up framework, well-being is expected to decline with age-related losses. However, an extensive body of life span literature has suggested that individuals are capable of maintaining their well-being throughout adulthood, at least until the 70s. This absence of a decline in well-being with age has been called a “paradox” (Kunzmann et al., 2000; Mroczek & Kolarz, 1998; Schilling, 2005). Theorists have proposed top-down explanations: A metatheory of life span development, selective optimization with compensation theory (SOC; Baltes & Baltes, 1990), states that individuals maximize gains and minimize losses throughout life by utilizing self-regulatory strategies. Consistent with SOC, socioemotional selectivity theory (SST; Carstensen et al., 1999) posits that older adults prioritize emotional gains as they perceive that their time left to live is limited. This age-related trend that favors positive over negative information could contribute to stabilizing well-being.
SST suggests a universal association between age and a limited time perspective, but the dominant strategy for regulating emotions may differ across cultures. Cross-cultural studies (e.g., Uchida et al., 2004) have argued that individuals in individualistic cultures are motivated to maximize positive emotions, but that those in collectivistic cultures are motivated to maintain a balance between positive and negative emotions. The strategy of balancing positive emotions with negative ones might help people in Eastern societies, which are known to be collectivistic, make sense of their negative life experiences and accept, rather than avoid, negative affect. In fact, a previous study (Miyamoto & Ryff, 2011) indicates that balanced positive and negative emotions are more prevalent and more beneficial for health in Japanese than Americans. Thus, culturally fitting strategies to regulate emotions may moderate the relationship between age and emotional well-being, which can lead to increases in positive and negative affect of older Easterners. However, further research is required to understand the association between age and SWB across cultures.
First, the link between age and SWB can vary depending on the constructs of well-being. Several studies indicate that some constructs remain stable, while others decline with age (Diener & Suh, 1998; Hansen & Slagsvold, 2012; Jivraj et al., 2014; Stone et al., 2010). Findings are relatively consistent for trajectories of life satisfaction: Life satisfaction increased or remained stable in middle age and declined in old age (Hansen & Slagsvold, 2012; Jivraj et al., 2014; Koivumaa-Honkanen et al., 2005; Mroczek & Spiro, 2005; Schilling, 2006) or at the end of life (Gerstorf et al., 2008; Mroczek & Spiro, 2005), with one exception indicating that life satisfaction increased in late life (Gana et al., 2013). Conversely, trajectories of positive and negative affect are somewhat mixed, especially in late life. Some studies found that positive affect increased or remained stable in middle age (Charles et al., 2001; Stacey & Gatz, 1991; Windsor & Anstey, 2010), whereas others reported that positive affect decreased (Griffin et al., 2006) or demonstrated an U-shaped pattern (Joiner et al., 2018) in midlife. In old age, some studies found that positive affect decreased (Charles et al., 2001; Griffin et al., 2006; Joiner et al., 2018; Kunzmann et al., 2000; Stacey & Gatz, 1991), whereas others showed that positive affect increased (Windsor & Anstey, 2010) or demonstrated an inverse U-shaped pattern (Gana et al., 2015). These longitudinal studies consistently revealed that negative affect decreased in middle age (Charles et al., 2001; Griffin et al., 2006; Joiner et al., 2018; Stacey & Gatz, 1991; Windsor & Anstey, 2010). In old age, however, some studies showed that negative affect remained stable (Kunzmann et al., 2000; Stacey & Gatz, 1991; Windsor & Anstey, 2010), while another reported that it increased (Griffin et al., 2006). Thus, trajectories of SWB, particularly those of emotional well-being in late life, have not been conclusively identified.
Second, the majority of the evidence reviewed above are based on studies of Western societies. A few cross-cultural studies have examined age differences in well-being in Eastern and Western samples and indicated that culture could moderate the link between age and well-being (Grossmann et al., 2014; Karasawa et al., 2011; Pethtel & Chen, 2010). Consequently, age differences in life satisfaction were absent in Chinese and Americans (Pethtel & Chen, 2010). For positive affect, one study did not find age differences in Chinese and Americans (Pethtel & Chen, 2010), while another showed that older adults reported a higher level than younger adults across countries (i.e., Japan and the U.S.; Karasawa et al., 2011). Negative affect was lower among older, compared with younger, Easterners as well as Westerners (Grossmann et al., 2014; Karasawa et al., 2011; Pethtel & Chen, 2010), but age differences in negative affect were less evident in an Eastern society (Grossmann et al., 2014). These findings suggest at least that age differences in negative affect vary across cultures. A smaller number of longitudinal studies in Eastern societies examined trajectories of well-being and indicate cultural variations in emotional well-being in old age. Consistent with most findings in Western societies, the majority of older Koreans showed stability in life satisfaction (Lim et al., 2017), and it slightly deceased among older Taiwanese (Hsu, 2010). Emotional well-being demonstrated deteriorating trends: Among older Taiwanese, positive affect decreased and leveled off, whereas negative affect increased and remained stable (Chiao et al., 2009).
Third, correlates of changes in well-being are not yet well understood. Most longitudinal studies have adopted bottom-up approaches and predicted that a reduction in SWB would be accompanied with the paucity or the loss of resources, such as lower levels of education, spousal bereavement, higher prevalence of morbidity, or age-related functional impairments (Gana et al., 2013, 2015; Hansen & Slagsvold, 2012; Jivraj et al., 2014; Joiner et al., 2018). In these studies, however, few correlates such as gender, marital status, or health were related to changes in well-being. Moreover, findings on correlates of well-being changes in Eastern societies are limited. Being female and having a better level of education and health were associated with the stability of life satisfaction in older Koreans (Lim et al., 2017), whereas these correlates were not related to trajectories of life satisfaction in older Taiwanese (Hsu, 2010). In addition, a different study of older Taiwanese found the correlates of levels, but not changes, in positive and negative affect (Chiao et al., 2009).
The Present Study
In the current study, we examined age-related changes in SWB among middle-aged and older Eastern adults, namely Japanese. Given the multidimensionality of SWB (Diener et al., 2003), we used three measures examining its cognitive and emotional components: life satisfaction, positive affect, and negative affect. Based on the relevant life span and cross-cultural literature, we hypothesized that the three measures of SWB remain stable in middle age, but that differential trajectories are observed in old age: Whereas life satisfaction remains stable, positive and negative affects increase. In a bottom-up approach, we next examined whether demographic, health, and methodological factors (gender, education, marital status, morbidity, instrumental activities of daily living [IADL], and wave of survey) account for age-related changes in SWB. These variables have been used as relevant correlates of age and well-being in previous studies (Chiao et al., 2009; Hsu, 2010; Lim et al., 2017).
Method
Participants and Procedure
Data were derived from the National Institute for Longevity Sciences, Longitudinal Study of Aging (NILS-LSA). The NILS-LSA was a study that began in 1997. Follow-up surveys had been conducted approximately once in every 2 years until 2012. The research design such as time intervals between assessments and recruitment procedures changed since 2013. In the present study, we used data obtained between 1997 and 2012. The NILS-LSA recruited community-dwelling Japanese adults aged 40–79 years living in two areas (Obu city and Higashiura town) close to the institution. A probability sample randomly stratified by age and gender was compiled from resident registrations. Participants completed self-administered questionnaires at home and underwent psychological and physical examinations at the institution. The survey applied a dynamic cohort design in which new participants entered the survey at each wave (Wave 1: n = 2,267; Wave 2: n = 446, Wave 3: n = 387; Wave 4: n = 269; Wave 5: n = 236; Wave 6: n = 130; Wave 7: n = 248). A total of 3,983 individuals participated in the NILS-LSA. From Wave 2 to Wave 7, we added supplemental samples of individuals reaching age 40. Also, individuals matched on age and gender to those who dropped out were recruited, except those who were aged 80 years and above. All participants provided written informed consent. The detailed methodology is available elsewhere (Shimokata et al., 2000).
In the current study, all available data were used from the up to 14-year seven-wave longitudinal cohort study. The final sample size for analyses was 3,890 respondents who provided ratings of study variables at the first assessment. The data included 15,988 valid observations across waves (Wave 1: n = 2,216; Wave 2: n = 2,206, Wave 3: n = 2,319; Wave 4: n = 2,331; Wave 5: n = 2,467; Wave 6: n = 2,255; Wave 7: n = 2,294). Rates of attrition between waves ranged from 13.1% to 20.0%. Detailed reasons for attrition were not specified, but 359 died and 1,245 dropped out for other reasons during the study period. The sample completed an average of 4.11 assessments (SD = 2.28). The mean follow-up period was 6.66 years (SD = 4.80, range = 0–14.12).
Measures
SWB
SWB was assessed by three measures: life satisfaction, positive affect, and negative affect. To enhance comparability of results across well-being indicators, scores were standardized to T metrics (M = 50, SD = 10) based on baseline data of the entire sample. Supplementary Table 1 presents descriptive statistics for SWB over time.
The Life Satisfaction Index-K (LSI-K; Koyano & Shibata, 1994) was used to measure cognitive well-being. The LSI-K consists of three subscales labeled Satisfaction With Life as a Whole, Psychological Stability, and Evaluation of Own Aging and includes a total of 9 items with two or three points. Responses to the 3-point scale were dichotomized when calculating the total score. Example items are “As I look on my life, I am fairly well satisfied” for Satisfaction with Life as a Whole, “Life is hard for me most of the time” (reversed) for Psychological Stability, and “As you get older, you are less useful” for Evaluation of Own Aging. These items were derived from those in existing scales such as the Life Satisfaction Index-A (Neugarten et al., 1961) and the Philadelphia Geriatric Center Morale Scale (Lawton, 1975). One item, “I have much pep as I did last year,” conceptually overlapped with subjective health and was removed from analyses to avoid the contaminating effects of health decline. A higher score indicates better satisfaction with life. Cronbach’s αs ranged from .60 to .65 across the seven waves.
Subscales of the Center for Epidemiologic Studies-Depression (CES-D; Radloff, 1977; Shima et al., 1985) were used to measure emotional well-being. The 4-item positive affect and 7-item depressed affect subscales were used to assess positive affect and negative affect (e.g., “Felt happy” and “Felt hopeful about future” for positive affect and “Felt sad” and “Felt lonely” for negative affect). These subscales have been used as emotional well-being indicators in other studies (e.g., Chiao et al., 2009; Gana et al., 2015). Participants were asked how frequently they had experienced each emotional status during the past week and responded to each item on a 4-point scale of 0 (none) to 3 (5 days or more). The sum scores of positive affect and negative affect were computed separately. Higher scores indicate that individuals experience positive and negative affects more frequently. Cronbach’s αs were .66–.74 for positive affect and .77–.79 for negative affect across the seven waves.
Correlates
Age, gender, years of education, and marital status at the first assessment were used as time-invariant covariates. Gender was coded as a binary variable, with male as the reference. Marital status was also defined as a dichotomous variable, with being unmarried as the reference.
Morbidity, IADL, and wave of survey were included as time-varying covariates. Morbidity was indexed by the number of four chronic diseases (diabetes, heart disease, hypertension, and stroke), in reference to an earlier study of older Japanese adults (Liang et al., 2002). A subscale of the Tokyo Metropolitan Institute of Gerontology-Index of Competence (TMIG-IC; Koyano et al., 1991) was used to assess IADL. The TMIG-IC consists of three subscales to assess higher-level functional capacity among older adults. The 5-item instrumental self-maintenance subscale was used for our study because previous studies have used the subscale as an indicator of IADL (Fujiwara et al., 2008; Shimada et al., 2010; Tanimoto et al., 2012). Participants were asked whether they were capable of performing each activity on a dichotomous scale. The scores range from 0 to 5, and a higher score represents better functional status. In addition, because participants were recruited at every wave from Wave 1 to Wave 7, we employed effect coding (Wendorf, 2004) for wave of survey as a methodological factor (see equation (5)). Specifically, values of 1 or −1 are assigned to represent the participation in each wave or not, respectively. A positive coefficient indicates that well-being at a certain wave was higher than the grand mean.
Sample characteristics
Table 1 provides information on intercorrelations and descriptive statistics for the study sample at the first assessment. The correlations among well-being indicators were moderate (rs = −.43, −.36, .37). Correlates were at best weakly related with well-being indicators (correlations ranging from −.14 to .13). Given the low rates of morbidity (M = 0.41) and the high levels of IADL (M = 4.90), our sample, on average, maintained healthy functioning at baseline.
Intercorrelations and Descriptive Characteristics Among Study Variables at the First Assessment.
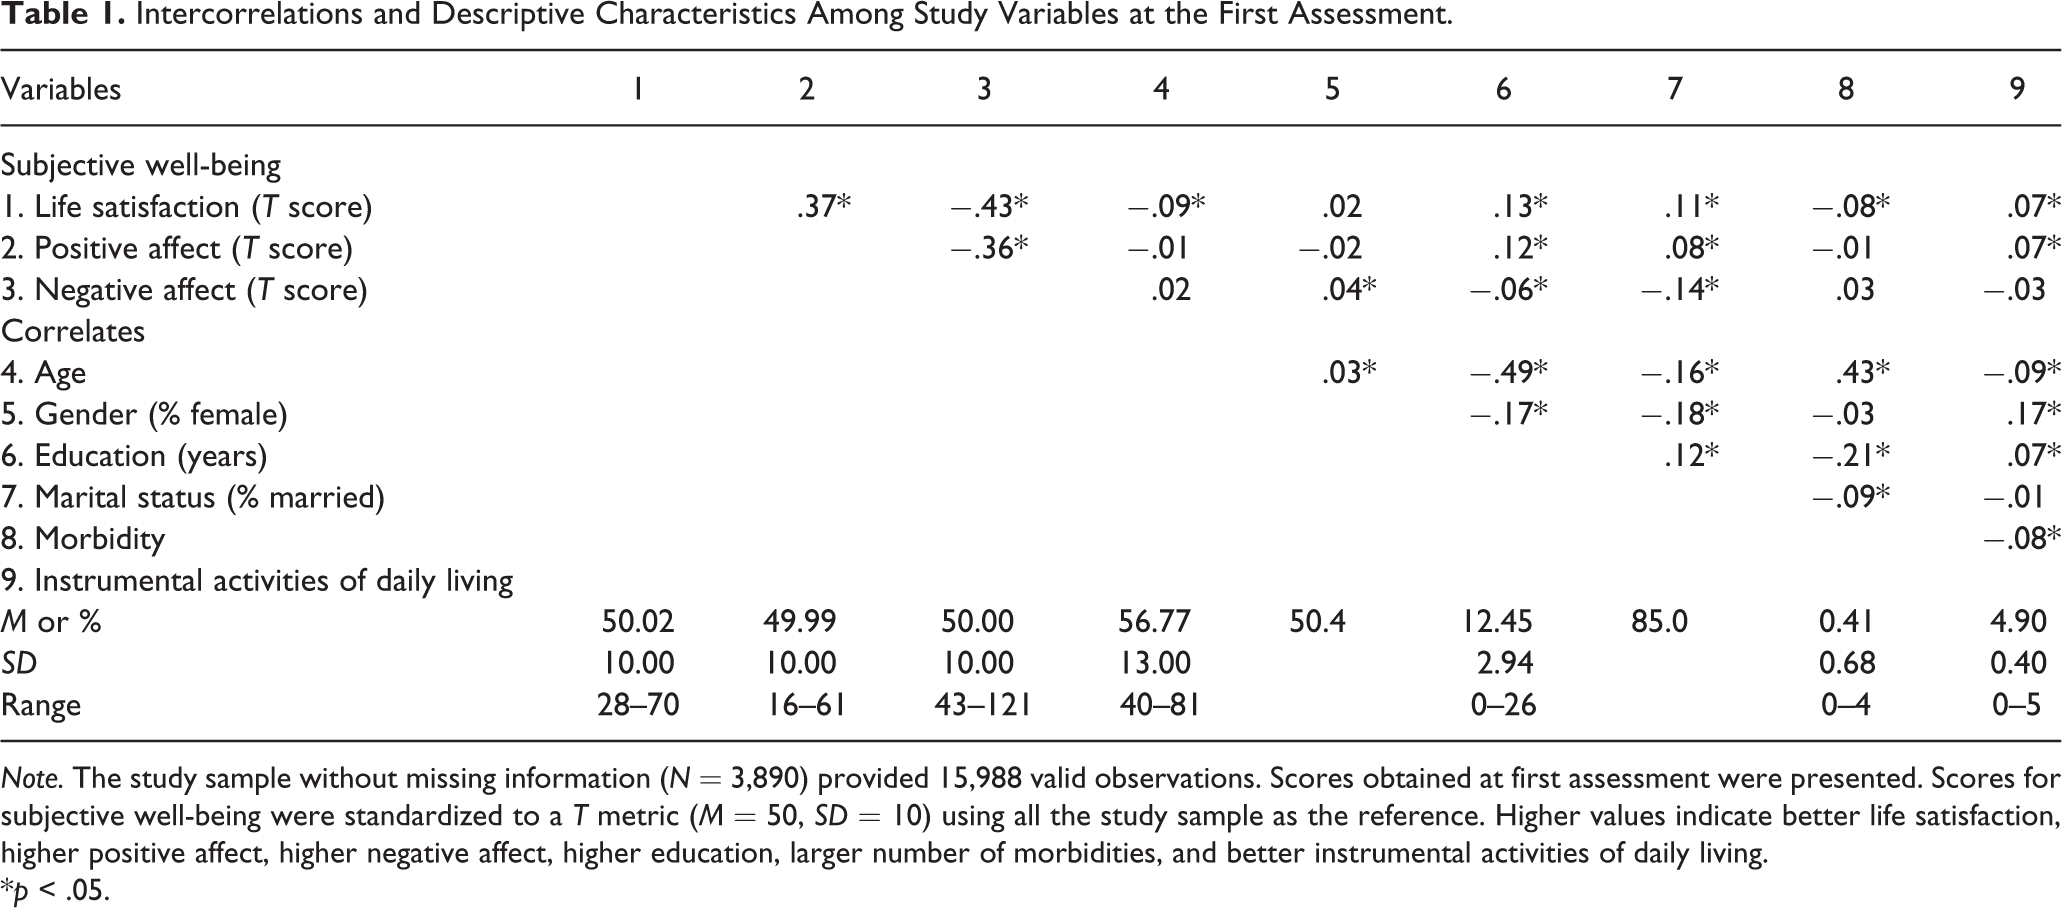
Note. The study sample without missing information (N = 3,890) provided 15,988 valid observations. Scores obtained at first assessment were presented. Scores for subjective well-being were standardized to a T metric (M = 50, SD = 10) using all the study sample as the reference. Higher values indicate better life satisfaction, higher positive affect, higher negative affect, higher education, larger number of morbidities, and better instrumental activities of daily living.
*p < .05.
To examine effects of sample selectivity, we compared participants without missing data on study variables and those who were excluded from the analyses due to having missing values (n = 93, 2.3% of the entire sample). Compared to participants included in the subsequent analysis, those who had missing data were older (Cohen’s d = .42, p < .001), had lower levels of education (Cohen’s d = .26, p = .017), and reported lower levels of life satisfaction and positive affect (Cohen’s d = .39, p < .001; Cohen’s d = .32, p = .005, respectively). Consequently, our final sample was more positively selected than the entire sample on demographic factors and well-being.
Data Preparation
Prior to the main analyses, we used estimates of levels and changes in health factors (morbidity and IADL) as correlates in multilevel growth curve model (Singer & Willett, 2003). The model took the following form:

where health status ti represents health for person i at time t. β0i is an individual-specific intercept parameter; β1i is an individual-specific linear slope parameter, which captures the rate of change per year; and eti is residual error. At the between-person level, individual differences were modeled as follows:


in which γ00 and γ10 are sample means, and u 0i and u 1i are individual variations from those means. The model was estimated with restricted maximum likelihood estimation, assuming the incomplete data as missing at random (Little & Rubin, 2002). The intercept and linear slope parameter, β0i and β1i , were extracted for health status for each individual. The slope score was z-standardized and indicated that one unit corresponds to a one standard deviation. Specifically, a score of −1 on the linear slope parameter of IADL would indicate that a person exhibited one standard deviation more decline than the average person in our sample.
Data Analysis
We estimated a series of multilevel models to examine trajectories of SWB. To capture change in well-being over time, time was specified as individual-specific time since date of the first assessment and was scaled in years. Quadratic and linear growth models including each well-being indicator as the outcome variable were fitted. At the within-person level, the base models were specified as follows:

where subjective well-being ti means SWB for person i at time t. β0i is an individual-specific intercept parameter; β2i is an individual-specific linear slope parameter; β4i is an individual-specific curvilinear slope parameter, which captures the rate of accelerated change per year; and eti is residual error. Because the curvilinear slope, β4i , was not statistically different from zero for positive affect and negative affect (data not shown), we omitted the parameter from the models and presumed only linear change in positive affect and negative affect.
To examine how trends in SWB differ across age-groups, base models included age, age squared, and elapsed time as the independent variables. We added age, age squared, and interaction terms of age (grand mean centered at 56.77 years) and age squared with the level and change in well-being as the independent variables at the between-person level (see equations (5) and (6)). Age, but not age squared, was related to quadratic change in life satisfaction in the model (estimate = .001, 95% CI [0.00, 0.002], p = .005). However, models were compared by assessing the reduction in the −2 log likelihood, and the model including the interaction term between age and time squared fitted worse than that excluding the term, Δχ2(1) = 6.10, p = .014. Therefore, the interaction term from the base model of life satisfaction was removed.
Next, to test the robustness of the link between age and SWB, full models including all correlates were estimated. At the between-person level, the full models took form as:
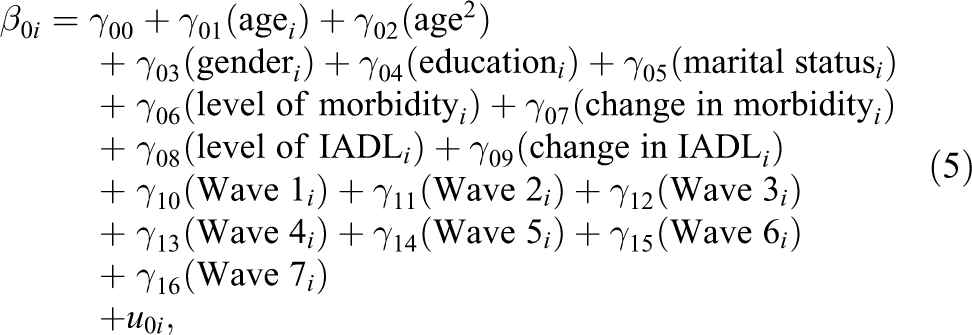
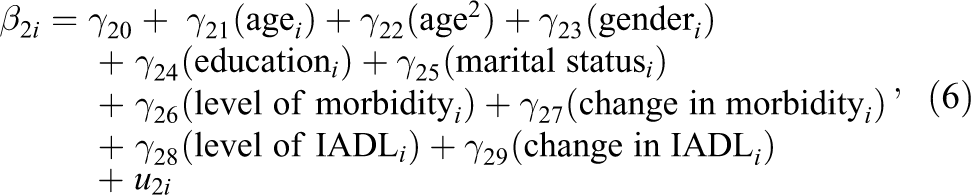

in which γ00, γ20, and γ40 are fixed effects, which represent sample means. u 0i , u 2i , and u 4 are random effects, which represent individual-specific deviations from the means. Random effects are assumed to be multivariate normally distributed, correlated with each other, and uncorrelated with the residual error, eti . Because none of the correlates including age were significantly associated with quadratic change in life satisfaction in the full model, correlates were omitted from equation (7) in order not to complicate the analysis. Even if correlates were included in equation (7), results were robust (data not shown). All correlates were centered at the sample means, so that the estimated parameters indicated the average trajectories of SWB and the extent of individual differences associated with a given correlate. Specifically, positive parameters indicated that correlates were associated with higher levels or an increase in SWB.
All models were fitted to the data using the “nlme” package Version 3.1-140 (Pinheiro et al., 2009) in R Version 3.5.0 (R Core Team, 2015). Restricted maximum likelihood estimation was used, treating incomplete data being as missing at random (Little & Rubin, 2002). Significance tests were evaluated at p less than .05.
Results
We first reported intraclass correlation (ICC) coefficients as an indicator of within-person stability. The ICC were .64, .38, and .49 for life satisfaction, positive affect, and negative affect, respectively. Tables 2, 3, and 4 summarize results for the base and full models of each well-being indicator. Based on the estimated coefficients, 7-year trajectories of SWB for each 5-year age-group (see Figures 1 and 2) are graphically illustrated. Seven years were selected based on the grand mean of the follow-up period. Below, we have focused on longitudinal results separately for each of the two sets of models.
Multilevel Growth Models of Life Satisfaction.
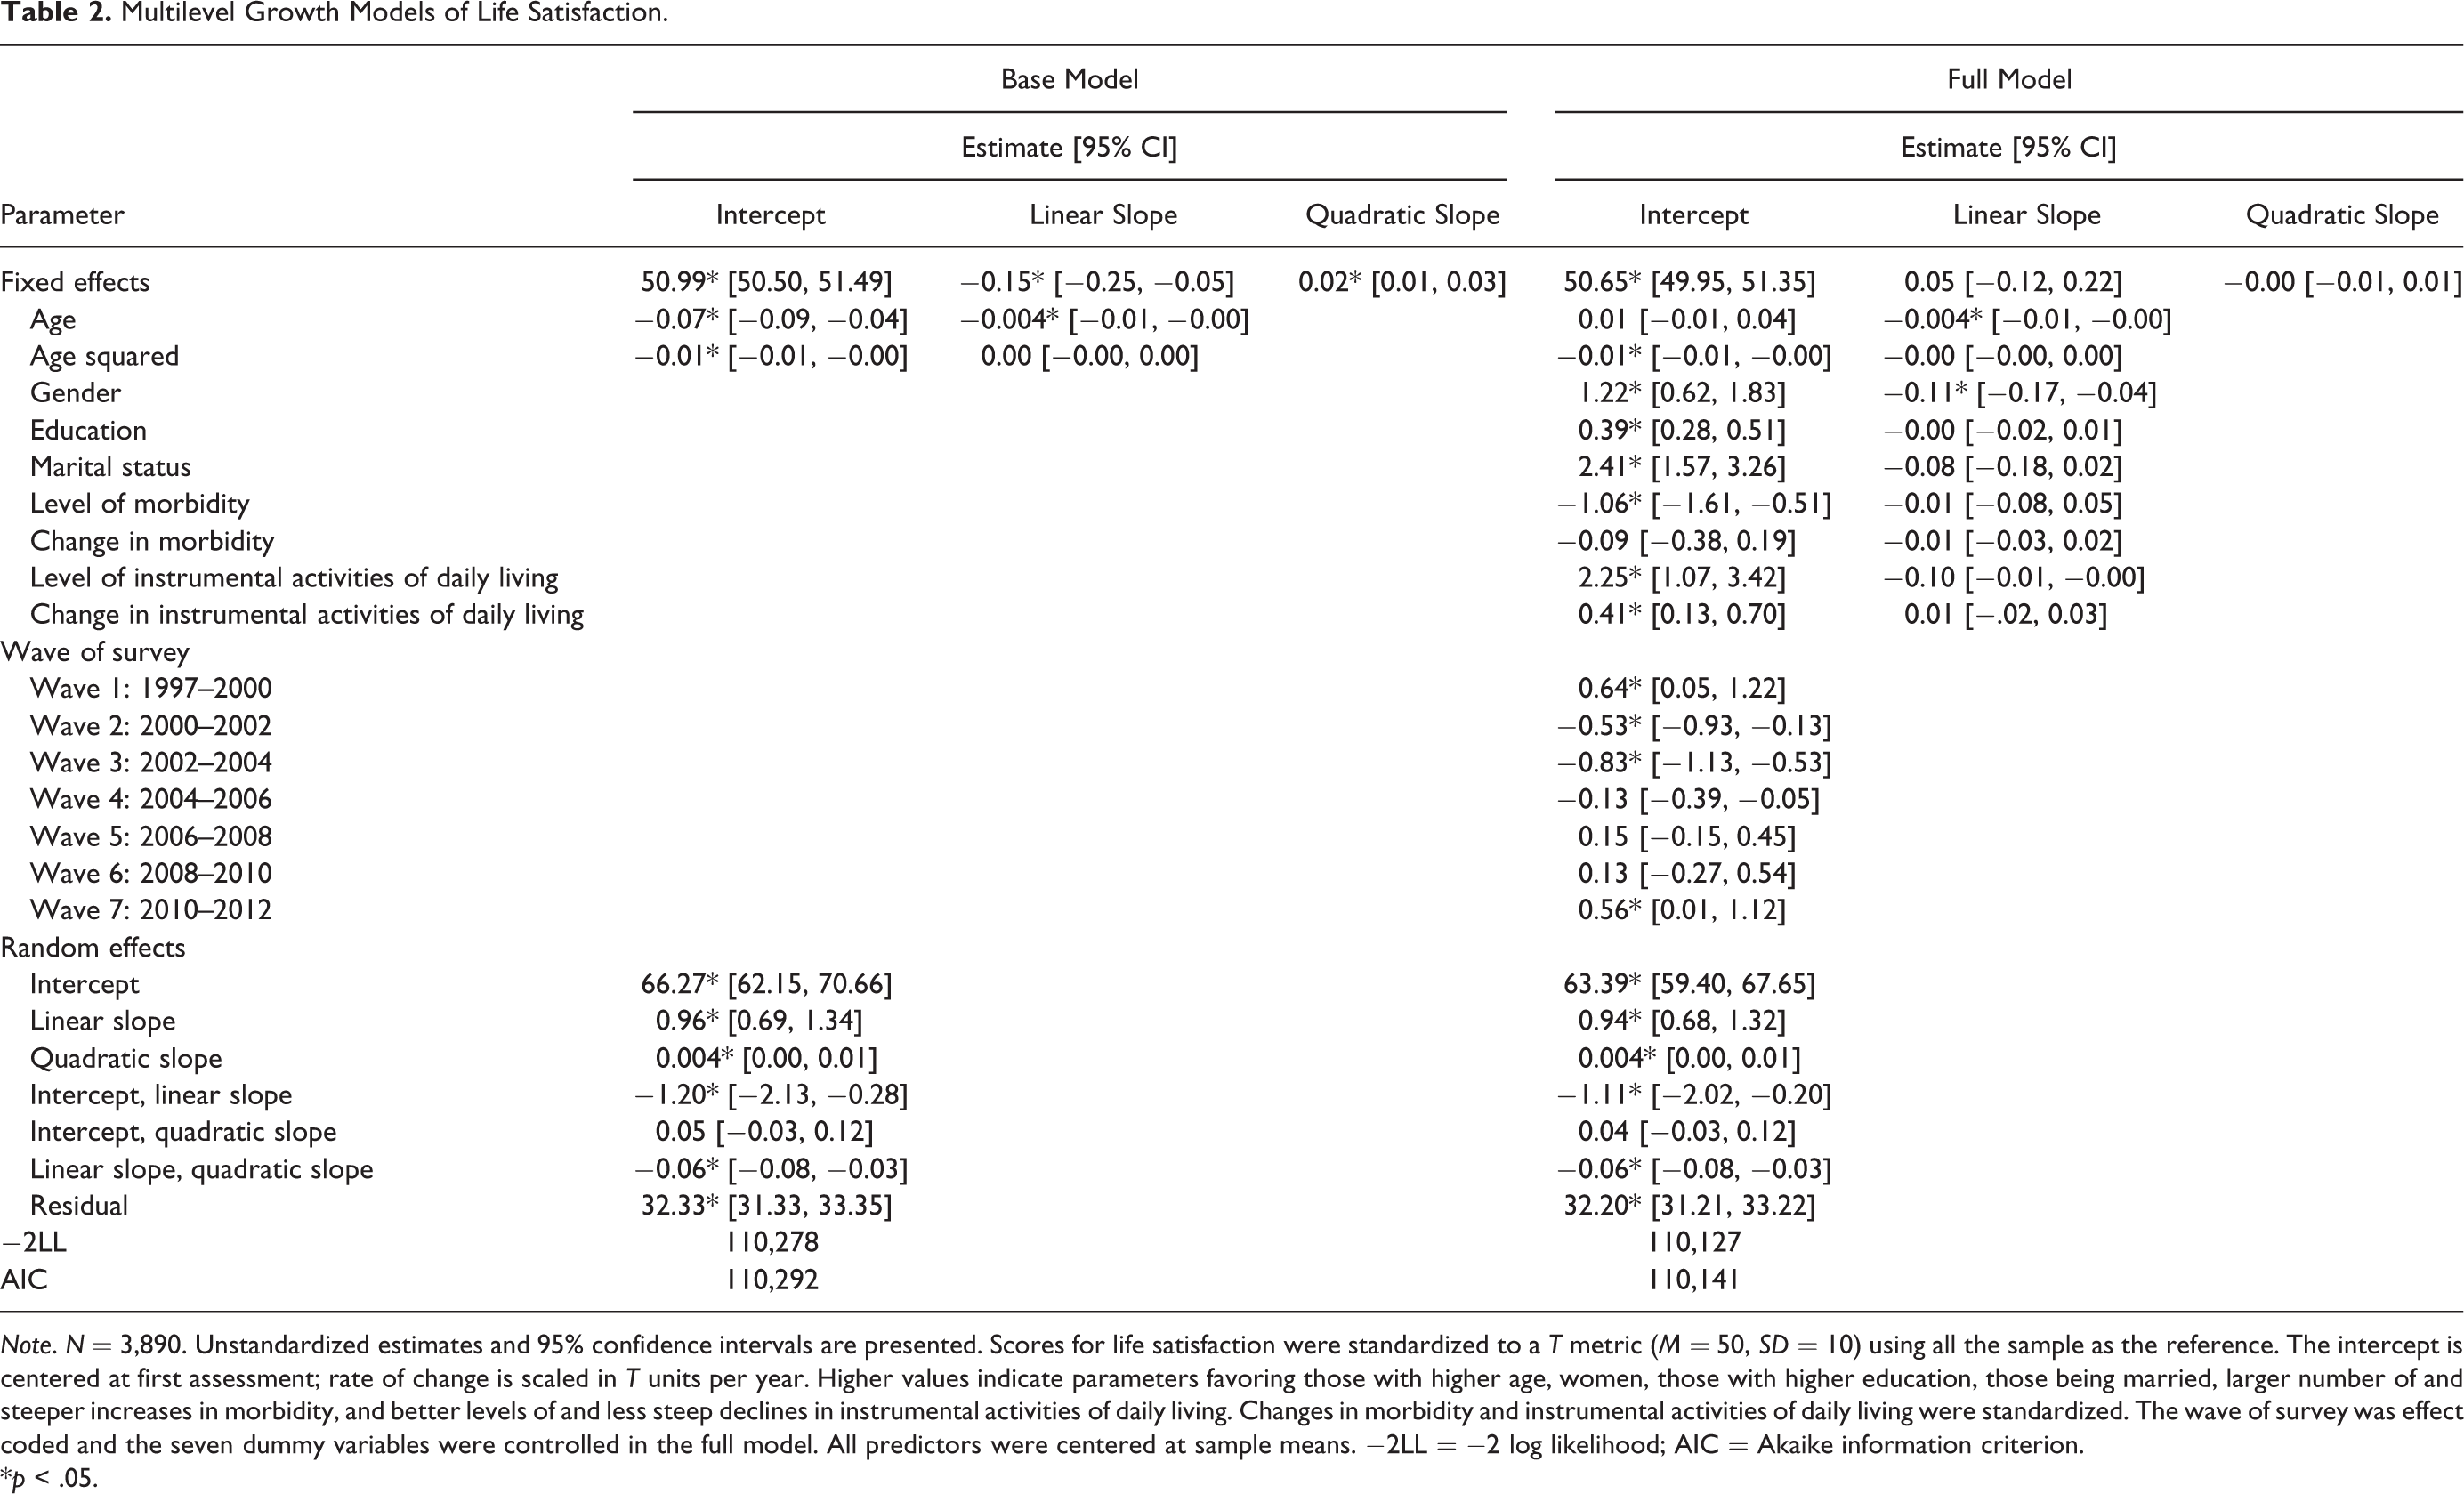
Note. N = 3,890. Unstandardized estimates and 95% confidence intervals are presented. Scores for life satisfaction were standardized to a T metric (M = 50, SD = 10) using all the sample as the reference. The intercept is centered at first assessment; rate of change is scaled in T units per year. Higher values indicate parameters favoring those with higher age, women, those with higher education, those being married, larger number of and steeper increases in morbidity, and better levels of and less steep declines in instrumental activities of daily living. Changes in morbidity and instrumental activities of daily living were standardized. The wave of survey was effect coded and the seven dummy variables were controlled in the full model. All predictors were centered at sample means. −2LL = −2 log likelihood; AIC = Akaike information criterion.
*p < .05.
Multilevel Growth Models of Positive Affect.
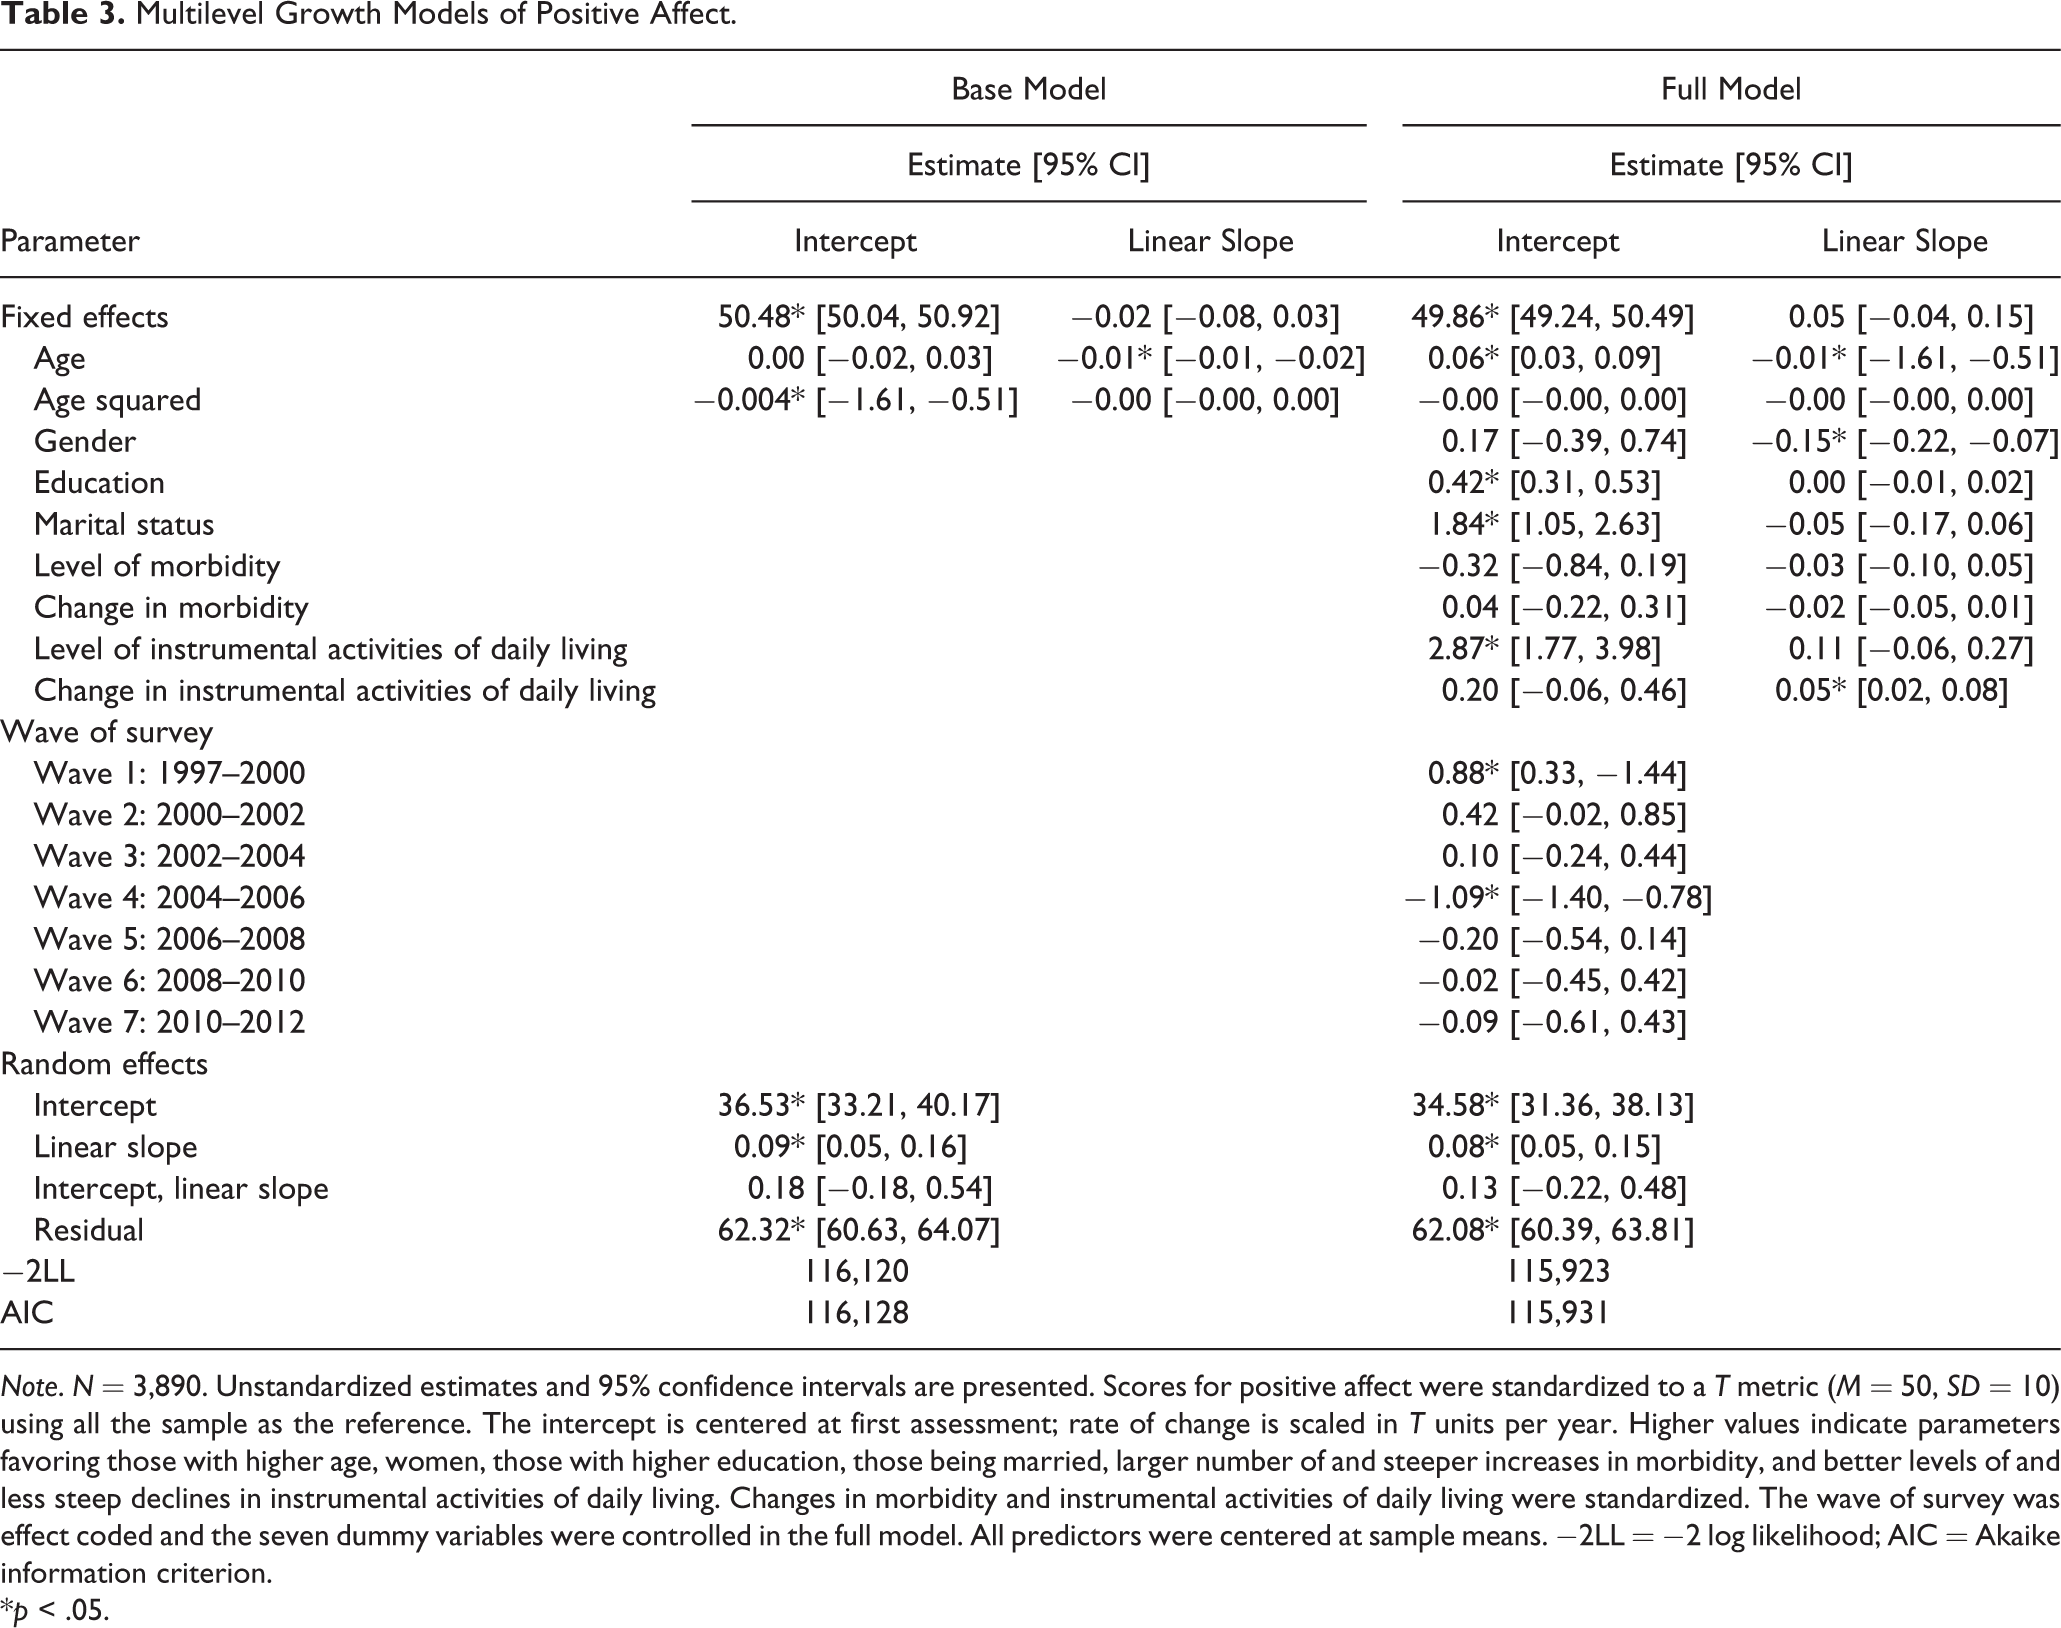
Note. N = 3,890. Unstandardized estimates and 95% confidence intervals are presented. Scores for positive affect were standardized to a T metric (M = 50, SD = 10) using all the sample as the reference. The intercept is centered at first assessment; rate of change is scaled in T units per year. Higher values indicate parameters favoring those with higher age, women, those with higher education, those being married, larger number of and steeper increases in morbidity, and better levels of and less steep declines in instrumental activities of daily living. Changes in morbidity and instrumental activities of daily living were standardized. The wave of survey was effect coded and the seven dummy variables were controlled in the full model. All predictors were centered at sample means. −2LL = −2 log likelihood; AIC = Akaike information criterion.
*p < .05.
Multilevel Growth Models of Negative Affect.
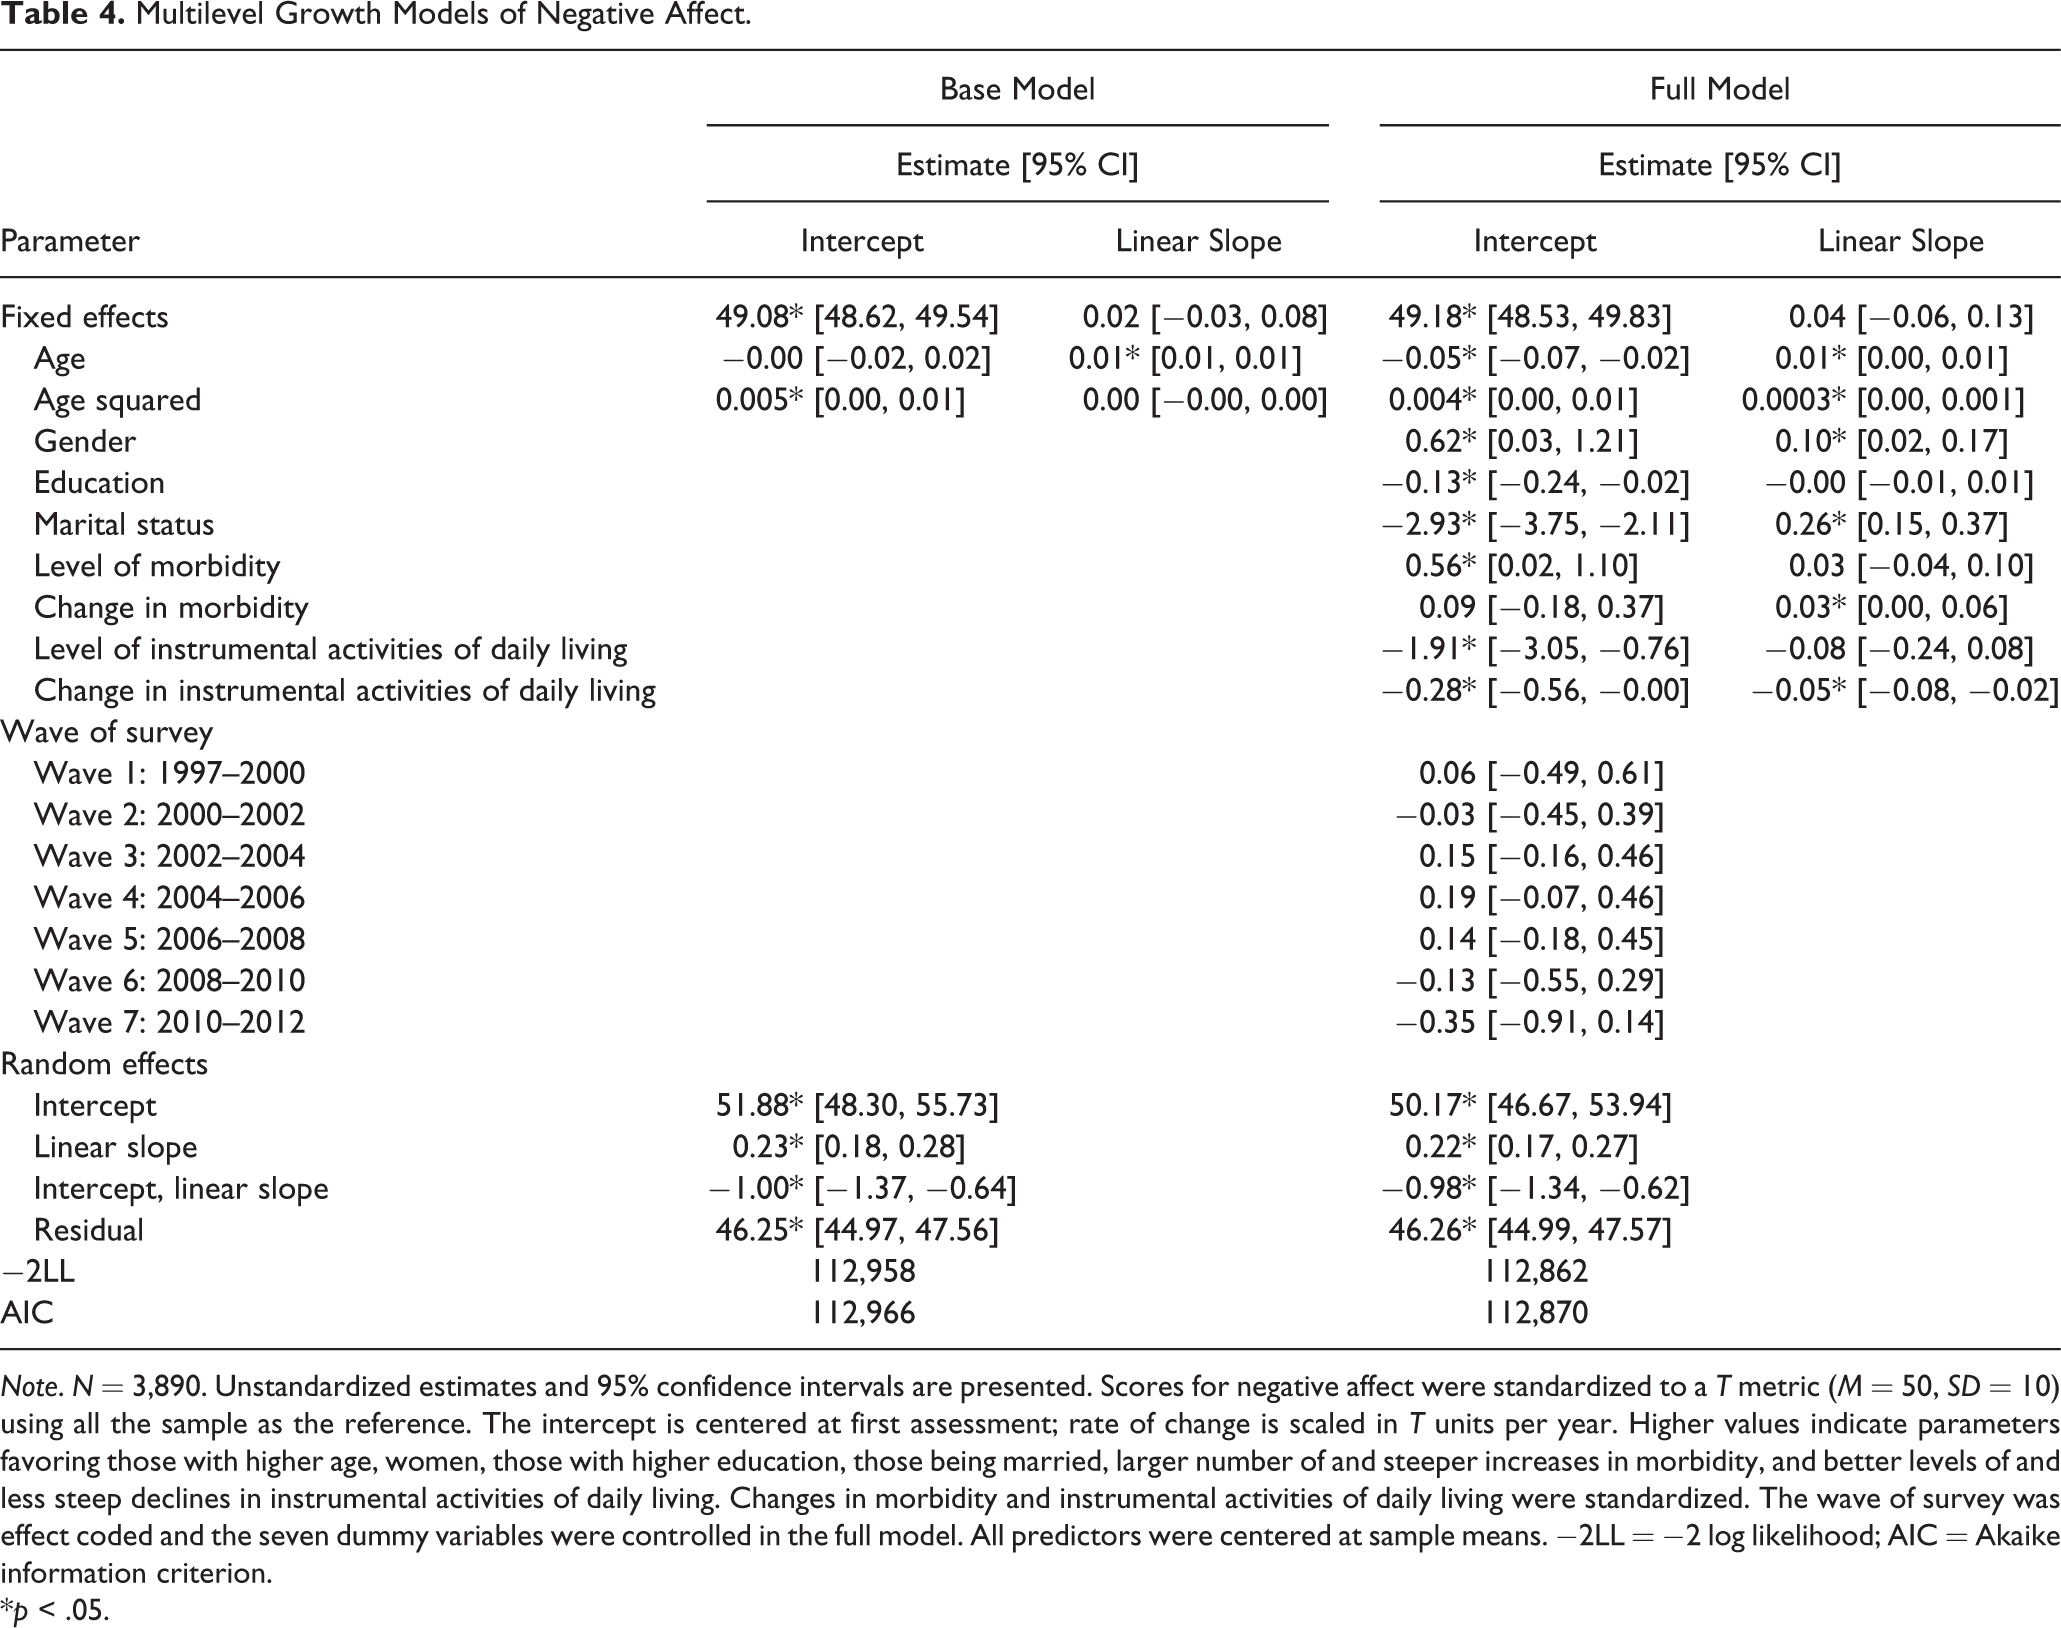
Note. N = 3,890. Unstandardized estimates and 95% confidence intervals are presented. Scores for negative affect were standardized to a T metric (M = 50, SD = 10) using all the sample as the reference. The intercept is centered at first assessment; rate of change is scaled in T units per year. Higher values indicate parameters favoring those with higher age, women, those with higher education, those being married, larger number of and steeper increases in morbidity, and better levels of and less steep declines in instrumental activities of daily living. Changes in morbidity and instrumental activities of daily living were standardized. The wave of survey was effect coded and the seven dummy variables were controlled in the full model. All predictors were centered at sample means. −2LL = −2 log likelihood; AIC = Akaike information criterion.
*p < .05.
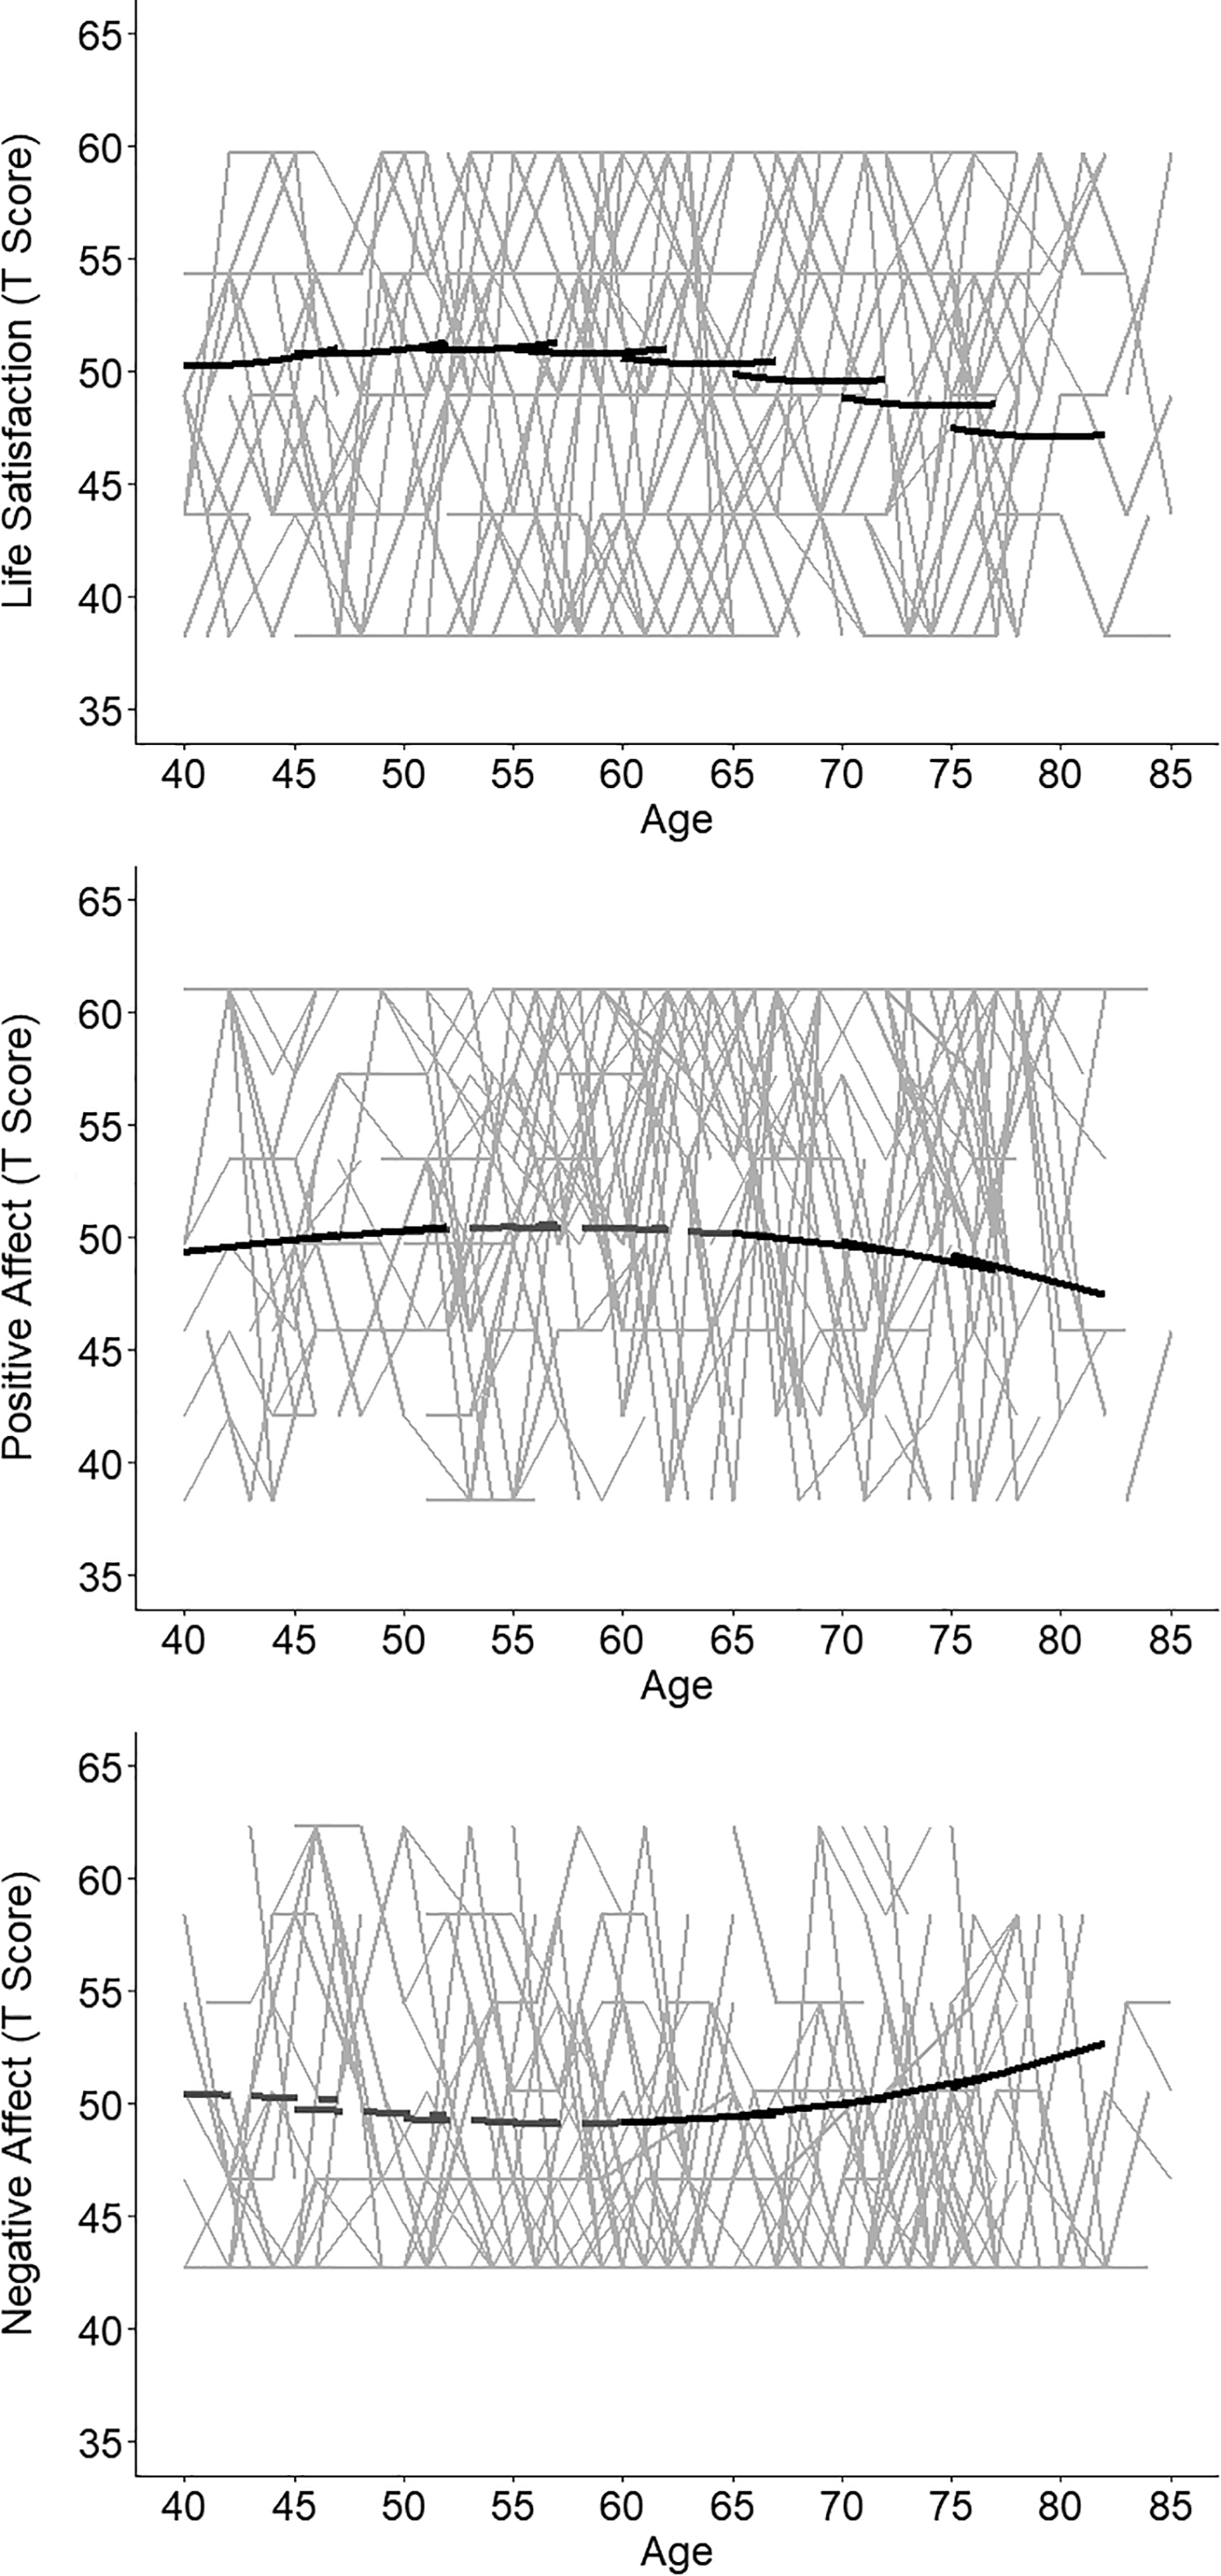
Base Model-Based Trajectories of Subjective Well-Being.
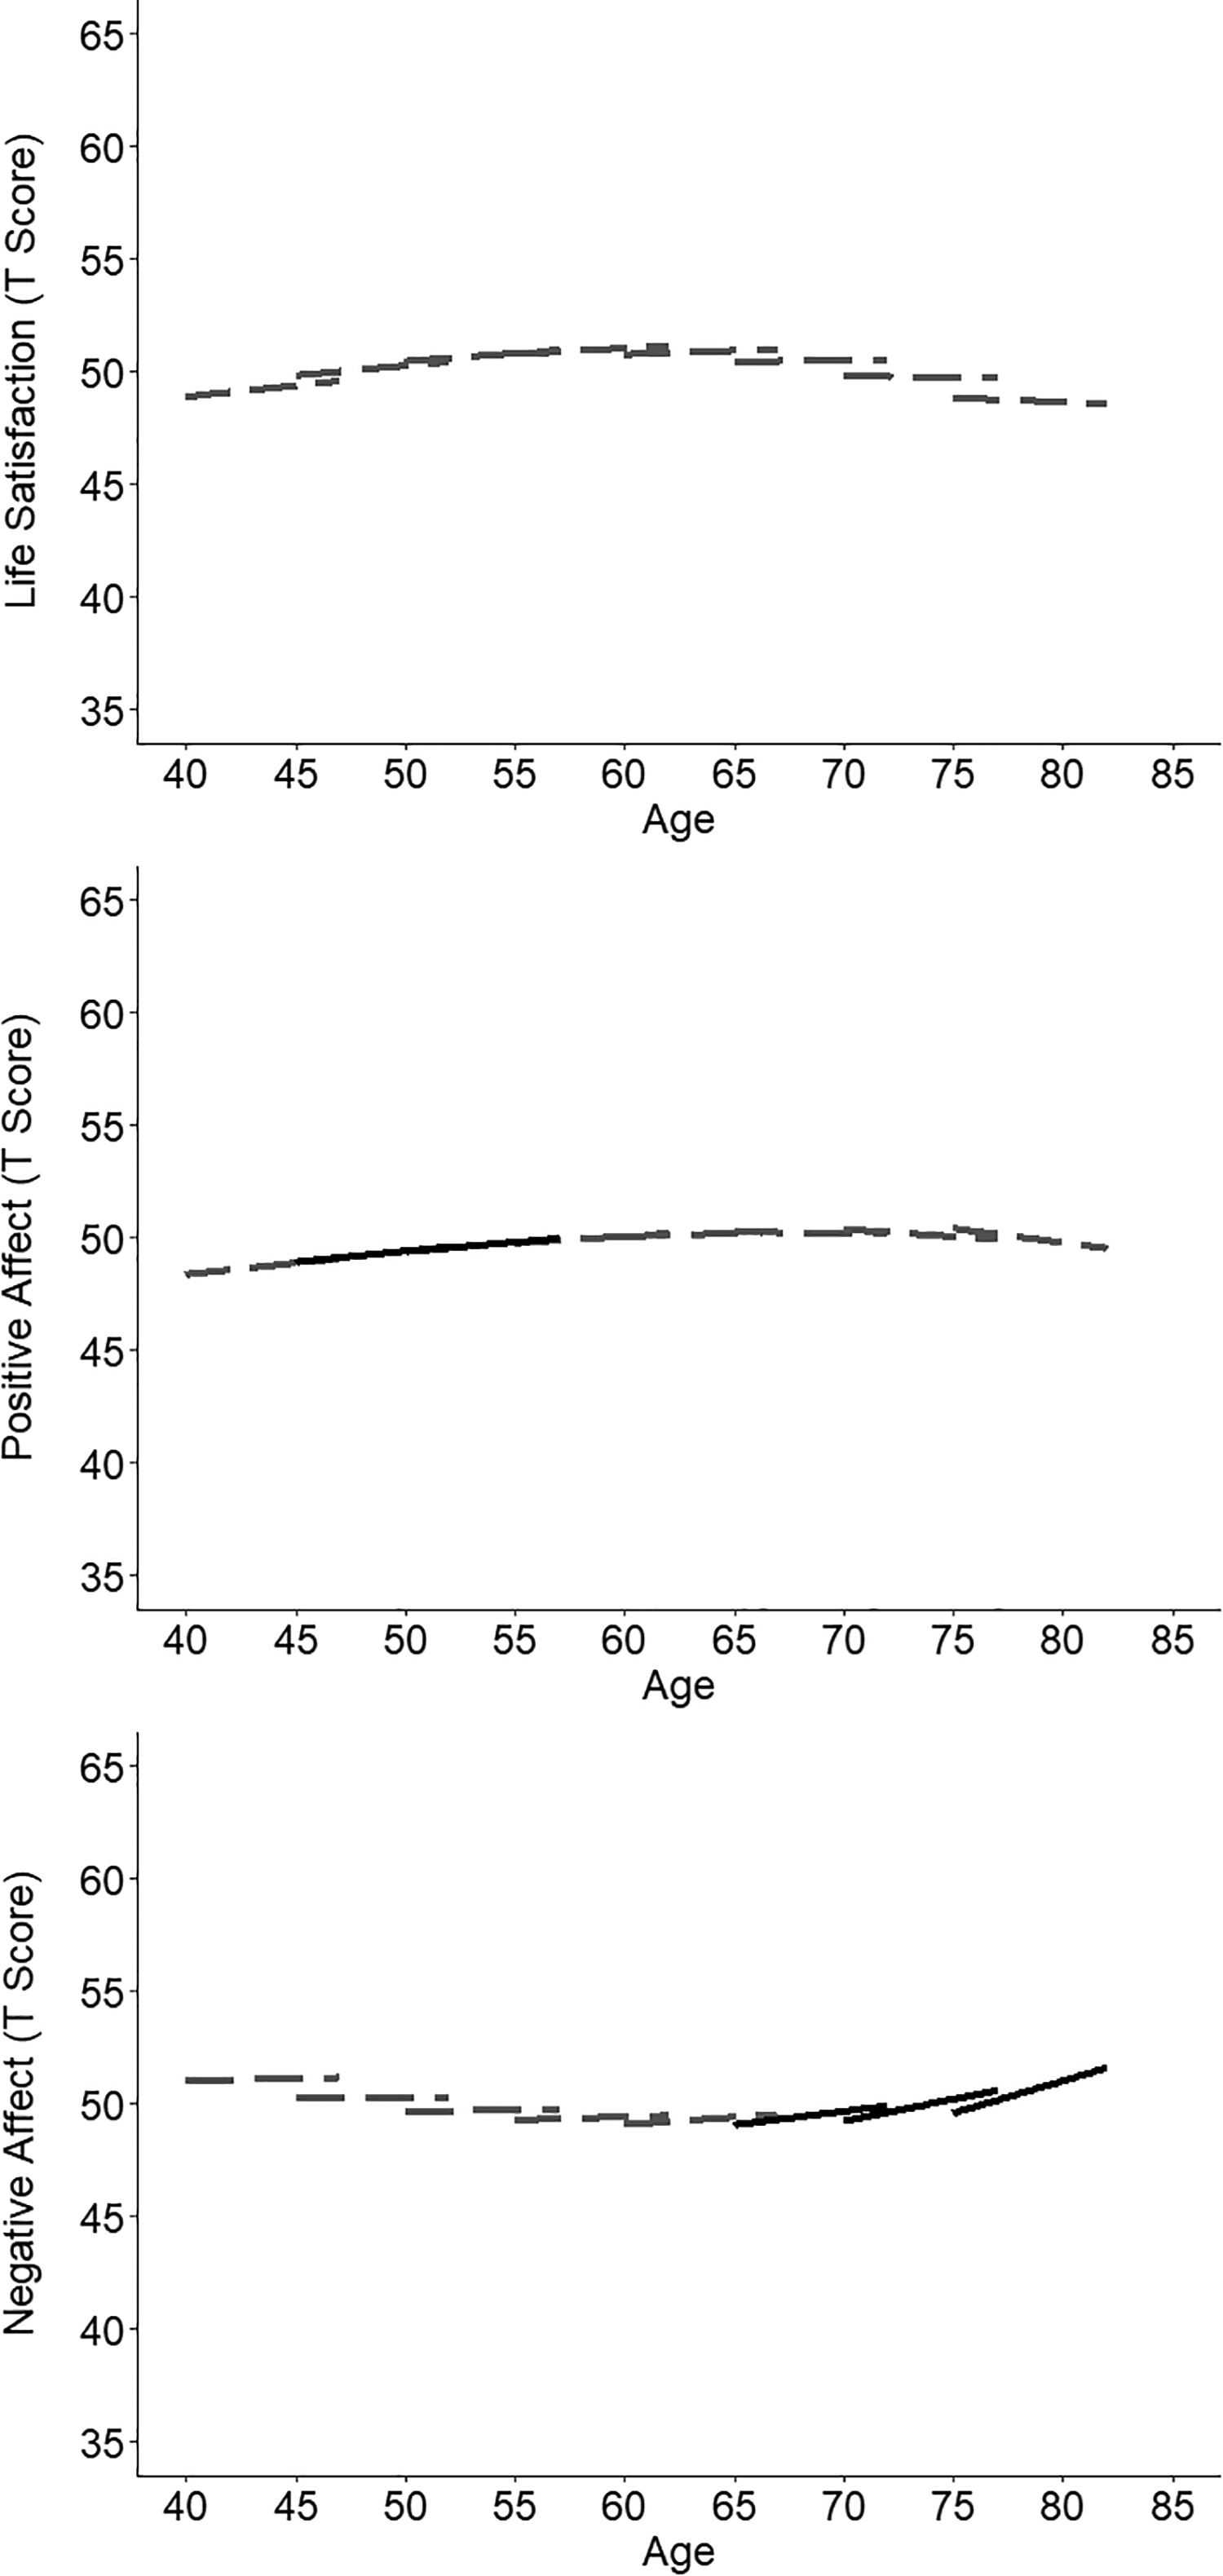
Full Model-Based Trajectories of Subjective Well-Being.
Base Models
The base models present age differences in levels and changes in SWB. As shown in Figure 1, differential patterns emerged across indicators. Regarding changes in life satisfaction, a U-shaped pattern was found: Whereas life satisfaction exhibited an accelerated increment in middle age, it declined and then leveled off in old age. Note that there were age differences in the linear, but not quadratic, change (see Table 2). Furthermore, longitudinal results presented that positive affect increased in midlife and decreased in late life. Also, negative affect remained stable in middle age but increased in old age.
Full Models
The full models show whether demographic, health, and methodological factors account for age-related changes in SWB. These models indicated that the demographic and health factors were associated with rates of change in well-being: Females reported more deteriorating trends in well-being across indicators than males—steeper declines in life satisfaction and positive affect and sharper increases in negative affect. Being married was initially related to better levels of well-being, but negative affect increased over time. Greater declines in IADL were related to steeper decrements in positive affect and sharper increases in negative affect. Similarly, larger increases in diseases were associated with steeper increments in negative affect. However, age differences in changes in well-being remained after controlling for correlates (see Tables 2, 3, and 4). Of note, increments in negative affect in old age were still observed, indicating that the study variables did not fully explain age-related changes in negative affect (Figure 2).
In the follow-up analyses, we contrasted participants who dropped out because of death or other reasons with those who remained in the study in Wave 7. The results indicated that participants who dropped out for reasons other than death had more exacerbating trajectories of well-being across indicators than those who continued in the study (Supplementary Table 2). However, attrition did not adequately account for changes in well-being.
Discussion
Adding to a body of longitudinal evidence accumulated in Western societies, the present study examined age-related changes in SWB in an Eastern society, namely Japan, using multiple indicators of SWB (life satisfaction, positive affect, and negative affect). The base models showed differential trends according to the well-being indicators. Specifically, in midlife, life satisfaction showed an accelerated increment in life satisfaction, positive affect increased, and negative affect remained stable. In late life, life satisfaction decreased and then leveled off, positive affect declined, and negative affect increased. Additionally, the full models, including correlates, suggested that demographic, health and methodological factors did not fully explain age-related changes in well-being, especially negative affect. We will first discuss the trajectories of each well-being component because the primary purpose of this study was to describe the trajectories of SWB.
Differential Trajectories of SWB
Based on life span and cross-cultural studies, we hypothesized that SWB would remain stable in middle age, but that differential patterns of SWB would be observed in old age depending on different indicators of well-being: Life satisfaction would remain stable, whereas positive and negative affects would increase. In line with our predictions, the stability of well-being across adulthood was observed for life satisfaction, but not for positive and negative affects.
Most studies have found that life satisfaction remains stable or increases in middle age and declines in old age across countries, with one exception (Gana et al., 2013). The present study found a U-shaped trend in life satisfaction, but the effect size of quadratic changes was modest. Thus, consistent with the earlier results, the overall life satisfaction increased in midlife and declined in late life. However, previous studies used measures such as the Satisfaction With Life Scale (Diener et al., 1985) and only assessed global evaluation of life satisfaction, whereas the current study used the LSI-K, which consists of multiple components. Moreover, the total score of the 8-item LSI-K and its core subscale, that is, satisfaction with life as a whole, showed relatively robust patterns in the follow-up analyses (Supplementary Table 3). Nevertheless, we also found slightly different trajectories in subscales. Evaluation of own aging, which is conceptually related to self-perception of aging, demonstrated a substantial decline across age-groups. Other longitudinal studies also reported that older adults showed a decline in positive self-perception of aging (Kleinspehn-Ammerlahn et al., 2008; Miche et al., 2014). Thus, it should be noted that the present trends of life satisfaction were confounded with age-related changes in how individuals perceived their own aging.
Previous findings on the trajectories of positive and negative affects have been mixed, and longitudinal evidence from non-Western countries remains sparse. The present study, similar to an earlier study in Taiwan (Chiao et al., 2009), found that overall, positive affect decreased and negative affect increased in old age. The longitudinal patterns of emotional well-being reported in Eastern societies are somewhat incongruent with most studies conducted in Western countries. Indeed, a cross-cultural study (Grossmann et al., 2014) indicated cultural variations in the association between age and negative affect. Therefore, the increase in negative affect in late life might be a distinctive feature of Eastern societies.
Correlates of SWB
The present study adopted a bottom-up perspective and examined whether the paucity or the loss of resources could account for age-related changes in well-being. We presumed that the association between older age and poorer SWB would be explained by gender, lower levels of educational attainment, spousal bereavement, greater prevalence of morbidity in older cohorts, and age-related functional impairments. The results indicated that only a few correlates, such as gender, marital status, and health, were associated with changes in well-being. Moreover, age variations in rates of change remained across components of well-being, even after controlling for the correlates. Consistent with previous studies in Eastern societies, being female and health decline was associated with deteriorating well-being trends. In contrast, being married was related to an increase in negative affect. Life events in one’s spouse, such as retirement or death, might also evoke negative affect. The time-varying nature of marital status and spousal information should be fully incorporated in future analyses.
SOC and SST using top-down perspectives suggest the mediating role of self-regulatory strategies on the relationship between age and well-being. Existing longitudinal studies, however, have not examined the pathways linking age, self-regulatory strategies, and well-being. Furthermore, although culture is expected to moderate the link between strategies to regulate emotions and well-being, the current study did not directly compare differences in trajectories of well-being across countries. Future research should integrate top-down and bottom-up frameworks and systematically investigate cultural differences in the association between age and well-being.
Limitations and Future Directions
The present study offers methodological advantages such as the multiple indicators of SWB, the wide age range, and the long observation period in comparison to previous studies conducted in Eastern societies (Chiao et al., 2009; Hsu, 2010; Lim et al., 2017). Nevertheless, the present study is not without limitations.
First, the measurement of the study variables raises several issues. Our well-being indicators were different from those used in some earlier studies. The LSI-K may cover relevant constructs such as self-perception of aging. Furthermore, we used the subscales of the CES-D as indicators of positive and negative affects. However, these subscales may not be “pure” measures of affect because they contain items that assess cognitive constructs such as self-esteem and optimism. At least, the most items showed consistent age variations in rates of changes (Supplementary Tables 4 and 5).
Second, changes in SWB in the oldest-old, 85 years and above, should be further examined. Relatively few participants (20.3% of our study sample) remained at follow-up after they entered the oldest-old age. Evidence in such very old age is still limited. A prior study of the oldest adults reported that the multidimensionality of well-being sustained and differential patterns emerged depending on its dimensions (Wettstein et al., 2015). Additionally, the follow-up analyses failed to find a decline in well-being with impending death. However, an earlier study has reported that a terminal decline in life satisfaction occurred approximately 4 years before death (Gerstorf et al., 2008). Future research should take the timing of death into consideration and investigate changes at the end of life more closely.
Third, the available results from Eastern societies have been from relatively wealthy countries such as Korea and Taiwan, which might not be generalized to developing Asian neighbors. An earlier study (Swift et al., 2014) indicated that societal wealth accounted for the stability of well-being across adulthood: Age differences in well-being were absent in more wealthy countries, although older adults reported lower levels of well-being than young adults in less wealthy countries. There might be societal-level determinants of individuals’ well-being.
Conclusion
The current study provided a descriptive overview of multifaceted SWB in middle-aged and older Japanese. Extending prior research mostly conducted in Western societies, we found differential trends in well-being across indicators: In middle age, life satisfaction demonstrated an accelerated increment, positive affect increased, and negative affect remained stable. In old age, however, life satisfaction decreased but leveled off, positive affect decreased, and negative affect increased. We note that demographic, health, and methodological correlates did not fully explain the age-related changes in well-being, especially negative affect in late life, which did not support bottom-up perspectives. Cross-cultural literature suggests that sociocultural contexts shape trajectories of well-being, but longitudinal evidence is still lacking except in Western societies. Further examination of cultural variations in SWB across adulthood is needed to better understand how well individuals adapt to age-related challenges around the world.
Supplemental Material
JBD914985_supplemental_material - Stability and change in well-being among middle-aged and older Japanese
JBD914985_supplemental_material for Stability and change in well-being among middle-aged and older Japanese by Takeshi Nakagawa, Yukiko Nishita, Chikako Tange, Makiko Tomida, Kaori Kinoshita, Rei Otsuka, Fujiko Ando and Hiroshi Shimokata in International Journal of Behavioral Development
Footnotes
Acknowledgments
We would like to thank all participants and staff involved in the NILS-LSA study. Also, we appreciate the technical help in data visualization by Yasunori Kinosada at Shizuoka University of Science and Technology.
Funding
The author(s) disclosed receipt of the following financial support for the research, authorship, and/or publication of this article: This work was supported by the JSPS KAKENHI (grant number 18J00674) and the Research Funding for Longevity Sciences from the National Center for Geriatrics and Gerontology, Japan (grant number 28-40, 19-10).
Supplemental Material
Supplemental material for this article is available online.
References
Supplementary Material
Please find the following supplemental material available below.
For Open Access articles published under a Creative Commons License, all supplemental material carries the same license as the article it is associated with.
For non-Open Access articles published, all supplemental material carries a non-exclusive license, and permission requests for re-use of supplemental material or any part of supplemental material shall be sent directly to the copyright owner as specified in the copyright notice associated with the article.