
Abstract
Wagner, J., Luyster, R.J., Moustapha, H., Tager-Flusberg, H., and Nelson, C. A. (2016). Differential attention to faces in infant siblings of children with autism spectrum disorder and associations with later social and language ability. International Journal of Behavioral Development. Epub ahead of print. doi: 10.1177/0165025416673475
Owing to errors made by SAGE, the above mentioned article, first published online on November 8th 2016, contained errors.
SAGE apologises to the authors and to the readers. The following corrections apply:
Line 6 of the article abstract originally read ‘For time scanning faces overall, HRA- and LRC showed similar patterns of attention, and this was significantly greater than in HRA-.’ This has been corrected to read ‘For time scanning faces overall, HRA+ and LRC showed similar patterns of attention, and this was significantly greater than in HRA-.’
The last line of the caption for Figure 2 originally read ‘Error bars are + standard error to the mean.’ This has been corrected to read ‘Error bars are +/- standard error to the mean.’
The formatting of Table 2 was incorrect. The correct table is presented below:
Communication and Symbolic Behavior Scales and Mullen Scales of Early Learning means (standard deviations in parentheses) for Low-risk Controls and High-risk Autism with and without a later Autism Spectrum Disorder diagnosis.
Note. Communication and Symbolic Behavior Scales at 18 months missing for 12 Low-risk Controls, 6 High-risk Autism with no diagnosis, and 2 High-risk Autism with an Autism Spectrum Disorder diagnosis; Mullen Scales of Early Learning at 18 months missing for 8 Low-risk Controls and 2 High-risk Autism with an Autism Spectrum Disorder diagnosis (see Method for more detail).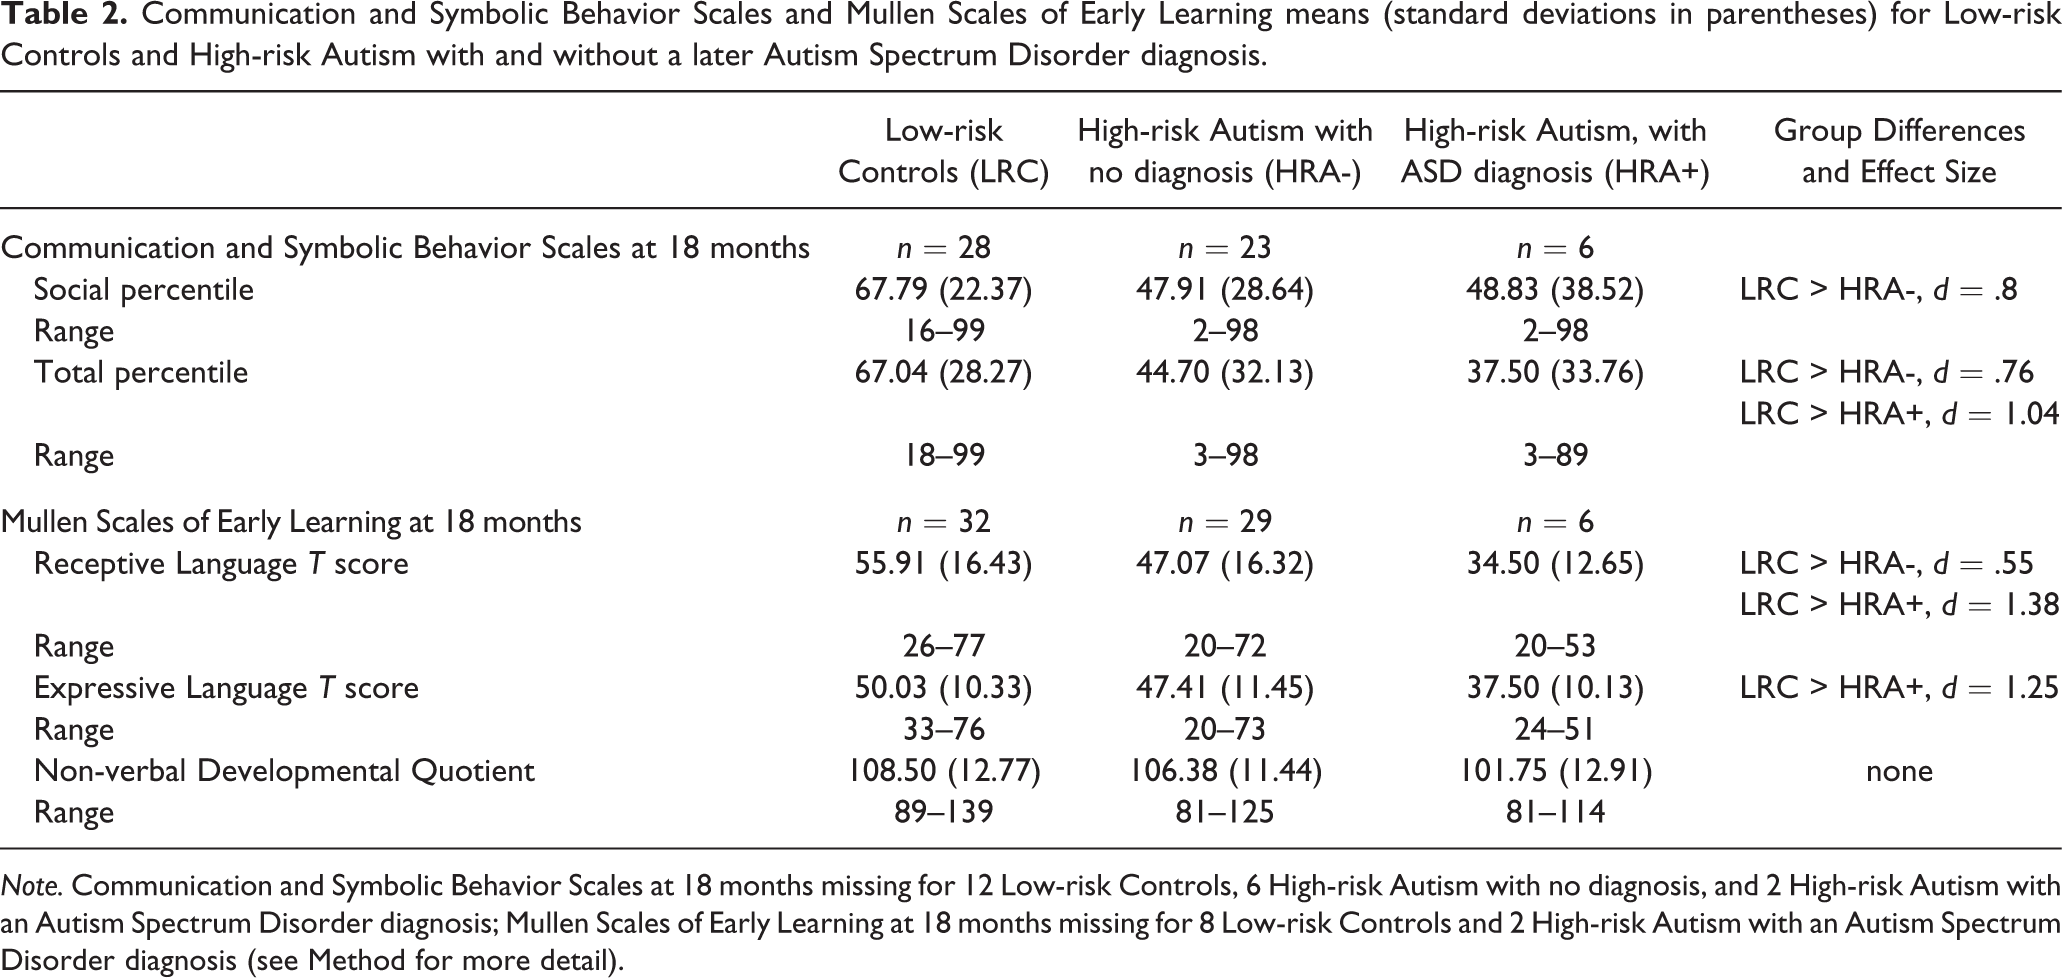
Low-risk Controls (LRC)
High-risk Autism with no diagnosis (HRA-)
High-risk Autism, with ASD diagnosis (HRA+)
Group Differences and Effect Size
Communication and Symbolic Behavior Scales at 18 months
n = 28
n = 23
n = 6
Social percentile
67.79 (22.37)
47.91 (28.64)
48.83 (38.52)
LRC > HRA-, d = .8
Range
16–99
2–98
2–98
Total percentile
67.04 (28.27)
44.70 (32.13)
37.50 (33.76)
LRC > HRA-, d = .76 LRC > HRA+, d = 1.04
Range
18–99
3–98
3–89
Mullen Scales of Early Learning at 18 months
n = 32
n = 29
n = 6
Receptive Language T score
55.91 (16.43)
47.07 (16.32)
34.50 (12.65)
LRC > HRA-, d = .55 LRC > HRA+, d = 1.38
Range
26–77
20–72
20–53
Expressive Language T score
50.03 (10.33)
47.41 (11.45)
37.50 (10.13)
LRC > HRA+, d = 1.25
Range
33–76
20–73
24–51
Non-verbal Developmental Quotient
108.50 (12.77)
106.38 (11.44)
101.75 (12.91)
none
Range
89–139
81–125
81–114
These corrections have been made in the most recent online version of the article, and will also be included in all subsequent versions of the article online and in print.
Get full access to this article
View all access options for this article.