
Abstract
The Everyday Ageism Scale is a self-report measure of ageism in older adults. To our knowledge, this scale has yet to undergo item response theory (IRT) analysis to evaluate its item-level properties. Our objective was to evaluate its reliability, structural validity, and item functioning. We conducted confirmatory factor analysis and IRT using data collected from 486 older adults. The Everyday Ageism Scale demonstrated acceptable McDonald’s omega coefficients and good model fit with its previously identified three-factor structure. Our findings also revealed items that provided the highest level of measurement precision and adequately/inadequately differentiated between respondents reporting varying levels of ageism. The Everyday Ageism Scale is a valid and reliable instrument for assessing ageism among North American older adults, though items 8-10 may require refinement to improve their discriminatory and predictive power. Future investigations are needed to establish cross-cultural validation.
Introduction
Ageism, referring to stereotypes, discrimination, or prejudice due to a person’s age (Butler, 1969; Officer & de la Fuente-Núñez, 2018), is highly prevalent in North America (Allen et al., 2022a). Older adults experience ageism at disproportionately higher rates than any other age group; a global survey of over 83,000 respondents revealed that one in two people hold ageist attitudes towards older persons (Officer et al., 2020). Ageism can be self- or other-directed, conveyed implicitly or explicitly, and expressed as either negative (e.g., characterizing older adults as frail or forgetful) or positive (e.g., as wise; Iversen et al., 2009). Ageism towards older persons is widespread in society (e.g., employment, healthcare, media) and a well-established risk factor for worse physical and mental health outcomes (Castillo et al., 2022; Chang et al., 2020; Kang & Kim, 2022). As a result, the effects of ageism have been found to impose a significant economic burden on the healthcare system (Levy et al., 2020).
Although several tools currently exist for assessing ageism, measurement has been recognized as a key issue in ageism research (Ayalon et al., 2019; Hu et al., 2021). Specifically, a systematic review of existing ageism measures determined that the vast majority fail to capture all dimensions of ageism (i.e., stereotypes, discrimination, prejudice) and lack appropriate psychometric validity (Ayalon et al., 2019). To address the need for instruments that assess the multidimensional nature of ageism experienced by older adults in their daily lives, the Everyday Ageism Scale was developed (Allen et al., 2022b). The Everyday Ageism Scale consists of 10 items that measure the frequency and extent of ageism towards older adults across three identified factors: (1) exposure to ageist messages; (2) ageism in interpersonal interactions; and (3) internalized ageism (Allen et al., 2022b). Four validation studies of the Everyday Ageism Scale scale using samples from the United States (Allen, 2025; Allen et al., 2022b), China (Zhang & Zhang, 2024), and Korea (Kim & Park, 2024) have been published to date.
Pre-existing validation results have supported the content, convergent, and known-group validity of the Everyday Ageism Scale, and demonstrated that higher scores were associated with adverse mental and physical health outcomes (Allen, 2025; Allen et al., 2022b). Moreover, Allen (2025) confirmed the three factor-structure of the scale (i.e., exposure to ageist messages, ageism in interpersonal interactions, and internalized ageism) using a sample of 237 adults aged ≥50 years in the United States. To our knowledge, however, the Everyday Ageism Scale has yet to undergo psychometric evaluation using item response theory (IRT) analysis. Given the need for systematic evaluation of item functioning of the Everyday Ageism Scale, we sought to examine the psychometric properties of this multidimensional measure through IRT.
In summary, the objective of this study was to extend and replicate Allen’s (2025) confirmatory factor analysis (CFA) results using a larger sample and through the addition of IRT analysis. As such, we were able to assess each item’s ability to differentiate between respondents reporting low versus high levels of ageism, and the likelihood of item endorsement in relation to level of experienced ageism. More broadly, this investigation helps address important gaps in the research literature regarding the need for more psychometric assessments of ageism measures, thereby supporting future research and clinicians in more reliably examining the prevalence and impact of ageism on older adults.
Methods
Sampling Strategy and Data Collection
Data were collected from across North America using Qualtrics Panels, an online survey sampling and administration company, in January 2024. Our data collection protocol was approved by the University of Regina Research Ethics Board (#2023-417) on November 2, 2023, and all participants provided informed consent prior to beginning the online survey. This data were collected as part of a larger project (Arsenault et al., 2025a, 2025b), and we have not yet published results from this CFA and IRT analysis of the Everyday Ageism Scale. Qualtrics Panels’ sampling strategy and compensation procedures for this study are described elsewhere (Arsenault et al., 2025a). Eligibility criteria included being a resident of North America, ≥65 years of age, a member of Qualtrics Panels, and able to read and understand English. The final sample comprised 486 older adults with a mean age of 71.62 (SD = 5.20). Most respondents self-identified as White (92.8%), of European descent (68.3%), and cisgender female (50.4%). Other demographic information can be found elsewhere (Arsenault et al., 2025a).
Measures
Everyday Ageism Scale
The Everyday Ageism Scale (Allen et al., 2022b) is a 10-item self-report measure of ageism. This measure consists of three factors which correspond to a previously identified three-factor structure (Allen et al., 2022b): (1) exposure to ageist messages; (2) ageism in interpersonal interactions; and (3) internalized ageism. The exposure to ageist messages subscale consists of two items measuring how often older adults have been exposed to everyday ageist events (e.g., “I hear, see, and/or read things suggesting that older adults and aging are unattractive”) on a 4-point Likert scale ranging from 0 (never) to 3 (often). The ageism in interpersonal interactions subscale consists of five items measuring how often older adults have experienced ageism during everyday interpersonal interactions (e.g., “People assume I do not do anything important or valuable”) using the same 4-point Likert scale above. The internalized ageism subscale consists of three items that assess the extent to which older adults endorse age-related stereotypes (e.g., “Feeling lonely is part of getting older”) on a 4-point Likert scale ranging from 0 (strongly disagree) to 3 (strongly agree). An overall score is obtained by adding the scores of all the items, and can range from 0 to 30. The Everyday Ageism Scale showed adequate reliability in its original validation sample (α = .75-.78; Allen et al., 2022b). Reliability was adequate-to-good in this sample (ω = .78-.82).
Analysis
Reliability
To further assess reliability, corrected item-total correlations were calculated using IBM SPSS 28.0.0.0. Corrected item-total correlations measure the association between an individual item on the Everyday Ageism Scale and the total score of the other scale items. Items with correlations between .30 and .70 are considered acceptable, and items with correlations <.30 may warrant revision or removal from the scale (Ferketich, 1991).
Confirmatory Factor Analysis
Descriptive Statistics of Everyday Ageism Scale Items
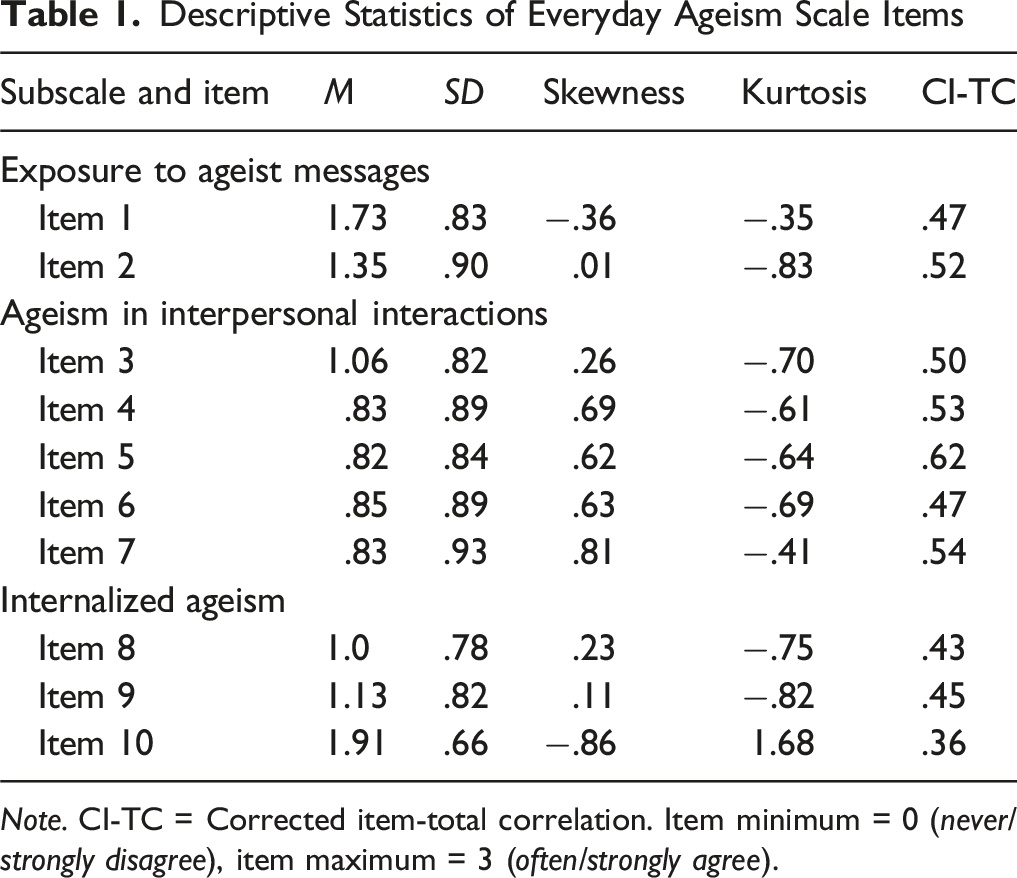
Note. CI-TC = Corrected item-total correlation. Item minimum = 0 (never/strongly disagree), item maximum = 3 (often/strongly agree).
Item Response Theory
IRTPRO 6 was used to conduct an IRT analysis of the Everyday Ageism Scale. IRT predicts the likelihood that a respondent will select or endorse a specific item response based on their underlying trait level, referred to as theta (Reise & Waller, 2009). IRT places both the respondent and scale items along a continuum that represents the full range of the underlying trait (i.e., level of experienced ageism). We used the graded response model (GRM; Samejima, 1969) to estimate item parameters, as this IRT model is designed to examine the properties of ordinal, Likert scale items, such as those on the Everyday Ageism Scale.
IRTPRO 6 calculates item characteristic curves and an item information function for each item on the Everyday Ageism Scale. The item characteristic curves illustrate how the probability of endorsing a particular response option changes across different levels of the latent trait of ageism, helping to identify where each scale item is most effective in distinguishing between respondents with higher versus lower trait levels (Embretson & Reise, 2013). The item information function evaluates how much measurement precision or information a given item provides at each different point along the trait level continuum (Toland, 2014).
In the GRM, there are specific parameter estimates for each item, including a discrimination parameter (a) and threshold parameters (b). The discrimination parameter reflects how well an item differentiates between respondents at different levels of the trait being measured. As a rule of thumb, items of higher discrimination parameters contribute more item information to the scale, and values >1 reflect good discriminatory abilities (Reise & Waller, 2009). The number of threshold parameters for a given item depends on the number of response categories it includes; specifically, there is one fewer threshold than the number of categories. In the case of the Everyday Ageism Scale, each item contains four response options and therefore has three threshold parameters (i.e., b 1 , b 2 , b 3 ). Each of the threshold parameters represent points along the latent trait continuum where a respondent has a 50% probability of choosing a particular response category or higher (e.g., rarely/disagree or higher; Toland, 2014).
Results
Everyday Ageism Scale Scores and Reliability
Table 1 presents the descriptive statistics for all item scores on the Everyday Ageism Scale. The complete frequency distributions of item responses can be found in the Supplemental Materials. All corrected item-total correlations were found to be moderate-to-strong, with values exceeding .30 (Table 1). Respondents had an average total score of 11.50 (SD = 5.11).
Confirmatory Factor Analysis
Standardized Loadings of Everyday Ageism Scale Items
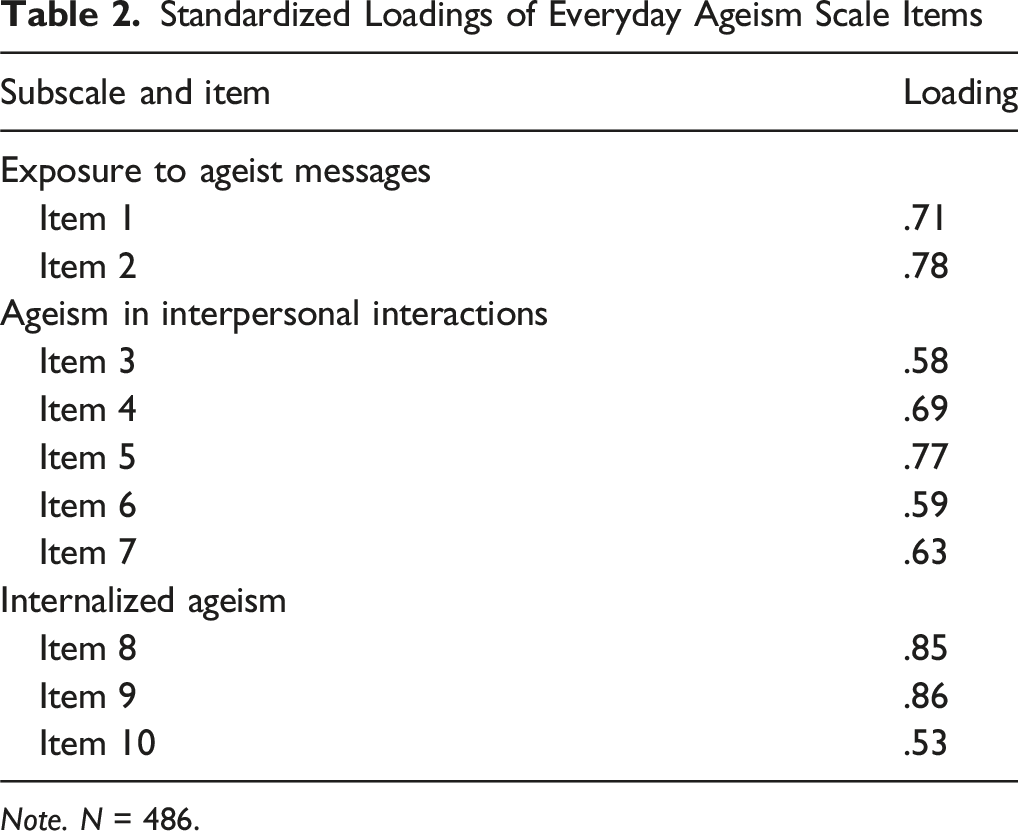
Note. N = 486.
Item Response Theory Analysis
Item Information Estimates on the Everyday Ageism Scale
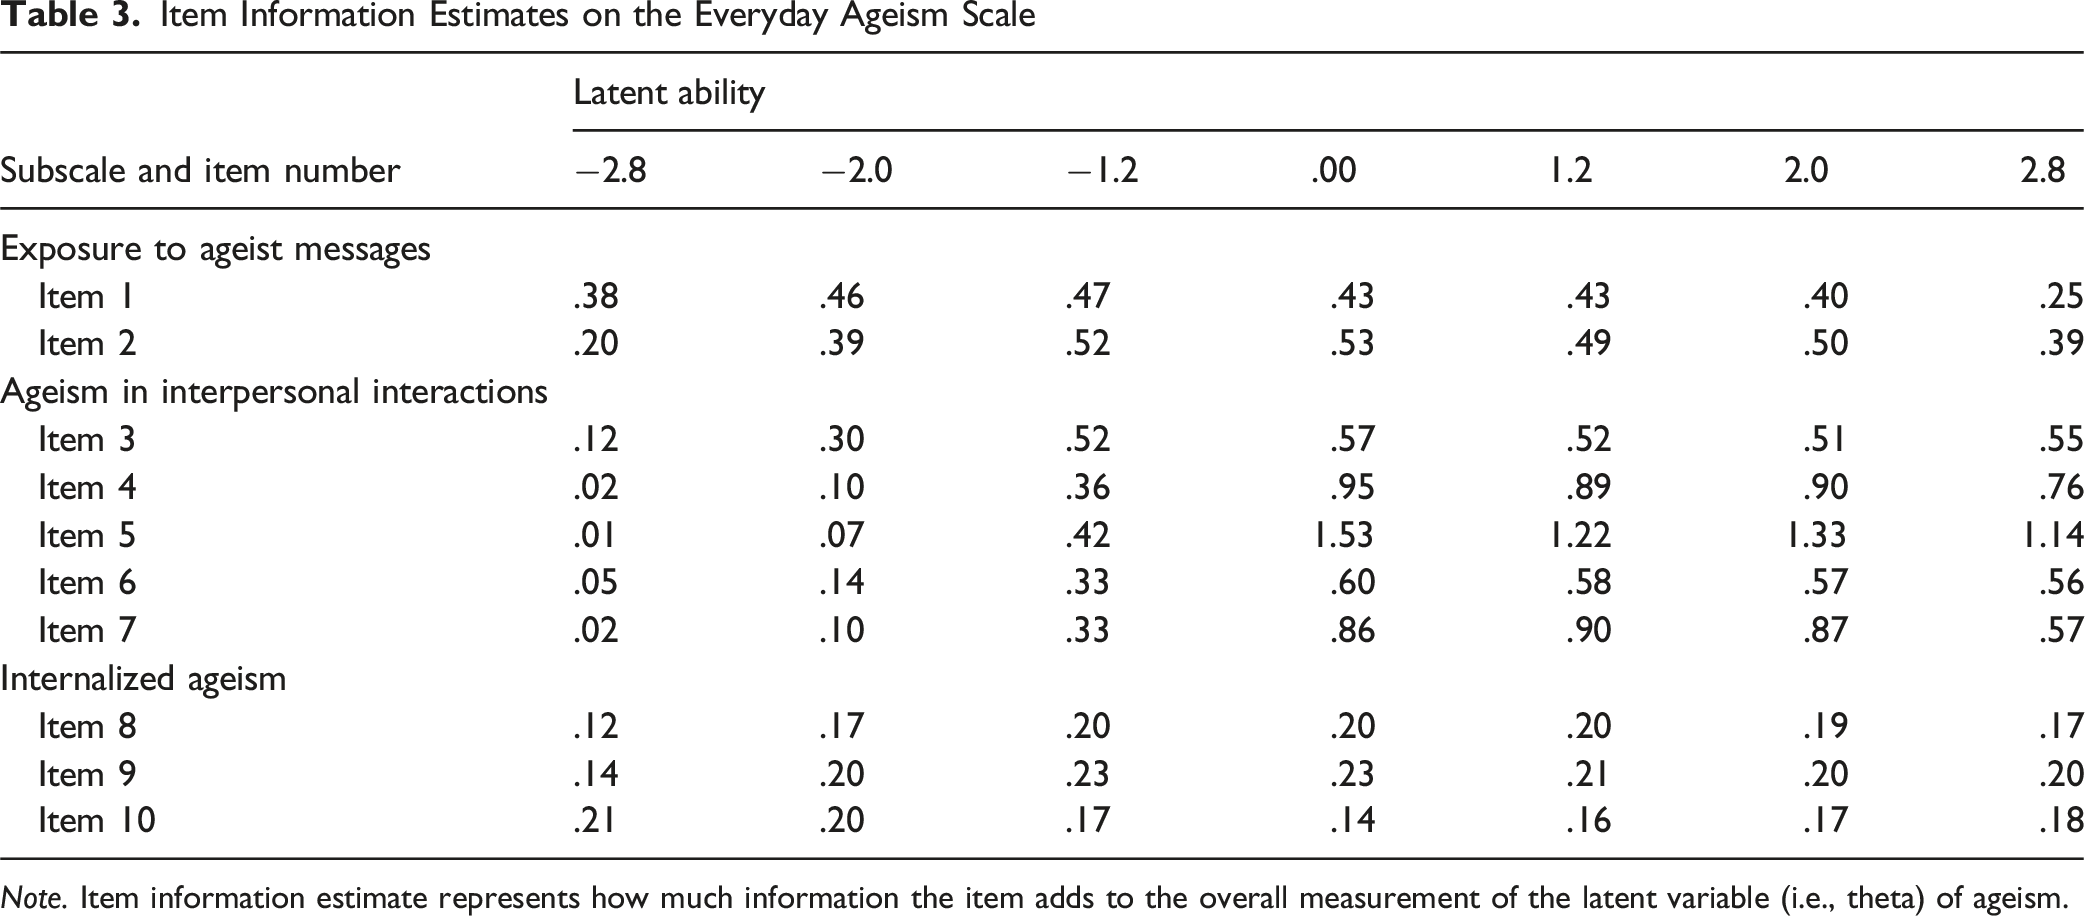
Note. Item information estimate represents how much information the item adds to the overall measurement of the latent variable (i.e., theta) of ageism.
Parameter Estimates (Standard Errors) for Everyday Ageism Scale Items
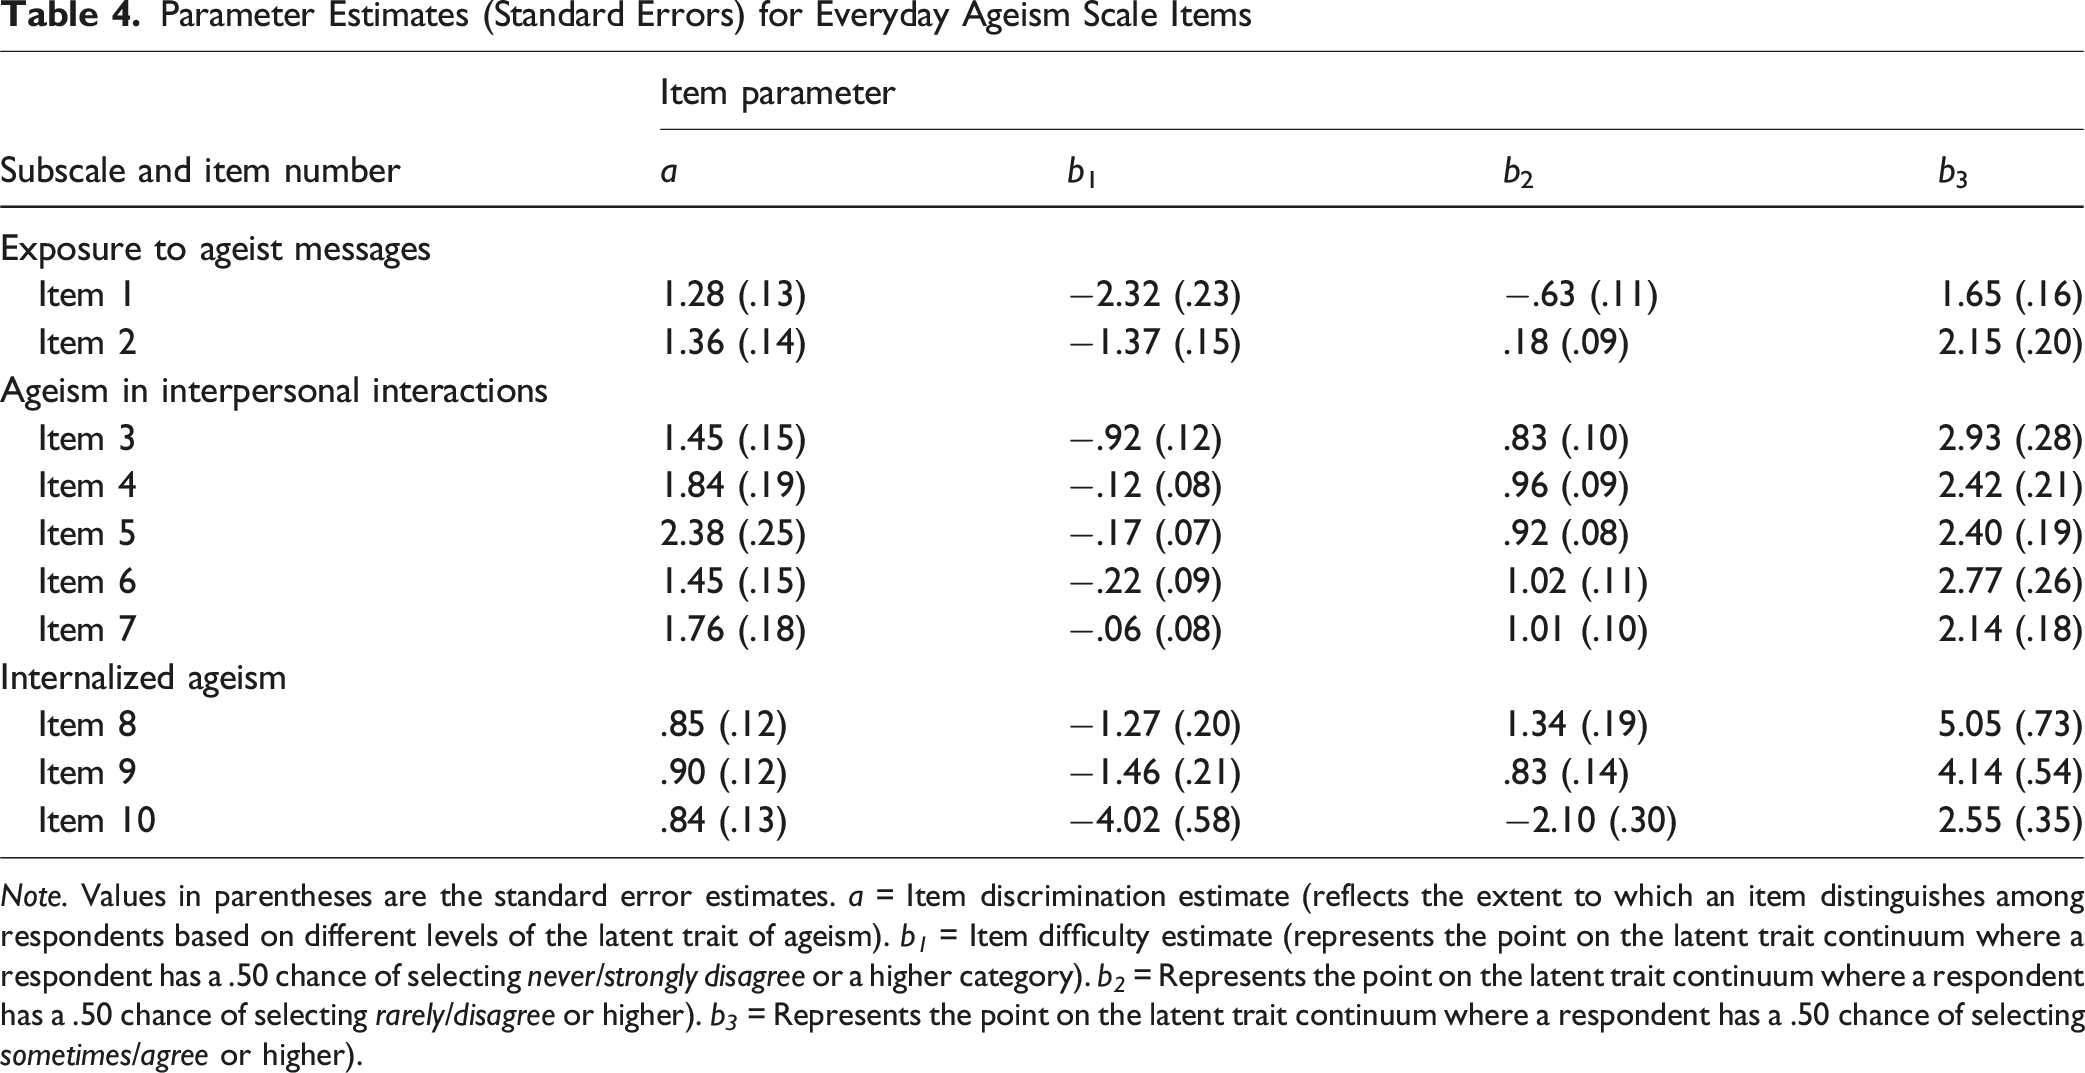
Note. Values in parentheses are the standard error estimates. a = Item discrimination estimate (reflects the extent to which an item distinguishes among respondents based on different levels of the latent trait of ageism). b 1 = Item difficulty estimate (represents the point on the latent trait continuum where a respondent has a .50 chance of selecting never/strongly disagree or a higher category). b 2 = Represents the point on the latent trait continuum where a respondent has a .50 chance of selecting rarely/disagree or higher). b 3 = Represents the point on the latent trait continuum where a respondent has a .50 chance of selecting sometimes/agree or higher).
Across all items, slope parameter estimates ranged from .84 for item 10 (i.e., “Having health problems is part of getting older”) to 2.38 for item 5 (i.e., “People assume I have difficulty remembering and/or understanding things”). Items 8, 9, and 10 were found to have lower slope parameter values (i.e., <1) and had characteristically flat item characteristic curves compared to the other scale items. This can be seen in Figure 1 by comparing their characteristic curves with item 5, which had the highest slope parameter (i.e., the best item to distinguish between high versus low ageism) and contributed the most information to the overall scale. In addition, for item 10 there is a higher probability of endorsing response option 2 (agree) than 1 (disagree), suggesting that it does not effectively discriminate among older adults experiencing varying levels of ageism. Taken together, these results indicate limited item discrimination and low predictive value across the ageism trait continuum for the three items. Item Characteristic Curves of Items 5, 8, 9, and 10 on the Everyday Ageism Scale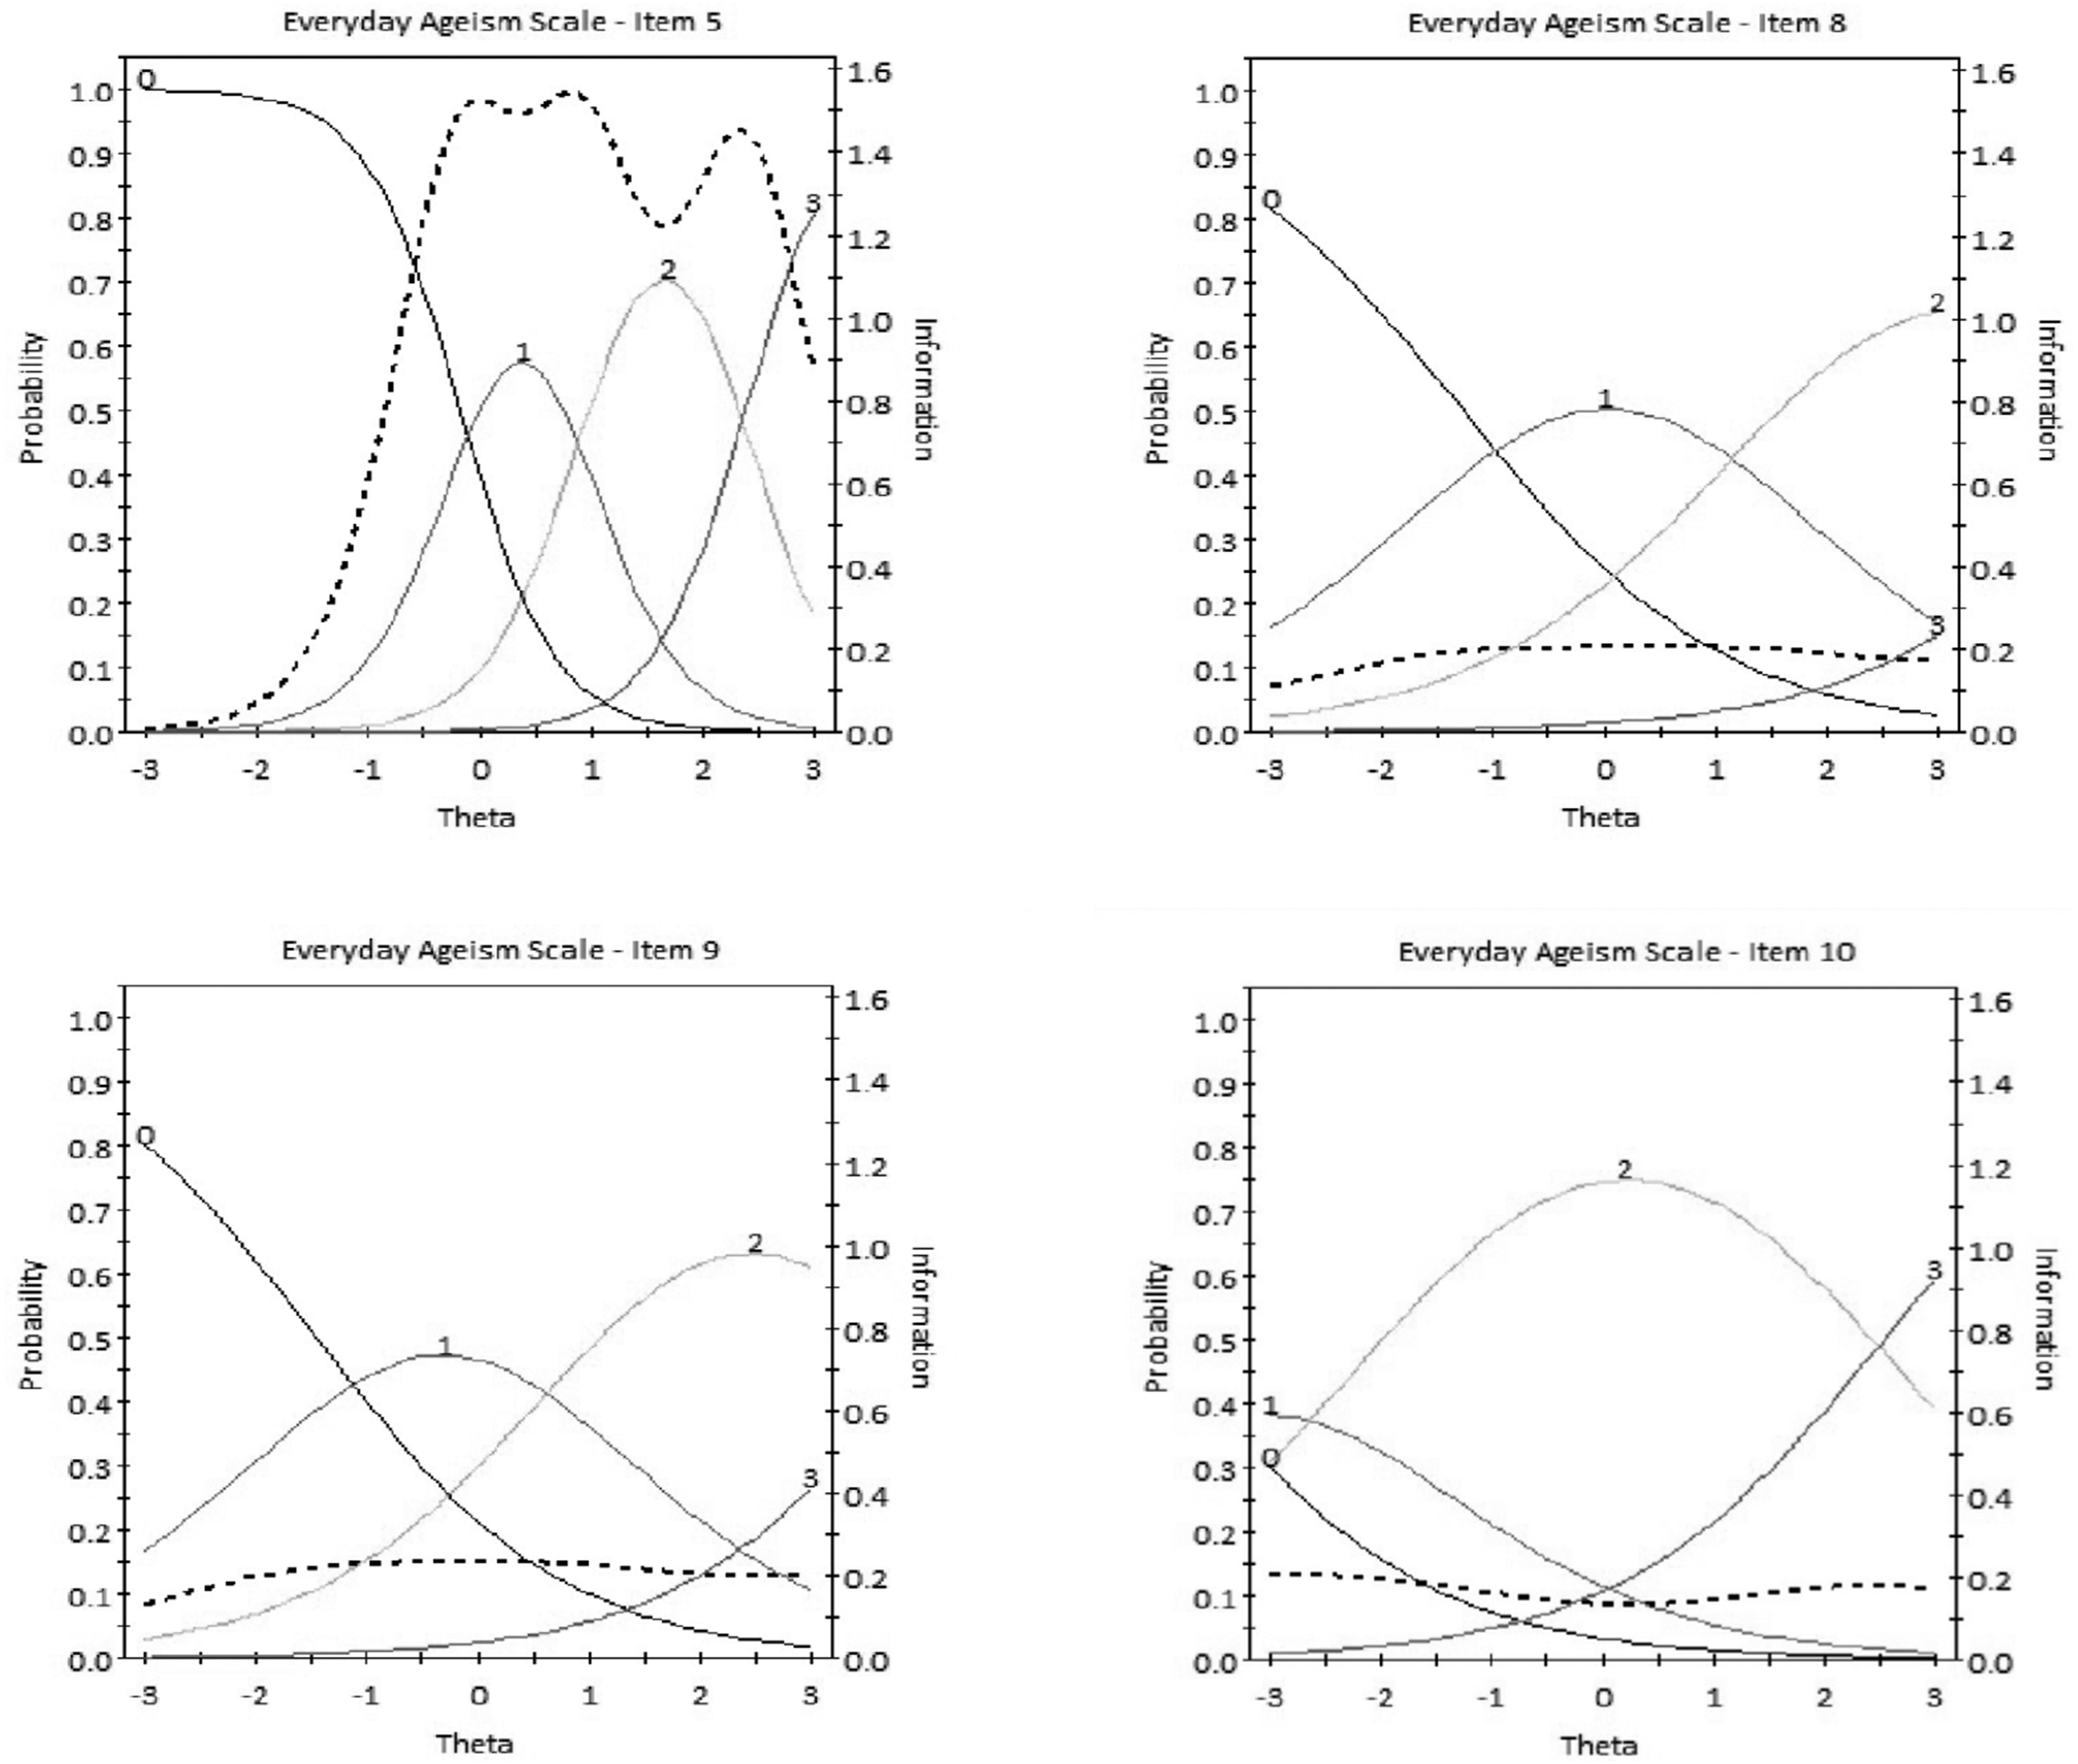
Discussion
This study replicated and extended the findings of Allen (2025) by confirming the three-factor structure of the Everyday Ageism Scale using a larger sample and conducting the first IRT analysis of the measure in a North American context. This psychometric evaluation of the Everyday Ageism Scale was important given that it is the only published multidimensional measure of ageism, and as identified by Ayalon et al. (2019), there is a dearth of psychometric evaluations of existing ageism scales. As such, our findings have implications for both clinical practice and researchers interested in investigating the impacts of ageism on the older adult population. Specifically, our results obtained from robust CFA procedures provide strong support for the three-factor structure of the Everyday Ageism Scale and independently confirm the findings of Allen (2025), which were based on a sample of older adults from the United States. Similar psychometric support has been obtained with Chinese (Zhang & Zhang, 2024) and Korean (Kim & Park, 2024) samples. The reliability of the Everyday Ageism Scale was also supported in our study by acceptable McDonald’s Omega and corrected item-total correlation coefficients. Considering the high global prevalence of ageism (Officer et al., 2020), however, it will be important for future studies to further confirm the psychometric properties of the Everyday Ageism across diverse cultural and geographic samples of older adults.
Based on the graded response model, which signifies the probability of respondents endorsing each response category on the Everyday Ageism Scale, the b3 parameter values for items 8 (i.e., “Feeling depressed, sad, or worried is part of getting older”) and 9 (i.e., “Feeling lonely is part of getting older”) were substantially higher than those of any of the other items. This indicates that to have an equal probability of endorsing agree or higher, respondents need to experience very high levels of the latent trait of ageism. In contrast to more overt or externalized expressions of ageism, these specific Everyday Ageism Scale items require respondents to personally identify with age-related stereotypes and integrate them into their self-concept. These findings may be explained by stereotype embodiment theory, proposed by Levy (2009), which suggests that lifelong exposure to age-related stereotypes can lead individuals to internalize them, either consciously or unconsciously. It is therefore possible that older adult respondents who are more frequently exposed to ageist messages and interactions in their daily lives are also likely to internalize and endorse age-related biases. The high threshold parameters, however, likely indicate that items 8 and 9 are most effective at capturing extreme manifestations of internalized ageism, potentially limiting their ability to detect respondents endorsing more moderate levels of the latent trait.
Our IRT analysis also revealed that items 1-7 on the Everyday Ageism Scale are capable of effectively distinguishing respondents across different levels of the latent trait of ageism. However, the items within the internalized ageism subscale (i.e., 8-10) were found to have low discriminatory value for identifying older adults holding ageist beliefs about themselves. The response categories do not exhibit distinct peaks in their characteristic curves (Figure 1), indicating that respondents may not be using the categories consistently or as intended. As a result, these items provide limited discrimination across levels of the latent trait of ageism and reduce their overall utility in the scale. Given that these three items were found to not be performing adequately, this suggests an important opportunity for item refinement to improve the psychometric functioning of the Everyday Ageism Scale. Future investigations could explore ways of refining these items to enhance their ability to distinguish between individuals who internalize ageist beliefs and those who do not. Item 5 (i.e., “People assume I have difficulty remembering and/or understanding things”) demonstrated the strongest discrimination and offered the greatest measurement precision among all items. These findings may relate to cognitive or memory decline being one of the most prevalent age-related stereotypes within the older adult population (Barber, 2017; Régner & Huguet, 2025). As such, the item’s relevance to respondents may be contributing to its ability to elicit distinct response patterns across varying levels of the latent trait of ageism.
Limitations
This study is limited by our reliance on an online survey method, which may restrict the generalizability of our findings to older adults who do not use the internet. It will be important for any future psychometric analyses of the Everyday Ageism Scale to incorporate other recruitment strategies, such as newspaper or radio advertisements, to engage non-internet users or individuals living in remote rural areas. It is also important to note that the majority of individuals in our sample were White and of European descent. Any future cross-validations of the Everyday Ageism Scale should involve a more racially and ethnically diverse sample of older adults to confirm the reliability, validity, and item functioning of the measure with a broader range of demographic groups.
Conclusion
Based on analyses with a large sample of older adults from North America, our results confirm that the Everyday Ageism Scale is both a valid and reliable measure of ageism. Consistent with the original structure proposed by Allen et al. (2022b) and previous research (e.g., Allen, 2025), our CFA analysis suggested evidence that the Everyday Ageism Scale is best represented by a three-factor structure. According to the IRT analysis, most items demonstrated sufficient discriminatory power, suggesting that they are able to differentiate between respondents experiencing varying levels of ageism. However, all items within the internalized ageism subscale (i.e., 8-10) showed insufficient discriminatory and predictive power, indicating a likely need for revision or refinement to strengthen the overall effectiveness of the measure. Further examination of cross-cultural reliability and validity will also be valuable in extending upon this work and determining whether our results can be replicated across more diverse samples.
Supplemental Material
Supplemental Material - Validation of the Everyday Ageism Scale Using Confirmatory Factor Analysis and Item Response Theory
Supplemental Material for Validation of the Everyday Ageism Scale Using Confirmatory Factor Analysis and Item Response Theory by Kylie A. Arsenault, Ying C. MacNab, & Thomas Hadjistavropoulos in Research on Aging
Footnotes
Ethical Considerations
Our data collection protocol was approved by the University of Regina Research Ethics Board (#2023-417) on November 2, 2023.
Consent to Participate
All participants provided informed consent prior to beginning the online survey.
Funding
The authors disclosed receipt of the following financial support for the research, authorship, and/or publication of this article: This work was supported in part by the Saskatchewan Health Research Foundation (grant number 2908) and the Canadian Institutes of Health Research Institute of Aging (Betty Havens Prize - 2023).
Declaration of Conflicting Interests
The authors declared no potential conflicts of interest with respect to the research, authorship, and/or publication of this article.
Data Availability Statement
Data are available from the corresponding author upon reasonable request for a period of seven years following publication and subject to approval from our institutional research ethics board.
Supplemental Material
Supplemental material for this article is available online.
Author Biographies
References
Supplementary Material
Please find the following supplemental material available below.
For Open Access articles published under a Creative Commons License, all supplemental material carries the same license as the article it is associated with.
For non-Open Access articles published, all supplemental material carries a non-exclusive license, and permission requests for re-use of supplemental material or any part of supplemental material shall be sent directly to the copyright owner as specified in the copyright notice associated with the article.