
Abstract
Population aging and increasing retirement rates are reshaping physical activity (PA) and health among older adults worldwide. Using the China General Social Survey data (CGSS), this study applies a fuzzy regression discontinuity design to estimate the causal impact of retirement on PA among Chinese older adults. We find that retirement significantly increases PA frequency. The effect is amplified by higher income and better health, but is weakened by psychological stress. Causal forest analysis reveals pronounced heterogeneity: income consistently emerges as the most influential moderator, while the importance of social participation, intergenerational caregiving, and urban-rural residency rises notably once provincial clustering is considered. Regional disparities also persist, with stronger effects in the eastern provinces, contrasted by more mixed and uneven patterns in central and western China. These findings highlight heterogeneous aging trajectories, showing that retirement’s impact on PA is context-specific and requires locally adaptive approaches.
Introduction
Population aging poses a major challenge to sustainable health systems in the 21st century. As the number of retirees expands, social welfare demand and public health pressures rise in parallel (Pison et al., 2022; WHO, 2023). China is undergoing one of the fastest demographic transitions worldwide, with the share of those aged 65 and older projected to increase sharply in the coming decades. The growing retired population may affect economic growth through labor supply and dependency ratios, while also reshaping health risk patterns (Wei, 2025). Ample evidence links sustained increases in physical activity (PA) to lower morbidity (Smith et al., 2016), better functional capacity (El Assar et al., 2022), and longer healthy life expectancy (Obidovna & Sulaymonovich, 2022). Against this backdrop, identifying the causal impact of retirement on PA has clear research and policy relevance.
Retirement marks a critical life-course transition that reshapes time allocation, social roles, and daily routines (Wang & Shi, 2014). However, existing evidence on its effect on PA remains mixed. Some studies find that PA rises after retirement, especially among previously sedentary workers (Barnett et al., 2012; Brainard et al., 2020; Glasson et al., 2023). Others suggest that PA may decline, as reductions in work-related activity are not fully offset by leisure or transport activity (Berger et al., 2005; Lee et al., 2020). Mechanistically, retirement may influence PA through time reallocation (Humphreys & Ruseski, 2011), changes in income and benefits (Stenholm et al., 2016), and shifts in social environments (Kauppi et al., 2021), each operating in different directions and intensities. The net effect is thus uncertain and context dependent, further shaped by prior occupation, gender, and socioeconomic status (Pulakka et al., 2020; Van Dyck et al., 2016). Moreover, differences in observation periods, PA measurement, and identification strategies have contributed to inconsistent findings.
Unlike the extensive evidence from high-income countries, the situation in China differs substantially, as retirement experiences are shaped by unique institutional and cultural constraints. First, the hukou system continues to generate deep inequalities in pension coverage and benefits between urban and rural residents (Williamson et al., 2017). Second, traditional familial norms assign older adults substantial caregiving responsibilities, and grandparental caregiving remains widespread (Feng & Zhang, 2018; Ko & Hank, 2014). Third, retirement often entails withdrawal from workplace-based social networks, which is a key source of group exercise opportunities, thereby narrowing social circles and reducing engagement in PA (Schetke et al., 2016; Tian et al., 2022). These interrelated institutional, cultural, and economic factors highlight the need for a context-sensitive examination of the retirement–PA relationship in China.
While recent studies have improved causal identification through quasi-experimental methods (Coe & Zamarro, 2011; Eibich, 2015; Wang et al., 2024), they remain limited in capturing treatment heterogeneity, often relying on linear interactions or subgroup analysis. In parallel, machine learning approaches hold promise for uncovering complex effect variation, it has not been widely applied to causal analyses of retirement’s impact on physical activity. To address both conceptual and methodological gaps, this study draws on data from the China General Social Survey (CGSS) and employs the statutory retirement age as an exogenous cutoff in a fuzzy regression discontinuity (FRD) design to identify the local average treatment effect (LATE) of retirement on PA. Building on this identification strategy, we employ causal forest (CF) techniques to systematically evaluate how treatment effects differ by socioeconomic and health characteristics.
Our contributions are twofold. First, leveraging China’s age-60 statutory cutoff, we provide a credibly identified FRD estimate of retirement’s effect on leisure-time PA; second, by pairing conventional subgroup analyses with causal forests, we deliver a flexible, non-parametric mapping of treatment heterogeneity that ranks moderators and clarifies context-specific channels relevant for policy.
Literature Review
International Evidence and Contextual Heterogeneity
A growing body of international research demonstrates significant heterogeneity in the relationship between retirement and PA, shaped by differences in institutional structures, population composition, and environmental factors. In the UK and France, retirement tends to be associated with increased leisure-time PA, particularly among individuals who held sedentary jobs prior to retirement (Brainard et al., 2020; Glasson et al., 2023; Touvier et al., 2010). Similarly, earlier US studies found that PA increases most significantly among retirees from sedentary jobs, while those leaving physically demanding jobs often experience smaller gains or even declines (Chung et al., 2009).
In contrast, evidence from the Netherlands and Belgium points out declines in PA after retirement, especially among recent retirees and those with lower socioeconomic status. (Slingerland et al., 2007; Van Dyck et al., 2016). Finnish empirical studies further highlight the role of individual characteristics: while PA tends to increase slightly among men and decline among women, factors such as income, education, and health have been shown to moderate the retirement-PA relationship (Lahti et al., 2011; Lallukka et al., 2025; Pulakka et al., 2020).
Across countries, socioeconomic disparities consistently shape PA trajectories post-retirement. Retirees with lower income or education are more likely to reduce PA, while individuals with greater social capital tend to maintain or increase activity levels (Barnett et al., 2012, 2014). Qualitative evidence from Italy also highlights barriers such as poor health, psychological stress, and anxiety, particularly among women, while strong social ties and community participation serve as important enablers (Socci et al., 2021). However, most of the existing research is based on high-income countries and relies primarily on linear models or subgroup comparisons, limiting their ability to capture nonlinearity and individual-level heterogeneity in retirement effects.
Evidence from China: Institutional, Socioeconomic, and Cultural Barriers
China’s household registration (hukou) system is a primary driver of social welfare disparities between urban and rural residents. Rural older adults are often compelled to continue working into old age to maintain basic subsistence (Fang et al., 2023), while urban retirees, especially civil servants, enjoy far more generous pensions and welfare benefits (Williamson et al., 2017; Zhu & Walker, 2018). Recent surveys reveal that over 80% of rural older adults remain in the workforce, compared to just 60% of their urban counterparts (Li et al., 2022). For many in rural China, retirement occurs only when declining health makes continued work impossible (Benjamin et al., 2005).
Distinctive cultural norms and family expectations further constrain older adults’ participation in PA. In traditional family structures, elderly family members are often expected to provide care for grandchildren, with more than half actively involved in childcare duties (Ko & Hank, 2014). Such intergenerational obligations reduce time available for exercise and increase physical burdens, undermining opportunities for PA (Feng & Zhang, 2018; Winefield & Air, 2010).
Moreover, older adults in China tend to prefer collective modes of PA (Schetke et al., 2016; Wang et al., 2019). However, the quantity and quality of public fitness facilities remain inadequate in many communities, with significant regional disparities in facility distribution (Chen et al., 2016; Tian et al., 2022). The transition out of the workforce also leads to the loss of social identity and networks (Fakoya et al., 2020). Nearly 63% of older adults in China report frequent feelings of loneliness (Cui et al., 2024), which further reduces their motivation to engage in PA (Creese et al., 2021).
These studies provide valuable insights into the retirement behavior of Chinese older adults. However, structural constraints related to institutions, culture, and resources may interact and compound their effects on post-retirement PA engagement. Quantitative evidence that systematically examines these layered barriers in the Chinese context remains scarce.
Methodological Developments and Research Gaps
Early studies examining the relationship between retirement and PA relied primarily on correlational methods such as variance analysis, OLS regression, fixed effects, and generalized linear models (Barnett et al., 2014; Chung et al., 2009; Glasson et al., 2023; Pulakka et al., 2020; Slingerland et al., 2007; Touvier et al., 2010; Van Dyck et al., 2016). While useful for identifying general patterns, these approaches offer limited capacity to address endogeneity and uncover underlying causal mechanisms, such as the interplay between health deterioration, early retirement, and PA decline.
To overcome these limitations, recent studies have increasingly adopted quasi-experimental strategies, including instrumental variables (IV), FRD, and difference-in-differences (DID), often using statutory retirement age as an exogenous instrument (Coe & Zamarro, 2011; Eibich, 2015; Wang et al., 2024; Zhang et al., 2018). These methods improve causal identification, especially in controlling for endogenous health effects, but often rely on linear interactions or subgroup analyses, limiting their ability to capture complex nonlinear relationships or precisely identify vulnerable subgroups.
In recent years, machine learning (ML) methods have been increasingly used to predict PA trajectories in the context of health behaviors and aging (Cheng et al., 2021; Dijkhuis et al., 2018; Farrahi & Rostami, 2024). However, these approaches tend to prioritize predictive accuracy over interpretability, offering limited insights into causal mechanisms or treatment effect heterogeneity. Although causal ML techniques such as CF (Wager & Athey, 2018) have shown promise in fields like education and labor economics (Baiardi & Naghi, 2024; McJames et al., 2025), their application to retirement-PA relationship remains rare.
This study integrates FRD and CF into a unified framework to jointly identify the causal effect of retirement on PA and the heterogeneous treatment effect. This approach combines the identification strength of FRD with the flexibility of CF, enabling the detection of complex interactions and subgroup vulnerabilities. It further generates data-driven evidence on the roles of economic capacity, psychological stress, and health status in shaping post-retirement PA, providing new empirical and theoretical support for precision policy design in China’s aging context.
Methods
Empirical Strategy
We exploit a quasi-natural experiment and apply an FRD design based on China’s statutory retirement age policy (60 for males), to identify the causal effects of retirement on PA among older adults. This policy introduces an exogenous cutoff for retirement eligibility, helping to address endogeneity concerns such as reverse causality and selection bias.
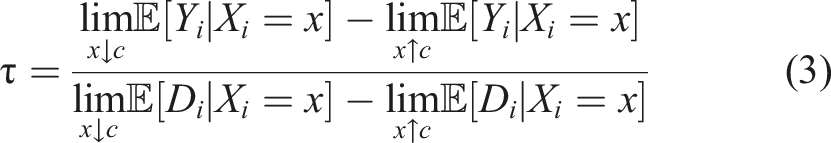
First, we implement a standard two-stage least squares (2SLS) procedure. In equation (1), retirement status is instrumented by eligibility based on the statutory age cutoff. Equation (2) then uses the predicted retirement status to estimate the causal effect of retirement on PA, controlling for observable characteristics


The first-stage F-statistic exceeds 80, well above the conventional thresholds (Stock & Yogo, 2005), confirming instrument strength.
Second, we estimate the LATE using LPR following Calonico et al. (2019), with the bandwidth selected according to their mean squared error (MSE) minimizing criterion. In our main specification, this procedure yields a symmetric window of ±5 years around the cutoff. This nonparametric approach provides consistent estimates while allowing for heteroskedasticity-robust standard errors. The corresponding model can be expressed as:
We also test the empirical validity of our identification strategy. Theoretically, China’s statutory retirement age is centrally mandated and not subject to individual manipulation, which supports the continuity assumption. Empirically, as shown in Figure 1(a), there is a clear jump in retirement rate from approximately 0.4 at age 59 to nearly 0.6 at age 60, coinciding with the policy cutoff. The distribution of sample sizes across ages is smooth, indicating no manipulation at the threshold. Furthermore, we examine the characteristics of individuals who retire at age 60. They are predominantly full-time male workers with relatively higher education and income levels, and a higher proportion reside in urban areas. This pattern is consistent with the institutional setting, where formal sector employees are more likely to comply with the statutory retirement age, while informal or part-time workers often exit the labor market at different ages. Fuzzy Regression Discontinuity Plots for Retirement and Physical Activity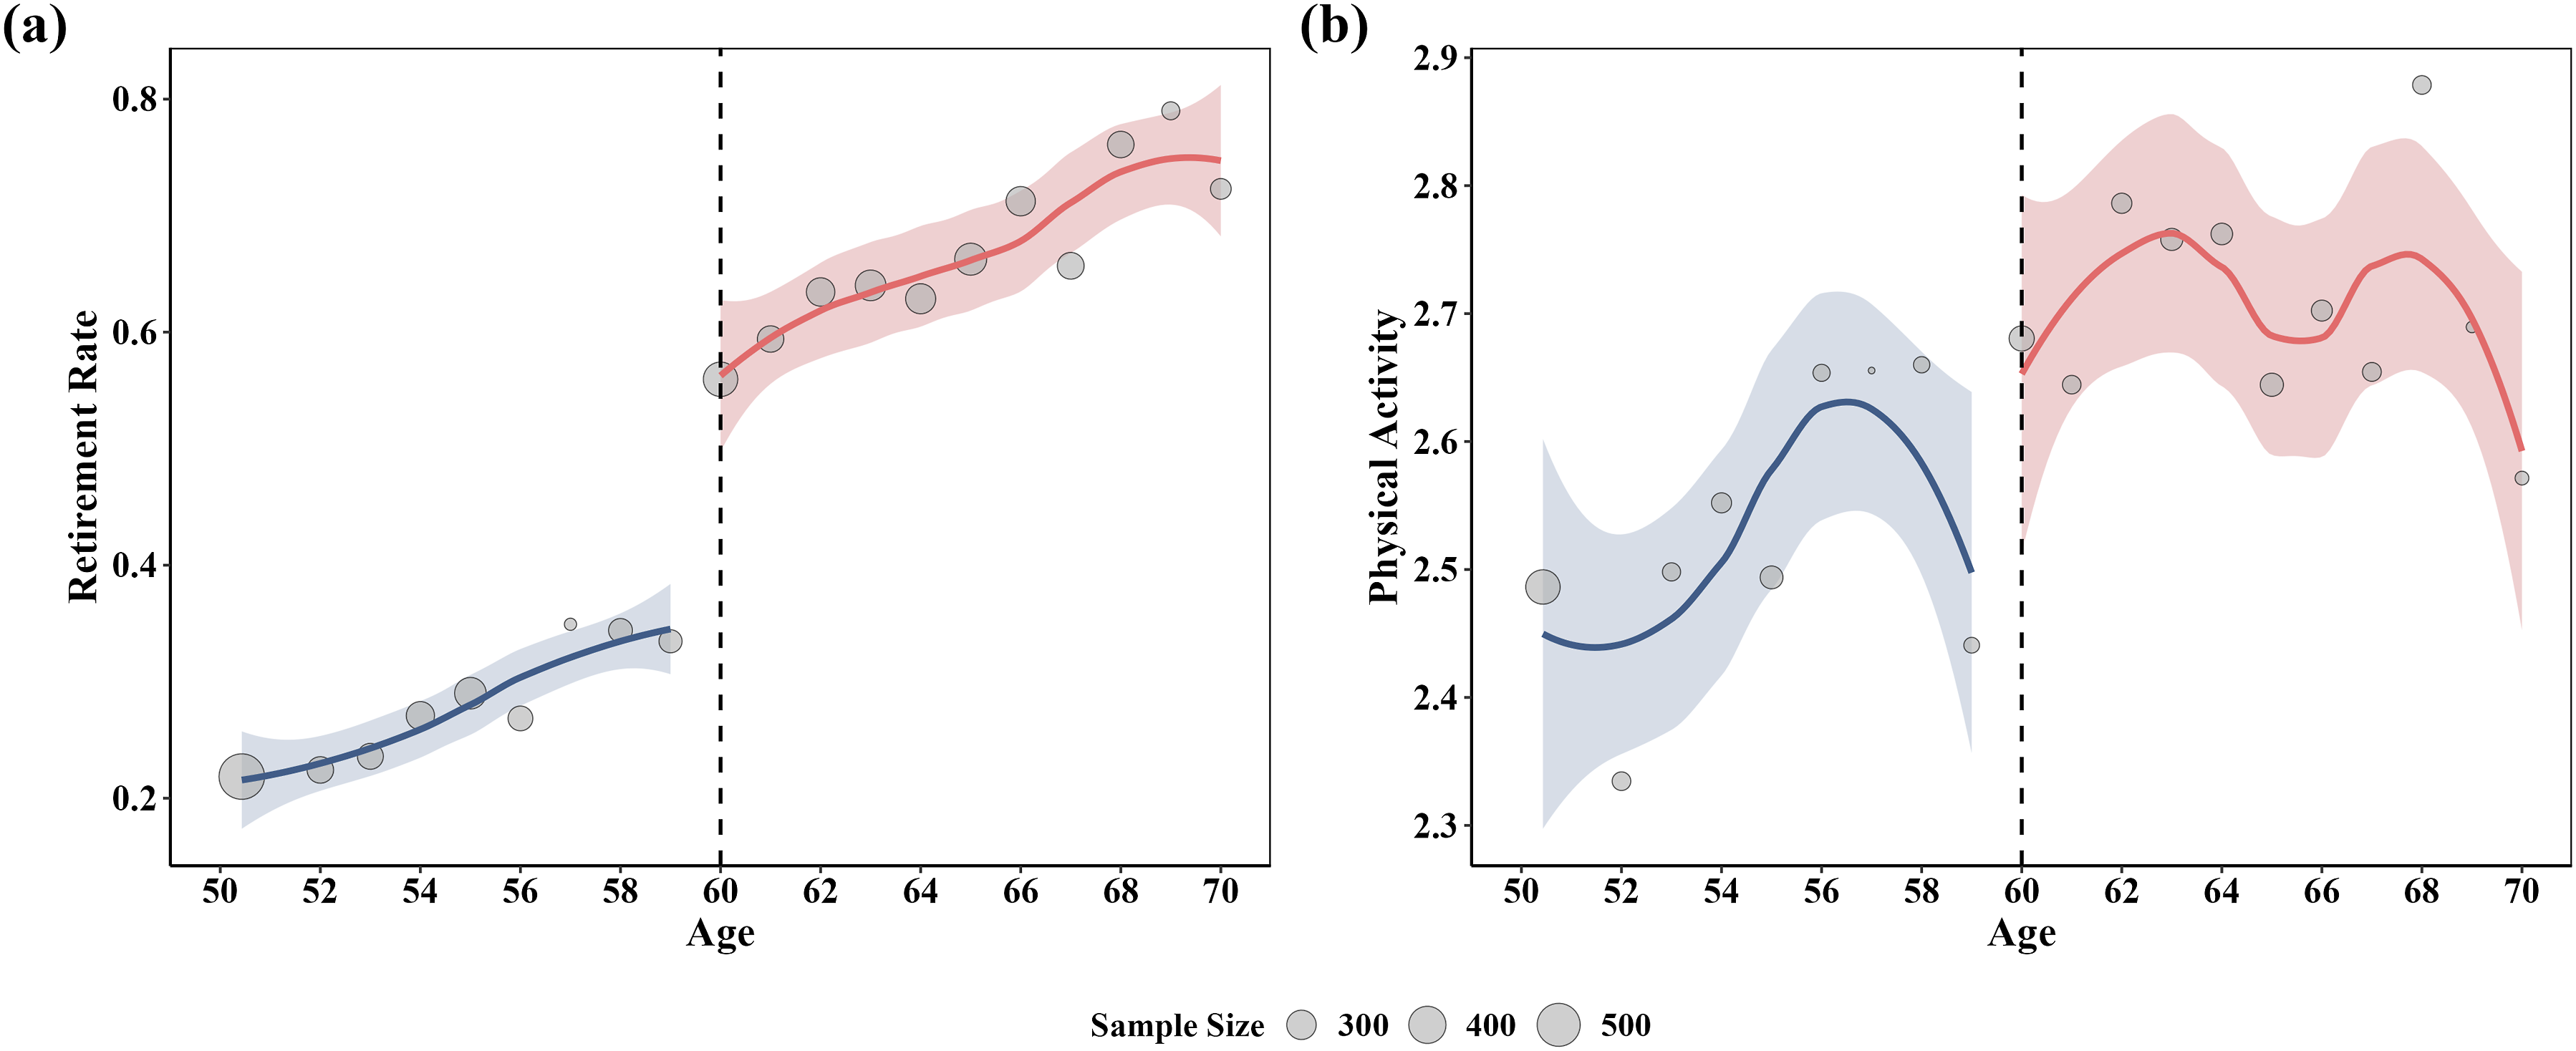
To further uncover heterogeneous treatment effects, we estimate Conditional Average Treatment Effects (CATEs) using the CF approach (Wager & Athey, 2018). The CF is trained on observations within a bandwidth h = 5 around the age-60 cutoff (ages 55 to 65), using the same bandwidth and analytic sample as the baseline analyses. While the core set of covariates is retained, we additionally include employment type (e.g., part-time and farming status) in the CF model to better capture treatment heterogeneity across occupational subgroups. We also incorporate province-level clustering to account for intra-provincial correlations and to enable a more detailed assessment of how regional institutional and socioeconomic contexts contribute to variation in treatment responses. The model targets the following:

As part of our empirical strategy, we perform a comprehensive set of robustness checks to ensure the credibility of our findings. These include a McCrary density test to rule out manipulation of the running variable, continuity tests on covariates to assess the balance around the threshold, placebo tests to examine the specificity, and bandwidth sensitivity analyses to evaluate the stability of our estimates to alternative bandwidth choices.
Data
The empirical analysis draws on pooled data from four waves (2015 - 2021) of the China General Social Survey (CGSS). As a national academic survey project in China, the CGSS provides extensive information on demographic, behavioral, and health-related variables. Although the CGSS is cross-sectional, panel data are not required for FRD designs, which rely on discontinuities in treatment probability at a policy threshold rather than within-individual variation (Imbens & Lemieux, 2008).
Description of the Selected Variables
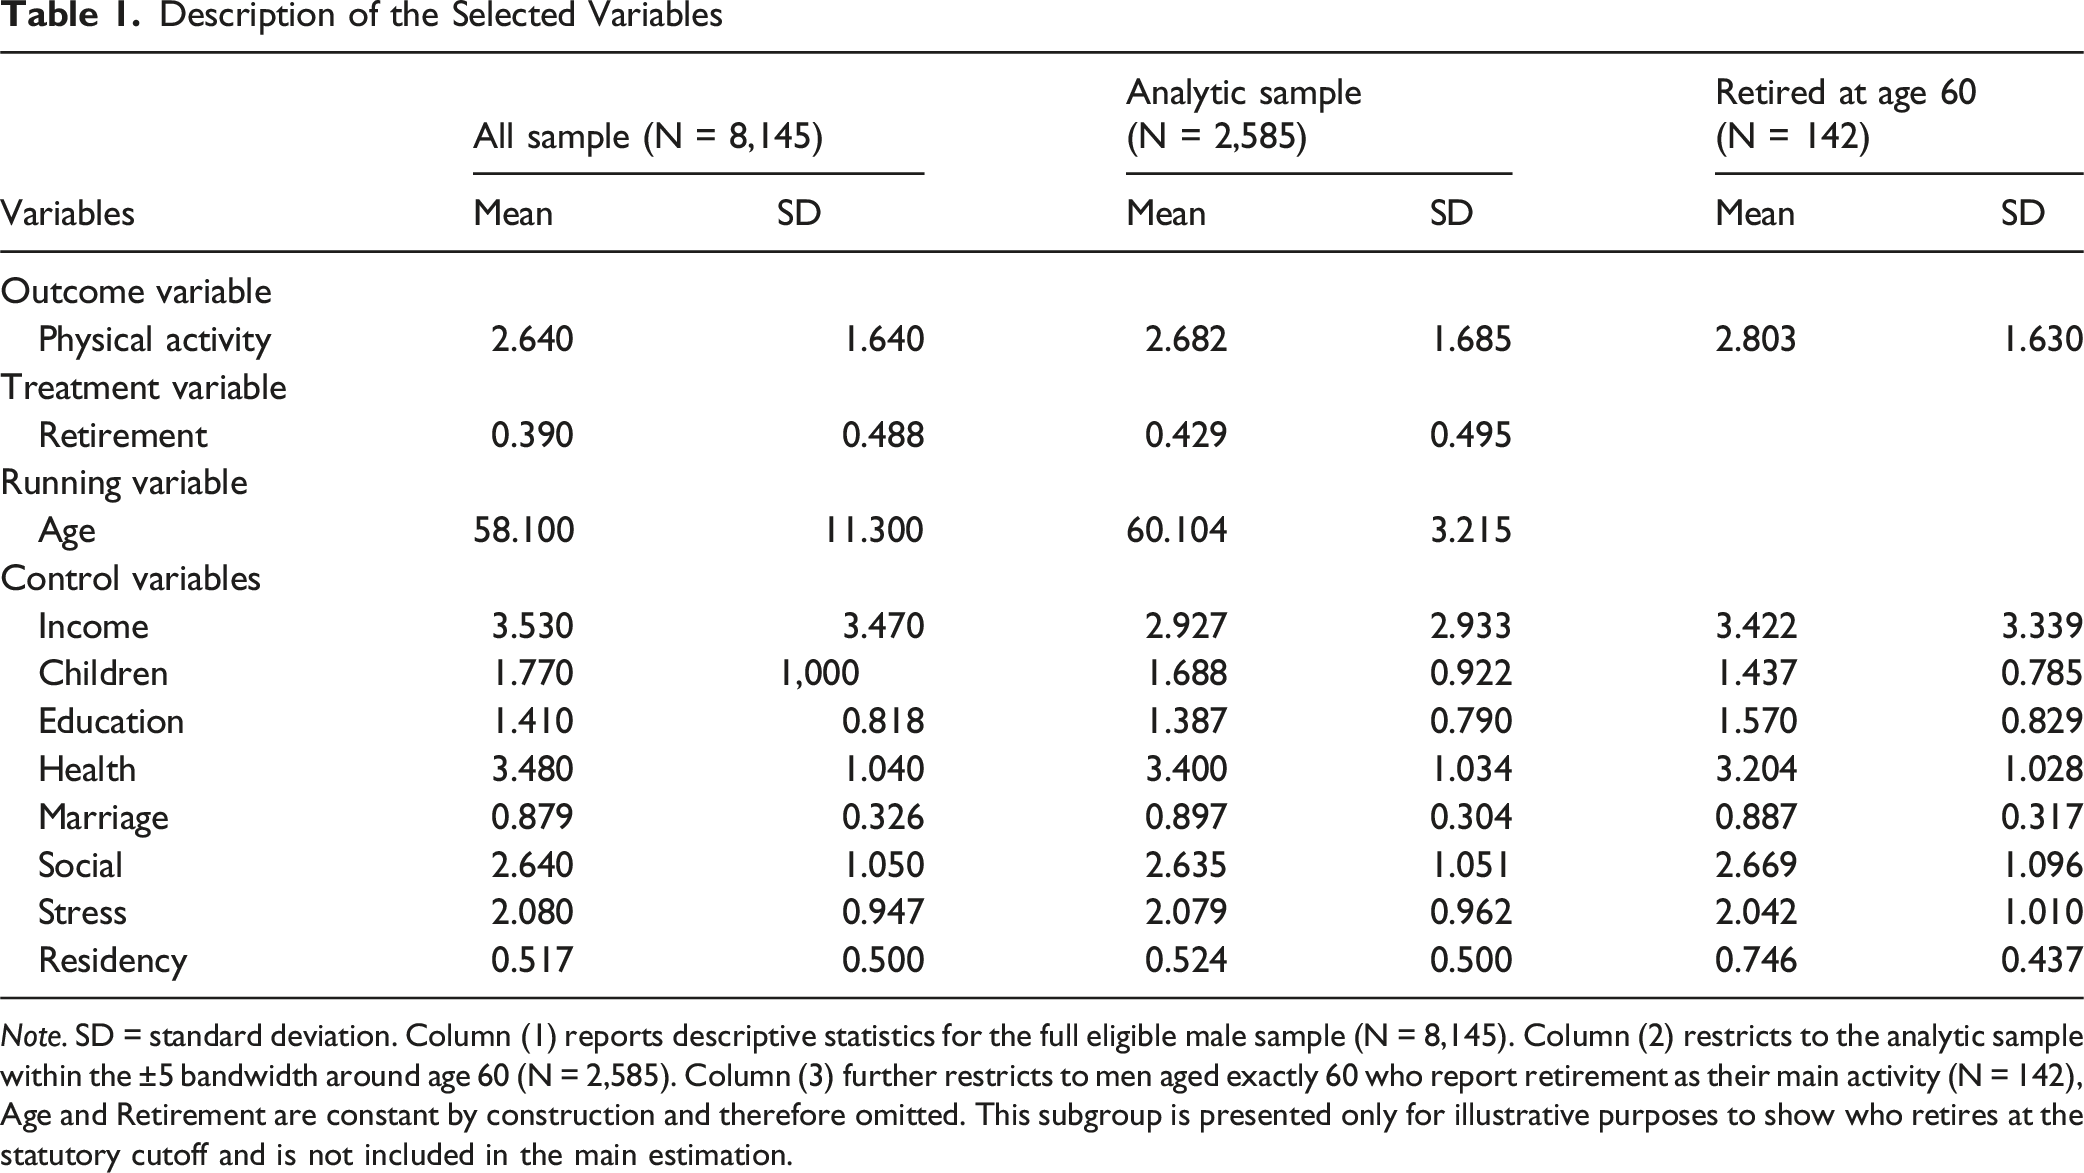
Note. SD = standard deviation. Column (1) reports descriptive statistics for the full eligible male sample (N = 8,145). Column (2) restricts to the analytic sample within the ±5 bandwidth around age 60 (N = 2,585). Column (3) further restricts to men aged exactly 60 who report retirement as their main activity (N = 142), Age and Retirement are constant by construction and therefore omitted. This subgroup is presented only for illustrative purposes to show who retires at the statutory cutoff and is not included in the main estimation.
Variables
Running Variable
The actual age is calculated as the difference between the survey date and the date of birth. This data is directly obtained from the question “What is your date of birth?”
Treatment Variable
Retirement status is coded as 1 if the respondent (a) did not engage in paid work last week, (b) was not on paid leave or temporary suspension, and (c) reported “retirement” as the main reason for not working, following Zhang et al. (2018). Respondents are coded as 0 if they were currently in paid employment, defined as having engaged in either agricultural or non-agricultural work for at least 1 hour in the past week. Individuals who reported being unemployed or out of the labor force for other reasons (e.g., caregiving, illness, education) are excluded to ensure a clean comparison between retirees and active workers.
Outcome Variable
PA frequency is measured by the question, “How often did you engage in physical activities during leisure time in the past year?” Responses are recorded on a 5-point scale (1 = never, 2 = several times a year or less, 3 = several times a month, 4 = several times a week, 5 = daily). Following Robitzsch (2020), we treat this ordinal variable as quasi-continuous, with higher scores indicating greater leisure-time PA. Although internationally standardized instruments such as the WHO Global Physical Activity Questionnaire (GPAQ) capture multiple dimensions of activity (intensity, duration, and domains), frequency-based items like those in the CGSS are conceptually comparable and have been widely applied in large-scale population studies in China (e.g., Li et al., 2024; Wang et al., 2022). This practice supports the validity of using the CGSS measure as a proxy for PA in our empirical setting.
Control Variables
We control for a set of socioeconomic, family, and health-related characteristics that may confound the relationship between retirement and PA. Income is measured as annual personal income (in 10,000 CNY), while education is coded on a four-point scale (0 = none, 1 = primary/junior, 2 = senior secondary, 3 = college or above). Because information on grandchildren is unavailable in the CGSS, we use the number of children as a proxy for potential caregiving responsibilities, consistent with evidence that children and grandchildren counts are highly correlated in low-mortality populations (Bolund & Lummaa, 2017; Zietsch et al., 2014). Self-rated health (1–5: higher = healthier) and perceived stress (1–5: higher = more stressed) are included to capture health status and psychological conditions that may influence both retirement decisions and PA. Marital status is coded as a binary indicator (1 = married, 0 = not married). Social participation is measured by frequency of social activities (1–5), and residency distinguishes between urban and rural hukou. Together, these variables capture economic resources, family structure, and health-related conditions, ensuring that our estimates are not confounded by major observable differences between retirees and active workers.
Results
Baseline Results
Baseline Estimates of the Effect of Retirement on Physical Activity
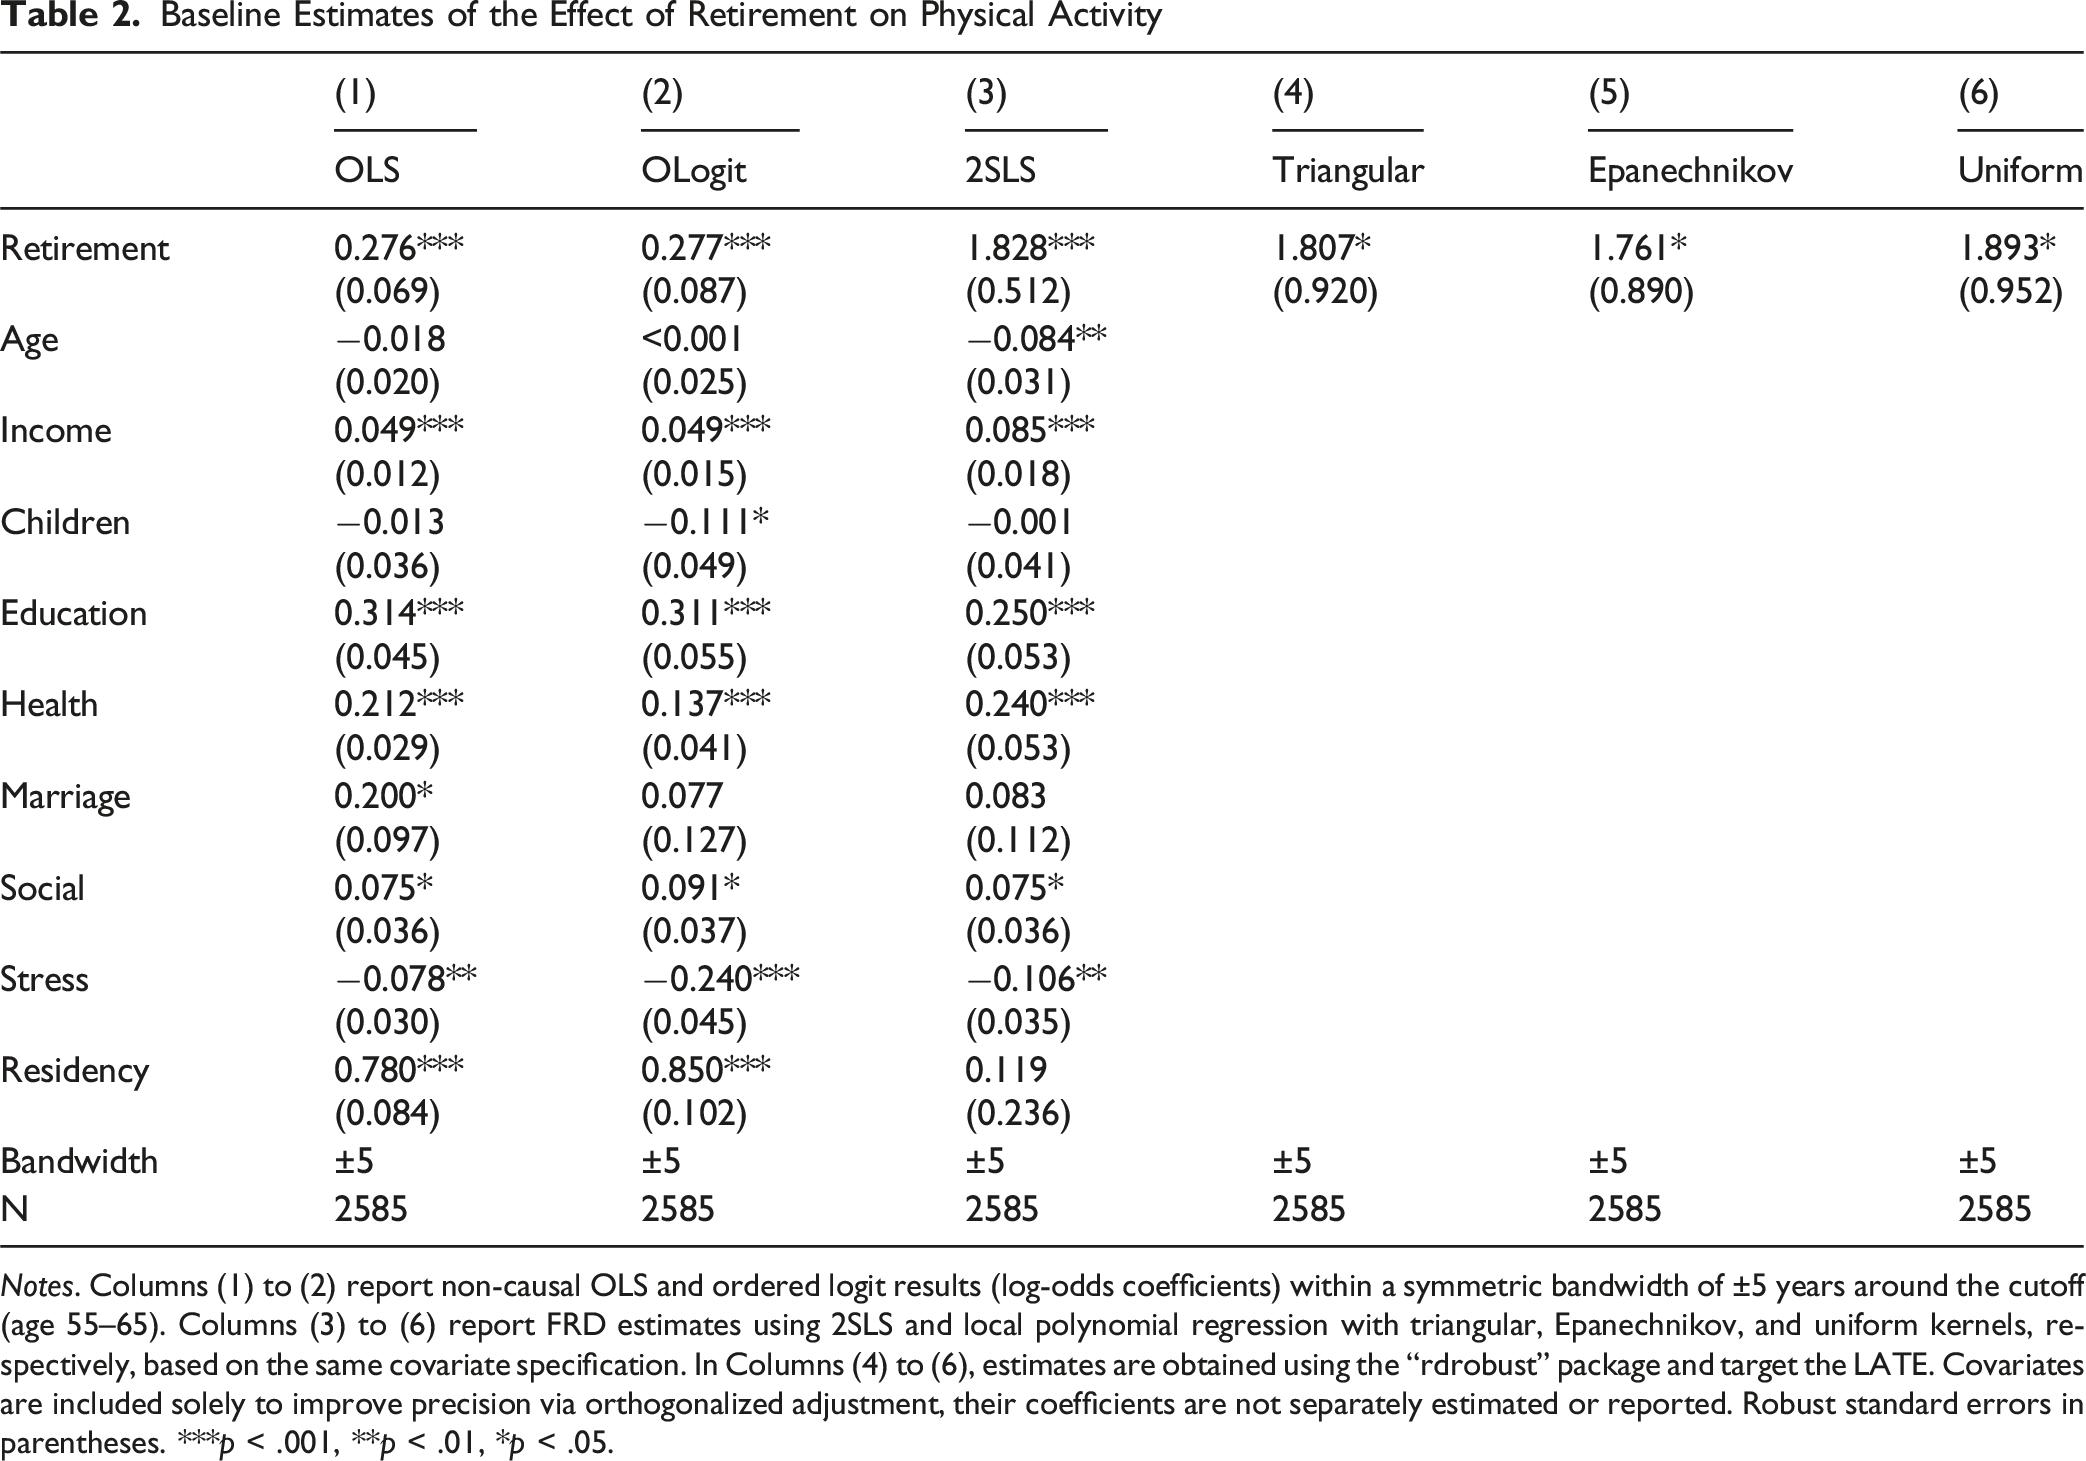
Notes. Columns (1) to (2) report non-causal OLS and ordered logit results (log-odds coefficients) within a symmetric bandwidth of ±5 years around the cutoff (age 55–65). Columns (3) to (6) report FRD estimates using 2SLS and local polynomial regression with triangular, Epanechnikov, and uniform kernels, respectively, based on the same covariate specification. In Columns (4) to (6), estimates are obtained using the “rdrobust” package and target the LATE. Covariates are included solely to improve precision via orthogonalized adjustment, their coefficients are not separately estimated or reported. Robust standard errors in parentheses. ***p < .001, **p < .01, *p < .05.
Turning to the causal estimates. Column (3) of Table 2 reports the 2SLS estimate. The coefficient of 1.83 (p < .001) represents the LATE, indicating that at the statutory cutoff of age 60, retirement increases the PA score by 1.83 units. Relative to the sample mean of 2.64 (SD = 1.65), this effect amounts to roughly 70% of the mean and 1.1 standard deviations, suggesting a substantively large impact. Columns (4) to (6) present the LPR estimates using triangular, Epanechnikov, and uniform kernels. The estimated LATEs are 1.81, 1.76, and 1.89 (all p < .05), respectively, reinforcing the robustness of our findings across alternative nonparametric specifications.
We further explore heterogeneity by occupation and employment type (Appendix Table A1). Columns (1) and (2) distinguish between full-time and part-time workers, while columns (3) and (4) separate non-farming and farming occupations. The retirement effect is strong and statistically significant among full-time workers (1.784, p < .001) and non-farming workers (1.308, p < .01). By contrast, the estimates for part-time and farm workers are positive but not statistically significant. These results suggest that retirement-induced increases in PA are mainly concentrated among workers previously engaged in full-time and non-farming jobs.
Moderating Effects
Moderating Effects of Retirement on Physical Activity
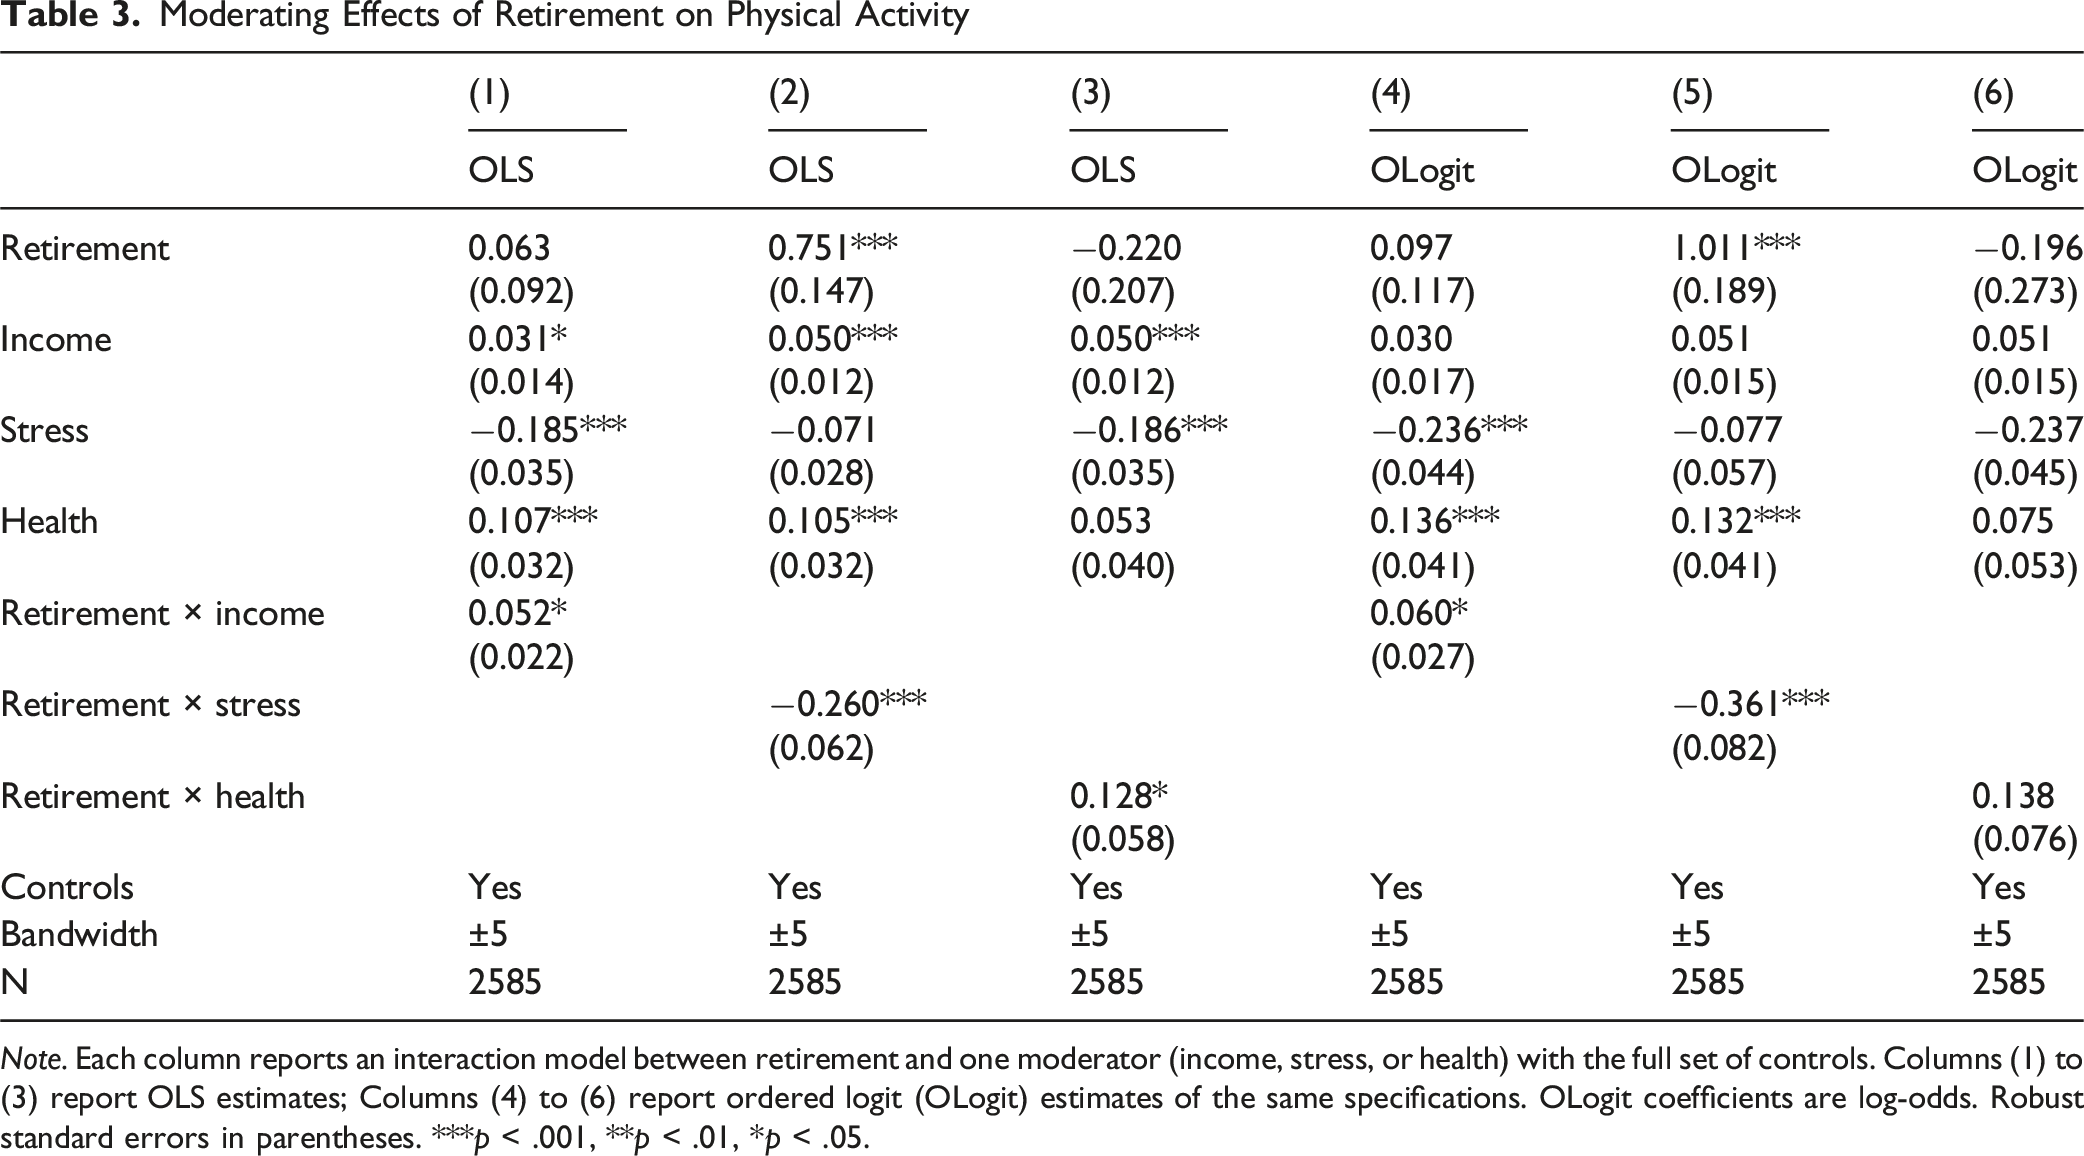
Note. Each column reports an interaction model between retirement and one moderator (income, stress, or health) with the full set of controls. Columns (1) to (3) report OLS estimates; Columns (4) to (6) report ordered logit (OLogit) estimates of the same specifications. OLogit coefficients are log-odds. Robust standard errors in parentheses. ***p < .001, **p < .01, *p < .05.
ATE and CATE Estimated by Causal Forest
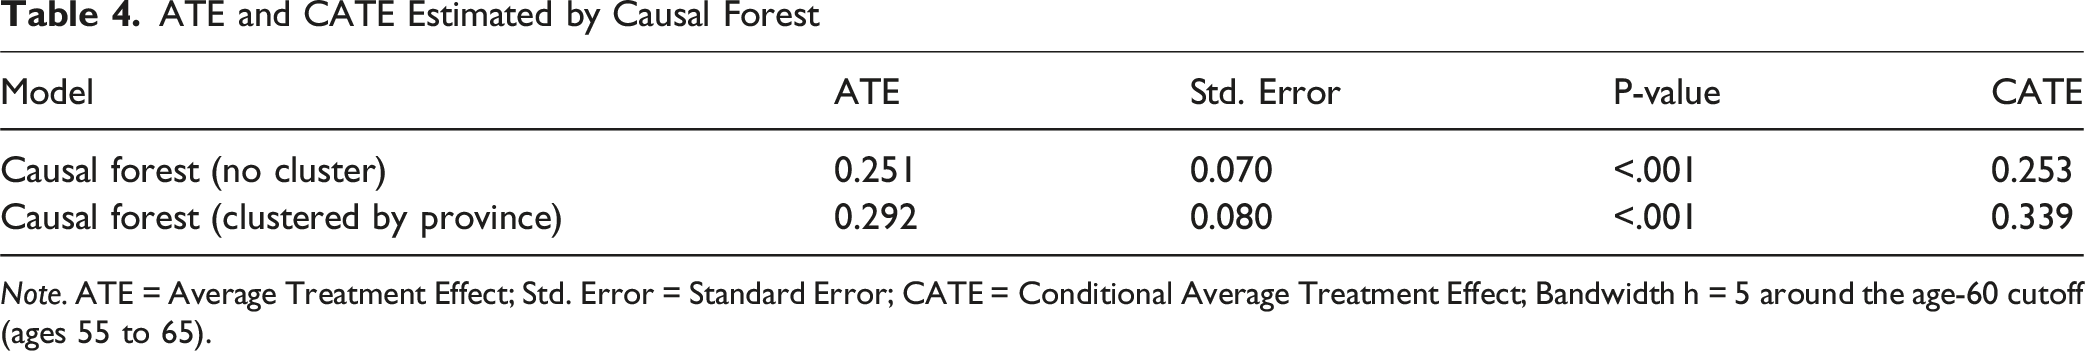
Note. ATE = Average Treatment Effect; Std. Error = Standard Error; CATE = Conditional Average Treatment Effect; Bandwidth h = 5 around the age-60 cutoff (ages 55 to 65).
Robustness Checks
We first assess potential manipulation of the running variable using the McCrary density test. The results show a smooth density function across the cutoff, with no evidence of discontinuity (p = .277; Appendix Figure A1), providing empirical support for the continuity assumption.
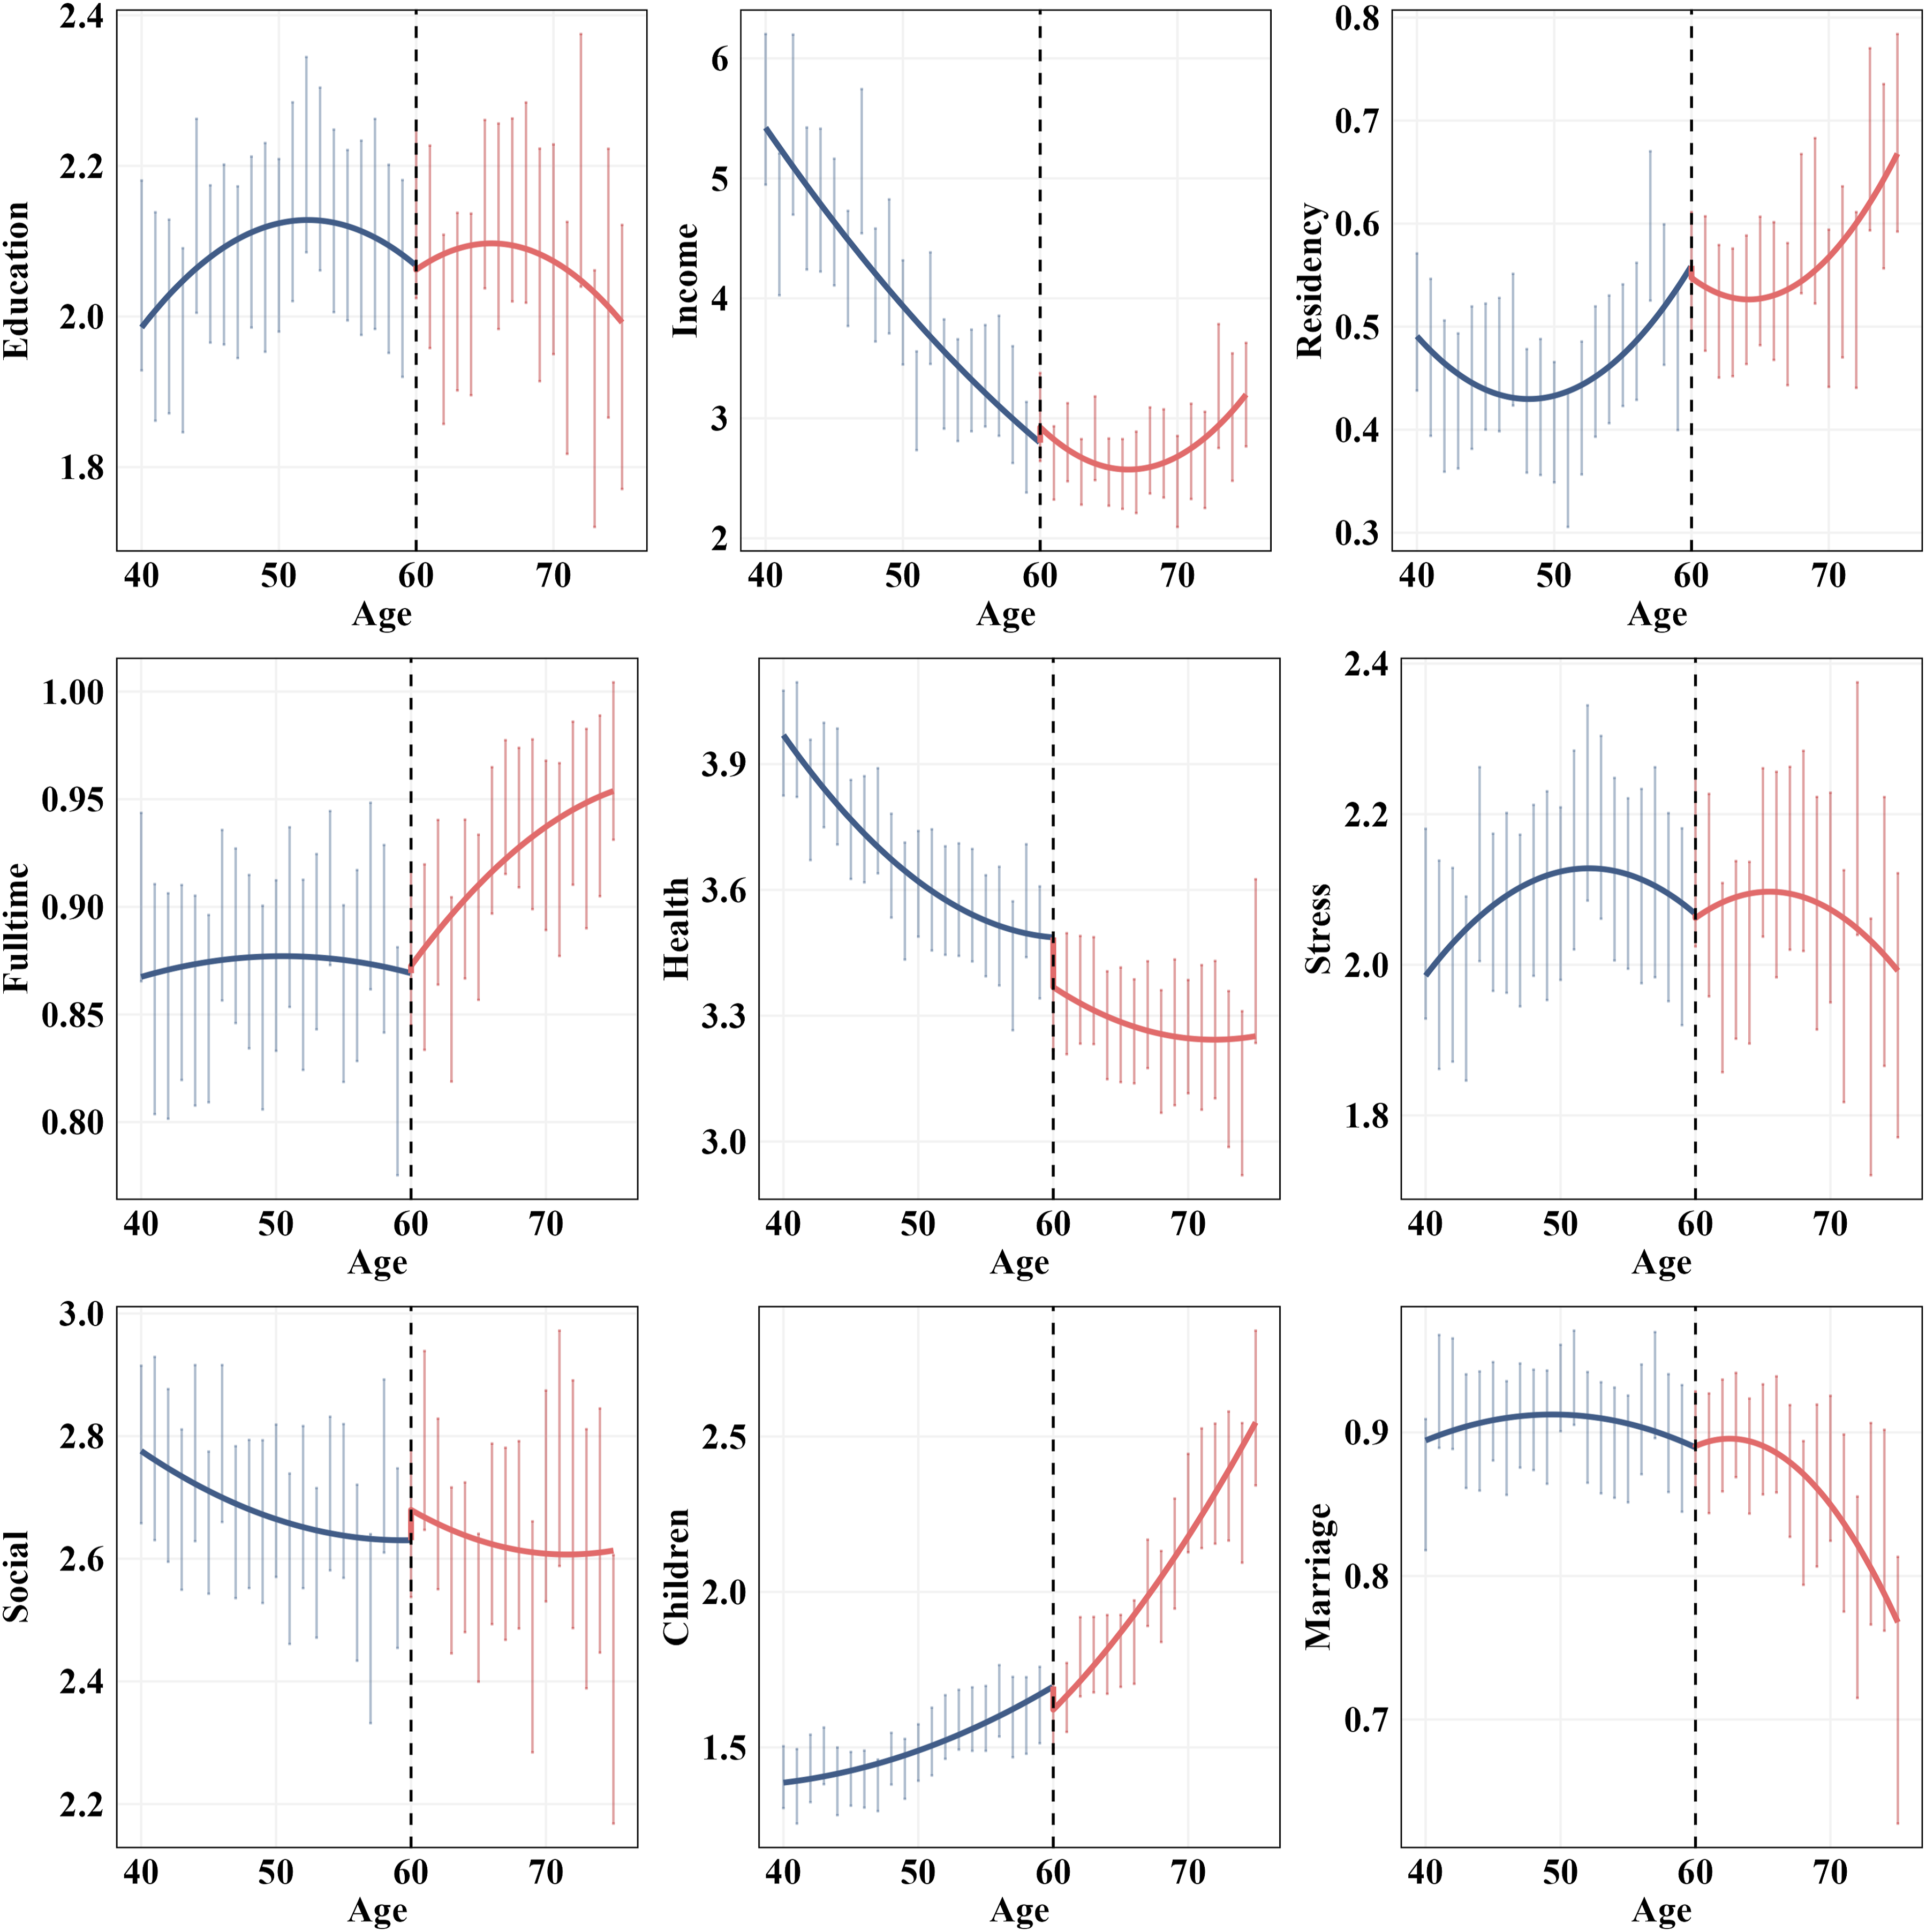
The balance of covariates is further examined using LPR. Appendix Table A3 reports that no covariate demonstrates a statistically significant discontinuity at age 60 (all p-values >.05), indicating that all covariates are smoothly distributed on both sides of the cutoff. Supporting this finding, Appendix Figure A2 visually confirms the absence of abrupt changes in the covariate distributions at the threshold.
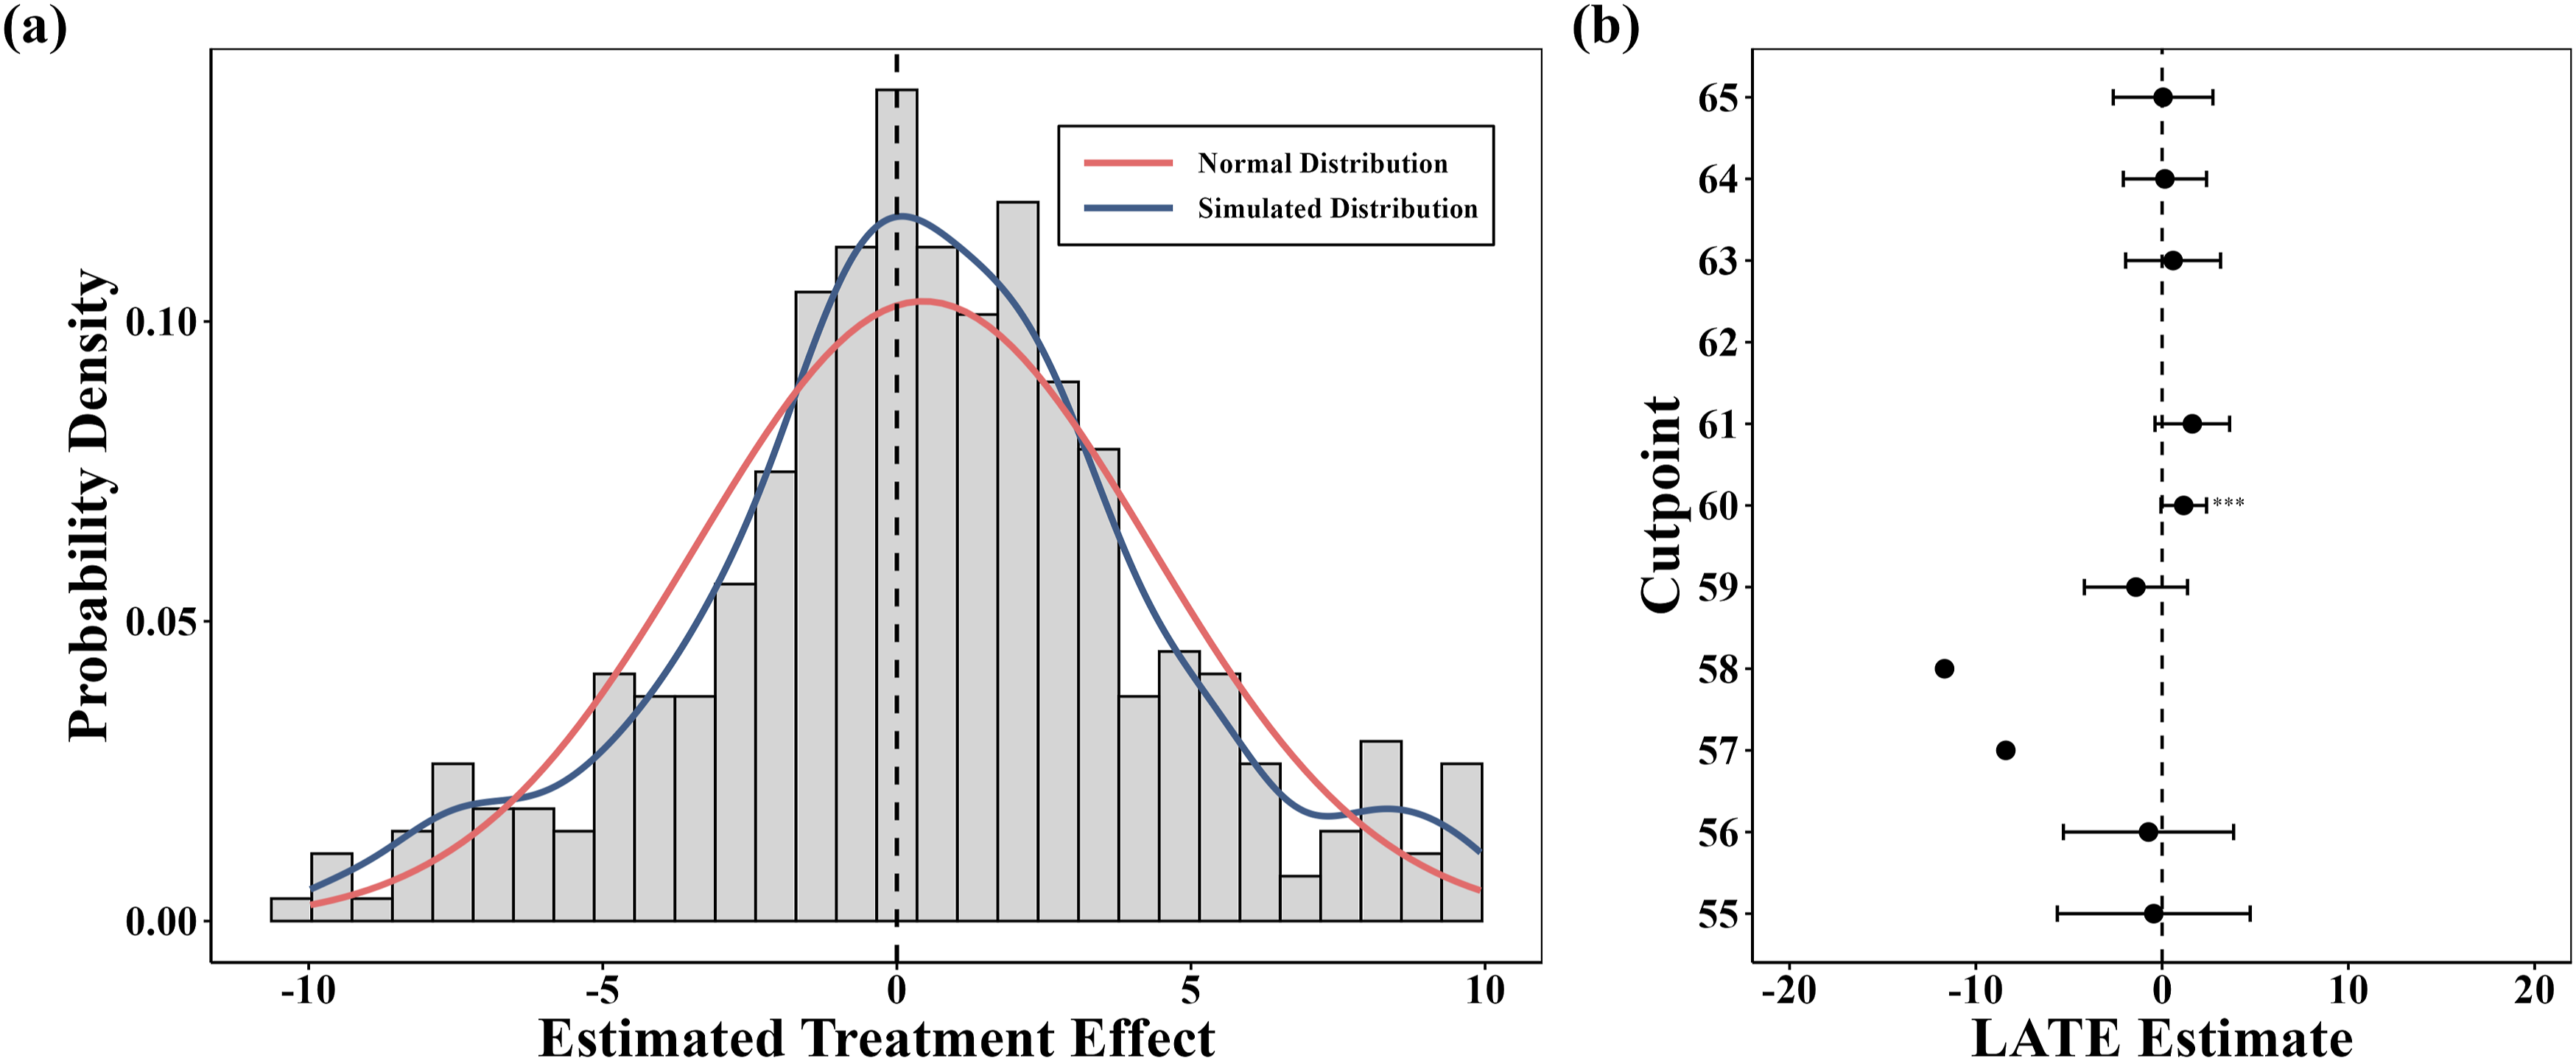
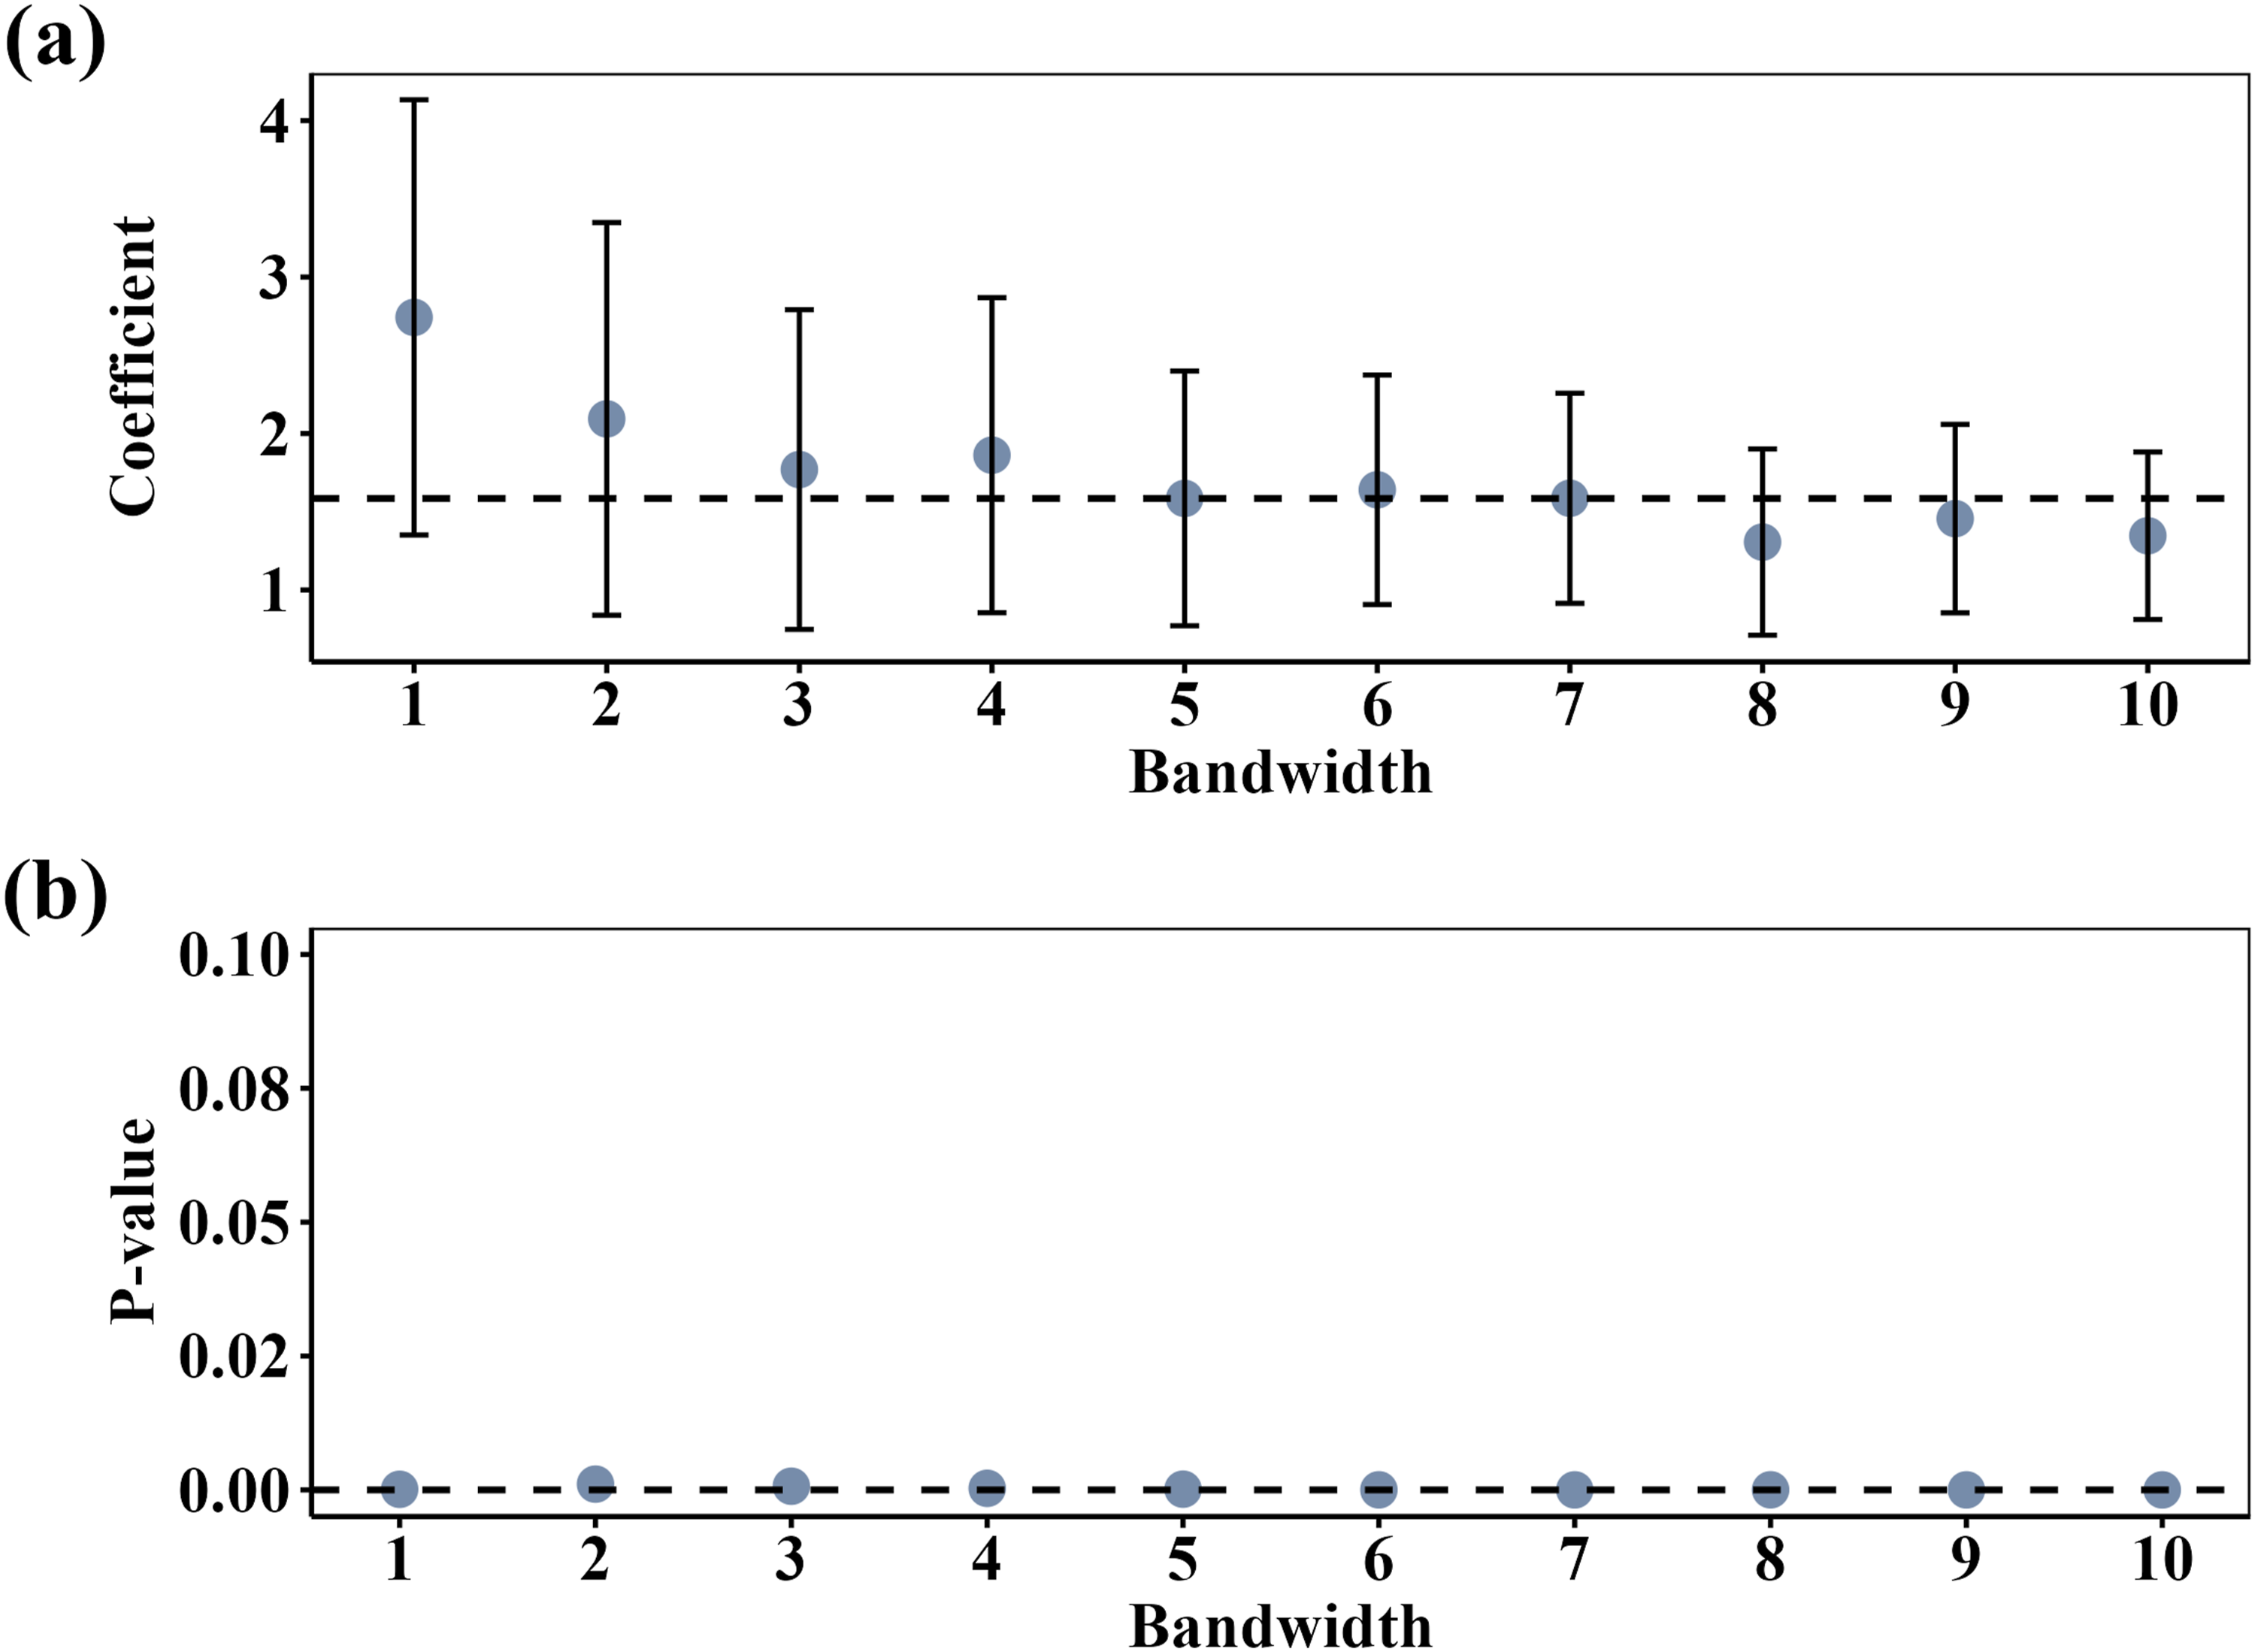
Furthermore, a series of placebo tests and sensitivity analyses support the robustness of our findings (Appendix Figure A3). Placebo simulations and alternative cutoff analyses confirm that the estimated effects are not driven by chance. We also report a single bandwidth sweep from ±1 to ±10 around age 60 (Appendix Figure A4). Following MSE-optimal guidance, we set ±5 as the main estimation window. Consistent with expectations, the ±1 estimate is positive but less precise, whereas estimates are stable in sign and magnitude for bandwidths between ±2 and ±10. These patterns indicate that our findings are not sensitive to bandwidth choice.
Heterogeneity Analysis
To estimate heterogeneous treatment effects, we apply the CF model. Without clustering, the estimated ATE is 0.251 (p < .001) and the CATE is 0.253 (p < .001). After clustering at the province level, the effects become larger, with an ATE of 0.292 (SE = 0.080, p < .001) and a CATE of 0.339 (p < .001), while statistical significance remains unchanged. The magnitudes increased by 0.041 for the ATE and 0.086 for the CATE, indicating that the detected heterogeneity is robust to within-province dependence. Importantly, these CF-based estimates should not be directly compared to the FRD results reported above, since the two approaches serve different purposes: FRD identifies local average causal effects around the statutory cutoff, whereas CF provides data-driven evidence on how treatment effects vary across subgroups (Table 4).
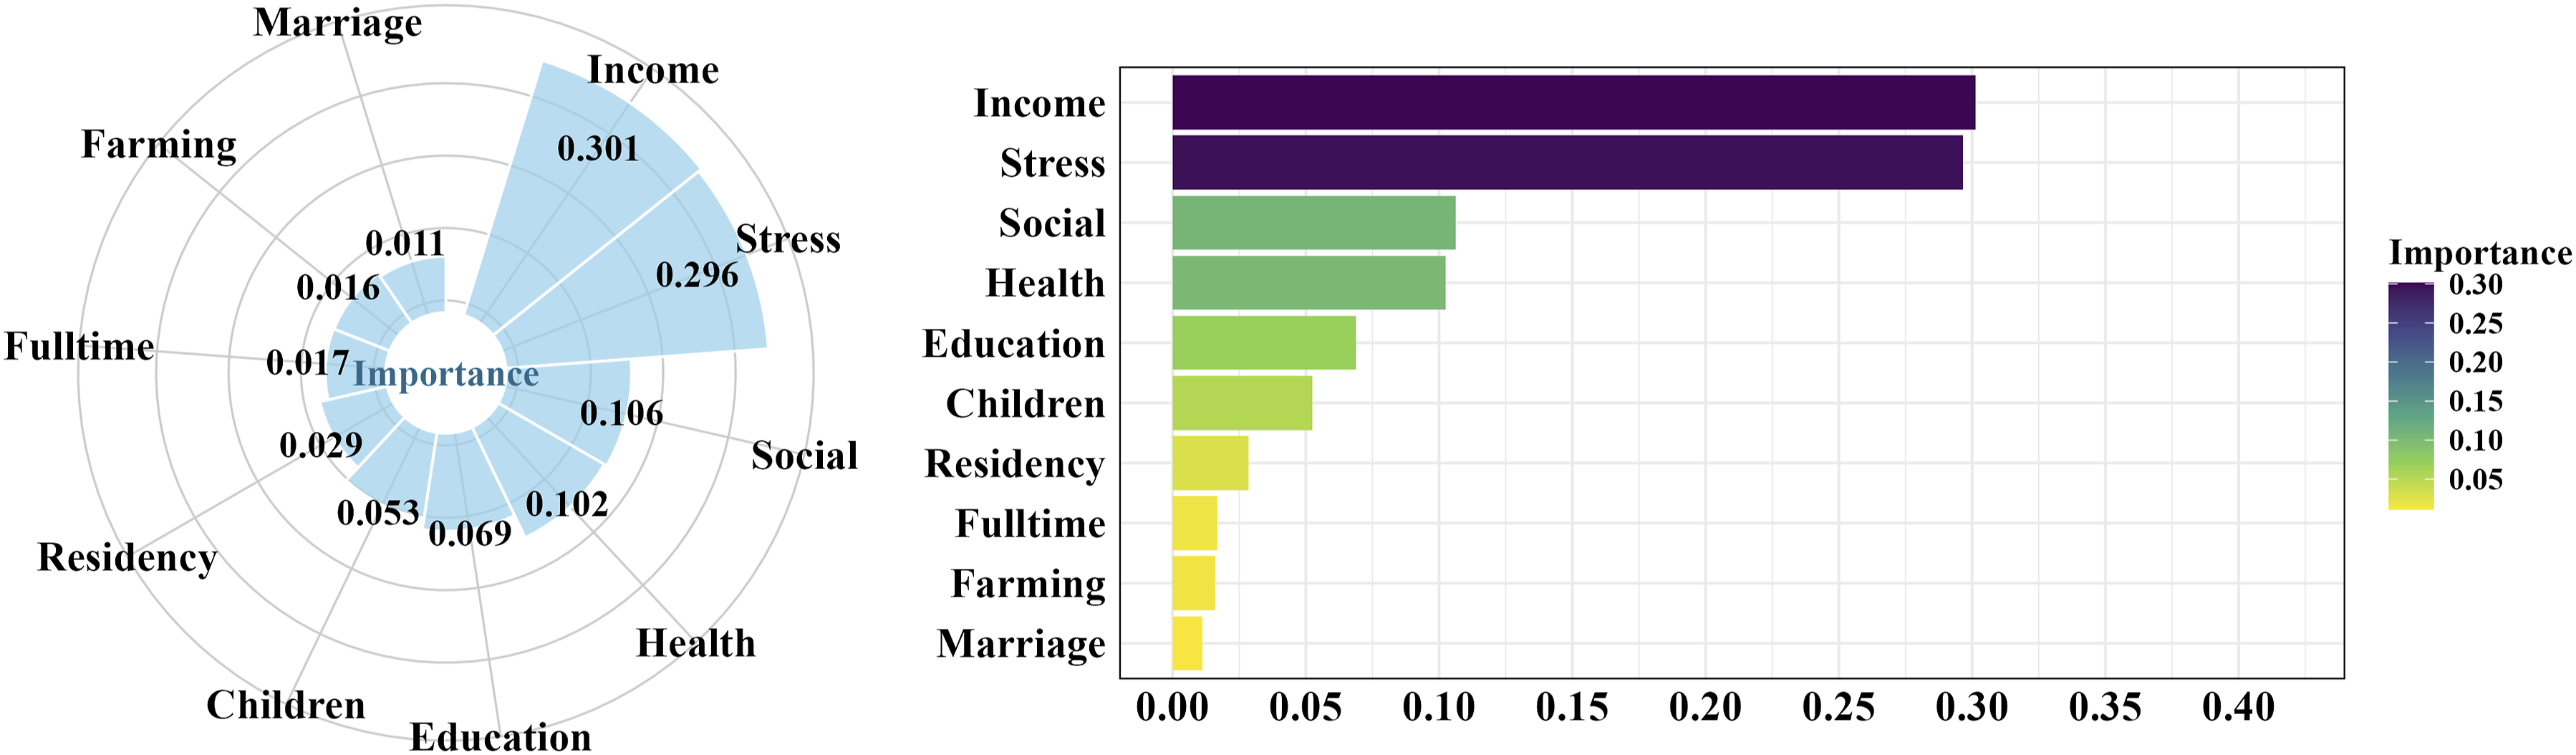
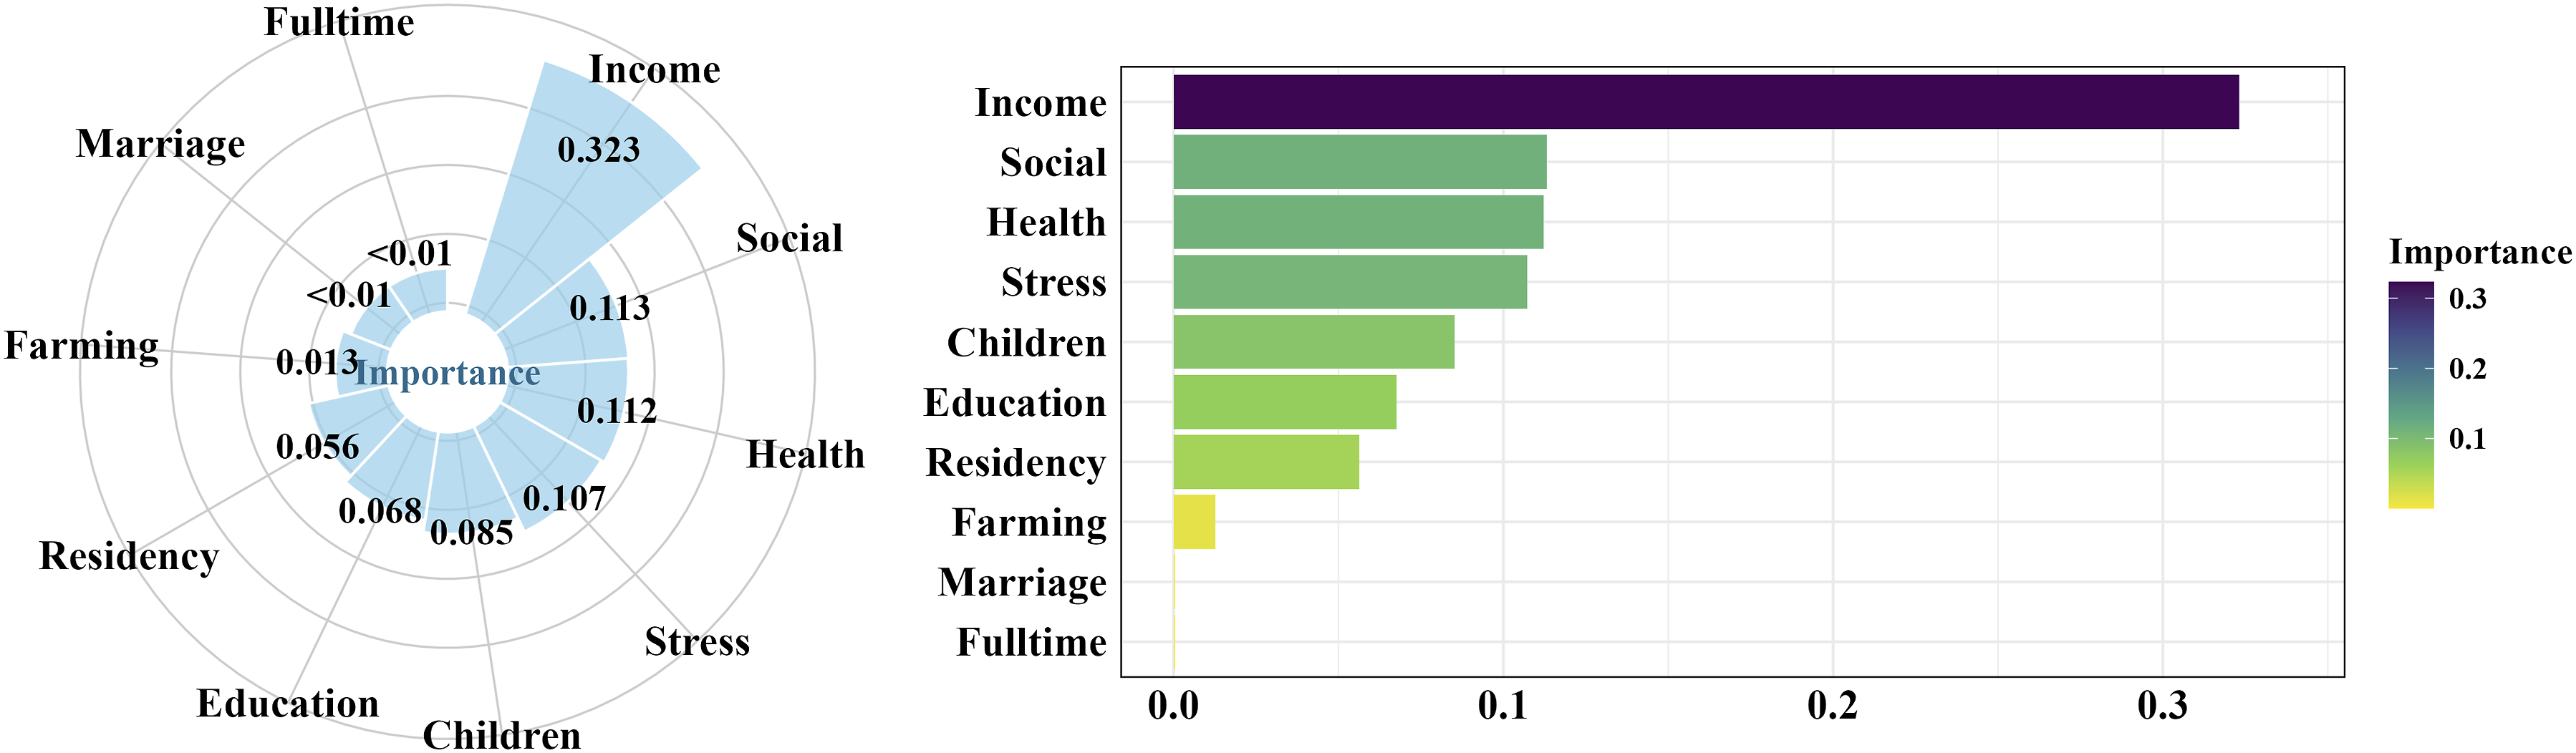
In terms of variable importance, income (0.301) and psychological stress (0.296) are the strongest moderators in the non-clustered model, followed by health status (0.106) and social participation (0.102) (Appendix Figure A5). After clustering, income remains the most influential factor (0.323), while social participation (0.113) rises in importance, ahead of health (0.112) and stress (0.107). The importance of children (0.085) and residency (0.056) also increases (Appendix Figure A6). These results indicate that both individual resources and social contexts shape the extent to which retirement affects PA.
Figure 2 illustrates the spatial distribution of retirement rates (a), PA levels (b), estimated CATEs (c), and sample sizes (d). Panel (a) shows retirement rates for the analytic sample (ages 55-65), which are higher in the northeast and parts of eastern and central China. Panel (b) indicates that PA levels are higher in several central and southern provinces. Panel (c) reveals clear regional variation in CATEs: the strongest retirement effects are observed in eastern coastal provinces, while central provinces display a mixed pattern, relatively weak in the north but stronger in the south. Western provinces show the greatest divergence, with some exhibiting effects comparable to the east and others showing little to no improvement. Panel (d) displays the distribution of sample sizes, which are generally adequate but smaller in some western regions. Spatial Distribution of Retirement Rate, Physical Activity, CATEs, and Sample size.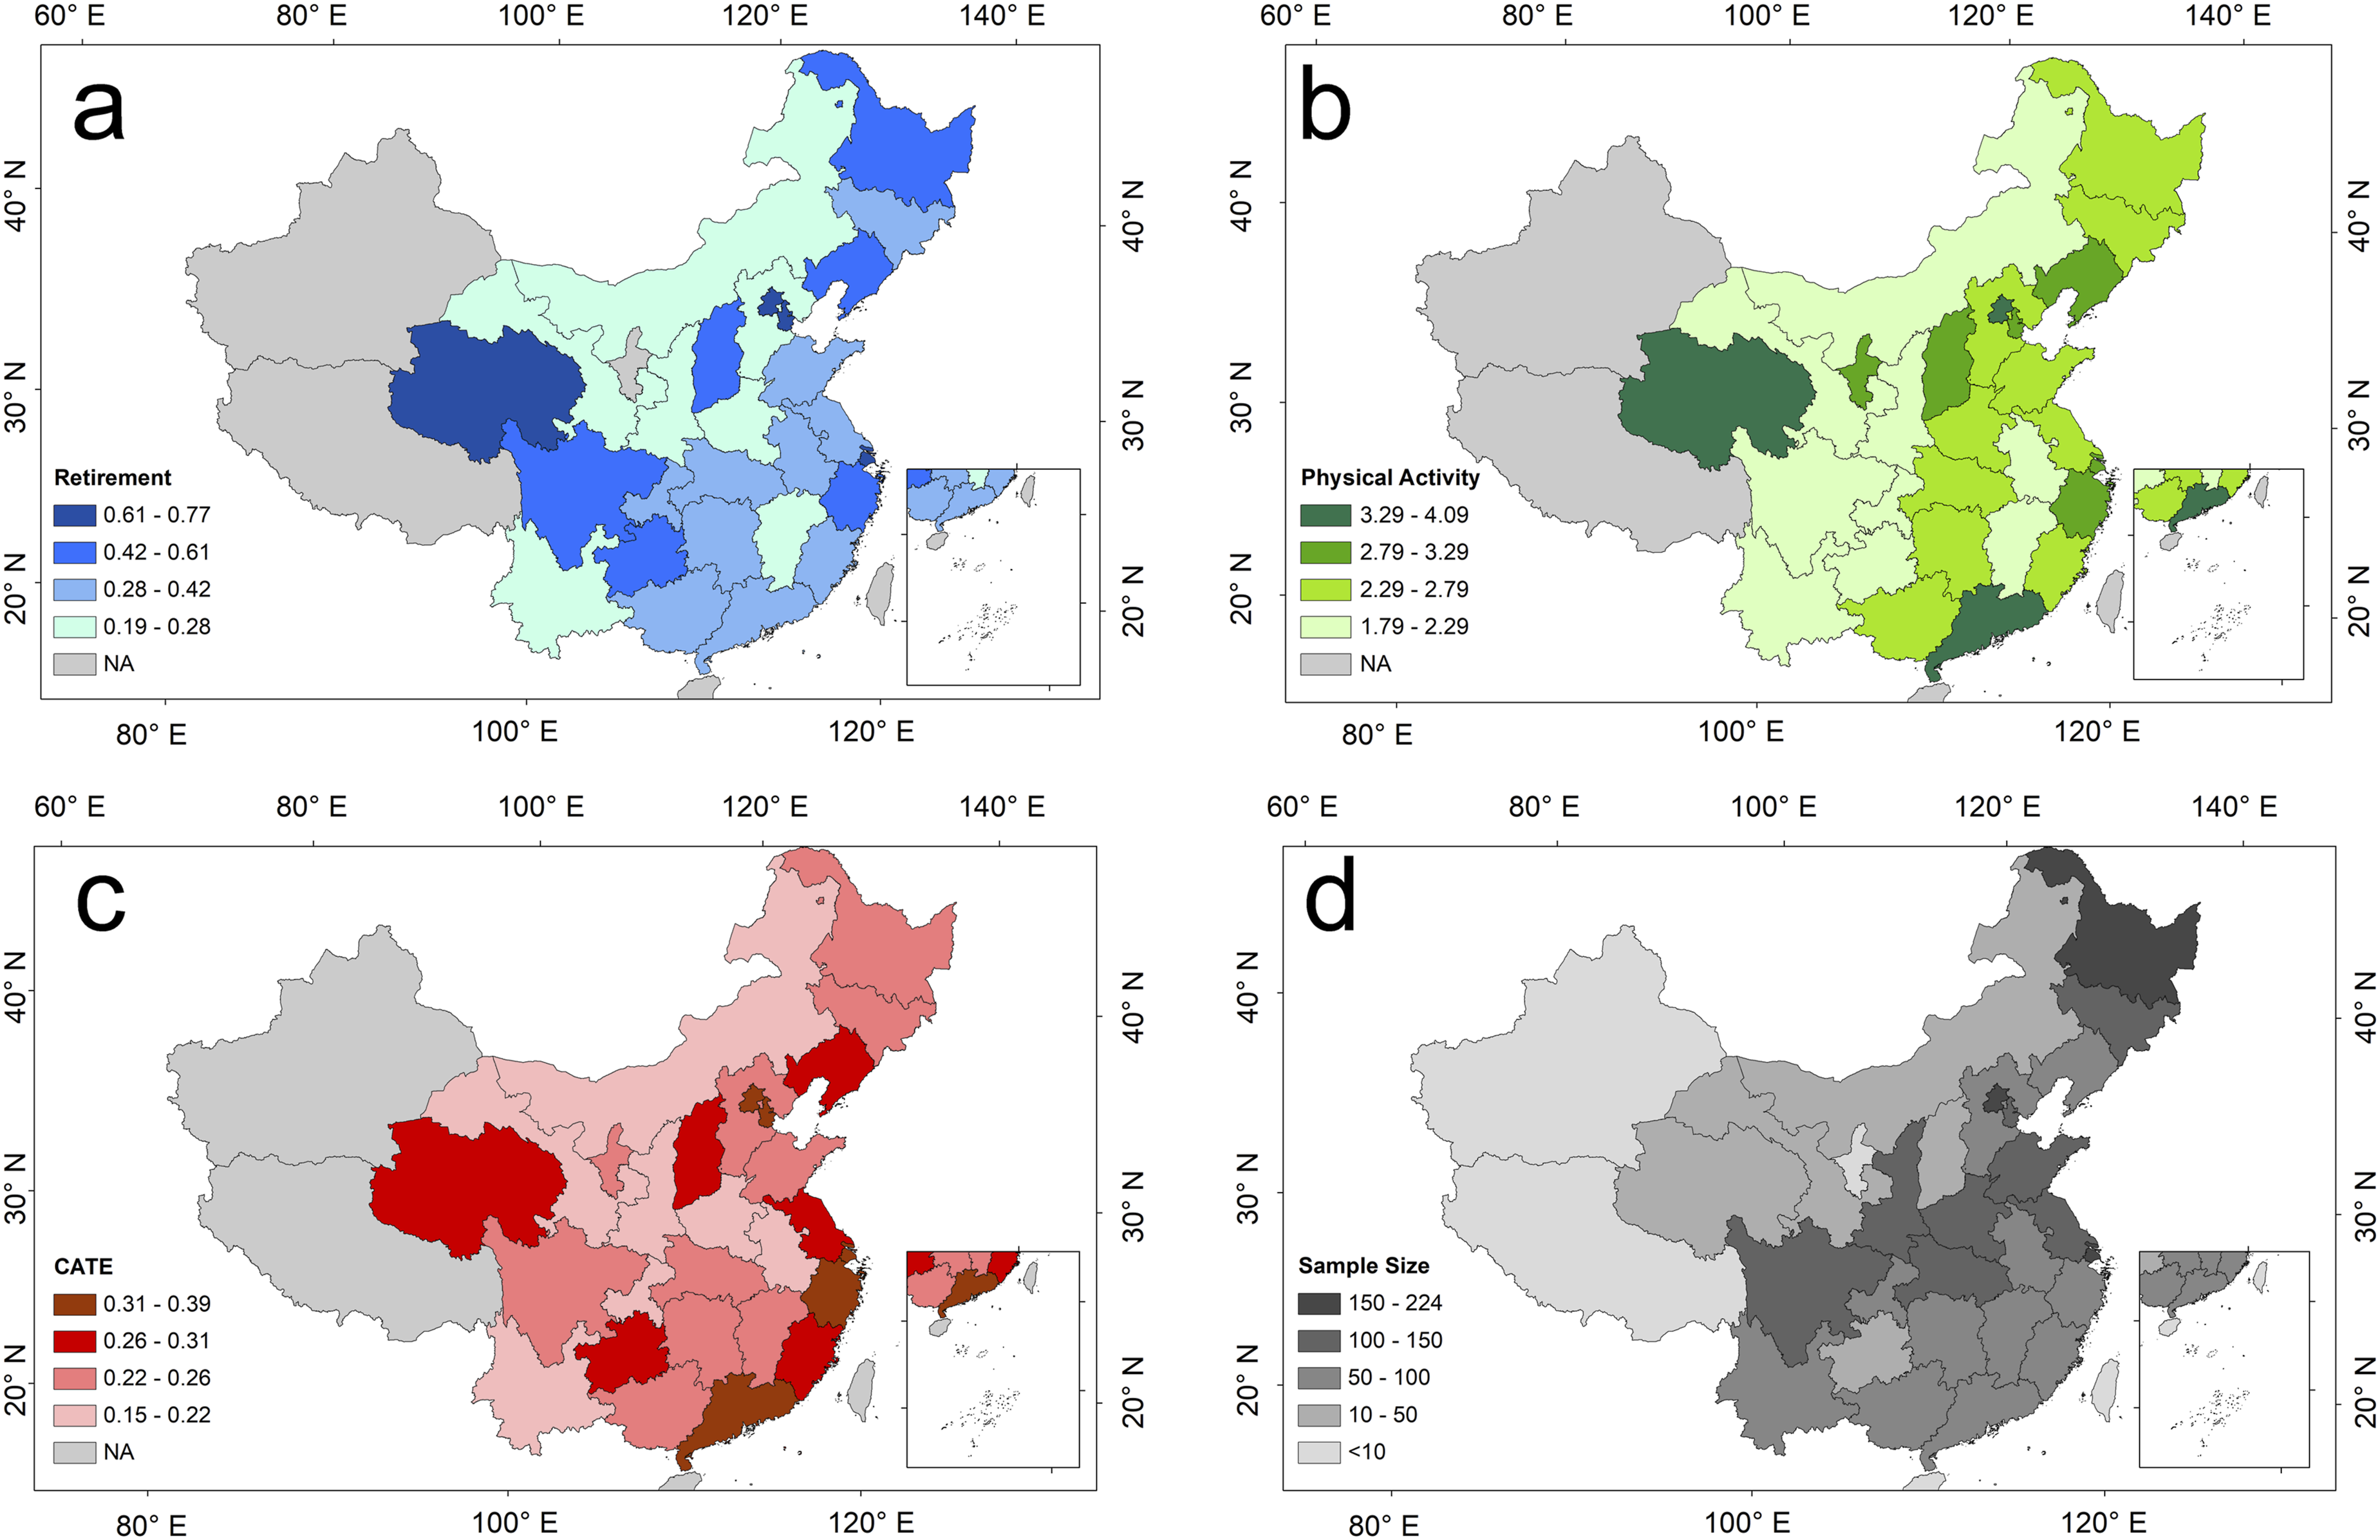
Discussion
Our findings align with existing studies from high-income countries, where retirement is generally associated with higher PA among older adults (Brainard et al., 2020; Glasson et al., 2023). In our Chinese male sample, retirement likewise significantly increases PA. Disaggregating by employment type and occupation, the positive effect is concentrated among full-time and non-farming workers. For part-time and farming workers, the point estimates are large in magnitude but not statistically significant (Appendix Table A1). The most plausible explanation is limited precision from smaller subsamples and weaker compliance with the statutory age 60 cutoff in China, where these groups are less tightly bound by formal retirement because of uneven pension coverage and continued informal work (Williamson et al., 2017). This contrasts with evidence from Finland, where retired manual laborers experience declines in PA (Pulakka et al., 2020). In the Chinese context, farming workers show no measurable change rather than a decline, plausibly reflecting the persistence of informal and non-market labor in rural settings. Many rural residents continue physically demanding agricultural tasks or provide intergenerational caregiving, which can substitute for leisure-time PA. These patterns point to institutional and cultural differences: retirement in many high-income settings marks a clearer boundary between work and leisure, whereas in China, especially in rural areas, the transition is more blurred by fragmented welfare coverage and enduring family obligations.
We also reveal that the effect of retirement on PA depends on individual conditions. Economic resources amplify the effect: higher-income individuals benefit more from the transition, which aligns with the descriptive evidence that financially secure individuals are more likely to retire on time at age 60. Health status enhances the capacity to translate retirement into more active lifestyles, consistent with health capital theory that emphasizes functional reserves in shaping health investments (Goryakin et al., 2015; Grossman, 1972). By contrast, psychological stress substantially limits these behavioral responses and can nearly offset the benefits among highly stressed individuals (Stenholm et al., 2016). Overall, the effect of retirement on PA is not uniform, but shaped by the interplay of financial capacity, health status, and psychological stress.
CF analysis highlights income as the most influential moderator of the retirement-PA relationship, underscoring the central role of financial resources in enabling healthier lifestyle adjustments after leaving the workforce. This aligns with evidence that socioeconomic security reduces constraints on health-promoting behaviors (Celidoni & Rebba, 2017; Xue et al., 2021). When accounting for provincial clustering, the importance of social participation and caregiving rises, reflecting that retirement in China is both a social and family-based transition. Prior studies suggest that maintaining social ties can buffer against declines in activity (Barnett et al., 2012; Socci et al., 2021), while caregiving obligations may substitute for or crowd out opportunities for PA (Feng & Zhang, 2018; Ko & Hank, 2014). In addition, the salience of residency further underscores urban-rural disparities, implying that policies to promote active aging should expand opportunities for community engagement, prioritize rural older adults, narrow urban-rural gaps, and help individuals balance intergenerational caregiving with their own health needs.
Beyond individual-level heterogeneity, we also document substantial regional variation in the retirement-PA relationship. Stronger effects appear in more developed eastern and central provinces, while weaker effects are found in less developed western regions. These spatial patterns cannot be fully explained by retirement rates or baseline PA levels. They likely reflect broader contextual factors, including infrastructure, the maturity of pension and social support systems, and prevailing social norms surrounding aging. In China, where regional disparities in economic development and institutional capacity remain pronounced, these differences highlight the importance of considering place-based determinants of retirement transitions (Chen & Jin, 2022).
Translating these findings into policy suggests two directions for regionally adaptive support. On the one hand, strengthen both physical and psychological support systems for older adults, especially in underdeveloped regions. Targeted investment in accessible, affordable community fitness facilities, together with integrating stress management and counseling into pension and primary care systems, can help close behavioral response gaps. On the other hand, enhance policy coordination and local adaptation. Given the regional disparities in effects, subnational governments should have latitude to tailor strategies to local needs. Developed regions might focus on chronic disease management and community rehabilitation, while less developed areas prioritize foundational infrastructure and service equalization. Linking funding to measurable outcomes and improving cross-department collaboration can increase the responsiveness and effectiveness of retirement policies.
Limitations
Some limitations should be acknowledged. First, the outcome relies on self-reported data, which may be subject to reporting bias. Second, while retirement status is measured at the time of the survey, the PA item asks about activity in the “past year,” which introduces temporal mismatch in our measures and may affect the estimates. Third, the analysis is restricted to Chinese men and the available data do not provide fine-grained distinctions across employment types or retirement pathways, which may limit the scope of subgroup analyses. Fourth, our spatial heterogeneity analysis is conducted at the provincial level, which may obscure within-province variation. With larger and more diverse samples, future research could extend to city- or county-level variation and incorporate more detailed occupational classifications, which may uncover additional place-based and subgroup-specific patterns of retirement effects.
Conclusion
Using an FRD design, this study provides causal evidence that retirement increases physical activity among older Chinese men. Across 2SLS and LPR specifications, retirement raises the PA score by about 1.8 units (about 70% of the sample mean and 1.1 SD), and the results are robust to alternative specifications. However, these averages conceal systematic variation. Effects are larger among higher-income and healthier individuals, whereas psychological stress markedly attenuates responses and can nearly offset gains at high stress levels. CF analysis highlights income as the most influential moderator. After clustering at the province level, the roles of social participation and caregiving increase, and disparities between urban and rural areas become more salient. Regionally, effects are strongest in eastern provinces, mixed in the central region, and uneven across the west. These patterns support context-sensitive policies: in more developed areas, sustain healthy routines among retirees; in less-developed areas, prioritize basic PA infrastructure and accessible mental-health services so that older adults can fully benefit from retirement.
Footnotes
Acknowledgements
The authors would like to thank the editor and the anonymous reviewers for their constructive comments and valuable suggestions, which have greatly improved the quality of this manuscript.
Ethical Considerations
This article does not contain any studies with human or animal participants.
Author Contributions
Jiahao Zhu, the author was responsible for the study design, data analysis, and manuscript.
Funding
The author received no financial support for the research, authorship, and/or publication of this article.
Declaration of Conflicting Interests
The author declared no potential conflicts of interest with respect to the research, authorship, and/or publication of this article.
Data Availability Statement
The datasets generated during and/or analyzed during the current study are available from the corresponding author on reasonable request.
Author Biography
Appendix
McCrary Density Test for Running Variable Manipulation Covariate Balance Plots Placebo Cutoff Simulations Bandwidth Sensitivity Analysis Variable Importance—non-clustered Model Variable Importance—Clustered by Province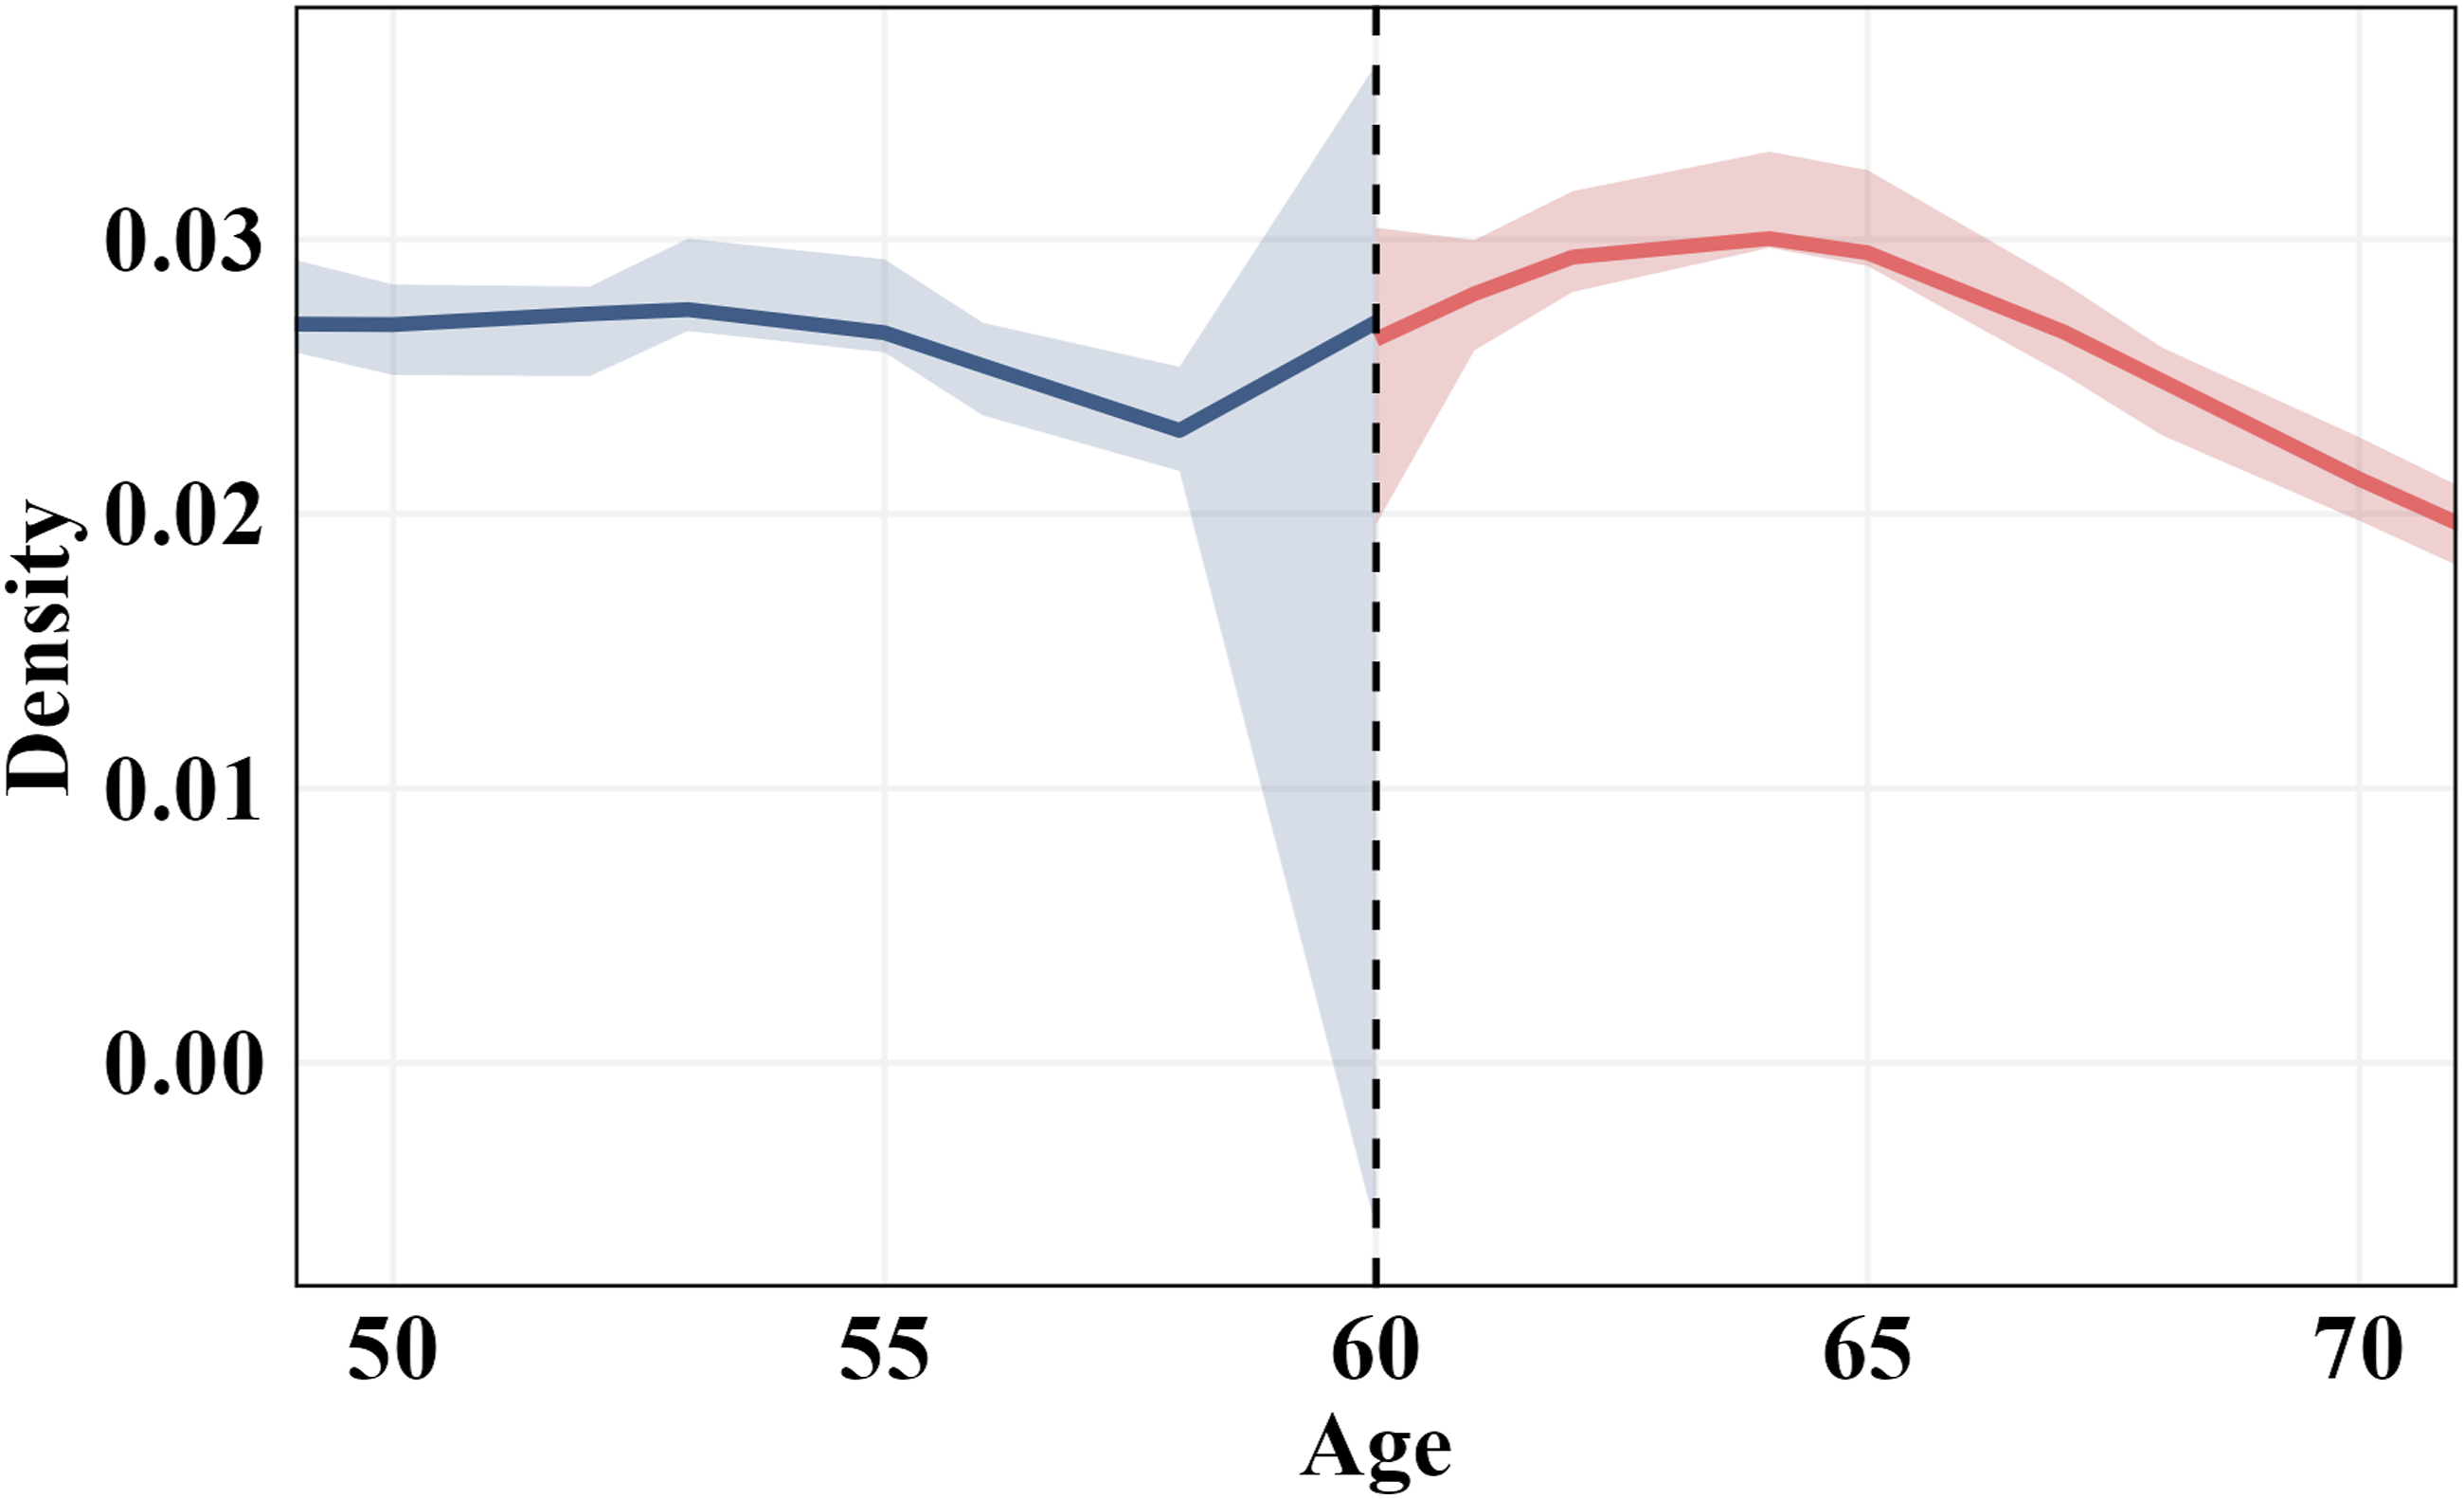
Subgroup Estimates of the Effect of Retirement on PA: Employment Type and Occupation Notes. Columns (1) and (2) distinguish between full-time and part-time workers, while Columns (3) and (4) distinguish between non-farming and farming occupations. Robust standard errors are reported in parentheses. ***p < .001, **p < .01, *p < .05.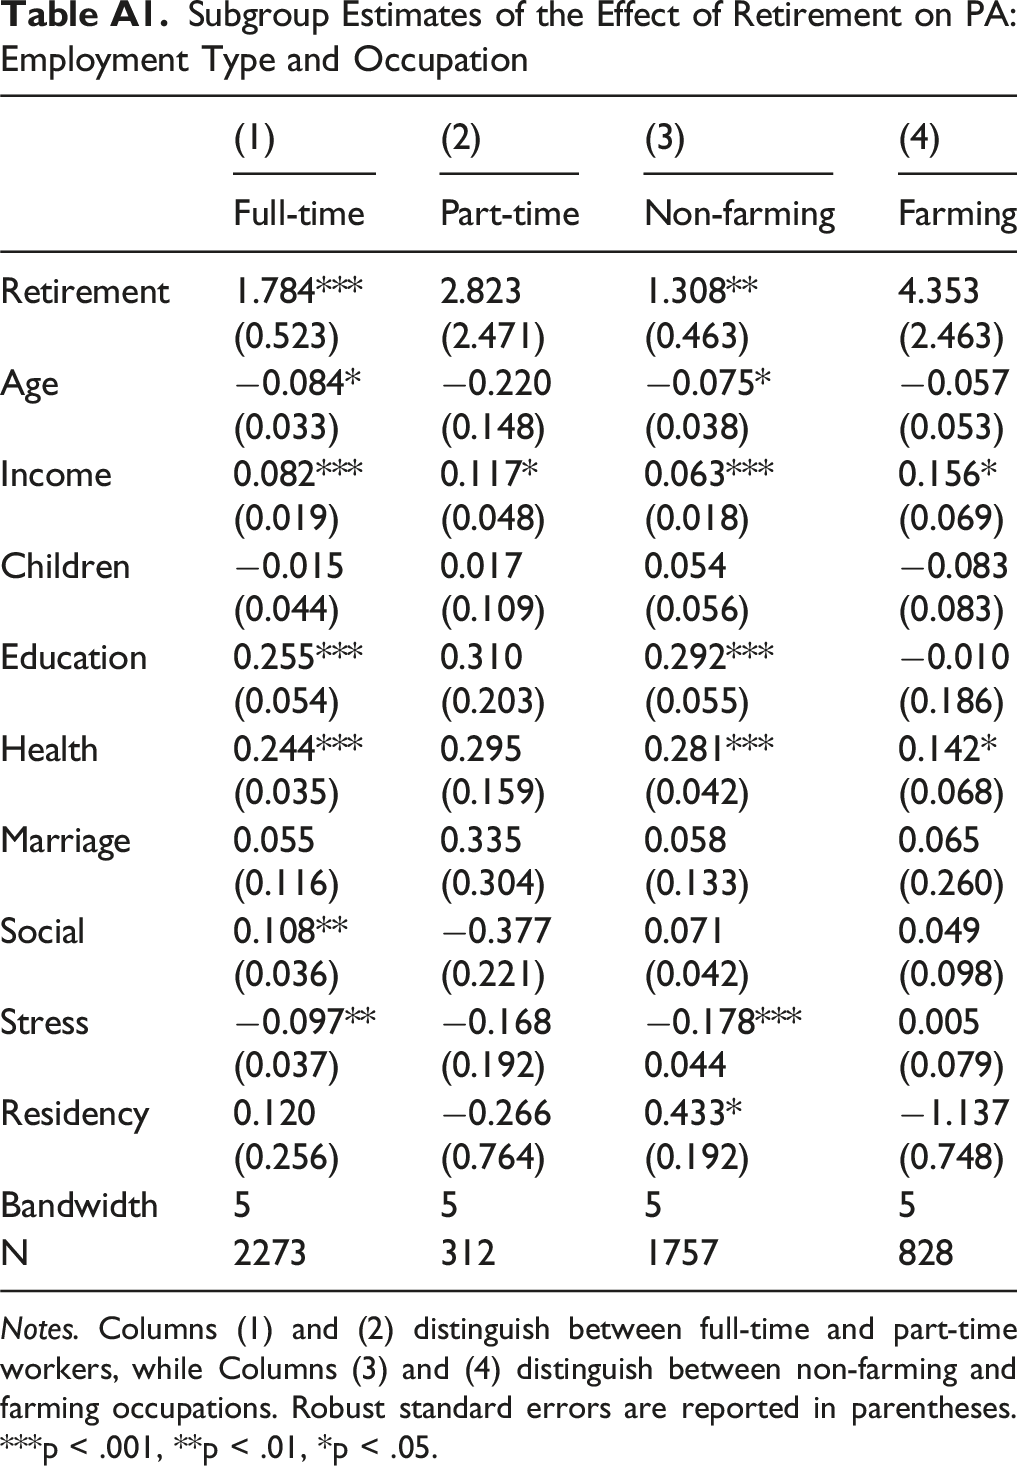
(1)
(2)
(3)
(4)
Full-time
Part-time
Non-farming
Farming
Retirement
1.784***
2.823
1.308**
4.353
(0.523)
(2.471)
(0.463)
(2.463)
Age
−0.084*
−0.220
−0.075*
−0.057
(0.033)
(0.148)
(0.038)
(0.053)
Income
0.082***
0.117*
0.063***
0.156*
(0.019)
(0.048)
(0.018)
(0.069)
Children
−0.015
0.017
0.054
−0.083
(0.044)
(0.109)
(0.056)
(0.083)
Education
0.255***
0.310
0.292***
−0.010
(0.054)
(0.203)
(0.055)
(0.186)
Health
0.244***
0.295
0.281***
0.142*
(0.035)
(0.159)
(0.042)
(0.068)
Marriage
0.055
0.335
0.058
0.065
(0.116)
(0.304)
(0.133)
(0.260)
Social
0.108**
−0.377
0.071
0.049
(0.036)
(0.221)
(0.042)
(0.098)
Stress
−0.097**
−0.168
−0.178***
0.005
(0.037)
(0.192)
0.044
(0.079)
Residency
0.120
−0.266
0.433*
−1.137
(0.256)
(0.764)
(0.192)
(0.748)
Bandwidth
5
5
5
5
N
2273
312
1757
828
PA as a Moderator of Retirement Effects on Income, Stress, and Health Note. PA denotes physical activity. All regressions are estimated using OLS with robust standard errors in parentheses. Each model includes the same set of control variables as in the main moderation analysis. The interaction term “Retirement × PA” tests whether physical activity moderates the effect of retirement on the respective outcome (Income, Stress, or Health). ***p < .001, **p < .01, *p < .05.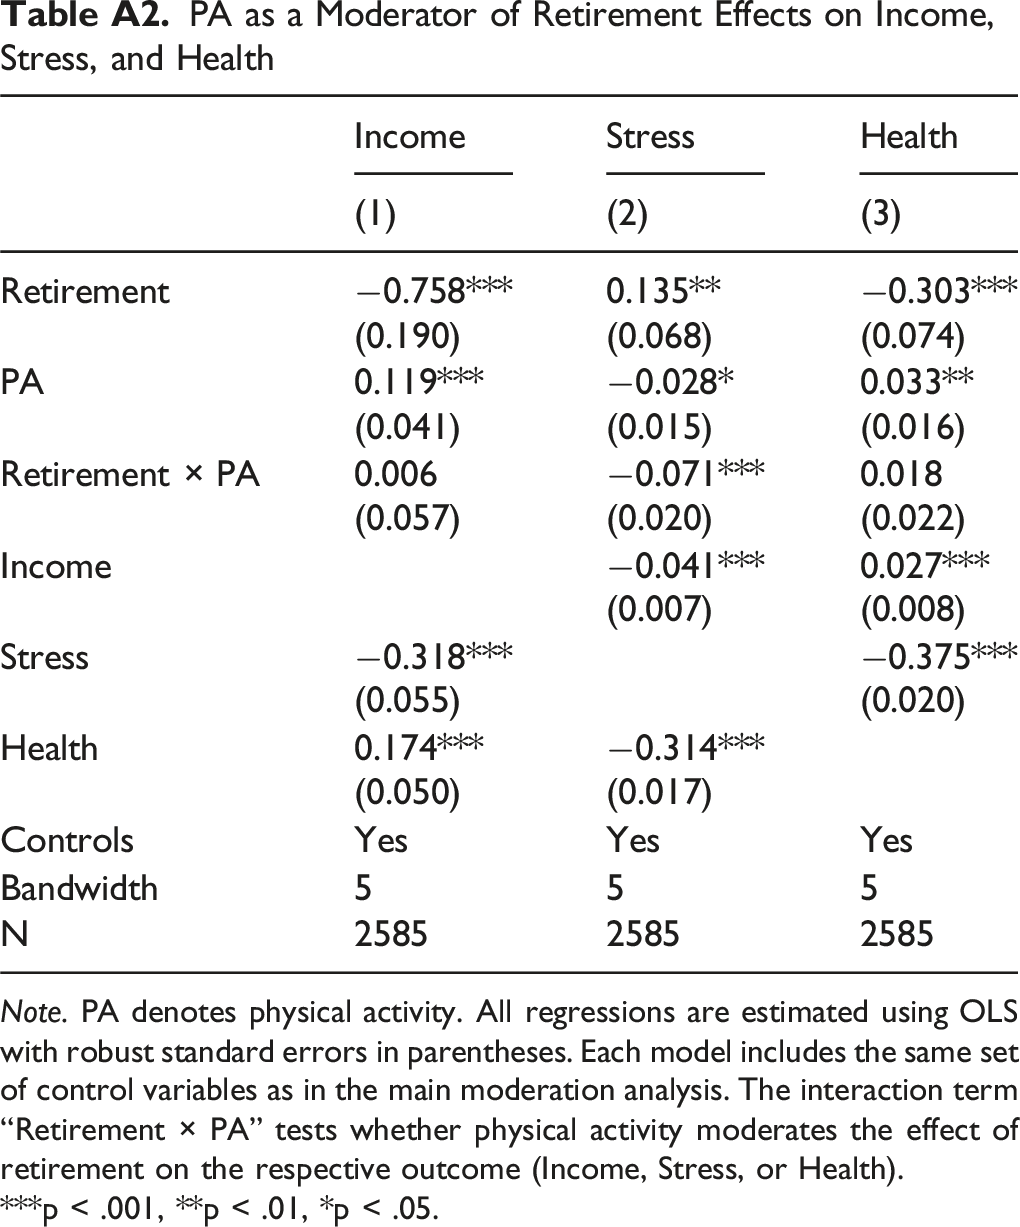
Income
Stress
Health
(1)
(2)
(3)
Retirement
−0.758***
0.135**
−0.303***
(0.190)
(0.068)
(0.074)
PA
0.119***
−0.028*
0.033**
(0.041)
(0.015)
(0.016)
Retirement × PA
0.006
−0.071***
0.018
(0.057)
(0.020)
(0.022)
Income
−0.041***
0.027***
(0.007)
(0.008)
Stress
−0.318***
−0.375***
(0.055)
(0.020)
Health
0.174***
−0.314***
(0.050)
(0.017)
Controls
Yes
Yes
Yes
Bandwidth
5
5
5
N
2585
2585
2585
Continuity Test for Covariates at the Retirement Threshold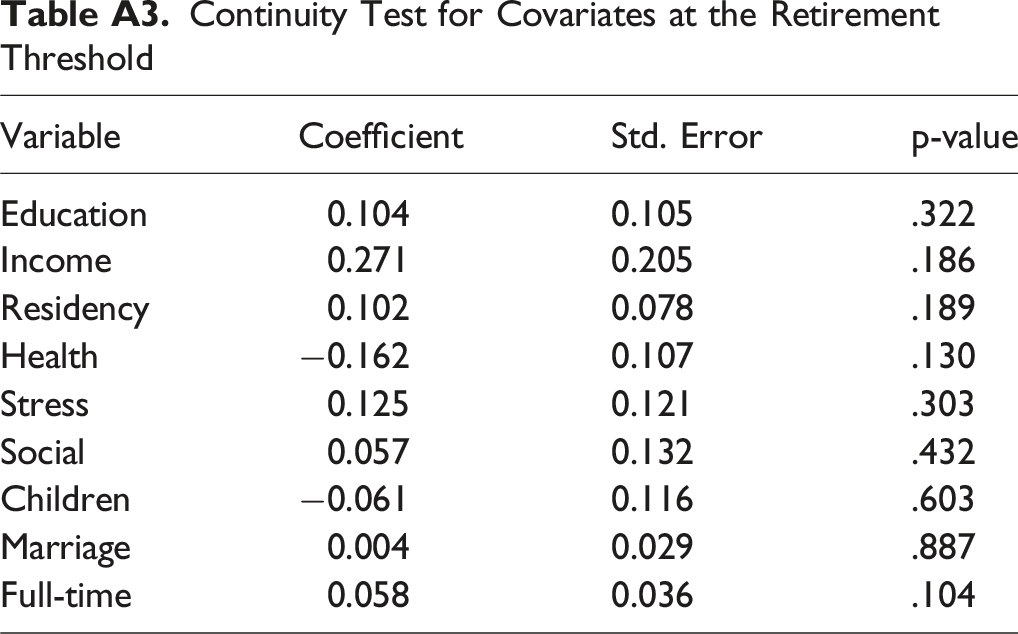
Variable
Coefficient
Std. Error
p-value
Education
0.104
0.105
.322
Income
0.271
0.205
.186
Residency
0.102
0.078
.189
Health
−0.162
0.107
.130
Stress
0.125
0.121
.303
Social
0.057
0.132
.432
Children
−0.061
0.116
.603
Marriage
0.004
0.029
.887
Full-time
0.058
0.036
.104