Abstract
This study examines life courses and retirement adjustment in the Netherlands. Gender-split latent class analyses identify four distinct trajectories among men and women, covering life events in work, family, health, care, and volunteering. The largest trajectories indicate traditional male and female life courses. Compared to those with traditional male trajectories, men with lifelong volunteering adjust better to retirement, financially, socially, and psychologically. Despite family and health issues, men making careers through mobility miss the prestige of work less, but men with late-career mobility are similar to the reference group. Women combining work with care and volunteering adjust better to retirement, missing work-related income, prestige, and role fulfillment less, while work-oriented carers do not differ from women with traditional female trajectories. However, mothers re-entering employment after childcare face financial challenges in retirement. These findings highlight gender differences in life courses and support the dynamic resource perspective on retirement adjustment.
Introduction
Retirement is a major life transition. With this transition, people adopt new routines, renegotiate social relationships, and redefine personal identity in the absence of work (Wanka, 2020). This means that retirees undergo a process of adjustment, where they deal with the changes that retirement brings.
Retirement adjustment refers to the extent to which individuals integrate retirement into their lives and feel comfortable with the changes (Van Solinge, 2013). Research has found substantial differences between individuals, with some adjusting easily to retirement and others having difficulties. This variation is often linked to changing resources, including finances and health, and characteristics of the retirement transition, such that those with more resources and voluntary transitions adjust better (Van Solinge & Henkens, 2008). However, these findings are based on personal circumstances during or after retirement, leaving it unclear how the capacity to navigate retirement unfolds over the life course.
It is valuable to examine retirement adjustment from a life course perspective because focusing only on the period around retirement overlooks how experiences evolve and interact over time. For a better understanding of retirement adjustment, we should examine people’s dynamic trajectories that span multiple stages and domains over the life course. Retirement adjustment is then not only seen as a process dependent on current resources, but also as a process embedded in the entire life course.
When studying how life course trajectories lead to differences in retirement adjustment, it is important to consider gender. Women’s careers typically include breaks for childbirth and informal care (Raiber et al., 2024). While women earn less due to caregiving and the motherhood penalty, men mostly work continuously and earn more thanks to the fatherhood bonus (Brady, 2024). These disparities persist in retirement, with women receiving lower pensions and caring more for grandchildren or parents (Grünwald et al., 2024). Women also do more unpaid work for society by volunteering within organizations, both during their career and in retirement (Wiepking et al., 2023). In contrast, men do more leisure or paid work after retiring (Wanka, 2020). Overall, men and women forge distinct paths in earlier life that crystallize in later life, producing potential differences in retirement adjustment.
In this study, we answer two questions: (1) How do life courses, including work, family, health, care, and volunteering trajectories before retirement, unfold among men, and how do they unfold among women? and (2) To what extent do life courses explain retirement adjustment for men and for women?
By answering these questions, we make three contributions. First, we deliver a holistic analysis of the life course by considering work, family, health, care, and volunteering trajectories simultaneously, for both men and women. Prior research focused exclusively on work-family trajectories, with health often placed within work trajectories (Machů et al., 2022). Caregiving and volunteering have usually been explored in isolation, despite their interplay with work, family, and health via time commitments, role transitions, and physical or mental demands (Burr et al., 2007; Carr et al., 2023). By integrating both long-term caregiving (i.e., caring for ill or older people, which is distinct from minor care or childcare) and volunteering with work, family, and health, we paint a fuller picture of the life course.
Second, we offer new insights into the dynamic nature of life courses with a nuanced measurement, especially in the work domain. Unlike earlier studies prioritizing working hours and employment types, we examine events that capture labor market mobility. Besides self-employment and unemployment, we assess promotion, demotion, employer and occupation changes, and quitting work for children. Using these indicators, we move beyond static categorizations to reveal the impact of transformative experiences, which improve our understanding of gender inequalities, as men and women face distinct facilitators and barriers in career progression (Deschacht, 2017; Pearlman, 2018).
Third, we extend the holistic and dynamic life course perspective to retirement adjustment. Some studies linked work-family trajectories to retirement timing, voluntariness, and income, but the role of multi-domain trajectories in retirement adjustment remains unknown (Madero-Cabib & Fasang, 2016). The retirement adjustment literature has inspected events at certain life stages within isolated domains (Barbosa et al., 2016). We fill this gap by investigating how complete life course trajectories across multiple life domains influence retirement adjustment among men and women. In doing so, we advance our knowledge of the cumulative effect of earlier-life experiences on retirement adjustment.
Traditionally, retirement adjustment has been measured as subjective well-being or life satisfaction (Wang et al., 2011). Though useful, these measures omit the adaptation to the loss of work roles. Following Damman et al. (2015), we adopt a multidimensional measure concerning how much retirees miss different aspects of work, including income, social contacts, and societal prestige. We expand this measure with societal role fulfillment, as work grants not only financial and social but also psychological rewards through a sense of meaning and recognition, which are central to fulfilling roles in society (Rosso et al., 2010). Our measure displays multiple facets of missing work after retirement and enriches our multi-sphere life course approach, particularly in care and volunteering spheres that relate to societal role fulfillment, helping us better show how men and women adjust to retirement.
Our study takes place in the Dutch context and draws on the Netherlands Interdisciplinary Demographic Institute’s Pension Panel Study (NPPS), using data from workers transitioning into retirement, aged 60-65 at baseline. Our sample is a targeted group, excluding older adults without a work history or those who exited the workforce earlier. However, this selectivity is relevant for our research, since our dependent variables concern how much individuals miss work after retirement. For individuals who were not working at older ages, these outcomes are less applicable.
Theoretical Framework
Life Course Perspective
Consistent with our comprehensive approach that covers trajectories across multiple life domains, we adopt a life course perspective. The life course perspective views human development as a process unfolding over time, characterized by path dependency, where earlier events determine later ones (Elder et al., 2003). Events are also interdependent across life domains, meaning that transitions in one domain influence another, such as stopping volunteering after illness. While these mechanisms apply broadly, gender affects the formation of life courses, shaping opportunities and constraints, especially in countries like the Netherlands, where conservative policies were once in place (Rossi, 2018). Therefore, based on theory and previous findings, we anticipate that male and female life courses share some commonalities, but also exhibit important distinctions due to gendered structures. However, since we cannot know the exact features of life courses in advance, as we employ a data-driven approach, we refrain from formulating explicit hypotheses and, instead, develop general expectations.
For men, the traditional life course in both the Dutch and the broader European context entails stability, particularly in the labor market, where continuous employment aligns with the male breadwinner norm. Men following this trajectory typically have early career progress, which later flattens, with a stable marriage that reinforces health (Machů et al., 2022). Certainly, not all men pursue this path. There will be those who forge more mobile careers. A mobile career has the potential to benefit or disrupt other life domains. For some, career mobility can be smooth and upward, with promotions that enhance health and family life, as advantages tend to accumulate (Dannefer, 2003). For others, it could be more complex or intense, containing repeated job changes with breaks in between. As highlighted in the concept of boundaryless careers, high mobility fosters professional growth, yet also fuels partner conflicts and health issues (Guan et al., 2019). These challenges may create role overload and hinder civic life, reducing time for caregiving or volunteering.
A contemporary female trajectory is a woman who works amid family duties. While this is common in the Netherlands and elsewhere and offers stability, it also features interruptions, especially with young children at home. As women often juggle multiple roles, they can diverge from this configuration by balancing or conflicting roles (Shockley et al., 2017). Like men, women may achieve upward career mobility that supports relationships and health. Yet, unlike men, these women are likely to pair successful careers, families, and good health with caregiving and volunteering. This stems from the gendered principle of informal support, which holds firmly in the Dutch context, prescribing women to give to communities, with stronger obligations on those having the capacity to do so (Wiepking et al., 2023). For other women, sustaining this capacity could be difficult. They might take long career breaks, frequently change jobs, or endure joblessness, which endangers marital and health continuity. This ultimately induces competing demands across life domains, likely hampering civic participation.
Overall, combining insights from theory and research on the male breadwinner norm, cumulative (dis)advantage mechanism, concept of boundaryless careers, and gendered principle of informal support, we expect life courses that are typical of older men and women in today’s society, involving stability and security, though in distinct ways, with more career breaks among women. Besides these normative configurations, we also envision men and women with upward career mobility, alongside favorable family and health conditions. While men in such a trajectory will likely not engage in civic activities, women will combine upward career mobility, intact family, and good health with caregiving and volunteering. Finally, for both genders, we presume groups that have turbulent careers, with struggles in work, family, and health domains, leaving less room for caregiving and volunteering.
Dynamic Resource Perspective
In linking life courses to retirement adjustment, we do not formulate hypotheses because we do not know the nature of life courses a-priori. Still, we propose general expectations, which are not gender-specific, as we study life courses separately among men and women. To substantiate our expectations, we use Wang et al.’s (2011) dynamic resource perspective on retirement adjustment. Integrating earlier theoretical frameworks, this perspective argues that retirement adjustment is shaped by temporal changes in financial, social, and psychological resources. When these resources increase over time, retirement adjustment becomes easier, but decreases in resources, such as declining health or social engagement, can hurt adjustment. The framework also addresses heterogeneity in retirement, recognizing that people forge trajectories with unique processes of resource accumulation.
Following this framework, we contend that financial adjustment to retirement depends on the accumulation of financial resources over the life course. Those who have been healthy with upward mobility during their careers receive higher pensions, which can mitigate the loss of income from work (Madero-Cabib & Fasang, 2016). Doing so alongside a lifelong partner may further ease financial adjustment, as stable family lives enhance wealth buildup and household income (Comolli et al., 2021). Others with histories of employment instability, including unemployment, breaks for childcare, or disability-related exits, are more vulnerable to missing income from work due to lower pensions, potentially experiencing financial hardship in adjusting to retirement (Barbosa et al., 2016).
Social adjustment to retirement is determined by the continuity of social resources over the life course. Consistent employment, intact families, and civic engagement help sustain social networks in retirement, making the loss of workplace contacts less consequential (Ajrouch et al., 2016). Upward mobility with higher positions during one’s career can buffer against the societal prestige loss in retirement, as prior status may still confer social recognition (Damman et al., 2015). In contrast, individuals with turbulent careers might grapple with social adjustment, especially if career instability weakens family ties. If career mobility were paired with health problems, opportunities for caregiving and volunteering could be constrained, exacerbating social adjustment difficulties (Burr et al., 2021).
Psychological adjustment to retirement lies in cultivating psychological resources over the life course. Retirees retaining good health, stable families, and upward careers before retirement are likely to enjoy a smooth psychological adjustment. Good health assists participation in productive activities, partners and children offer emotional support, and employment enables societal contributions (Lee et al., 2023). Holding higher positions can boost psychological adjustment by fostering a sense of fulfillment through mentoring and supervision. Those giving care and volunteering may find substitute roles that provide purpose in life and appreciation by others (Mutchler et al., 2003). However, persons with work, family, or health instabilities might struggle, particularly if these experiences deprived them of alternative sources of identity and recognition, like caregiving and volunteering.
We consider people with life courses typical of older men and women as reference groups because they are likely the largest groups and present a logical baseline. Relative to their counterparts, these people had relatively stable lives and preserved financial, social, and psychological resources over the life course, which are expected to help retirement adjustment in all domains (Comolli et al., 2021). Yet, after decades of similar roles and resources, retirement can break their routines, making it hard to adjust in all domains. Understanding their adjustment requires comparison with groups facing additional (dis)advantages. For instance, healthy men in stable families with upward careers and working women integrating civic participation into their lives may fare better, while those with turbulent careers and work, family, or health disruptions may struggle more than these stable groups.
Methods
Data
We used data from NPPS (Henkens et al., 2017), which is a prospective cohort study of Dutch older adults born between 1950-1955. It employs a stratified sampling procedure to recruit workers from organizations covered by the three largest occupational pension funds in the Netherlands (ABP, PfZW, BpfBouw), which represent ∼49% of wage-employed workers in the country, encompassing the government, education, care, social work, and construction sectors. These sectors include a diverse range of occupations, from high-skilled professionals (e.g., medical doctors, civil servants) to mid- and low-skilled workers (e.g., nurses, construction laborers), with a broad spectrum of income levels. To capture the experiences of those who transition to retirement, the recruited workers are aged 60-65 at baseline and work for 12+ hours per week. The baseline (Wave 1) was administered in 2015 when 15,470 questionnaires were distributed and a response rate of 44% was achieved, with 6,793 questionnaires returned. The first follow-up in 2018 (Wave 2) was fielded among the participants of Wave 1, where 5,312 questionnaires were completed (response rate 79%). The second follow-up in 2023 (Wave 3) had a response rate of 83%, involving 4,258 questionnaires.
For this study, we first selected individuals who participated in Wave 1 and in at least one of the follow-up waves, namely Wave 2 or 3 (n = 5,312). This was needed because life course variables were measured only in Wave 1, when participants were employed, and retirement adjustment variables were measured only in Wave 2 and 3, when participants were retired. Then, we selected people who were fully retired in Wave 2 or 3, excluding working retirees, as our measurement of retirement adjustment (missing work after retirement) concerned those who were fully retired (n = 4,444). Finally, we removed respondents with missing values in life course and retirement adjustment variables (n = 177), resulting in a sample of 4,267 respondents: 54.39% men and 45.61% women (see Figure A1).
The average retirement age of our sample is 65.12 years, which reflects the statutory and institutional retirement norms in the Netherlands. This implies that our data primarily capture people retiring at or close to the statutory retirement age. As a result, the study underrepresents those who retired earlier, such as workers who exited the labor force through disability, unemployment, or other exit routes.
Measurement
Retirement adjustment was measured with questions regarding how much respondents missed various aspects of work since stopping work (Damman et al., 2015). Missing money/income, social contacts, and societal prestige were each assessed by single items. Missing societal role fulfillment was evaluated with a scale averaging three items: meaning something in society, meaning something to others, and appreciation by others (α = 0.89). Response options ranged from 1 = Very much to 5 = Not at all, which were reverse-coded, so that higher scores denoted a stronger missing of a given aspect, implying a harder retirement adjustment. We used responses from the wave right after a respondent’s full retirement, namely Wave 2 for those retiring in Wave 2 and Wave 3 for those retiring in Wave 3.
The pre-retirement life course was measured with questions from Wave 1, asking whether and when respondents experienced certain events during their careers. Specifically, they were given 11 events to report if they had them between ages 20-29, 30-39, 40-49, and 50-59. Although this information was retrospective and prone to recall bias, it offers valuable insights into the long-term pattern of events. The events included: getting a higher position (promotion), getting a lower position (demotion), stopping work for children, being unemployed (> three months), changing employer, changing occupation, being self-employed, getting divorced or widowed (unpartnered), having severe physical or psychological health problems, giving long-term care, and doing volunteer work. We dropped stopping work for children between ages 40-49 and 50-59, as its prevalence beyond age 40 was negligible. This left us with 42 binary indicators spanning four decades of life across the work, family, health, caregiving, and volunteering domains.
All measures were self-reported and based on respondents’ subjective interpretations. For example, long-term care or volunteering was reported without a prespecified threshold for intensity or duration. In the Netherlands, however, long-term care is commonly understood as providing regular, unpaid care to an older or ill person in an informal capacity, often a relative or friend, while volunteering typically refers to unpaid work carried out for formal organizations, such as community centers or churches (Meijeren et al., 2025; Raiber et al., 2024). The item on severe physical or psychological health problems also relied on self-assessment of the severity. While these measures lack clear operational definitions, they capture respondents’ lived experiences and individual perceptions, which are relevant for understanding life course patterns and their relation to retirement outcomes.
Analysis
To identify diverse types of life courses, we conducted a gender-split latent class analysis (LCA). As one of the widely used methods for constructing trajectories from categorical data, LCA is suitable for our study because it helps detect distinct life course trajectories across the domains of work, family, health, caregiving, and volunteering that cannot be directly observed from individual life events alone. While regression models could examine associations between retirement adjustment and individual life events, LCA acknowledges that experiences across life domains are interdependent (cf. Dernberger & Pepin, 2020). By exploiting information from multiple domains simultaneously, LCA uncovers underlying patterns of life courses that reflect qualitatively unique subgroups in the population (Wurpts & Geiser, 2014). The subgroups share certain features and exhibit homogeneity, called latent classes, which are unobserved variables derived from responses to observed variables. It is assumed that membership in latent classes explains patterns of responses across indicators, and individuals are assigned to classes based on their probability of being in a class according to the profile of their scores.
We conducted LCA in Mplus, implementing user-specified starting values with random starts and maximum likelihood estimation with robust standard errors. For both men and women, we started with a two-class model and went up to five classes, as models became unstable after five classes. We determined the number of classes based on fit indices and theoretical interpretability. Fit indices included the Akaike Information Criterion (AIC), Bayesian Information Criterion (BIC), sample-adjusted BIC (SABIC), and −2 Log-Likelihood (-2LL), on which lower values mean better-fitting models. We also checked diagnostic criteria, such as entropy, average latent class probability, bootstrapped likelihood ratio test, and class size. Although diagnostic criteria are not commonly used to select a final model, we nevertheless examined and considered them, particularly when fit indices did not clearly indicate a single solution, as recommended by Weller et al. (2020).
After selecting a model, we assigned people to one of the identified classes by the highest probability of membership. We then used the classes as predictors of retirement adjustment, running separate and gender-split ordinary-least squares (OLS) linear regression analyses on the four outcome variables. These linear regressions were performed in Stata, using the command regress, and accounted for respondents’ nesting within organizations where they worked at baseline, with robust standard errors clustered at the organization level, using the command vce(cluster).
We also conducted sensitivity checks. First, we re-estimated OLS linear regressions with control variables. We added educational level, occupational class, income, wealth, health, relationship status, number of children, and time since retirement as control variables because these are the commonly studied and established predictors of retirement adjustment (Barbosa et al., 2016; Van Solinge, 2013). All control variables were measured at Wave 1, except for time since retirement, which was computed based on Wave 2 and 3. Second, we executed logistic regressions instead of OLS linear regressions, using the command logit, without control variables and with the same specifications as the main analysis. The results of sensitivity checks were largely consistent with the main findings, as can be seen in Table A1 (OLS linear regressions with control variables) and Figure A2 (logistic regressions).
Results
Identifying Life Courses
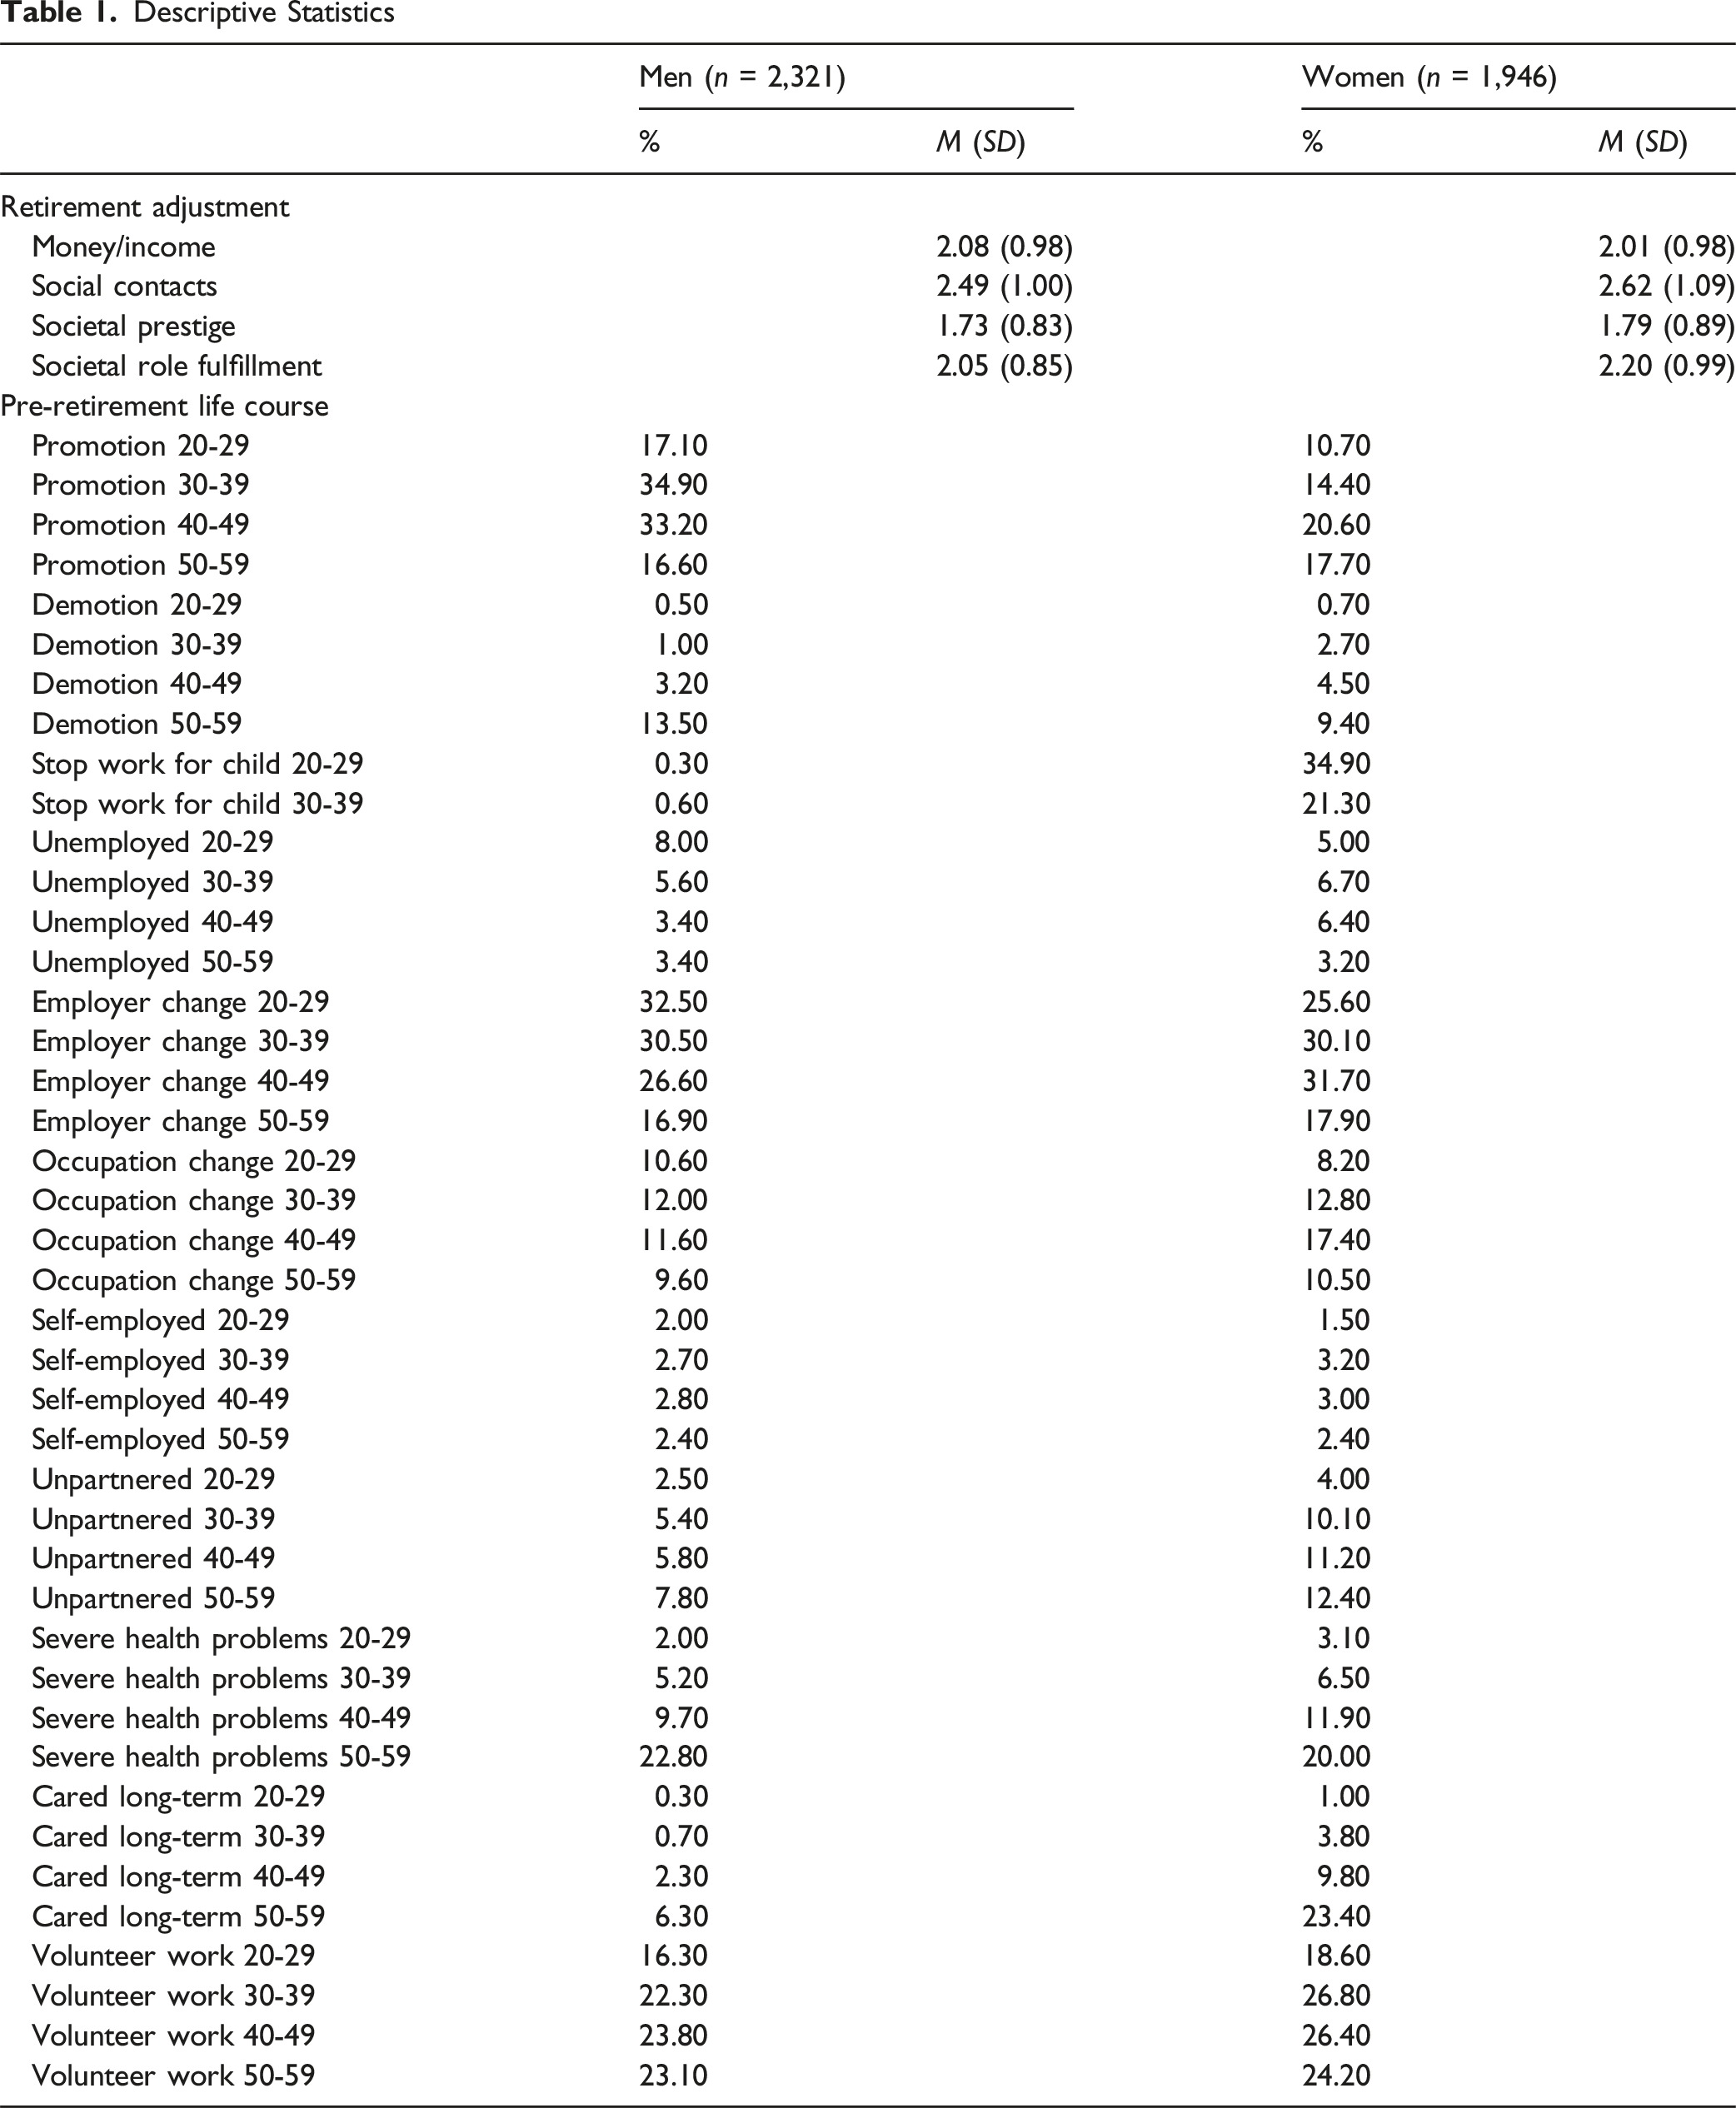
Descriptive Statistics
Fit Indices and Diagnostic Criteria for Latent Class Models From Two to Five Classes
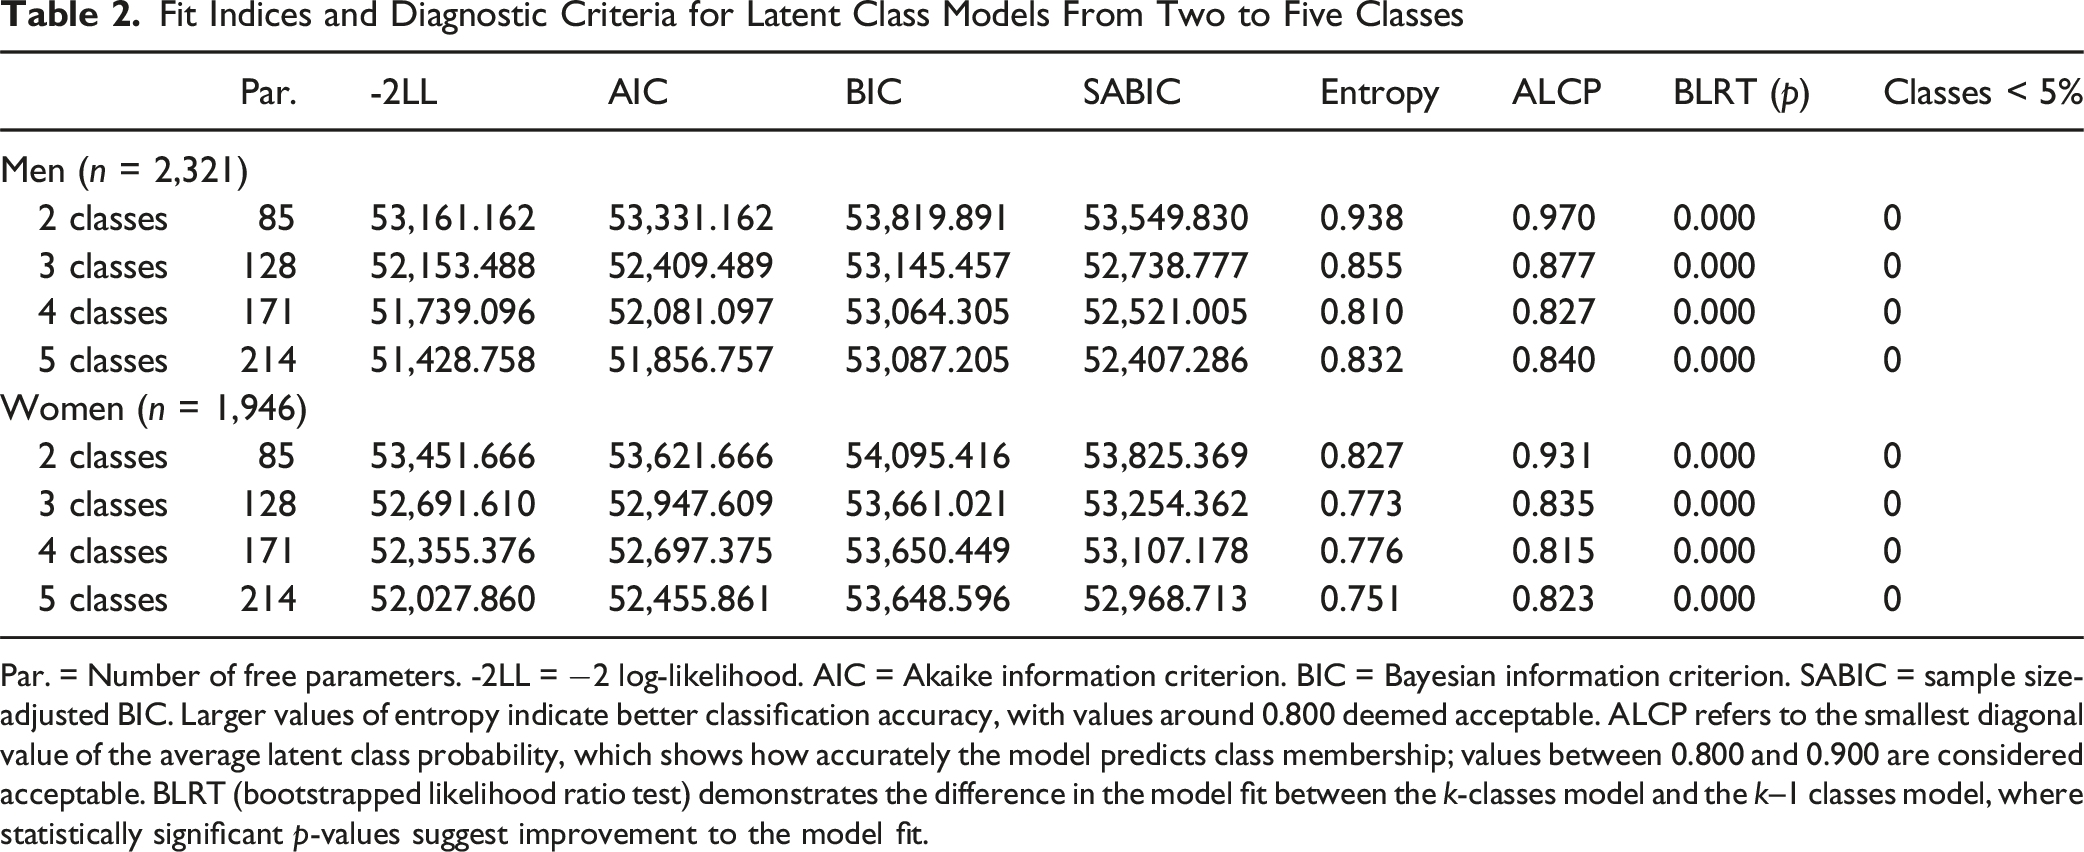
Par. = Number of free parameters. -2LL = −2 log-likelihood. AIC = Akaike information criterion. BIC = Bayesian information criterion. SABIC = sample size-adjusted BIC. Larger values of entropy indicate better classification accuracy, with values around 0.800 deemed acceptable. ALCP refers to the smallest diagonal value of the average latent class probability, which shows how accurately the model predicts class membership; values between 0.800 and 0.900 are considered acceptable. BLRT (bootstrapped likelihood ratio test) demonstrates the difference in the model fit between the k-classes model and the k–1 classes model, where statistically significant p-values suggest improvement to the model fit.
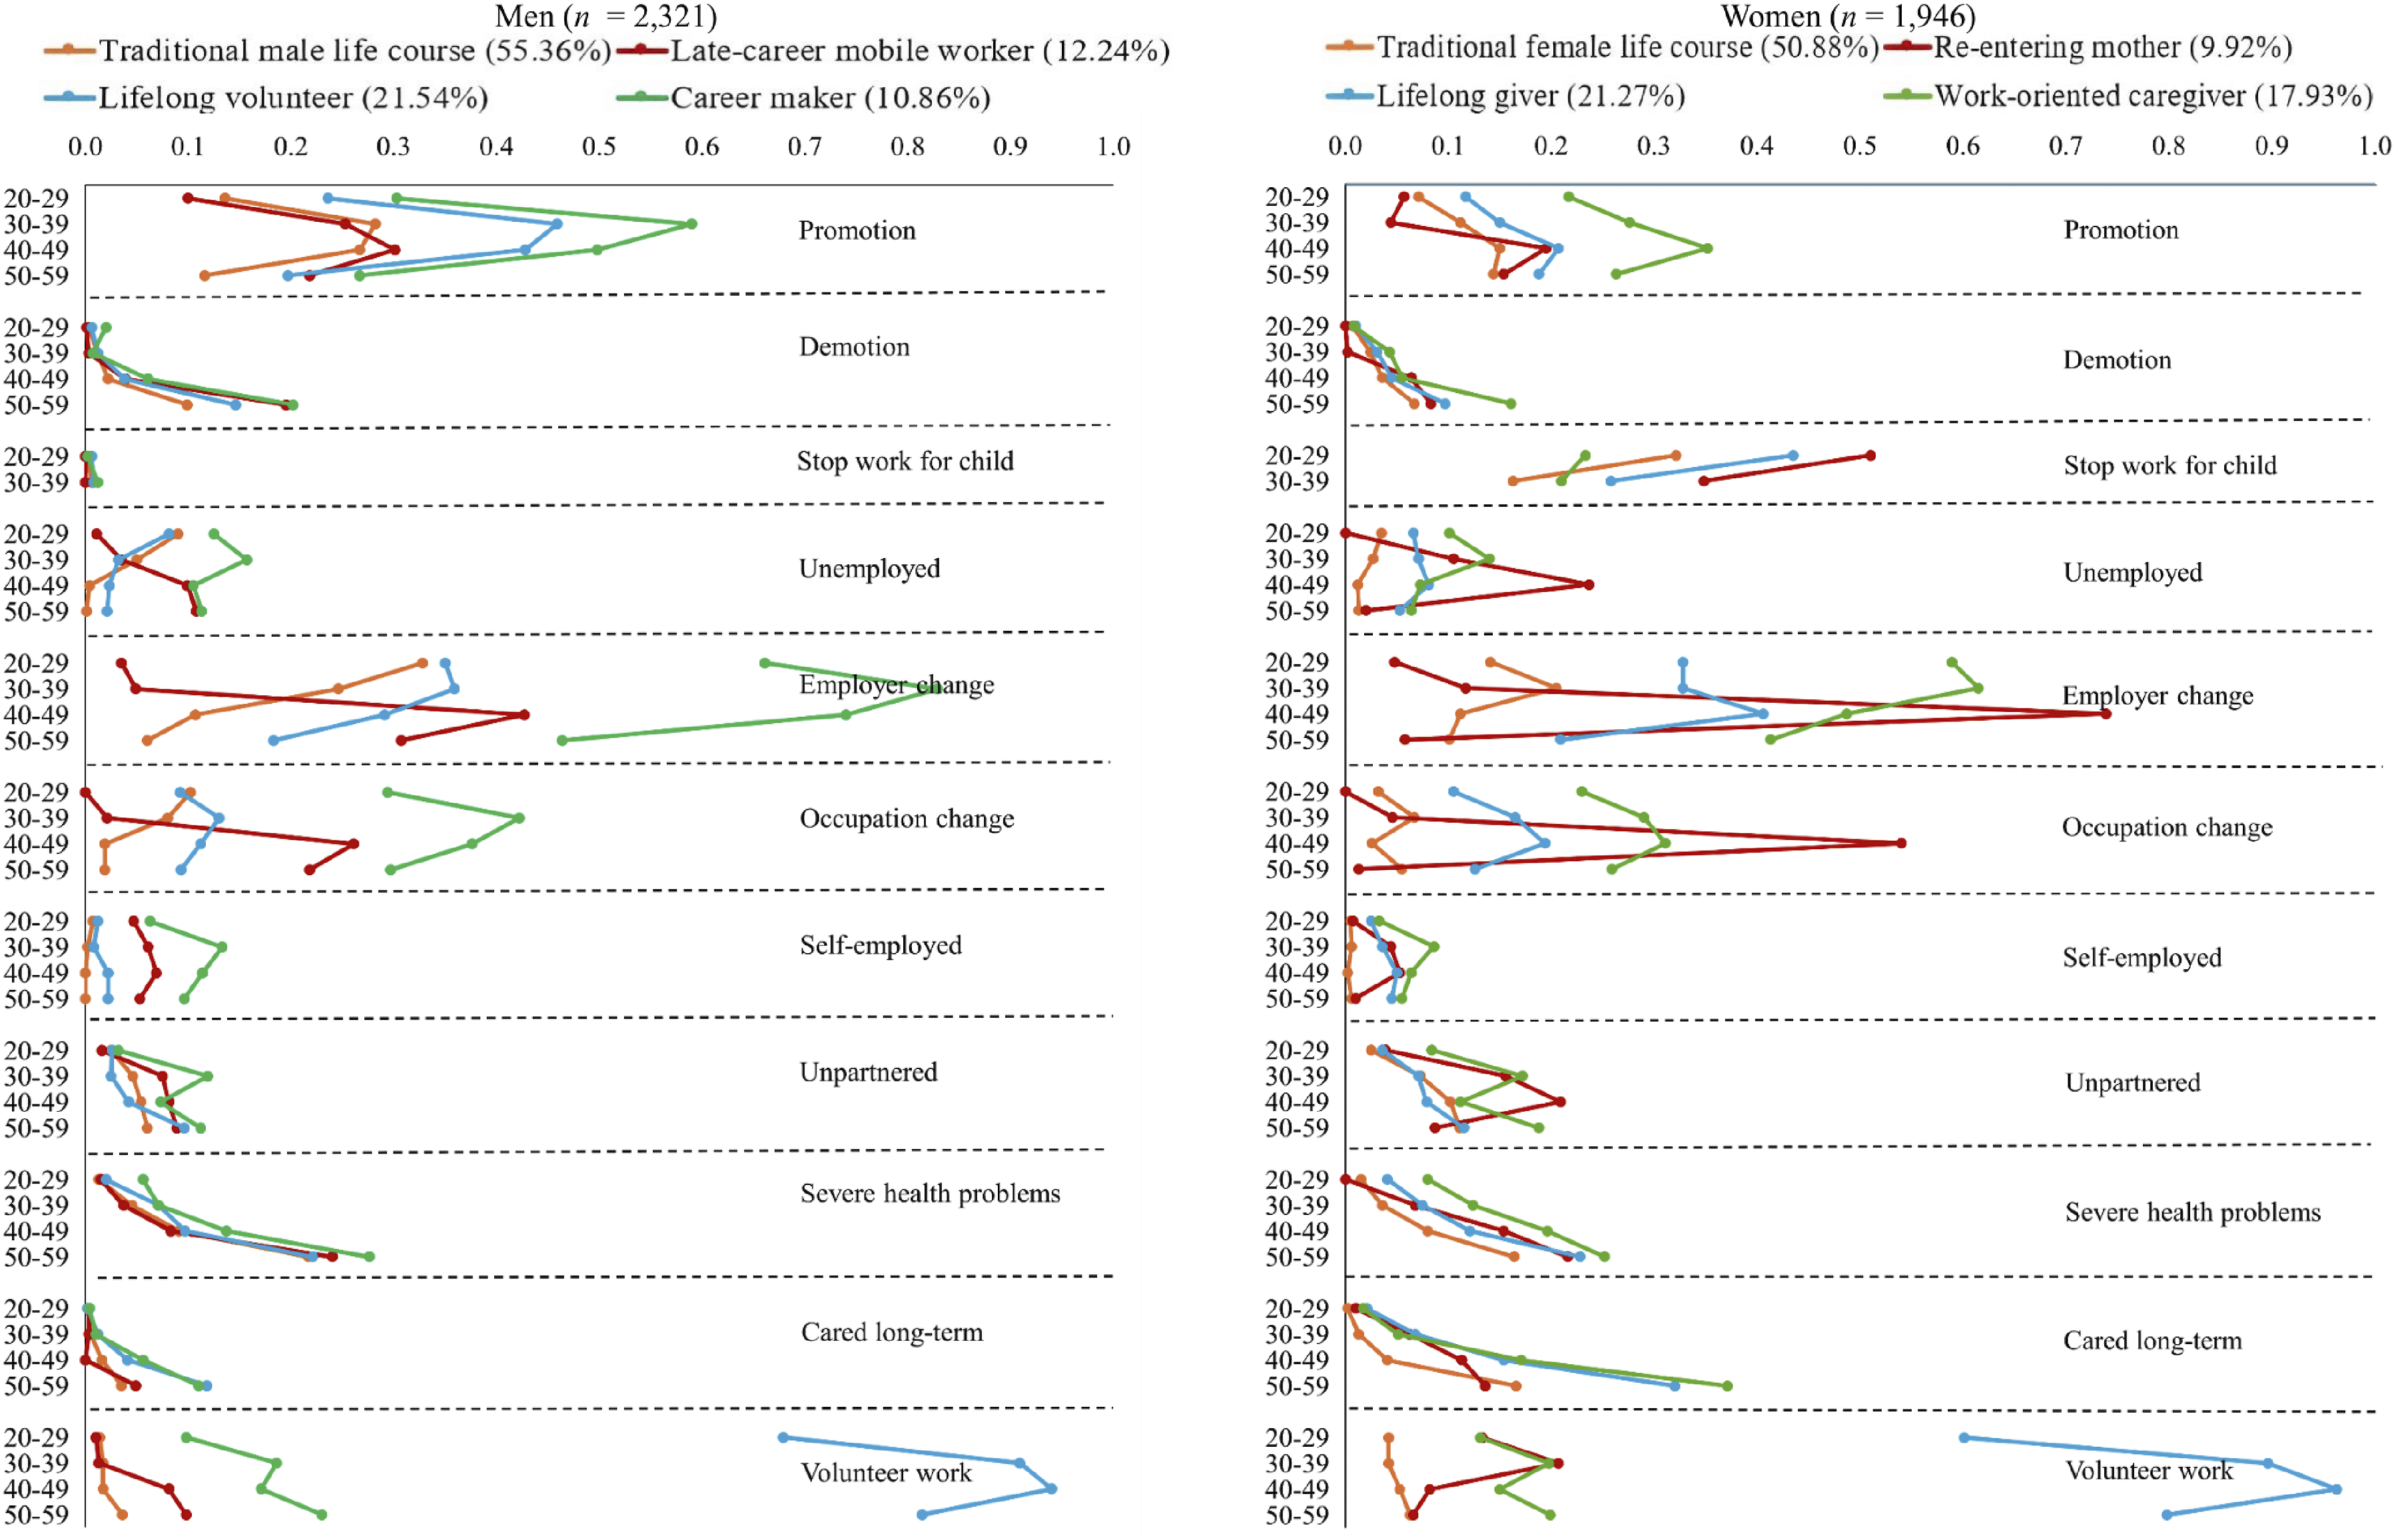
Probabilities of Pre-retirement Life Course Events From Age 20 to 59 Across Four Classes
Male Classes
As can be seen in the left panel of Figure 1, there is considerable homogeneity among the four classes of men (see also Table A2). Stopping work for children, providing long-term care, becoming unpartnered, and being self-employed occur infrequently across all classes. Demotion and severe health problems are more common, but follow similar trends in all classes, increasing with age. Whereas unemployment remains limited in all classes, its trend differs between classes, rising with age in some classes and declining in others. Promotion, employer change, occupation change, and volunteer work vary more distinctly between classes, making them the main distinguishing factors.
The first and largest class of men (55.4%) is most distinguished by some mobility early in life, but increasing stability later on, especially in the work domain. Men in this class move between employers until their 30s and get promoted until 40s. Occupation changes and unemployment decrease from age 30 onwards. Other domains remain stable over the life course, with lasting partnerships, limited health and care demands, and no volunteering. This represents a Traditional Male Life Course for this cohort.
The next class of men (12.2%) shows an opposite pattern in the work domain, distinguished by late-life mobility. At ages 40-49, men in this class receive promotions and change employers and occupations. This is why we call them Late-career Mobile Worker. In other domains, they have similar trajectories to men with a traditional male life course. However, different from all other male classes, late-career mobile workers have consistently rising unemployment, albeit at low levels.
For about one-fifth of men (21.5%), the work, family, health, and care histories follow the traditional male life course pattern, but the volunteering history is the most distinguishing aspect. These men start volunteering between ages 20-29 with a probability of 0.68. From age 30 to 50, almost all men in this class become volunteers, as probabilities reach 0.90. The probability goes down to 0.81 at ages 50-59, which is still a considerable amount. Accordingly, we refer to these men as Lifelong Volunteer.
The last and smallest class of men features those with the most dynamic and upward careers (10.9%). Hence, we name them Career Maker. These career makers have the highest probabilities of promotions and employer and occupation changes across all ages. Nonetheless, this career success entails some challenges. Relative to men in other classes, men in this class confront more unemployment and self-employment while tackling more marital breakdown and health deterioration, while the probabilities of these events remain at similarly low rates.
Female Classes
The right panel of Figure 1 portrays the four classes of women, with many shared characteristics (see also Table A3). There is little occurrence of demotion and self-employment across the classes. Being unpartnered and severe health problems occur more, yet at low levels and without clear differentiation between classes. While generally low, promotion, unemployment, and long-term care distinguish some classes through higher occurrence. The strongest class distinctions arise from quitting work for children, employer and occupation changes, and volunteering – events with the highest probabilities.
What sets the largest class of women (50.9%) apart from other female classes is that it includes those with the least mobility and most stability across all life domains. Although becoming unpartnered, experiencing health problems, and providing long-term care rise with age, women in this class have the lowest likelihood of these events. The most active part of their life course is quitting work for children between ages 20-29. This reflects the normative career move for women of this cohort when entering child-rearing years. Therefore, we call this class Traditional Female Life Course.
Quitting work for children is the most likely event for the smallest class of women (9.9%). In their 20s and 30s, these women exit the labor market to take care of children. They re-enter later, hence dubbed Re-entering Mother, but come across many changes at the re-entrance. Between ages 40-49, they change employers and occupations, which are, alongside quitting work for children, the defining features of these women, with probabilities reaching 0.74. At the same period, they also become unemployed and unpartnered slightly more than women in other classes. Possibly because of the intensity of these changes in work and family domains, their volunteering drops sharply after age 40.
Another class of women (21.3%) stands out for volunteering throughout the life course, with a probability of 0.96 between ages 40-49, implying that virtually all women in this class give to society at some point. However, their giving is not limited to society. They also give to families through childcare and informal care, leading us to label them as Lifelong Giver. Relative to women with a traditional life course, lifelong givers have more promotions, job changes, and breaks in their careers, while having similar patterns in family and health domains to women with a traditional life course.
The last class of women (17.9%) is the most work-oriented female class. Women in this class have the most promotions, the fewest career breaks because of children, and the highest self-employment, though these events tend to be less frequent among all female classes. After re-entering mothers, these women also have the highest likelihood of career changes, with decreasing unemployment over time. This implies that these women are likely successful in the labor market. Nevertheless, they are involved extensively in long-term caregiving. Thus, we call them Work-Oriented Caregiver.
Predicting Retirement Adjustment
To assess the predictive value of the life courses, we regressed them on the retirement adjustment variables, using OLS linear regression analyses. Before that, an examination of the proportion of respondents selecting specific response options (1 = Very much, 5 = Not at all) on retirement adjustment variables showed that, since retirement, the majority of our sample missed work-related aspects little or not at all. Social contacts were the most frequently missed aspect, with 47% of men and 51% of women reporting that they missed social contacts fairly, much, or very much. Role fulfillment was missed by 37% of men and 42% of women, while income was missed less, with 29% of men and 28% of women indicating that they missed income to some extent. Societal prestige was missed the least, by 16% of men and 19% of women. This suggests that our sample adjusted well to retirement, as is also evident in the mean scores of retirement adjustment variables given in Table 1.
Figure 2 provides further insights into the mean scores, revealing that the range and pattern of retirement adjustment are similar across the four classes of both men and women. While our primary interest lies in within-gender comparisons by classes, it is noteworthy that men and women followed dissimilar life course trajectories yet displayed broadly similar levels of retirement adjustment. This aligns with prior reviews showing no consistent gender differences in retirement adjustment (Van Solinge, 2013) and with the dynamic resource perspective on retirement adjustment (Wang et al., 2011), which does not explicitly emphasize gender as a differentiating factor. Mean Values of Retirement Adjustment Variables Across Four Classes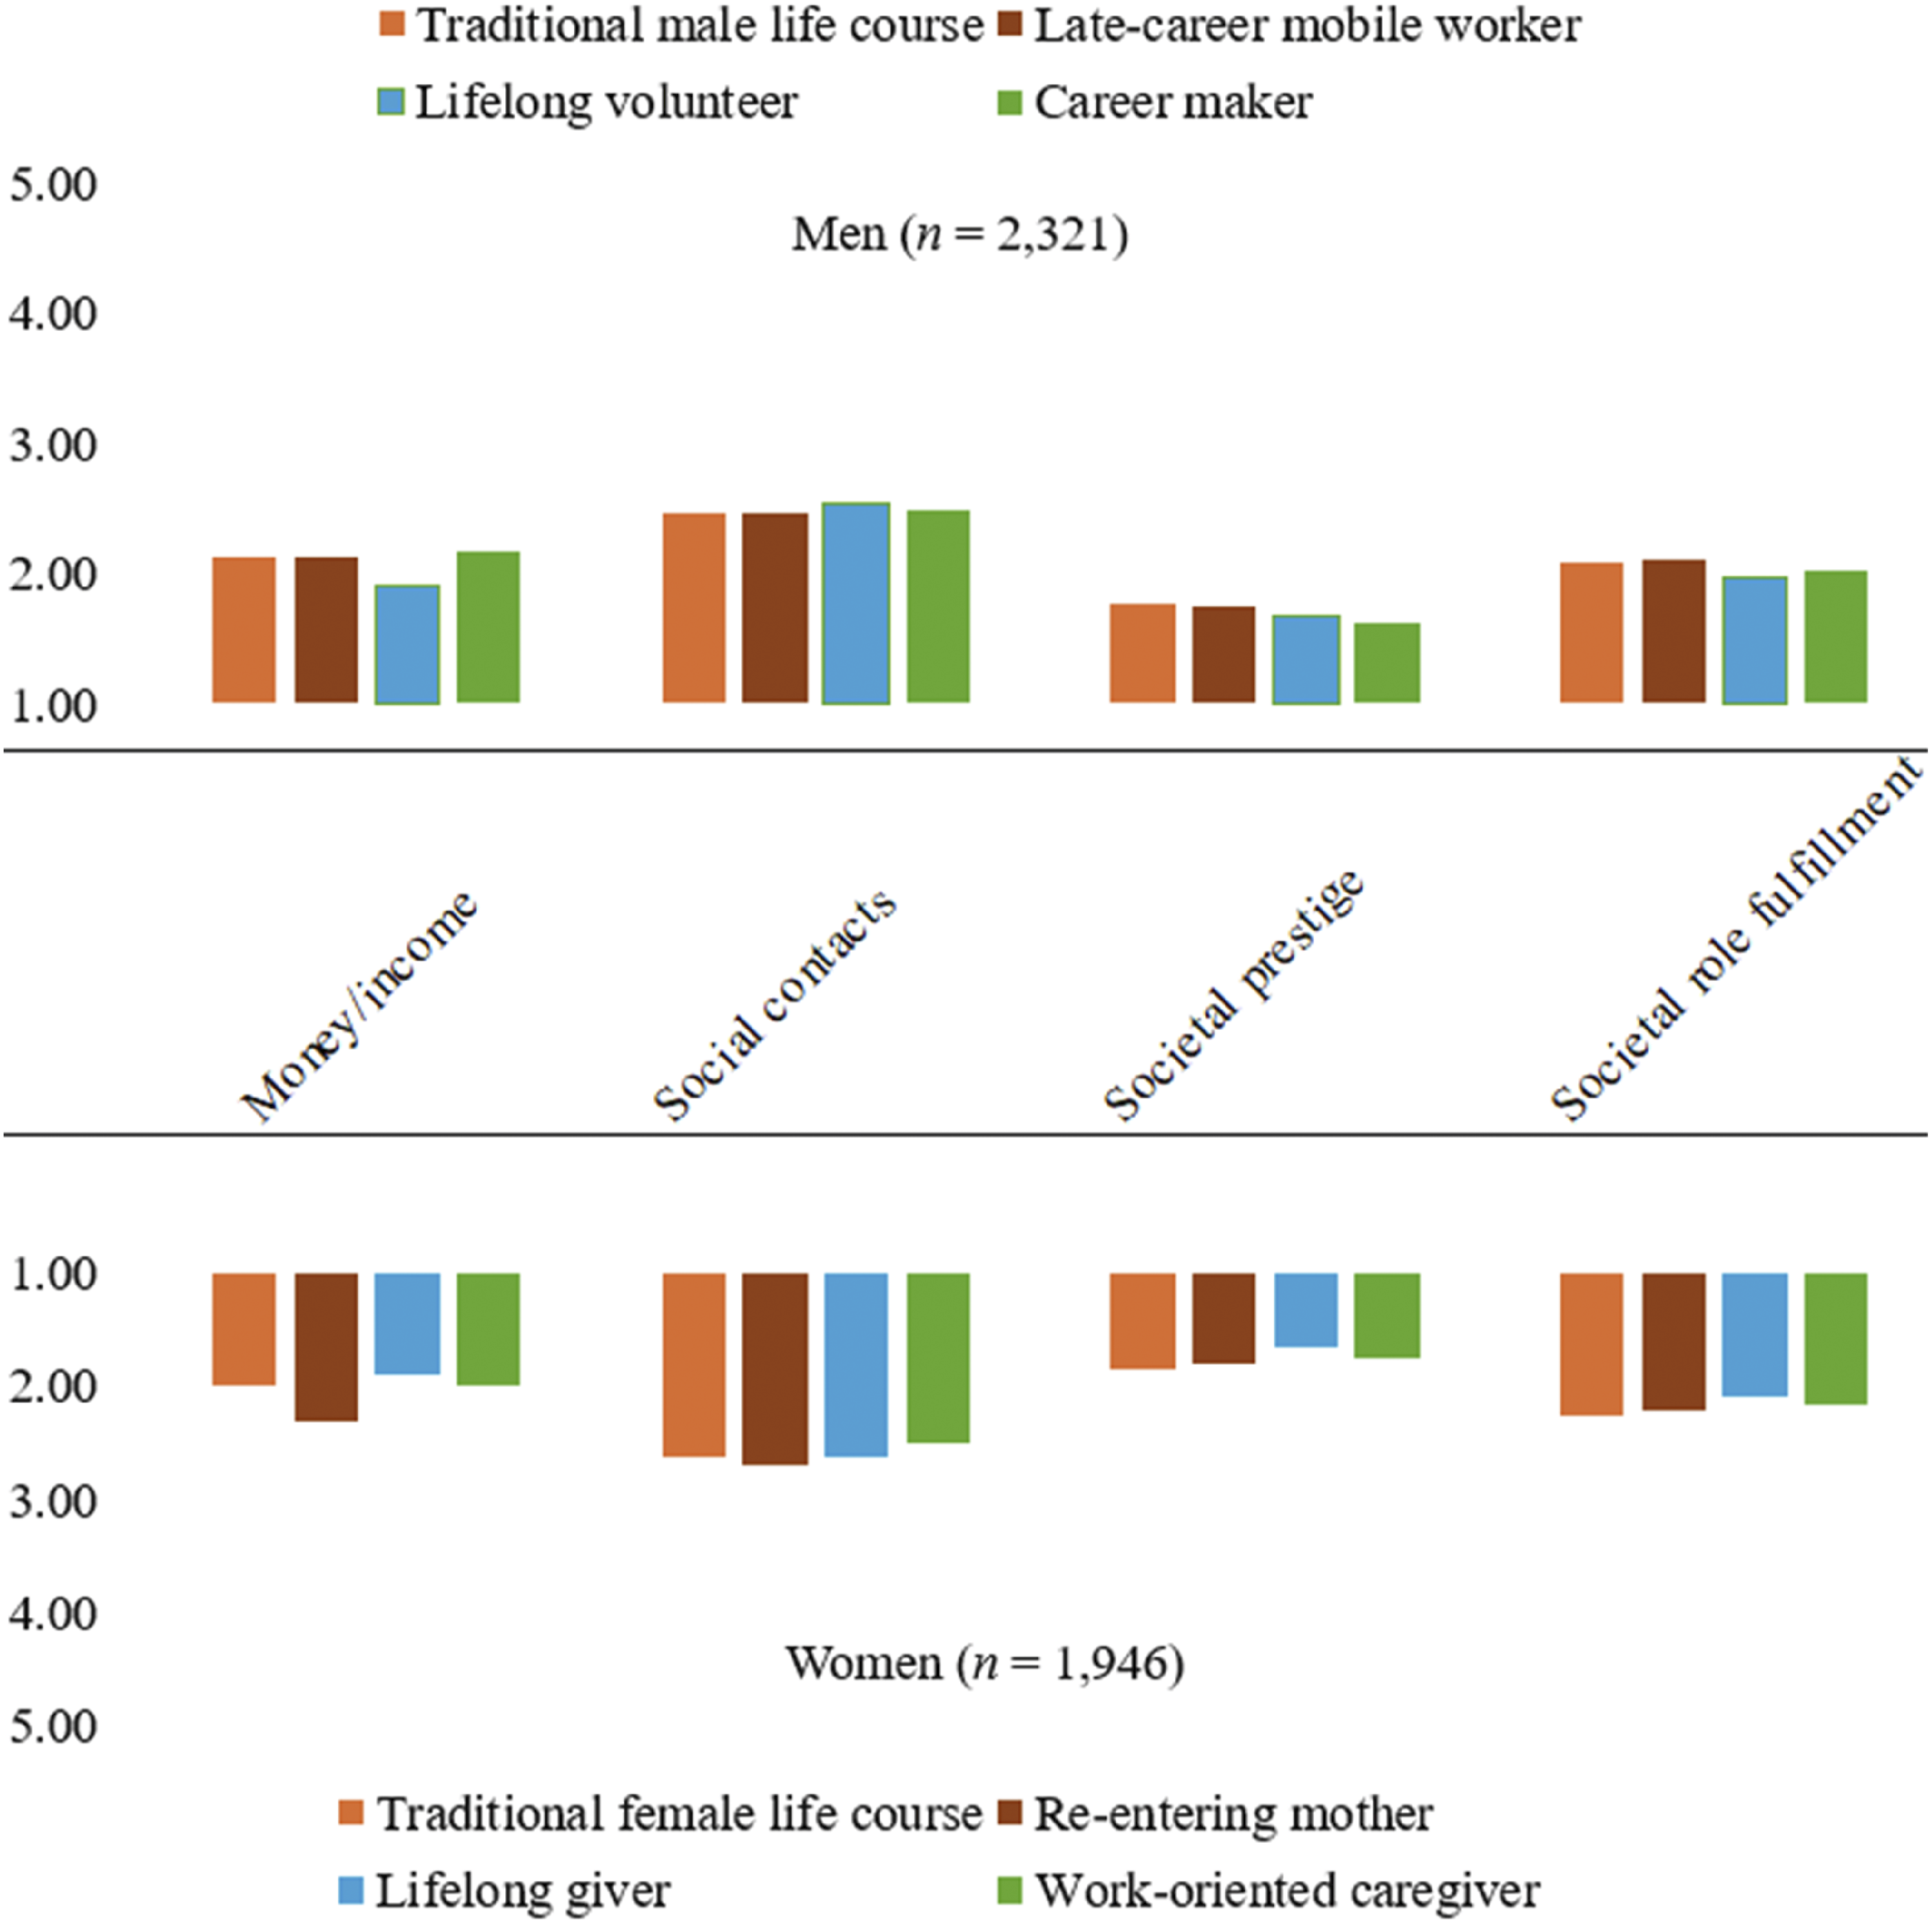
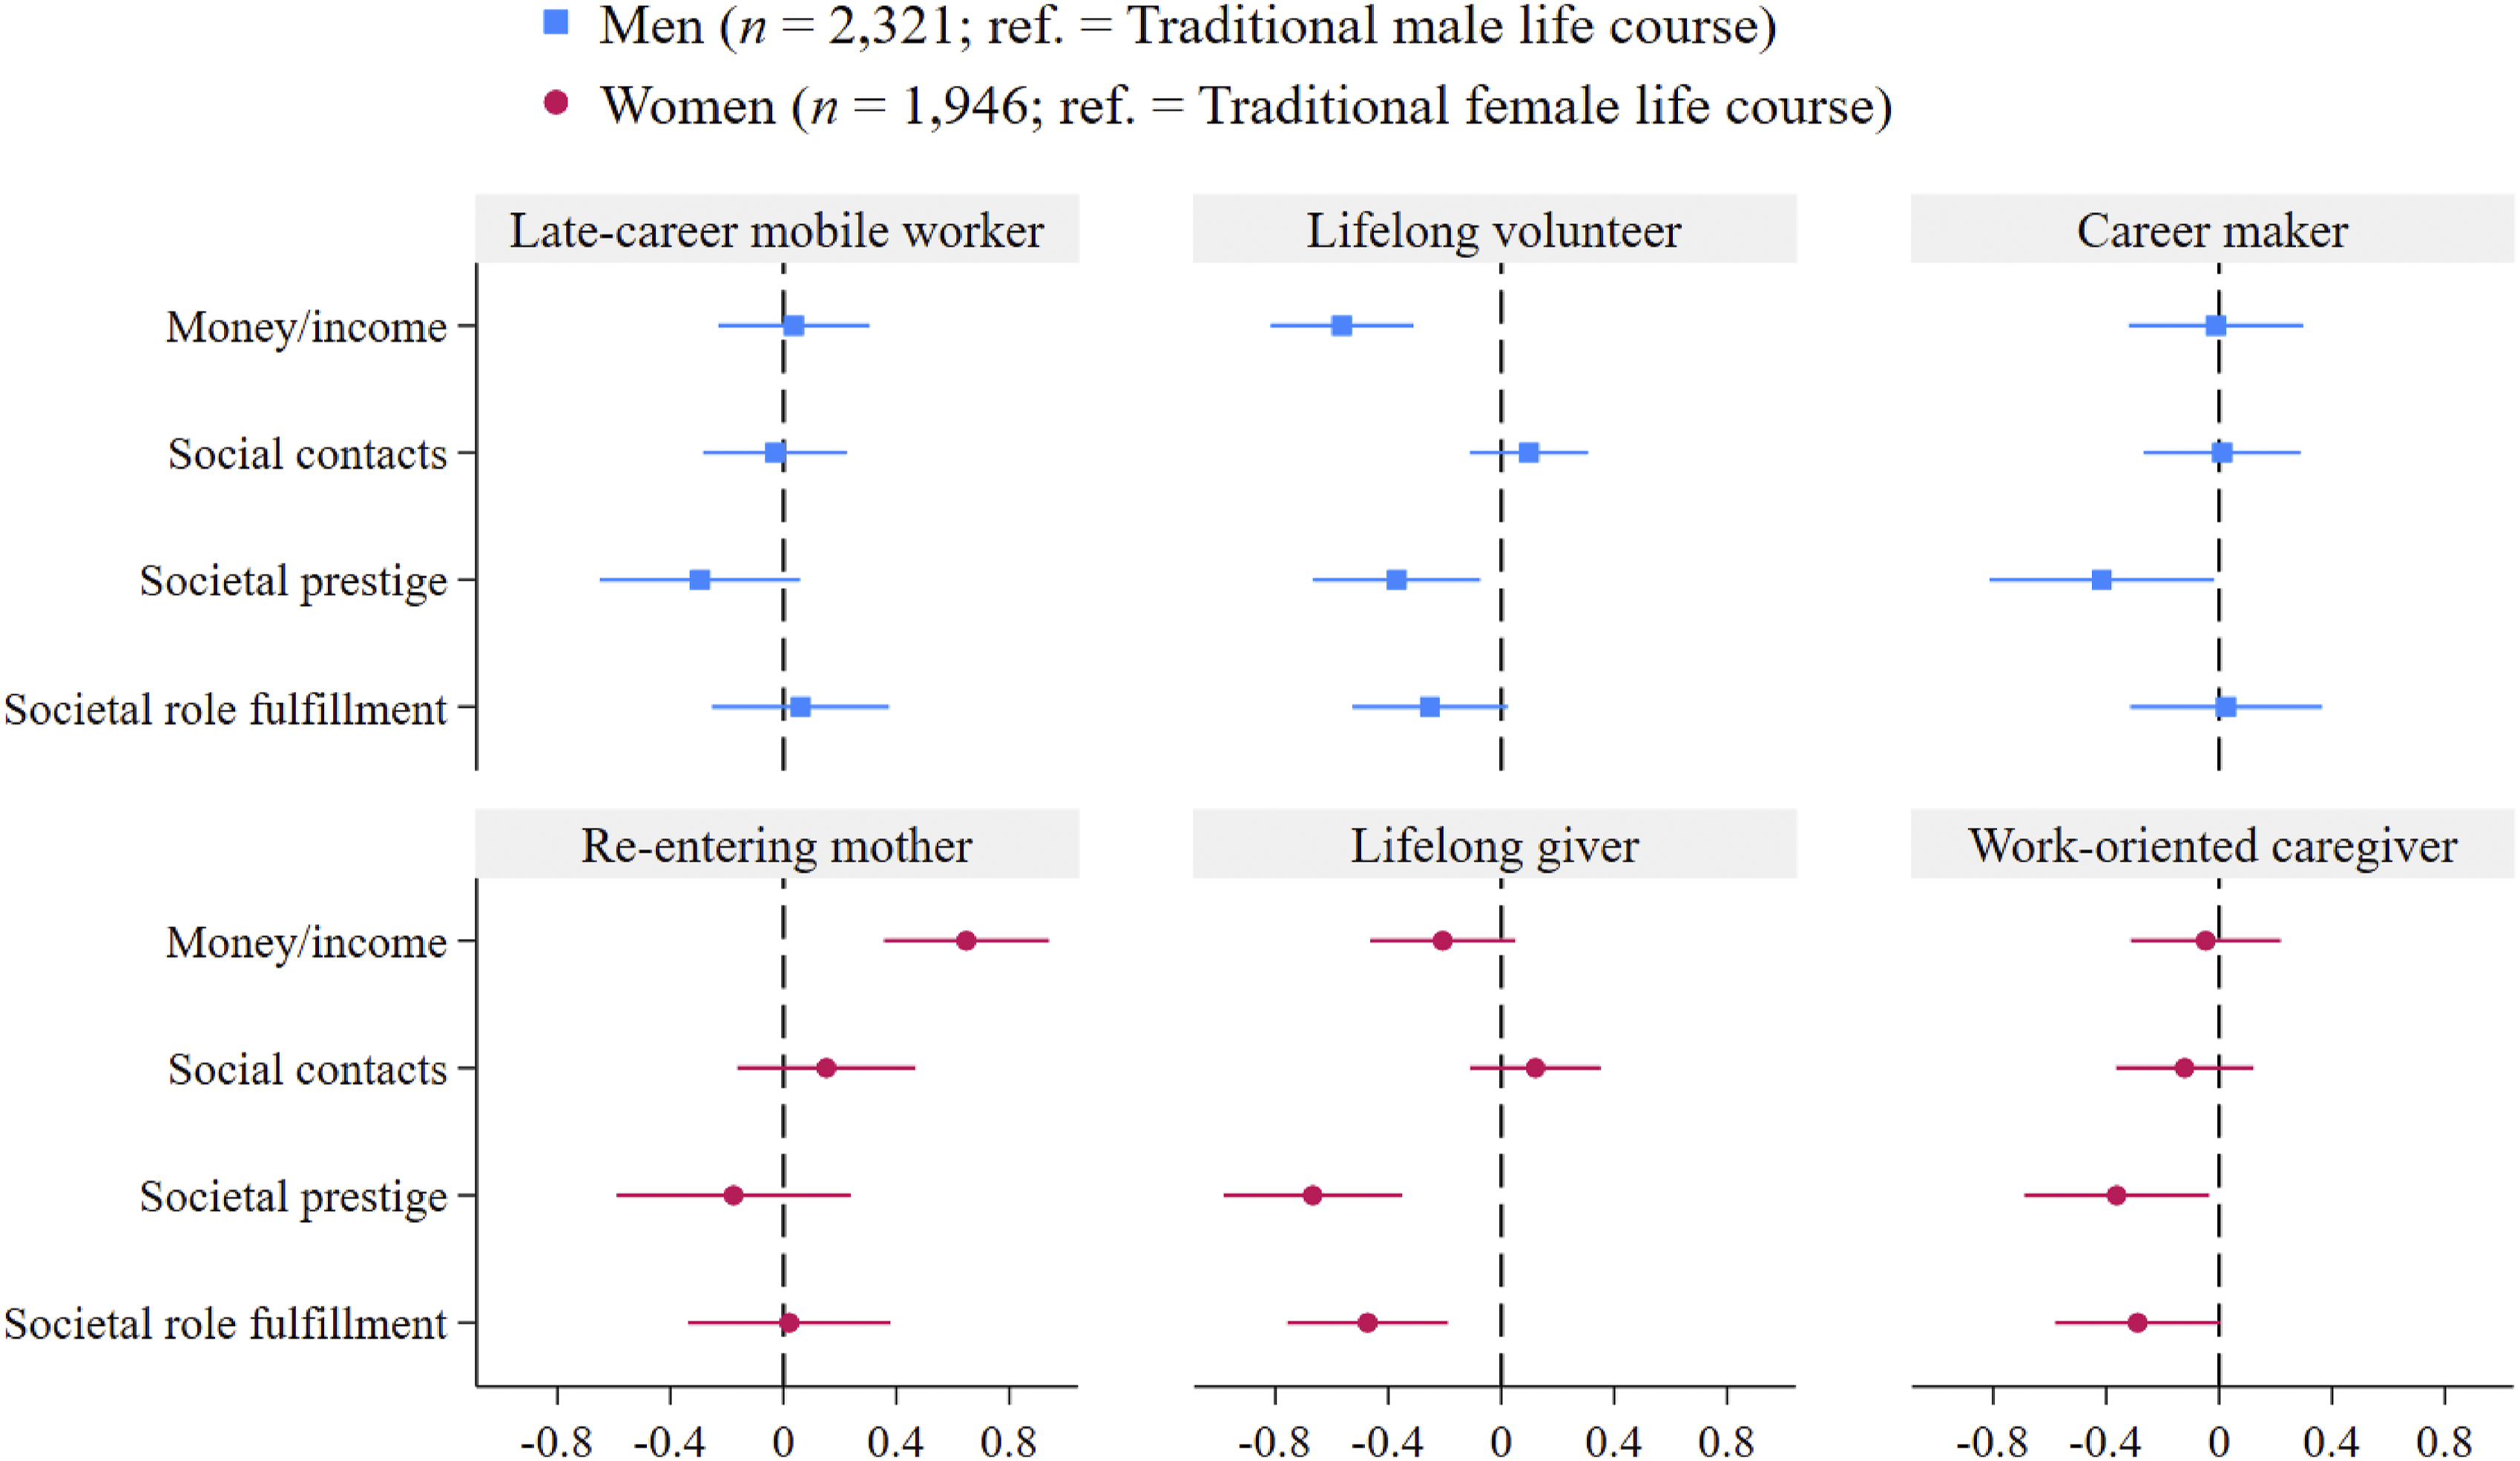
Moving beyond descriptive statistics, Figure 3 presents the regression coefficients from OLS linear regression analyses. Among men, Late-career Mobile Workers did not differ from those with a Traditional Male Life Course in any aspect of retirement adjustment. However, Lifelong Volunteers missed income, prestige, and role fulfillment less than men with a Traditional Male Life Course. This implies that Lifelong Volunteers adjust better to retirement, both financially, socially, and psychologically. Career Makers also adjust better to retirement than men with a Traditional Male Life Course, albeit only socially, missing the prestige of work less. To contrast all groups of men, we changed the reference category, which further established the advantage of Lifelong Volunteers. Lifelong Volunteers showed better financial adjustment to retirement than Career Makers and better financial and psychological adjustment than Late-career Mobile Workers (see Table A4). Regression Coefficients of Retirement Adjustment Variables With 95% Confidence Intervals, OLS Linear Regression Analyses With Robust Standard Errors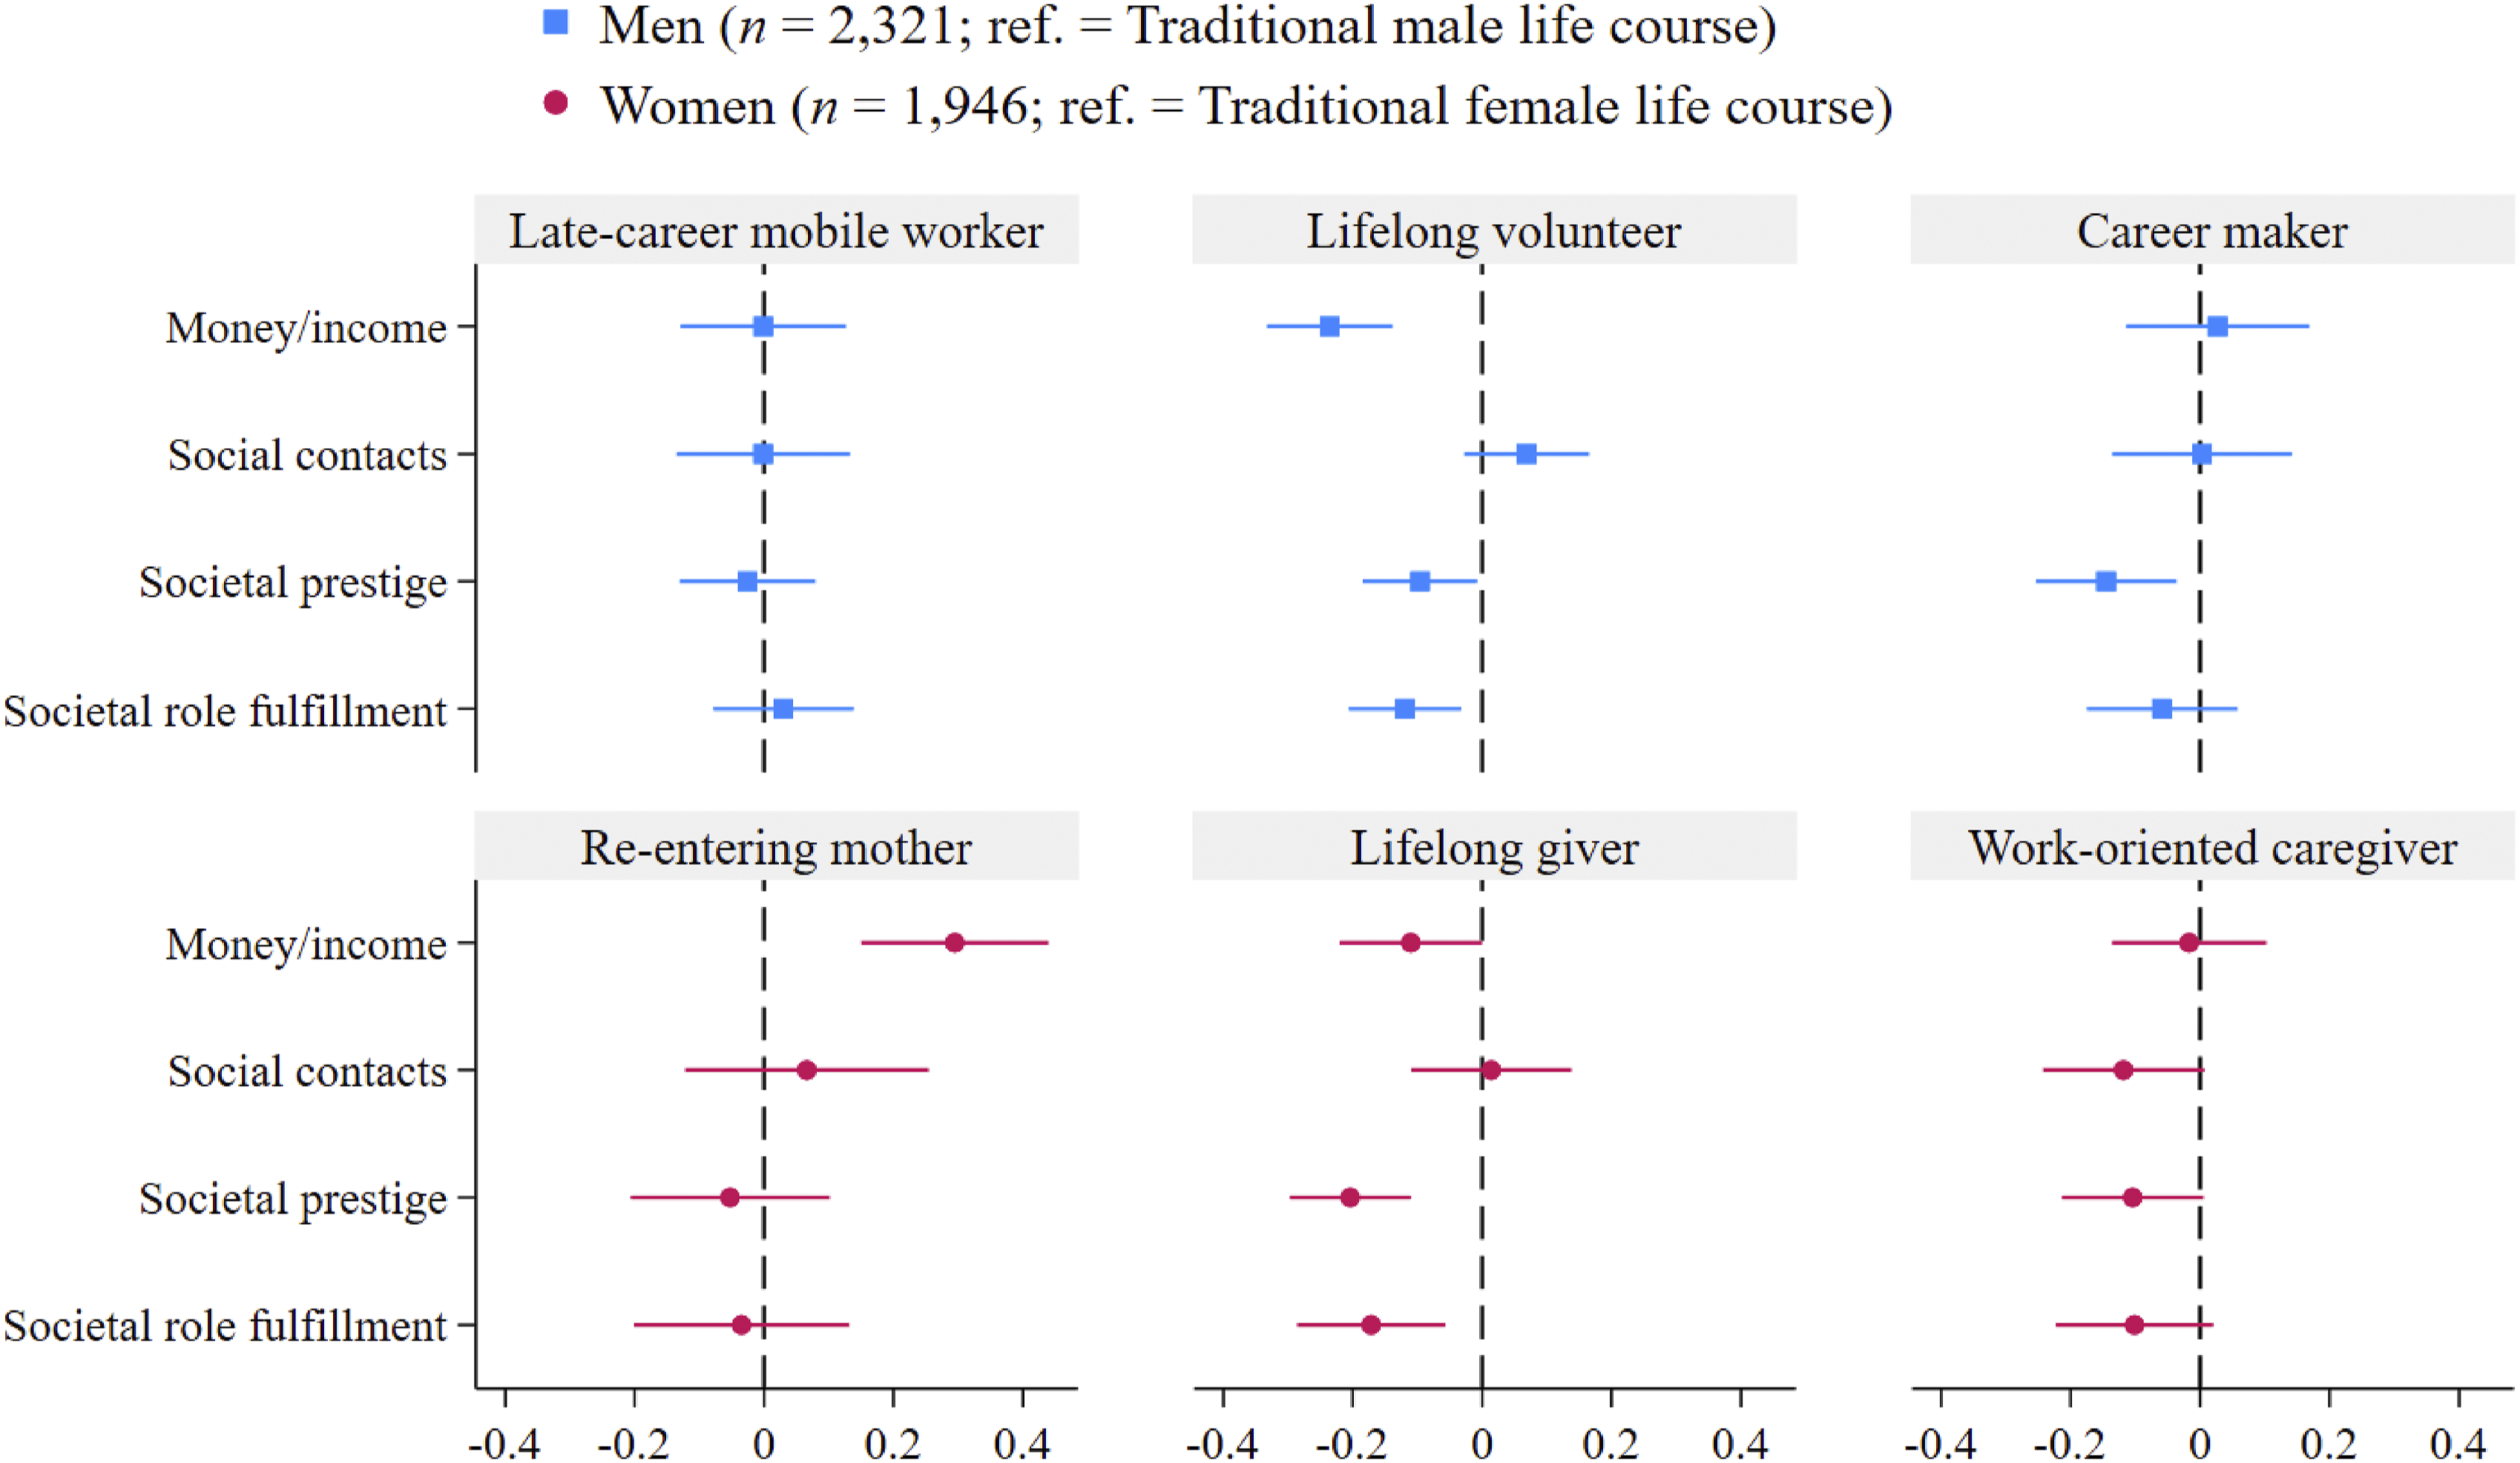
Among women, Re-entering Mothers missed the income from work more than those with a Traditional Female Life Course. That is, Re-entering Mothers adjust worse to retirement financially. Contrasting Re-entering Mothers with other groups of women affirmed the financial disadvantage of Re-entering Mothers. Both Lifelong Givers and Work-Oriented Caregivers missed the work’s income less than Re-entering Mothers (see Table A4). Lifelong Givers were financially the most well-off, missing income less than both Re-entering Mothers and women with a Traditional Female Life Course. Lifelong Givers also adjusted better to retirement socially and psychologically than women with a Traditional Female Life Course, missing the prestige and role fulfillment aspects of work less. As for Work-Oriented Caregivers, they did not differ from women with a Traditional Female Life Course in any aspect of retirement adjustment.
Discussion
Previous studies left it unclear how life courses spanning multiple life stages and domains influence retirement adjustment. We addressed this gap by using more detailed indicators at the work-family interface while including health, care, and volunteering experiences. The inclusion of health, care, and volunteering is valuable because these domains capture forms of social engagement and interdependence that are not reducible to work or family. For instance, health shapes the capacity to participate in paid work, caregiving, or volunteering, while caregiving represents obligations that may compete with or complement work. Volunteering, in turn, reflects a domain of agency and prosocial behavior that extends beyond family or work, adding explanatory power when examining cumulative resources across the life course. This holistic examination allowed us to present a panoramic view of life courses among Dutch older adults, providing new opportunities for a better understanding of retirement adjustment. To capture gender differences, we first constructed men’s and women’s life course trajectories and then examined these trajectories’ relationship with retirement adjustment. In doing so, we employed a multidimensional and extended measurement of retirement adjustment, focusing on how much retirees miss different aspects of work. As such, we provided one of the most comprehensive studies of retirement adjustment from a life course perspective.
We identified four distinct life course trajectories among both genders. Most men and women follow stable trajectories, with minimal mobility and adversity. Identifying these trajectories adds nuance to existing knowledge. Prior research showed that the typical trajectory for both genders includes full-time employment, marriage, and children (Firat et al., 2023). With variables on career mobility and family-related work interruptions, we saw that men forge more stable lives, whereas women gradually encounter more mobility over time. Representing the traditional male life course of the cohorts under study, men change employers and occupations less with age, with decreasing promotions in midlife. Women, however, switch employers until midlife, experience varying occupation changes, and receive promotions later, recovering from career breaks for children. This pattern illustrates the traditional female life course of women who are now older and retired.
Although men and women differ in work stability and mobility, their civic participation is similar. One in five men and women develop trajectories that involve consistent volunteering and increasing caregiving over time. This finding advances research in three ways. First, earlier studies did not explore the development of caregiving and volunteering alongside work, family, and health. We filled this gap, showing that these activities, especially volunteering, are integral to life courses, with favorable work, family, and health conditions. Supporting continuity theory, our results suggest that there is continuity in volunteering (Atchley, 1989). It is often assumed that people start volunteering in retirement, and research shows that volunteering increases post-retirement (Hämäläinen et al., 2024). Yet, we see that volunteering is a way of life for many people, as they volunteer throughout their lives.
Second, our study reiterates that caregiving is more dominant in women’s lives, but challenges the idea that volunteering is a female domain. We found that volunteering is also central to men’s lives, which exhibit the same pattern of volunteering as women, with both genders represented equally in trajectories marked by volunteering. This can be specific to the Dutch context, as studies showing that women volunteer more are usually from the United States (Wilson, 2000). In the Netherlands, the participation of both men and women in volunteering is among the highest in Europe, surpassed only by Sweden and Norway (Wiepking et al., 2023). This means that, regardless of gender, volunteering is a salient part of life in the Netherlands, which is supported by strong civic infrastructures and institutional encouragement. To better understand how volunteering unfolds alongside work, family, health, and caregiving among men and women, future research may conduct cross-national studies.
Third, we offer new insights into volunteering’s role in retirement adjustment. It is known that volunteering helps retirement adjustment, but we studied it as part of entire trajectories across other domains. Whereas volunteering occurs with caregiving among women, and upward careers are more prevalent among men, men and women with civic participation adjust similarly to the loss of work roles. Men and women with civic participation miss the income, prestige, and role fulfillment aspects of work less than their counterparts with traditional trajectories. They also adjust better than those with late-career mobility, labor market return, or work orientation, being the most advantaged groups. This supports role substitution and resource accumulation theories, implying that career success, stable family, and good health foster resources, while caregiving and volunteering offset losing work roles (Mutchler et al., 2003; Wang et al., 2011). As such, our findings extend the theoretical implications of retirement adjustment beyond work- and family-centered explanations to civic participation.
Women who had the highest probability of quitting work for children in earlier life also had the highest probability of being mobile in the labor market in later life. These mothers seemed to have struggles when they re-entered employment. Reflecting the potential scarring effect of career breaks for childcare, they became unemployed between ages 40-49. At the same time, they changed employers and occupations frequently, which apparently coincided with divorce. Although we cannot determine the precise timing of divorce relative to job changes, these patterns suggest possible overlap between work and family instability. Likely as a result of these disruptions in work and family, these mothers experience financial hardship in retirement, probably due to having lower pensions and household incomes. This makes them the most disadvantaged group in financial terms, as they miss the work’s income the most after retirement. While we cannot claim that a process of cumulative disadvantage is at play, this finding is consistent with the notion of cumulative disadvantage, whereby career interruptions during childrearing contribute to lower economic resources later in life (Dannefer, 2003).
Our study is not without limitations. First, while retrospective data allowed us to examine past lives, it is subject to recall bias, and because it is self-reported, it is also prone to social desirability bias. For a more accurate assessment, future research could benefit from prospective or administrative life course data. However, it takes a long time to gather such data, posing significant challenges to feasibility. Second, our life course measure covered multiple life domains but recorded whether an event occurred within a decade, not capturing differences in life course dynamics throughout the decades, such as the intensity of labor force attachment (e.g., working hours) across the ages. Although this broad timeframe may have helped recall accuracy by reducing cognitive load, it precludes the inferences we can make about life courses, working lives in particular. A yearly measure with greater detail would offer finer insights into the timing, duration, and order of events, and the composition of life courses. Third, our sample comprised people working at older ages. This restriction likely excludes many women, lower-SES individuals, and other disadvantaged groups, thereby limiting the generalizability of our findings to the broader Dutch population. It also likely explains the absence of subgroups with purely disadvantageous trajectories. While our sample has disadvantageous transitions or periods, involving unemployment and disability, there is no trajectory defined exclusively by these adversities. People struggling with long-term unemployment and disability probably dropped out earlier, and the Netherlands is a country that provides generous benefits to minimize such adversities. Moreover, we used LCA, which is an exploratory, data-driven method; thus, the subgroups it identifies may not directly “exist” in the world but rather represent useful approximations of underlying patterns.
Despite these limitations, our study advances the understanding of how men’s and women’s life courses evolve before retirement and how they shape the experience of missing various aspects of work after retirement. Our findings highlight the importance of recognizing the complex interplay of work, family, health, caregiving, and volunteering trajectories over time, as these trajectories determine how people adapt to retirement. Therefore, we invite researchers to further explore these dynamics to support retirees’ well-being in the context of aging populations and pension reforms.
Footnotes
Funding
The authors disclosed receipt of the following financial support for the research, authorship, and/or publication of this article: This work was supported by the Instituut Gak [project Understanding old-age inequality]; the Netherlands Organization for Scientific Research [grant number 453-14-001]; and the Network for Studies on Pensions, Aging and Retirement.
Declaration of conflicting interests
The authors declared no potential conflicts of interest with respect to the research, authorship, and/or publication of this article.
Data Availability Statement
The datasets generated during and/or analyzed during the current study are available from the corresponding author on reasonable request.
Author Biographies
Appendix
Regression Coefficients of Retirement Adjustment Variables With Control Variables, OLS Linear Regression Analyses With Robust Standard Errors *p < 0.05, **p < 0.01, ***p < 0.001. Standard errors are robust standard errors clustered by the organization where respondents worked at the baseline.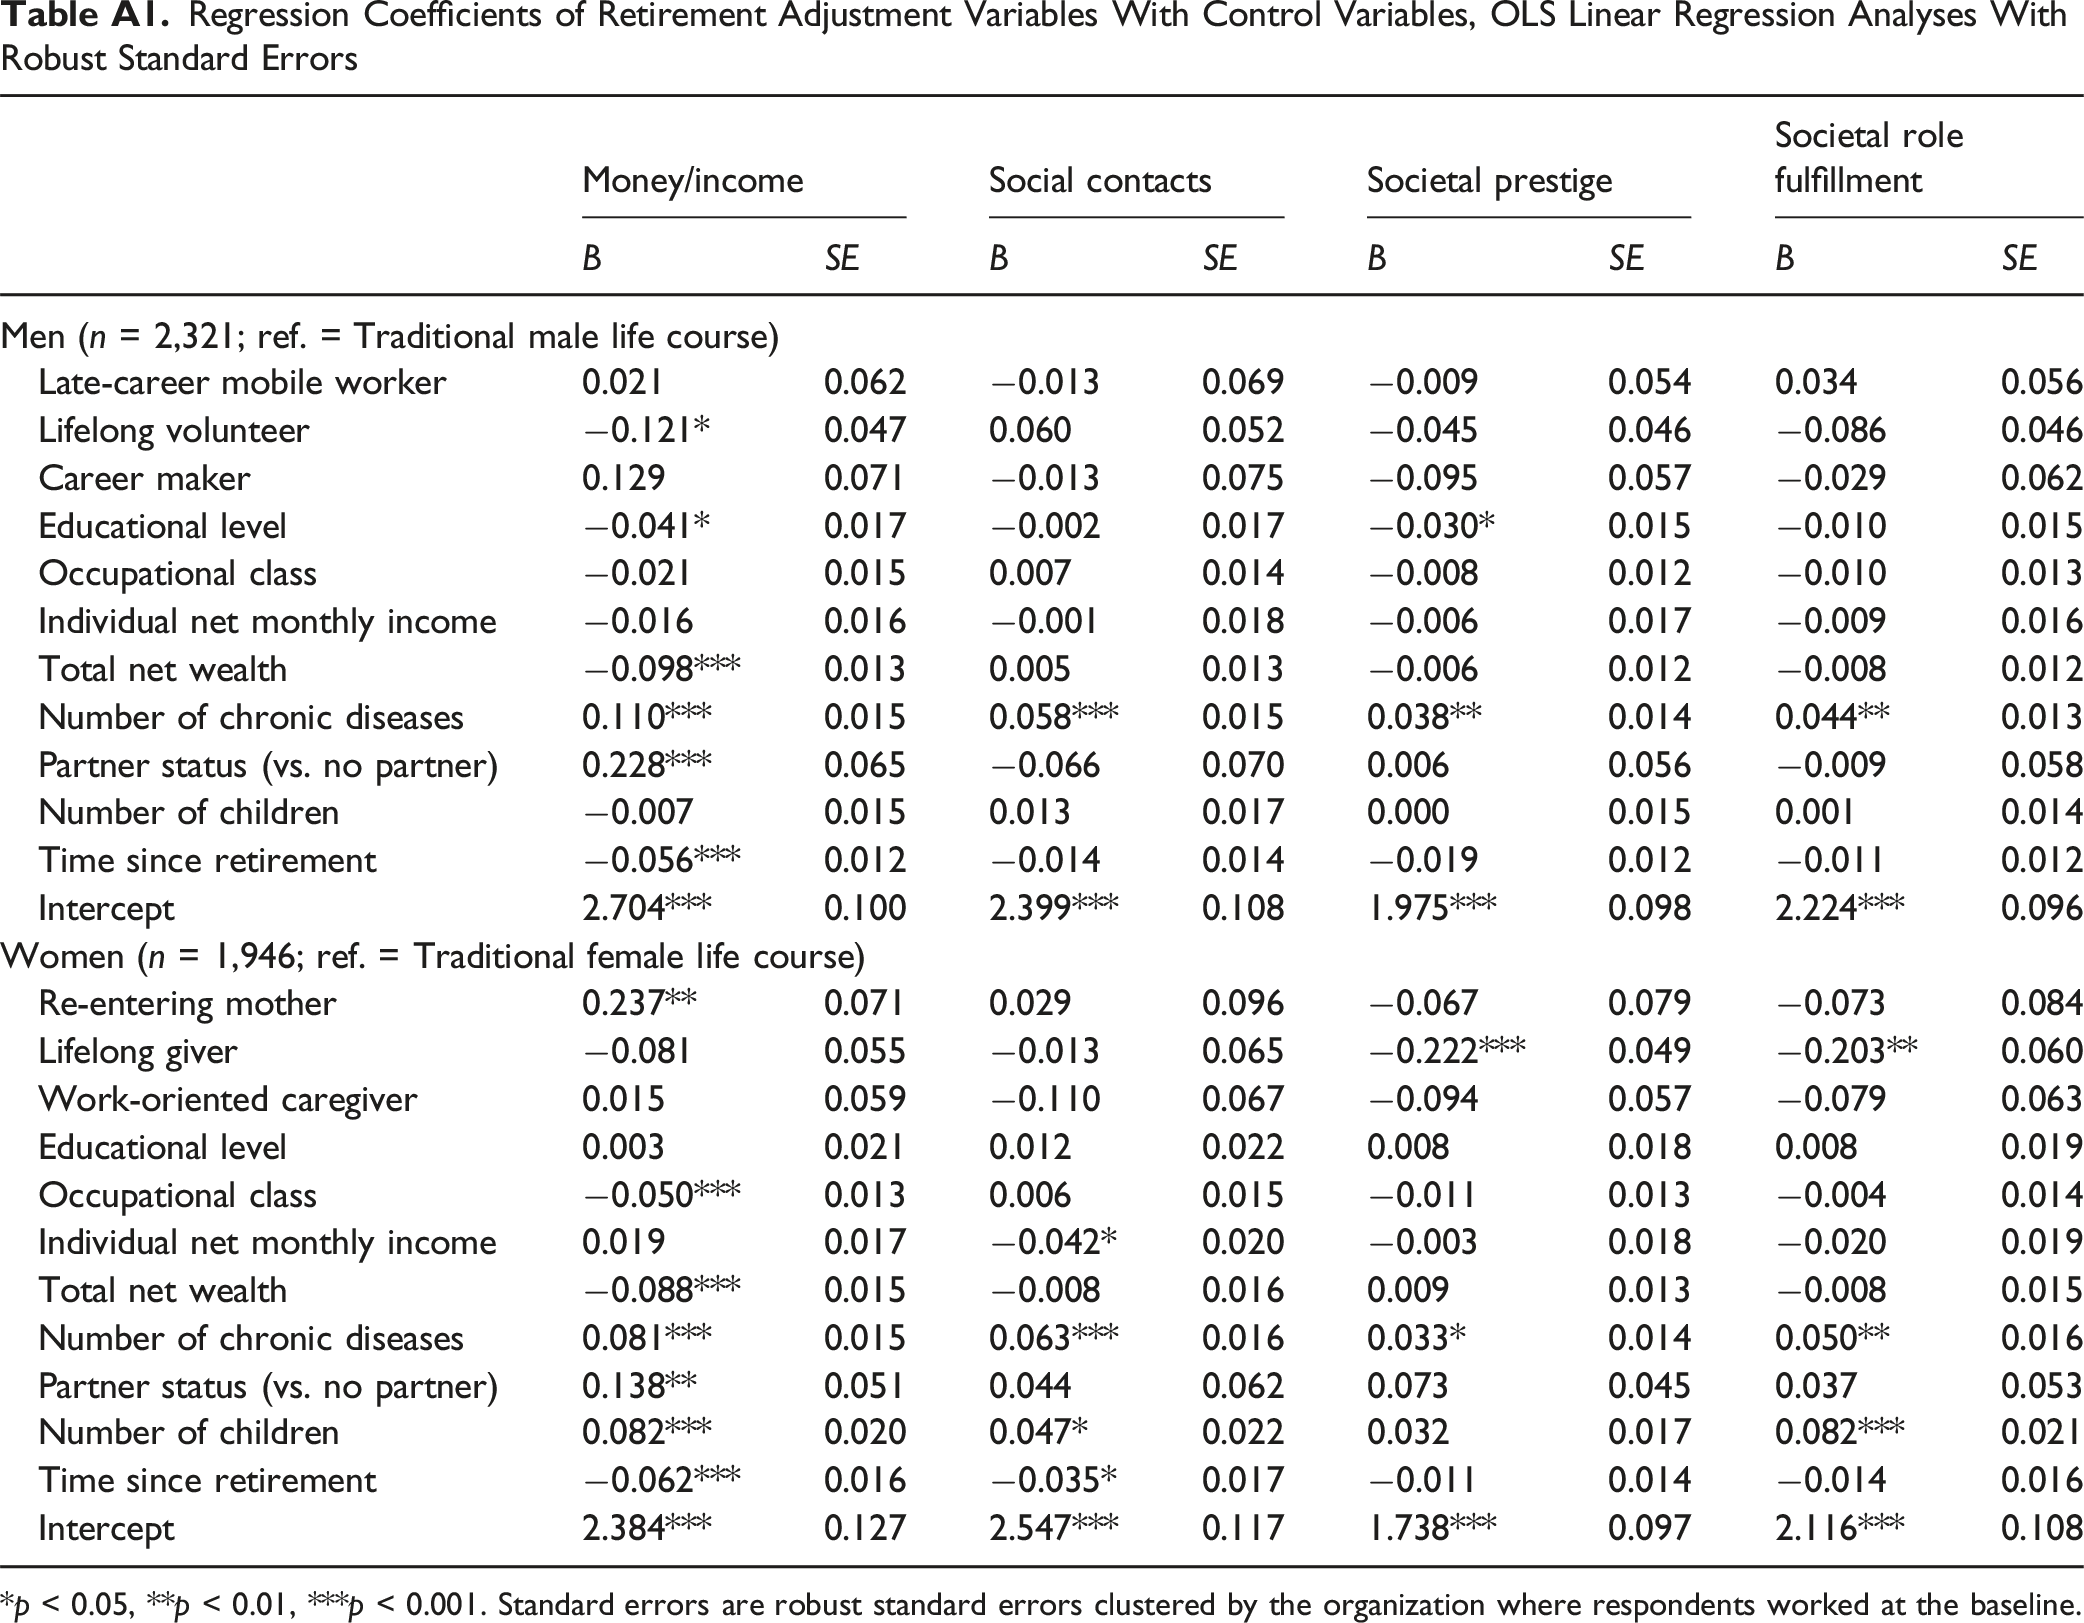
Money/income
Social contacts
Societal prestige
Societal role fulfillment
B
SE
B
SE
B
SE
B
SE
Men (n = 2,321; ref. = Traditional male life course)
Late-career mobile worker
0.021
0.062
−0.013
0.069
−0.009
0.054
0.034
0.056
Lifelong volunteer
−0.121*
0.047
0.060
0.052
−0.045
0.046
−0.086
0.046
Career maker
0.129
0.071
−0.013
0.075
−0.095
0.057
−0.029
0.062
Educational level
−0.041*
0.017
−0.002
0.017
−0.030*
0.015
−0.010
0.015
Occupational class
−0.021
0.015
0.007
0.014
−0.008
0.012
−0.010
0.013
Individual net monthly income
−0.016
0.016
−0.001
0.018
−0.006
0.017
−0.009
0.016
Total net wealth
−0.098***
0.013
0.005
0.013
−0.006
0.012
−0.008
0.012
Number of chronic diseases
0.110***
0.015
0.058***
0.015
0.038**
0.014
0.044**
0.013
Partner status (vs. no partner)
0.228***
0.065
−0.066
0.070
0.006
0.056
−0.009
0.058
Number of children
−0.007
0.015
0.013
0.017
0.000
0.015
0.001
0.014
Time since retirement
−0.056***
0.012
−0.014
0.014
−0.019
0.012
−0.011
0.012
Intercept
2.704***
0.100
2.399***
0.108
1.975***
0.098
2.224***
0.096
Women (n = 1,946; ref. = Traditional female life course)
Re-entering mother
0.237**
0.071
0.029
0.096
−0.067
0.079
−0.073
0.084
Lifelong giver
−0.081
0.055
−0.013
0.065
−0.222***
0.049
−0.203**
0.060
Work-oriented caregiver
0.015
0.059
−0.110
0.067
−0.094
0.057
−0.079
0.063
Educational level
0.003
0.021
0.012
0.022
0.008
0.018
0.008
0.019
Occupational class
−0.050***
0.013
0.006
0.015
−0.011
0.013
−0.004
0.014
Individual net monthly income
0.019
0.017
−0.042*
0.020
−0.003
0.018
−0.020
0.019
Total net wealth
−0.088***
0.015
−0.008
0.016
0.009
0.013
−0.008
0.015
Number of chronic diseases
0.081***
0.015
0.063***
0.016
0.033*
0.014
0.050**
0.016
Partner status (vs. no partner)
0.138**
0.051
0.044
0.062
0.073
0.045
0.037
0.053
Number of children
0.082***
0.020
0.047*
0.022
0.032
0.017
0.082***
0.021
Time since retirement
−0.062***
0.016
−0.035*
0.017
−0.011
0.014
−0.014
0.016
Intercept
2.384***
0.127
2.547***
0.117
1.738***
0.097
2.116***
0.108
Proportion (%) of Pre-retirement Life Course Events From Age 20 to 59 Across Male Classes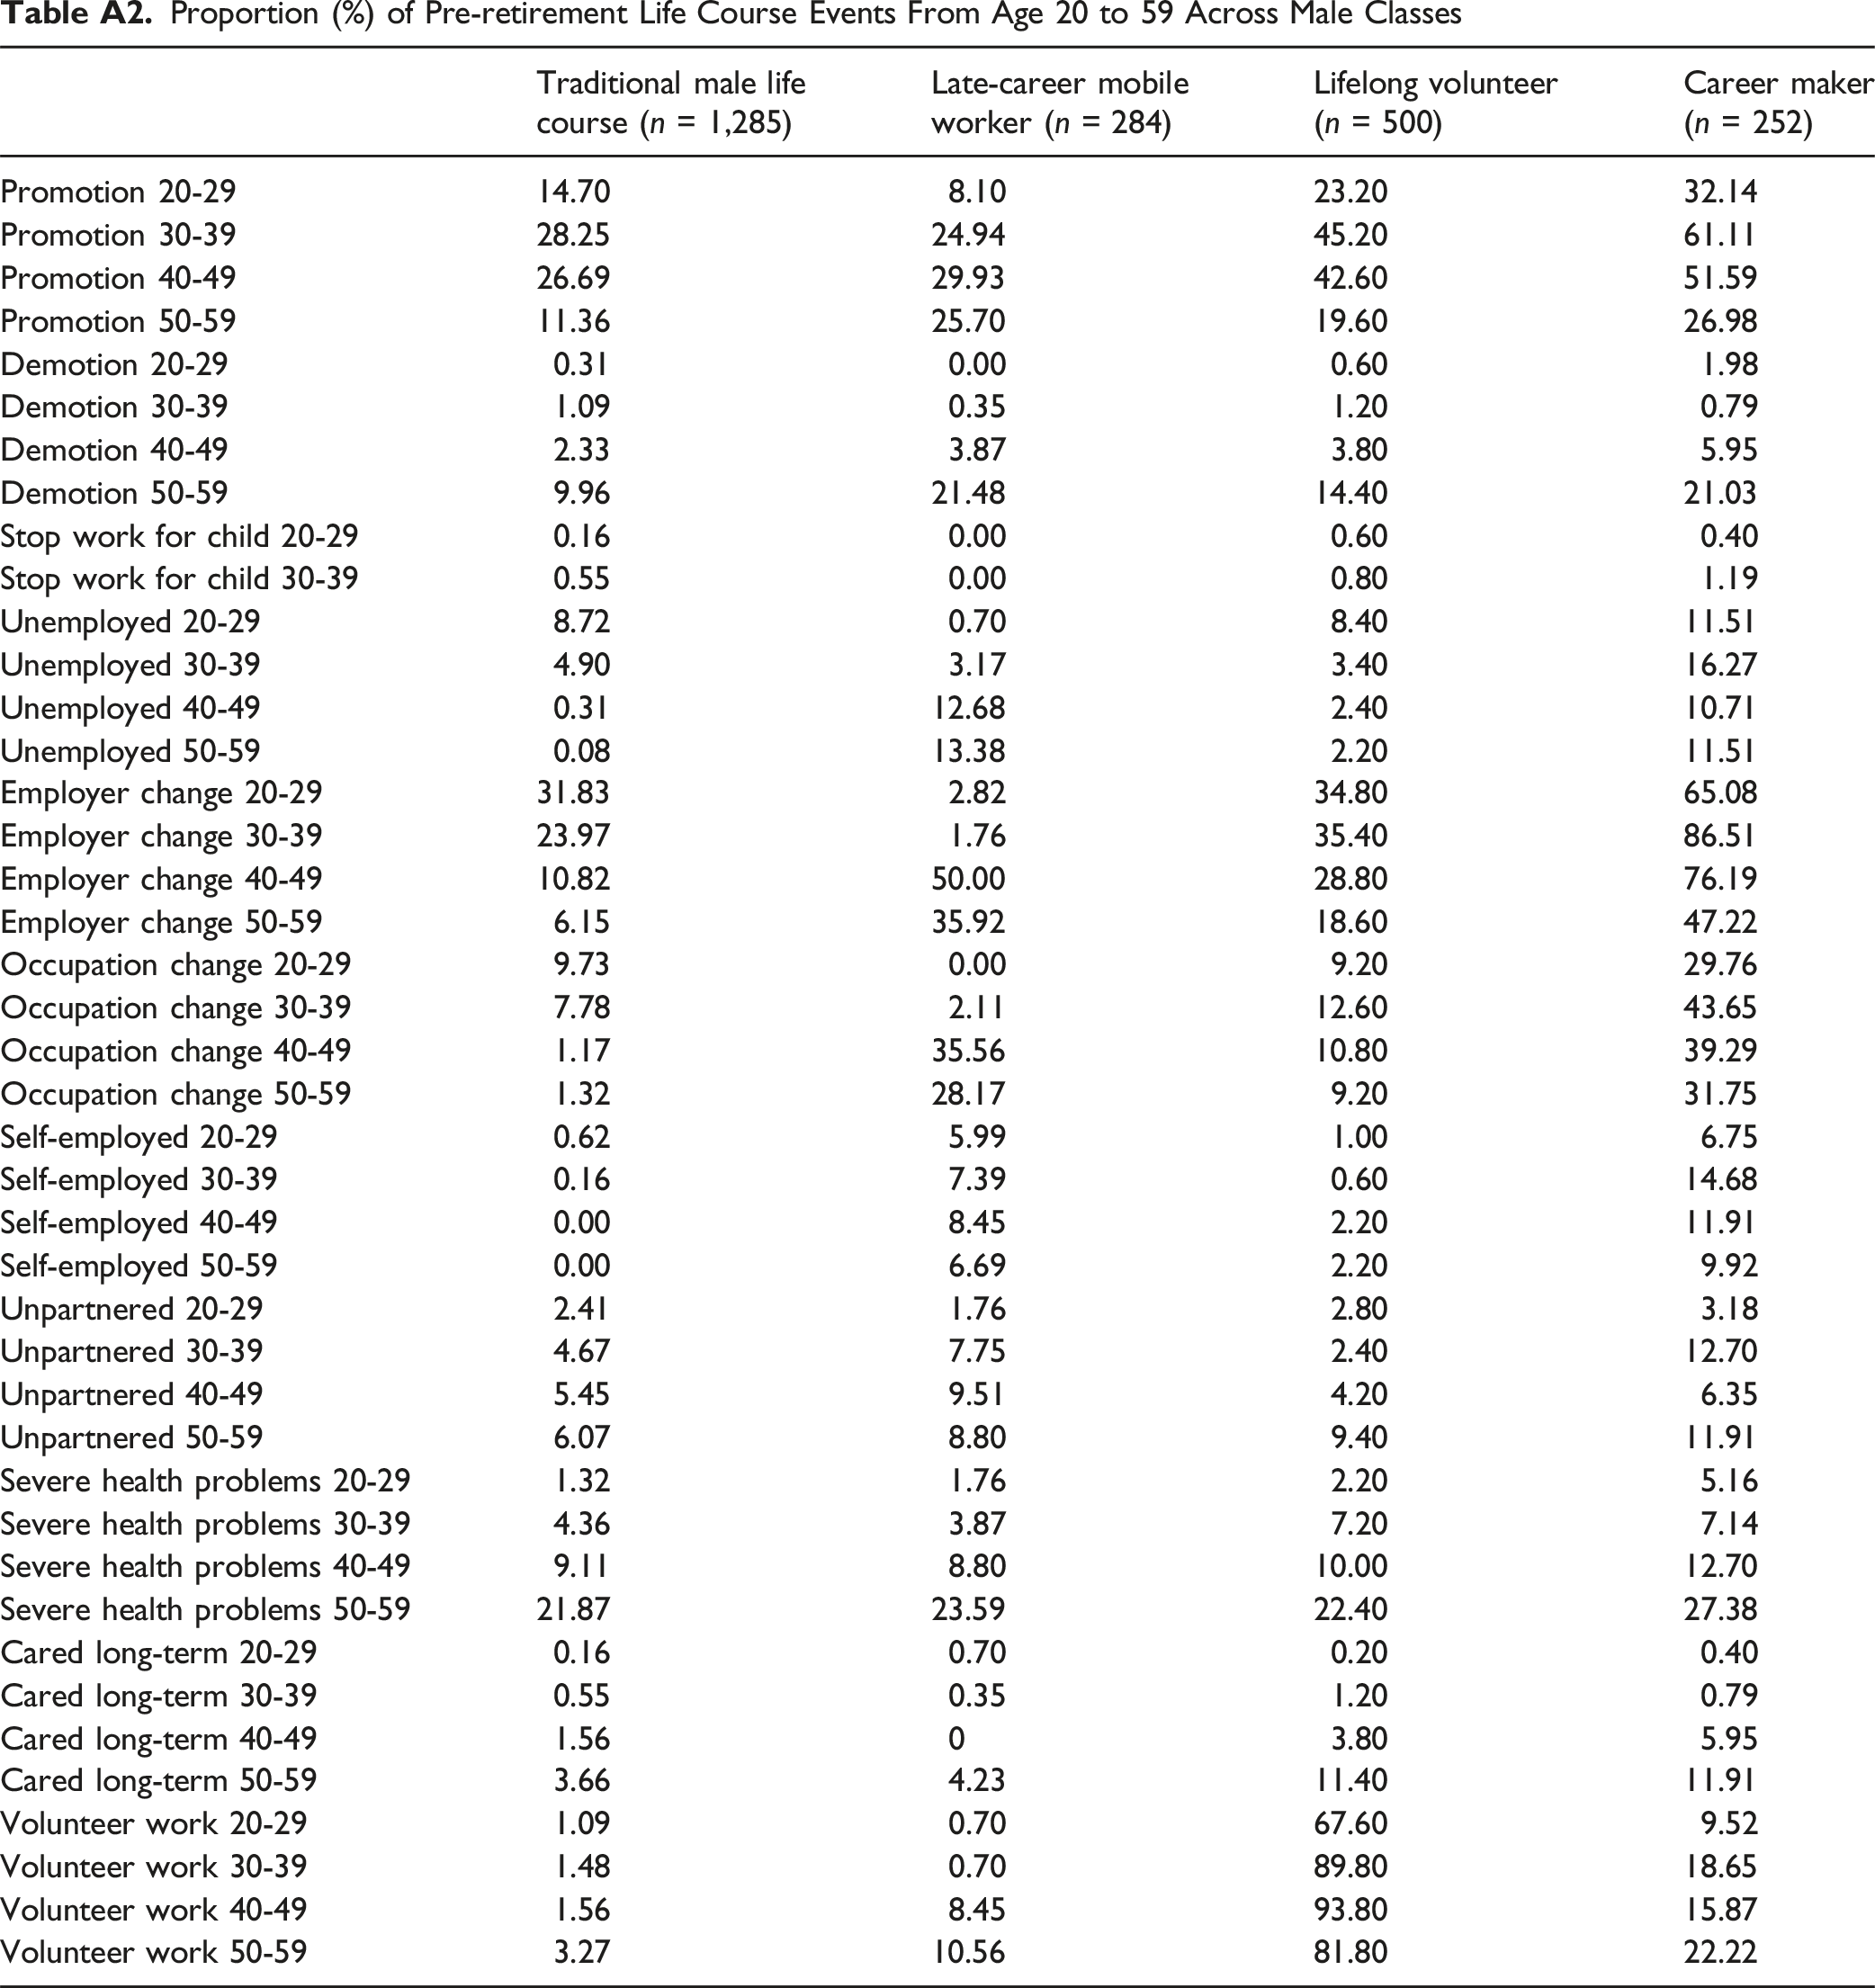
Traditional male life course (n = 1,285)
Late-career mobile worker (n = 284)
Lifelong volunteer (n = 500)
Career maker (n = 252)
Promotion 20-29
14.70
8.10
23.20
32.14
Promotion 30-39
28.25
24.94
45.20
61.11
Promotion 40-49
26.69
29.93
42.60
51.59
Promotion 50-59
11.36
25.70
19.60
26.98
Demotion 20-29
0.31
0.00
0.60
1.98
Demotion 30-39
1.09
0.35
1.20
0.79
Demotion 40-49
2.33
3.87
3.80
5.95
Demotion 50-59
9.96
21.48
14.40
21.03
Stop work for child 20-29
0.16
0.00
0.60
0.40
Stop work for child 30-39
0.55
0.00
0.80
1.19
Unemployed 20-29
8.72
0.70
8.40
11.51
Unemployed 30-39
4.90
3.17
3.40
16.27
Unemployed 40-49
0.31
12.68
2.40
10.71
Unemployed 50-59
0.08
13.38
2.20
11.51
Employer change 20-29
31.83
2.82
34.80
65.08
Employer change 30-39
23.97
1.76
35.40
86.51
Employer change 40-49
10.82
50.00
28.80
76.19
Employer change 50-59
6.15
35.92
18.60
47.22
Occupation change 20-29
9.73
0.00
9.20
29.76
Occupation change 30-39
7.78
2.11
12.60
43.65
Occupation change 40-49
1.17
35.56
10.80
39.29
Occupation change 50-59
1.32
28.17
9.20
31.75
Self-employed 20-29
0.62
5.99
1.00
6.75
Self-employed 30-39
0.16
7.39
0.60
14.68
Self-employed 40-49
0.00
8.45
2.20
11.91
Self-employed 50-59
0.00
6.69
2.20
9.92
Unpartnered 20-29
2.41
1.76
2.80
3.18
Unpartnered 30-39
4.67
7.75
2.40
12.70
Unpartnered 40-49
5.45
9.51
4.20
6.35
Unpartnered 50-59
6.07
8.80
9.40
11.91
Severe health problems 20-29
1.32
1.76
2.20
5.16
Severe health problems 30-39
4.36
3.87
7.20
7.14
Severe health problems 40-49
9.11
8.80
10.00
12.70
Severe health problems 50-59
21.87
23.59
22.40
27.38
Cared long-term 20-29
0.16
0.70
0.20
0.40
Cared long-term 30-39
0.55
0.35
1.20
0.79
Cared long-term 40-49
1.56
0
3.80
5.95
Cared long-term 50-59
3.66
4.23
11.40
11.91
Volunteer work 20-29
1.09
0.70
67.60
9.52
Volunteer work 30-39
1.48
0.70
89.80
18.65
Volunteer work 40-49
1.56
8.45
93.80
15.87
Volunteer work 50-59
3.27
10.56
81.80
22.22
Proportion (%) of Pre-retirement Life Course Events From Age 20 to 59 Across Female Classes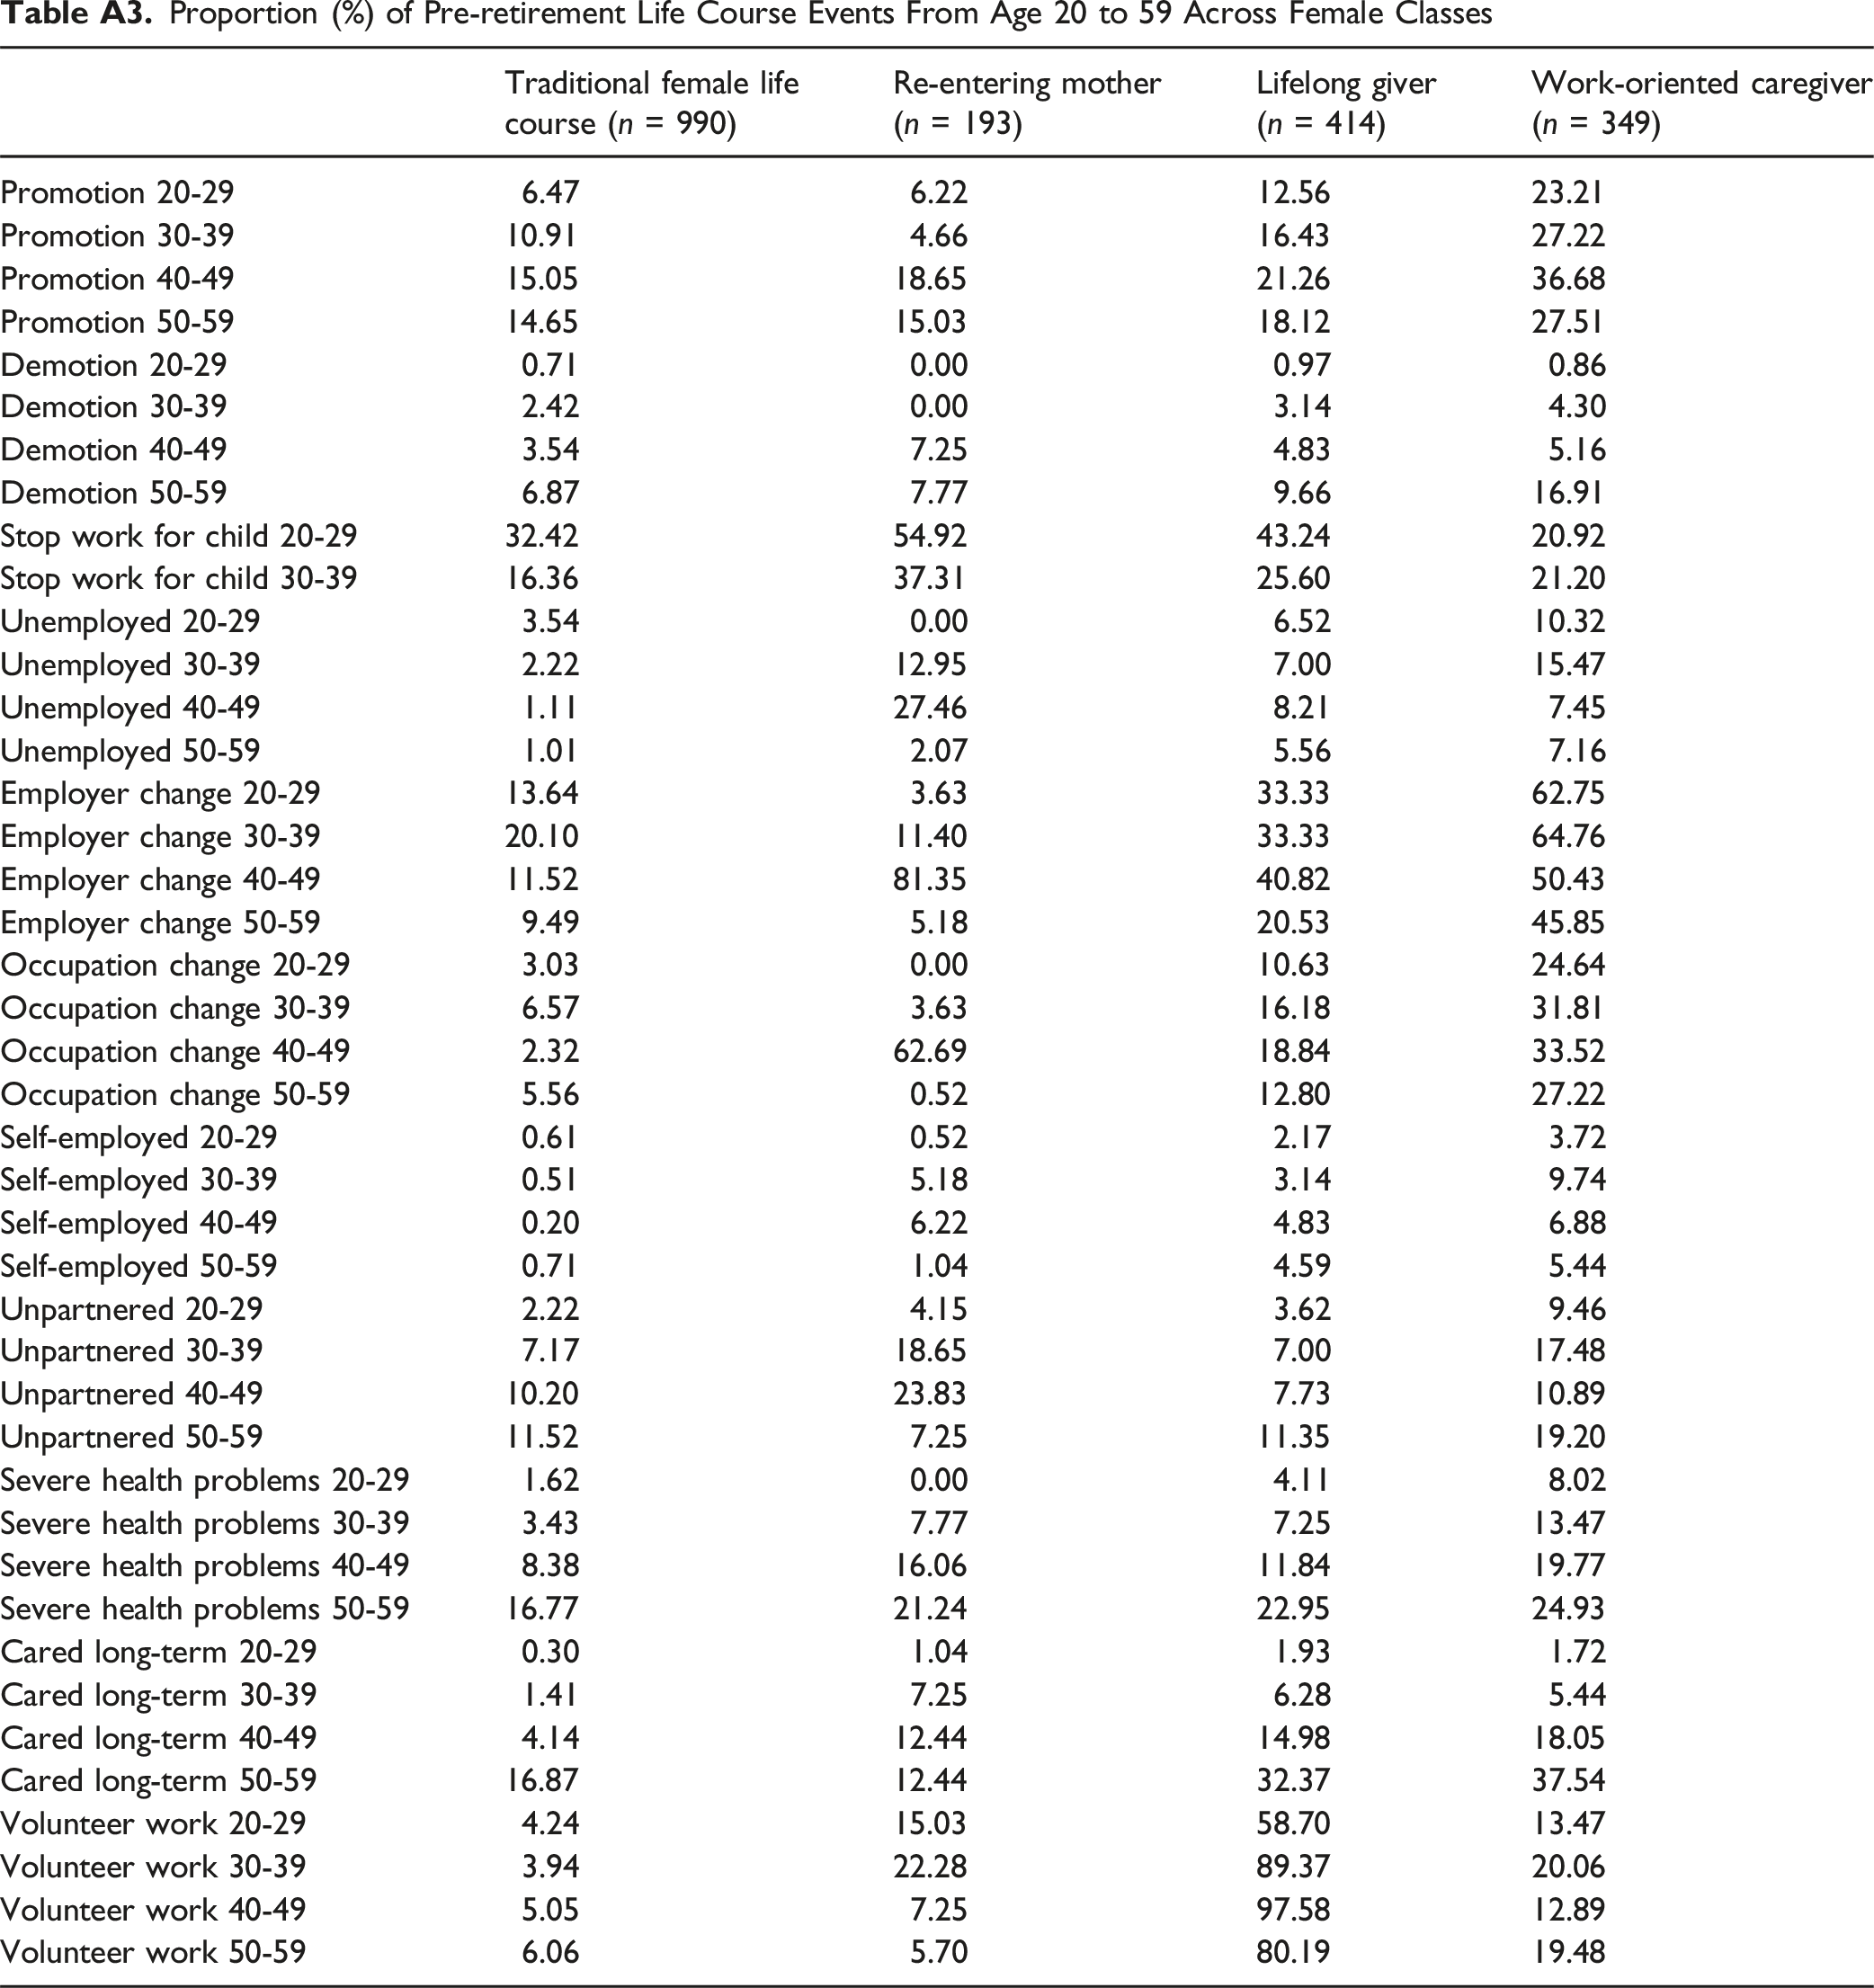
Traditional female life course (n = 990)
Re-entering mother (n = 193)
Lifelong giver (n = 414)
Work-oriented caregiver (n = 349)
Promotion 20-29
6.47
6.22
12.56
23.21
Promotion 30-39
10.91
4.66
16.43
27.22
Promotion 40-49
15.05
18.65
21.26
36.68
Promotion 50-59
14.65
15.03
18.12
27.51
Demotion 20-29
0.71
0.00
0.97
0.86
Demotion 30-39
2.42
0.00
3.14
4.30
Demotion 40-49
3.54
7.25
4.83
5.16
Demotion 50-59
6.87
7.77
9.66
16.91
Stop work for child 20-29
32.42
54.92
43.24
20.92
Stop work for child 30-39
16.36
37.31
25.60
21.20
Unemployed 20-29
3.54
0.00
6.52
10.32
Unemployed 30-39
2.22
12.95
7.00
15.47
Unemployed 40-49
1.11
27.46
8.21
7.45
Unemployed 50-59
1.01
2.07
5.56
7.16
Employer change 20-29
13.64
3.63
33.33
62.75
Employer change 30-39
20.10
11.40
33.33
64.76
Employer change 40-49
11.52
81.35
40.82
50.43
Employer change 50-59
9.49
5.18
20.53
45.85
Occupation change 20-29
3.03
0.00
10.63
24.64
Occupation change 30-39
6.57
3.63
16.18
31.81
Occupation change 40-49
2.32
62.69
18.84
33.52
Occupation change 50-59
5.56
0.52
12.80
27.22
Self-employed 20-29
0.61
0.52
2.17
3.72
Self-employed 30-39
0.51
5.18
3.14
9.74
Self-employed 40-49
0.20
6.22
4.83
6.88
Self-employed 50-59
0.71
1.04
4.59
5.44
Unpartnered 20-29
2.22
4.15
3.62
9.46
Unpartnered 30-39
7.17
18.65
7.00
17.48
Unpartnered 40-49
10.20
23.83
7.73
10.89
Unpartnered 50-59
11.52
7.25
11.35
19.20
Severe health problems 20-29
1.62
0.00
4.11
8.02
Severe health problems 30-39
3.43
7.77
7.25
13.47
Severe health problems 40-49
8.38
16.06
11.84
19.77
Severe health problems 50-59
16.77
21.24
22.95
24.93
Cared long-term 20-29
0.30
1.04
1.93
1.72
Cared long-term 30-39
1.41
7.25
6.28
5.44
Cared long-term 40-49
4.14
12.44
14.98
18.05
Cared long-term 50-59
16.87
12.44
32.37
37.54
Volunteer work 20-29
4.24
15.03
58.70
13.47
Volunteer work 30-39
3.94
22.28
89.37
20.06
Volunteer work 40-49
5.05
7.25
97.58
12.89
Volunteer work 50-59
6.06
5.70
80.19
19.48
Regression Coefficients of Retirement Adjustment Variables With all Classes Compared to Each Other, OLS Linear Regression Analyses With Robust Standard Errors *p < 0.05, **p < 0.01, ***p < 0.001. Standard errors are robust standard errors clustered by the organization where respondents worked at the baseline.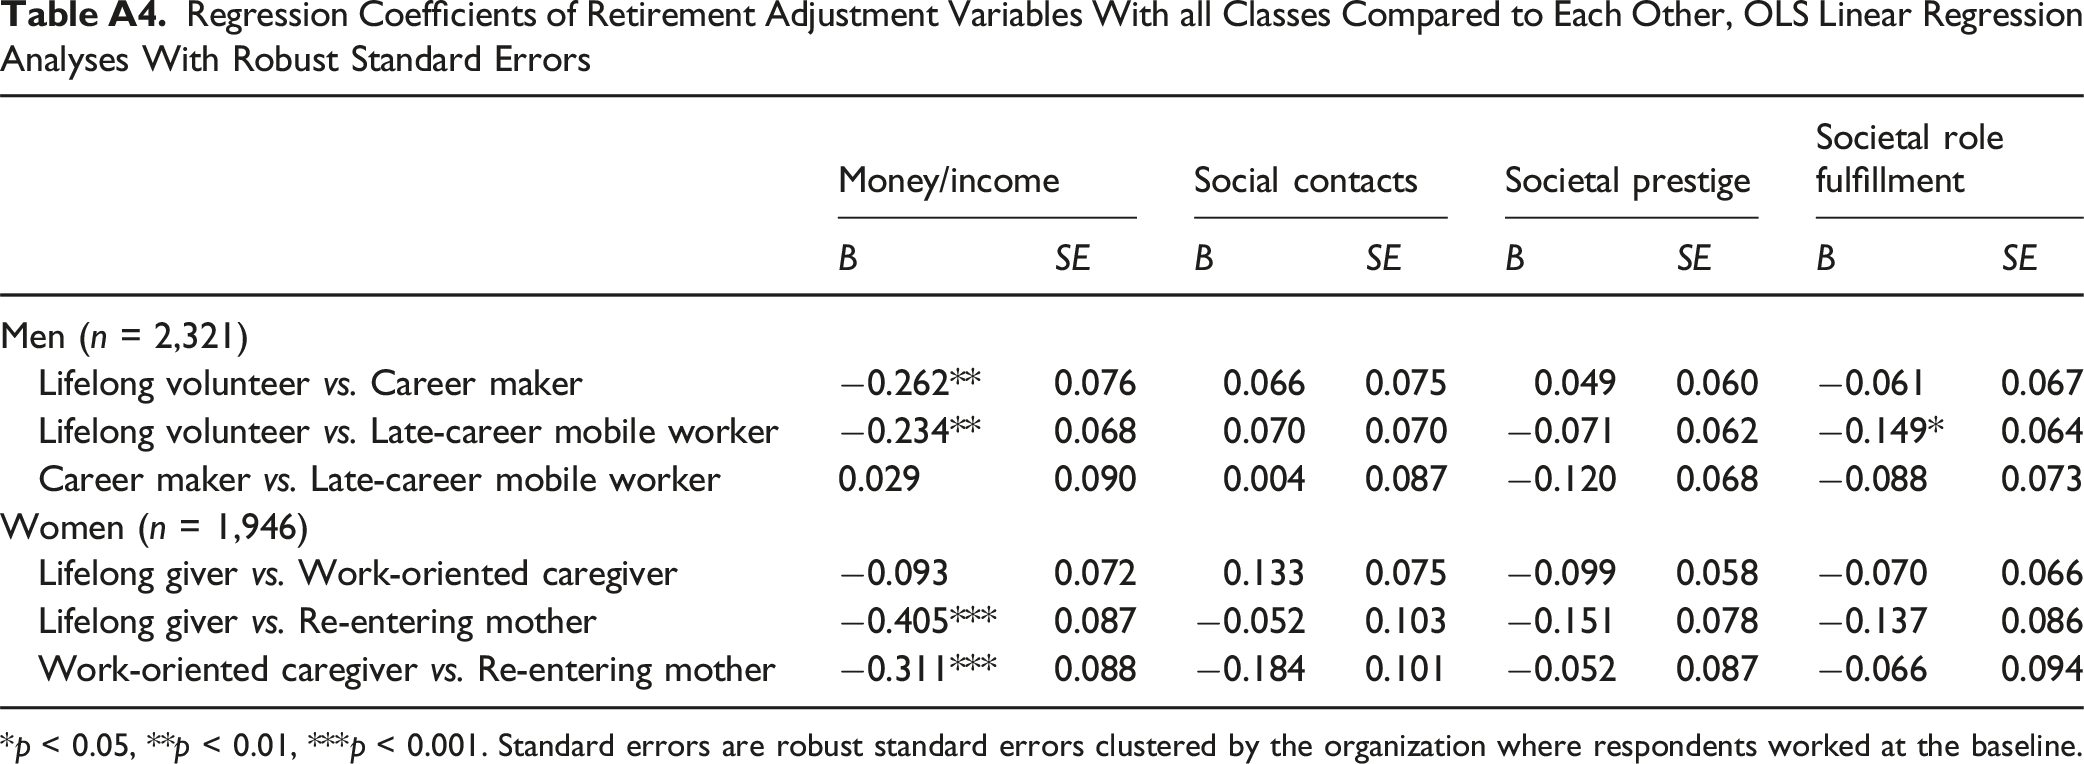
Money/income
Social contacts
Societal prestige
Societal role fulfillment
B
SE
B
SE
B
SE
B
SE
Men (n = 2,321)
Lifelong volunteer vs. Career maker
−0.262**
0.076
0.066
0.075
0.049
0.060
−0.061
0.067
Lifelong volunteer vs. Late-career mobile worker
−0.234**
0.068
0.070
0.070
−0.071
0.062
−0.149*
0.064
Career maker vs. Late-career mobile worker
0.029
0.090
0.004
0.087
−0.120
0.068
−0.088
0.073
Women (n = 1,946)
Lifelong giver vs. Work-oriented caregiver
−0.093
0.072
0.133
0.075
−0.099
0.058
−0.070
0.066
Lifelong giver vs. Re-entering mother
−0.405***
0.087
−0.052
0.103
−0.151
0.078
−0.137
0.086
Work-oriented caregiver vs. Re-entering mother
−0.311***
0.088
−0.184
0.101
−0.052
0.087
−0.066
0.094
Overview of the Sample Selection Process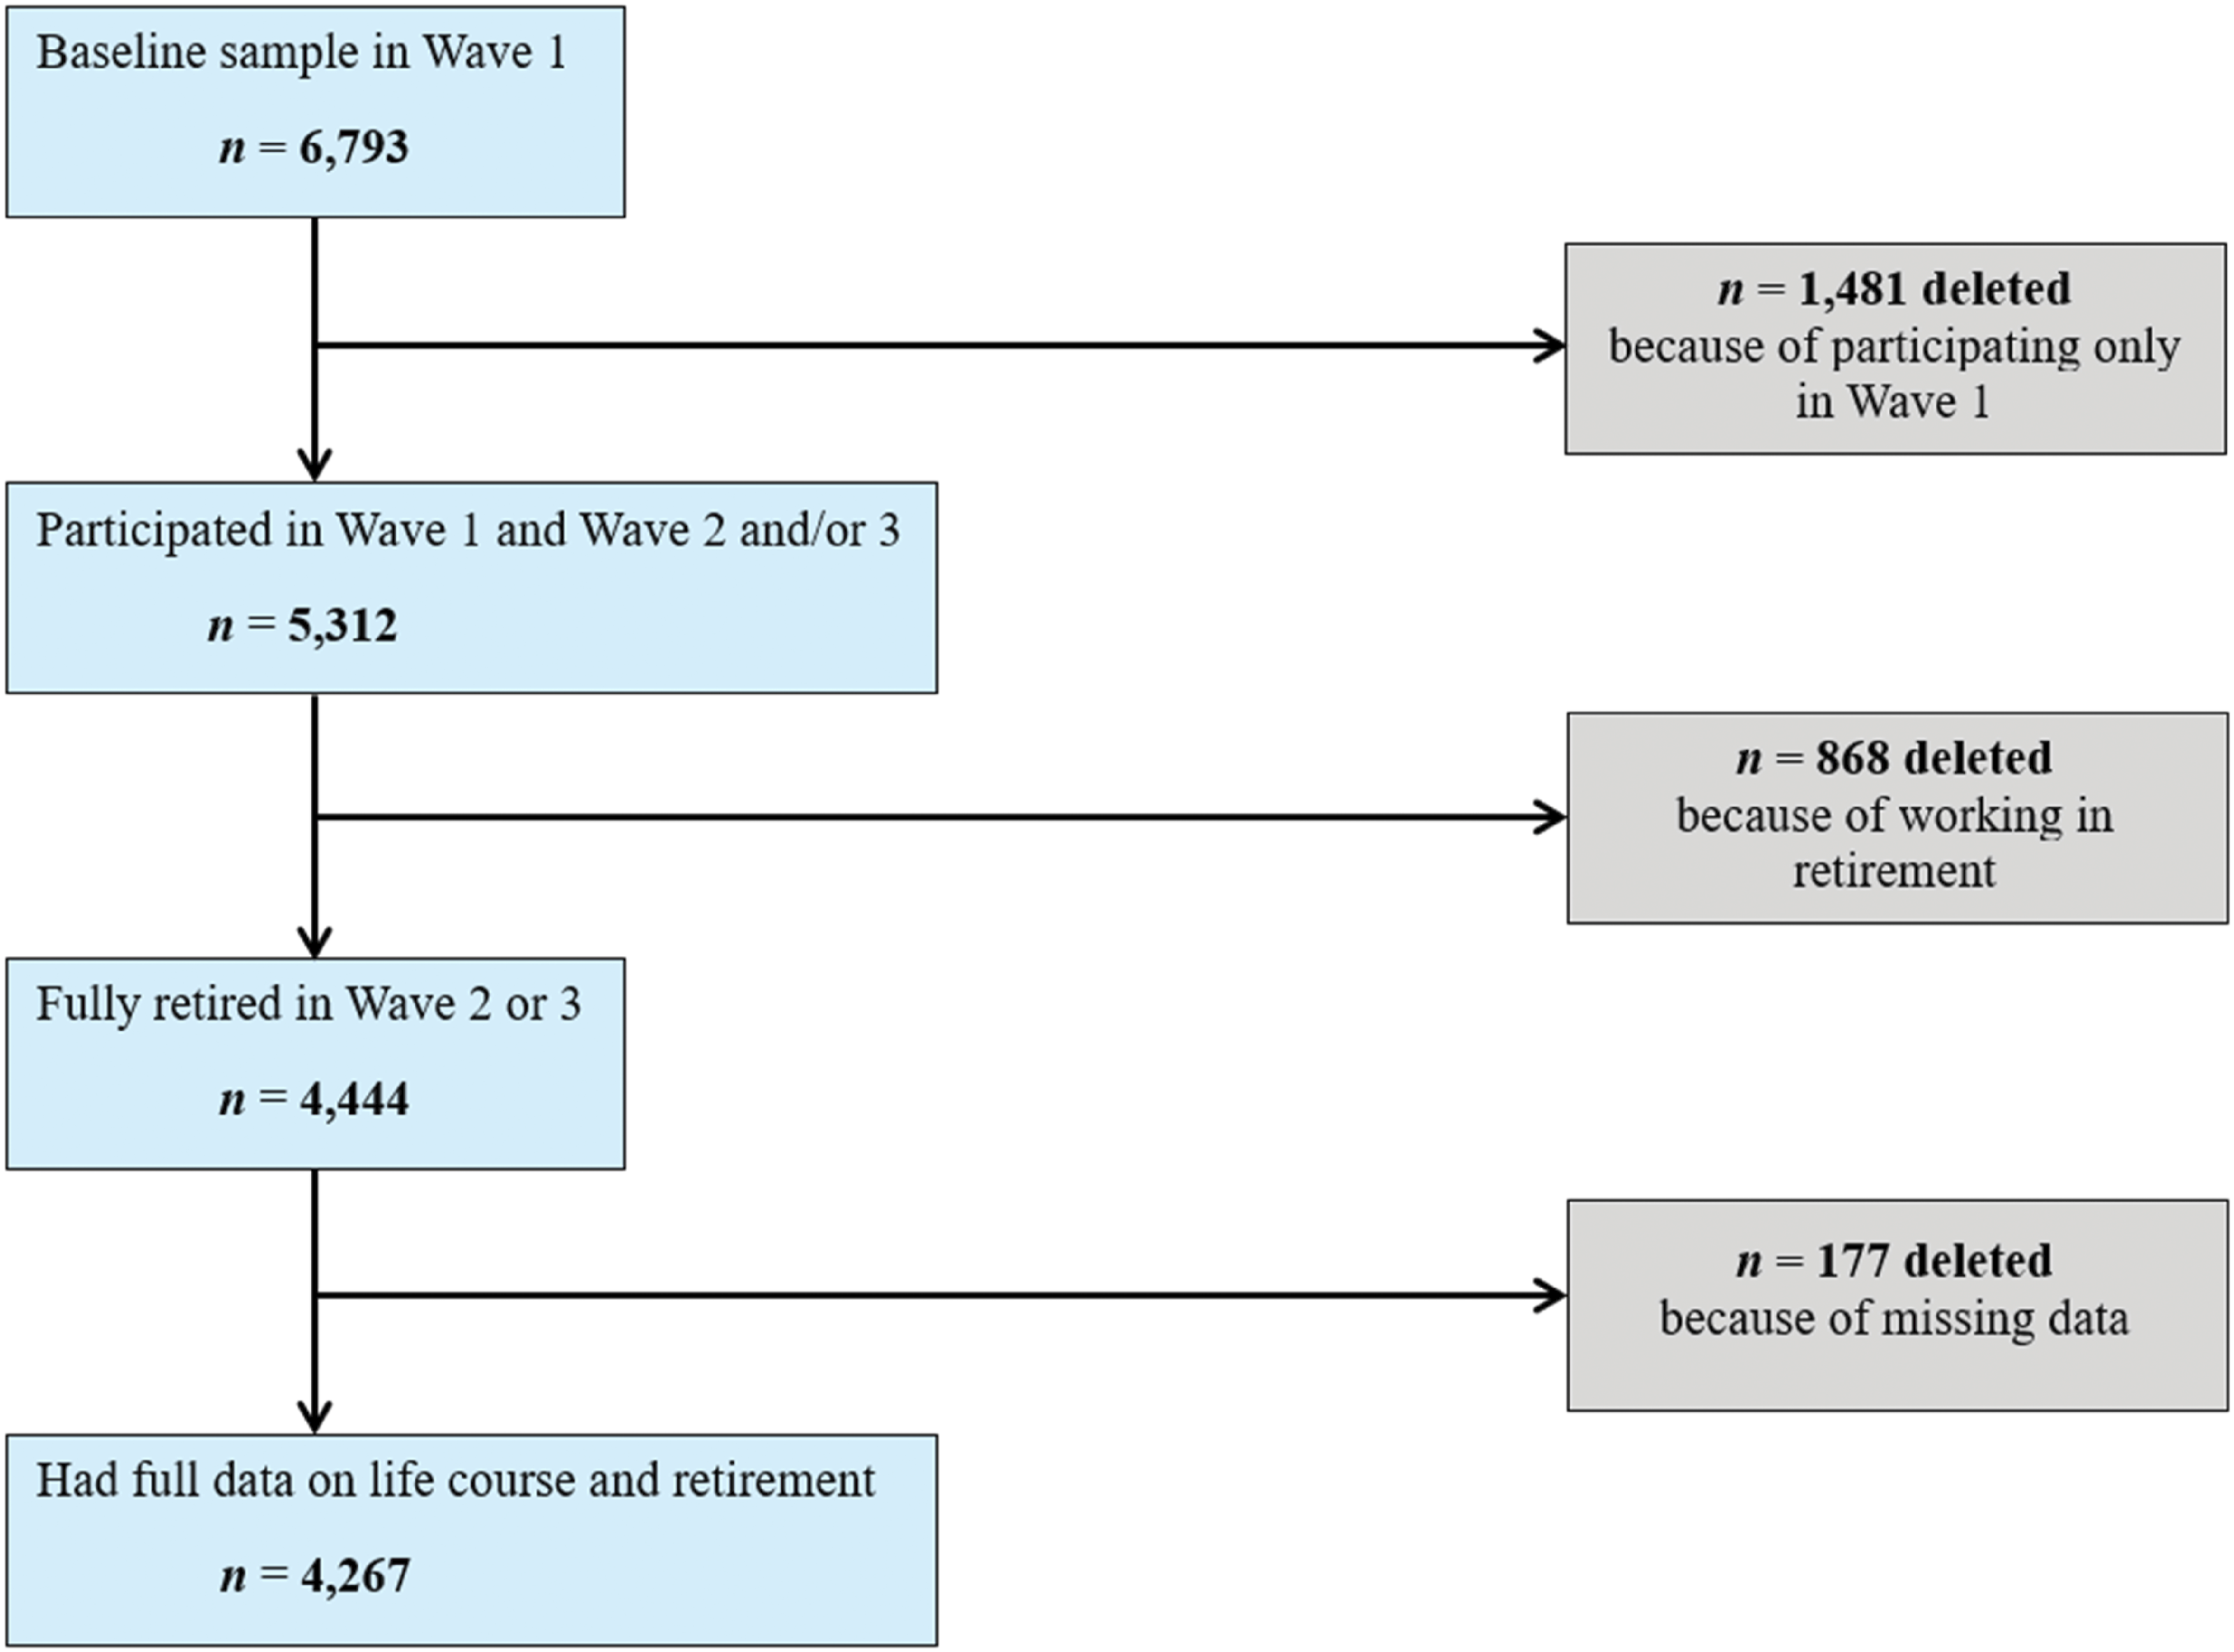
Regression Coefficients of Retirement Adjustment Variables With 95% Confidence Intervals, Logistic Regression Analyses With Robust Standard Errors