
Abstract
This study examines the relationship between individual-level social capital and compliance attitudes toward health protective measures in the context of COVID-19. We drew on secondary population-based data fielded during the pandemic’s initial phase (April – June of 2020). The analytic sample consists of 9124 older American adults (ages 55 and over) across 18 U.S. States and Metropolitan Statistical Areas. We estimated mixed-effects models with random intercepts and slopes. People who are better socially connected are more willing to comply with anti-pandemic government intervention. This relationship is stronger among those who are more psychologically distressed. Its magnitude also increases in more densely populated areas and places with higher numbers of coronavirus infection. Older Americans’ anti-coronavirus compliance attitudes is significantly driven by preexisting interpersonal connectedness and civic engagement. The role of social capital is also contingent on the existing levels of risk factor (threat and vulnerability).
Introduction
In the wake of the COVID-19 outbreak, public health officials have recommended wearing face masks, avoiding crowded places, and keeping a six-feet distance outside the household (CDC, 2021). Over time, as the pandemic situation worsened, government authorities throughout the world began imposing stricter social distancing and other protective guidelines, as well as implementing the closure of schools and non-essential businesses and stay-at-home orders. Recent evidence suggests that such preventive measures have effectively reduced the viral transmission (Fowler et al., 2021; Medline et al., 2020). Importantly, however, they have also caused social isolation and compromised personal freedom. As a result, adherence to anti-COVID-19 guidelines and mandates has not been constant. Rather, it has varied widely across geographical areas at the aggregate level and individual members at the micro level (Allcott et al., 2020; Barrios & Hochberg, 2021; Garnier et al., 2021; Weill et al., 2020). It is proposed that the current pandemic constitutes a “social dilemma,” where short-term self-interests collide with long-term collective interests (Cato et al., 2020; Van Lange et al., 2013; Yong & Choy, 2021). That is, compliance with health protective restrictions inherently involves a collective action problem, i.e., free riders who choose not to contribute to the provision of public health.
Clearly, from the perspective of self-interested actors, cooperating with social distancing and other protective measures can be beneficial for minimizing the risk of infection and even death (Fowler et al., 2021; Medline et al., 2020). At the same time, it can be costly since those who cooperate—by incurring social isolation and loneliness—are more likely to suffer from mental distress and the economic fallout (Choi et al., 2022; Kim & Jung, 2021; Witteveen & Velthorst, 2020). Moreover, people who face a lower risk of infection (e.g., physically healthy individuals) are prone to perceive anti-coronavirus mandates as less urgent and thus more likely to disregard them (Lu et al., 2021; Wise et al., 2020). The consequences of non-compliance can be immediate or delayed with profound implications (Van Lange et al., 2013). In the short run, the failure to comply can temporarily increase rates of infection and mortality. In the long term, if the number of non-contributors (free riders) exceed a critical threshold, the situation could permanently jeopardize public health at large.
Given the global urgency of the coronavirus-induced crisis and the pressing need for its containment, a large volume of studies has emerged probing the conditions under which, or reasons why, people adhere to government guidelines and orders. Why are some more likely to engage in anti-pandemic preventive behaviors and thereby contribute to overcoming the social dilemma? According to a systematic review, a variety of individual-level factors has been examined including sociodemographic characteristics, pandemic-related beliefs and fears, perception of the media, trust in government, scientific literacy, and the like (Moran et al., 2021). Despite a wide coverage of potential predictors, the role of social capital has received scant attention, mostly due to lack of data. To the extent that social capital has been considered in the COVID-19 context, findings almost exclusively rely on aggregate, or regional-level, data (Alfano, 2022; Ferwana & Varshney, 2021; Fraser et al., 2021; Makridis & Wu ,2021), thereby raising the thorny issue of ecological fallacy. Moreover, while older adults have been known to be particularly vulnerable to the threat of COVID-19, prior research has largely focused on the community-dwelling adults of all ages (Frounfelker et al., 2021; Hayashi et al., 2022; Liu & Li, 2021; Wright et al., 2021).
In the present study, we endeavor to bridge the existing gap in the literature by shifting the analytic angle toward a demographically older group facing especially heightened risks of COVID-19 infection and mortality (Shahid et al., 2020; Vahia et al., 2020). Across different empirical settings, as the outcome variable, previous studies have primarily analyzed individual compliance with protective behaviors (e.g., physical distancing, avoiding public places, washing hands, wearing a mask), and, to lesser extent, subjective attitudes regarding the pandemic (Moran et al., 2021). Our research extends the conventional boundary of outcome measurement by investigating people’s support for the government to invasively test and regularly track anyone suspected of infection using internet-based communication technologies. Specifically, the present study’s objective is to hypothesize and demonstrate whether and how individual-level social capital, conditioning on community-level social capital, is associated with willingness to comply with anti-pandemic government intervention among a probability sample of older American adults.
Social Capital and COVID-19 Compliance Behavior
Increasingly, research has examined the role of interpersonal connectedness or embeddedness, i.e., “social capital,” as a critical determinant of health and health behaviors (Kawachi et al., 2008; Uphoff et al., 2013). Social capital generally refers to the manners in which individuals are interconnected through networks and organizations and the related access to resources and benefits such as generalized trust, emotional and material support, and norms of reciprocity (Putnam, 2000; Sampson, 2003). A growing number of findings indicates positive associations between social capital and myriad indicators of health (for an overview, see Ehsan et al., 2019). The main issue for our study is how, if at all, social capital may be related to overcoming a social dilemma posed by the COVID-19 pandemic, that is, people’s willingness to contribute to public health safety. Below, our empirical analysis and discussion of findings are based on the following question: Are individuals who are more socially connected or engaged more supportive of government intervention to combat the viral transmission at the cost of personal privacy?
According to prior studies, social capital is positively linked with health-protective behaviors (Chuang et al., 2015; Rönnerstrand, 2014); it is also found to facilitate post-disaster recovery processes (Aldrich & Meyer, 2015). Closer to the topic of our research, a limited body of studies has explored the connection between social capital and COVID-19-related outcomes, but with mixed findings. On the one hand, at the aggregate level social capital is shown to lessen the impact of the pandemic in terms of lower infection cases, growth rates, and excess deaths (Bartscher et al., 2021; Elgar et al., 2020; Fraser et al., 2021; Makridis & Wu, 2021). On the other hand, however, social capital ostensibly exacerbates the effect of COVID-19. Drawing on Facebook data, for example, geographic areas with more social ties to early pandemic ‘hotspots’ had higher COVID-19 cases (Kuchler, Russel, & Stroebel, 2022). Also, the U.S. counties with higher levels of relational social capital (e.g., organized group membership) experienced fewer COVID-19 deaths, but this association was reversed with respect to cognitive social capital such as interpersonal trust (Borgonvi et al., 2021; Elgar et al., 2020).
Still, others have probed the connection between social capital and social distancing intentions and behaviors. Higher social capital was regionally associated with reduced mobility across North America and Europe (Barrios et al., 2021; Borgonvi et al., 2021). Another study found that in the U.S. social distancing was less responsive to COVID-19 cases and restrictions in places with higher community engagement, while counties with greater commitment to social institutions increased social distancing in response to COVID-19 cases and restrictions (Ding et al., 2020). These mixed findings imply that different aspects of social capital are differentially related to the pandemic-related outcomes, highlighting the need to conceptualize and measure the concept more precisely. Also, researchers have examined the relationship between social capital and health protective behavior mainly among the general population. Few studies that do examine older, i.e., more vulnerable, subgroups—since analyses are ecological based on aggregate orregional data—offer only a crude picture of this relationship in the context of individuals who make up a significant segment of the population disproportionately affected by the virus (Mueller et al., 2020).
Research Hypotheses and Questions
Building on and extending previous research, we conjecture that older adults with higher levels of social capital are more willing to comply with invasive government plans to curb the viral transmission, that is, contribute to overcoming the public health crisis caused by COVID-19. This willingness, we propose, is significantly rooted in interpersonal connectedness and engagement, or lack thereof. In general, the social lives of older adults are characterized by fewer social ties in part due to life transitions such as retirement and bereavement (McPherson et al., 2006), though they also maintain more emotionally meaningful relationships (English & Carstensen, 2014). According to findings, intimate ties can exert informal social control by way of encouraging adherence to health-promoting norms (Umberson, 1992; Umberson et al., 2010). Such relationships also motivate individuals to engage in healthy behaviors by generating a sense of belonging and attachment (Berkman et al., 2000; Thoits, 2011).
In addition, there is evidence on the positive link between civic engagement, such as volunteering or taking part in community-based organizations, and health outcomes (Chang et al., 2022; McDougle et al., 2014; Pillemer et al., 2010). Such associational involvement can evolve into lasting relationships, providing access to health information and other relationally available resources (Goldman & Cornwell, 2015). Volunteering may be particularly relevant as it is a prosocial behavior that enables people to recognize others outside of their immediate network. Older persons who participate in volunteering, therefore, may have a better understanding of the importance of COVID-19 compliance for the benefit of broader society. And of course, there may be a selection process here, as those willing to volunteer are probably more interested in the well-being of others in the first place.
Based on above discussions, we elaborate on our thesis by way of introducing two distinct, yet complementary, mechanisms: internal and external. The internal mechanism or logic implies that those who are better socially connected and/or engaged have a stronger sense of group identity as well as a stronger sense of civic duty. As a result, they may be psychologically (that is, internally) more motivated to support and comply with anti-pandemic government measures as part of a collective campaign. In comparison, the external mechanism suggests that ‘better-connected’ individuals are also likely to be reminded by others (family, friends, and neighbors) to adhere to government mandates, i.e., they are more prone to face greater pressure from outside (that is, externally) to contribute to the protection or provision of public health. 1 This dual logic, then, leads to our main hypothesis:
( According to the literature, stay-at-home orders had increased experiences of isolation and loneliness, which, especially for the older population, produced deleterious consequences in terms of worse mental health including elevated levels of psychological distress (Choi et al., 2022; Kim & Jung, 2021; Knox et al., 2022). It is also widely known that, above all ecological factors, population density most powerfully fueled the spread of the novel coronavirus (Sy et al., 2021) and that the resulting cases of infection, in turn, contributed to emotional anxiety and poor mental health (Liu et al., 2021). What these three measures—distress, density, and infection—have in common is that they are risk factors related to subjective “vulnerability” and objective “threat,” respectively. On the one hand, psychological distress (e.g., feeling nervous, anxious, depressed, and hopeless) is a proxy for subjective vulnerability at the individual level. On the other, population density (conducive to the viral transmission) and infected cases independently gauge objective threat at the aggregate level. Given this, we conjecture that all else equal, persons who are more distressed, reside in denser (i.e., more urban) locations, or surrounded by higher total numbers of viral infection might be more sensitive and thus responsive to the spread of COVID-19. If so, a relevant issue worthy of investigation is whether and to what extent the three measures of vulnerability/threat potentially modify the magnitude of the focal relationship under consideration. We anticipate that the association between social capital and anti-pandemic compliance behavior will not be constant but vary partly as a function of these individual- and contextual-level risk factors. In addition to the main effect of social capital specified in the above hypothesis, we thus introduce below a set of research questions framed to probe possible interactions between social capital and these sources of risk (measures of vulnerability and threat) operationalized across different units of analysis.
(
(
(
Methods
Sample
Data were drawn from three waves (W1-W3) of the COVID Impact Survey fielded in April (20–26), May (4–10), and June (1–8) of 2020, respectively, across the U.S. For the analysis, we merged them into a single cross-sectional file. Data collection was completed by the NORC (National Opinion Research Center) at University of Chicago. COVID Impact Survey provides estimates of the American adult household population for 18 regions including 10 States (California, Colorado, Florida, Louisiana, Minnesota, Missouri, Montana, New York, Oregon, Texas) and 8 Metropolitan Statistical Areas (Atlanta, Baltimore, Birmingham, Chicago, Cleveland, Columbus, Phoenix, Pittsburgh). The sampling frame is based on an extract of the U.S. Postal Service delivery-sequence file, covering approximately 97% of the U.S. population. A special user agreement with NORC provided the corresponding author of this study access to the restricted data with 4-digit FIPS (Federal Information Processing Standard Publication) geocodes available at the county level. For the analysis, we pooled the data across W1 (N = 7467; completion rate = 92.7%), W2 (N = 7420; completion rate = 93.3%), and W3 (N = 6082; completion rate = 92.5%). We then drew on a subsample of respondents ages 55 years old and over. After listwise deletion of cases with missing values (under 8% of the original sample), our effective sample consists of 9124 older adults nested in 645 counties across 18 larger regional clusters (i.e., cities and states). Technical information on sampling procedures and other methodological matters are available at the repository maintained by the Data Foundation, a not-for-profit think tank (https://www.covid-impact.org/results).
Outcome Measure
The dependent variable (COVID-19 compliance) is based on a multi-item question: “There are some options for testing and tracking people who may have COVID-19 in order to help slow the spread of this virus. If these options were available to you, how likely is it for you to participate in them?” A) Installing an app on your phone that asks you questions about your own symptoms and provides recommendations about COVID-19. B) Installing an app on your phone that tracks your location and sends push notifications if you might have been exposed to COVID-19. C) Using a Web site to log your symptoms and location and get recommendations about COVID-19. D) Testing you for COVID-19 infection using a Q-tip to swab your cheek or nose E. Testing you for immunity or resistance to COVID-19 by drawing a small amount of blood. Original answers (1 = ‘extremely likely’; 2 = ‘very likely’; 3 = ‘moderately likely’; 4 = ‘not too likely’; 5 = ‘not likely at all’) were reverse coded and averaged to create a composite index with a higher score corresponding to greater willingness to comply (Cronbach’s α = .86).
Main Predictor
Our key explanatory variable, Social connectedness, is measured using items inquiring about the survey participants’ relationships with friends, family members, and neighbors, as well as their civic engagement (involvement in volunteering), prior to the onset of the COVID-19 pandemic: 1) “During a typical month prior to March 1, 2020, when COVID-19 began spreading in the United States, how often did you talk with any of your neighbors?” 2) “During a typical month prior to March 1, 2020, when COVID-19 began spreading in the United States, how often did you communicate with friends and family by phone, text, email, app, or using the Internet?” 3) “During a typical month prior to March 1, 2020, when COVID-19 began spreading in the United States, did you spend any time volunteering for any organization or association, or not?” The first two items were coded on a 5-point scale (5 = ‘Basically every day’; 4 = ‘A few times a week’; 3 = ‘A few times a month’; 2 = ‘Once a month’; 1 = ‘Not at all’) and the third one was based on its original binary coding (1 = ‘Yes’; 0 otherwise). Answers were standardized with the mean of 0 and the standard deviation of 1 and then combined, with a higher number indicating greater connectedness.
Moderators
There are three moderators in relation to the research questions posed above. Psychological distress is based on the following survey item: “In the past 7 days, how often have you A) Felt nervous, anxious, or on edge B) Felt depressed C) Felt lonely D) Felt hopeless about the future (1 = “not at all or less than 1 day”; 2 = “1–2 days”; 3 = “3–4 days”; 4 = “5–7). days”). Answers were combined into a scale (Cronbach’s alpha = .73). Data for Population density come from the US Census Bureau COVID-19 site (converted to z-scores). For the level of infection, we use a variable named COVID-19 cases based on (z-standardized) averaged data daily tracked by the Center for Systems Science and Engineering at Johns Hopkins University.
Individual and contextual covariates
For conservative parameter estimates of the main predictor (Social connectedness), our models adjust for multiple confounders at individual and contextual units of analysis. At the individual level, we include the following socioeconomic and demographic controls: age, race, gender, education, income, family size, and employment status. To further check that the focal relationship between social capital and compliance attitude is not spurious, our analysis conditions on medical symptoms and pandemic-induced restrictions. Adjusting for these factors is critical since mental state and experienced COVID-19 restrictions would significantly shape survey respondents’ answers regarding the outcome measure. Importantly, doing so allows us to eliminate the alternative explanation that willingness to comply with the anti-pandemic government intervention is purely driven by a concern for personal health protection, not a desire to contribute to the well-being of others. Lastly, to control for unobserved temporal trends, we include wave (time) dummies. At the contextual level, we add Trump-Clinton vote gap during the 2016 Presidential Election, an indicator for social distancing orders mandated by the state government, a comprehensive gauge of county-level vulnerability (Social Vulnerability Index) compiled by the Centers for Disease Control and Prevention based on regional socioeconomic status, household composition/disability, minority status/language, and housing type/transportation, and, lastly, a set of dummies for States and Metropolitan Statistical Area (i.e., regional fixed effects).
Summary of Descriptive Statistics and Variable Definitions.
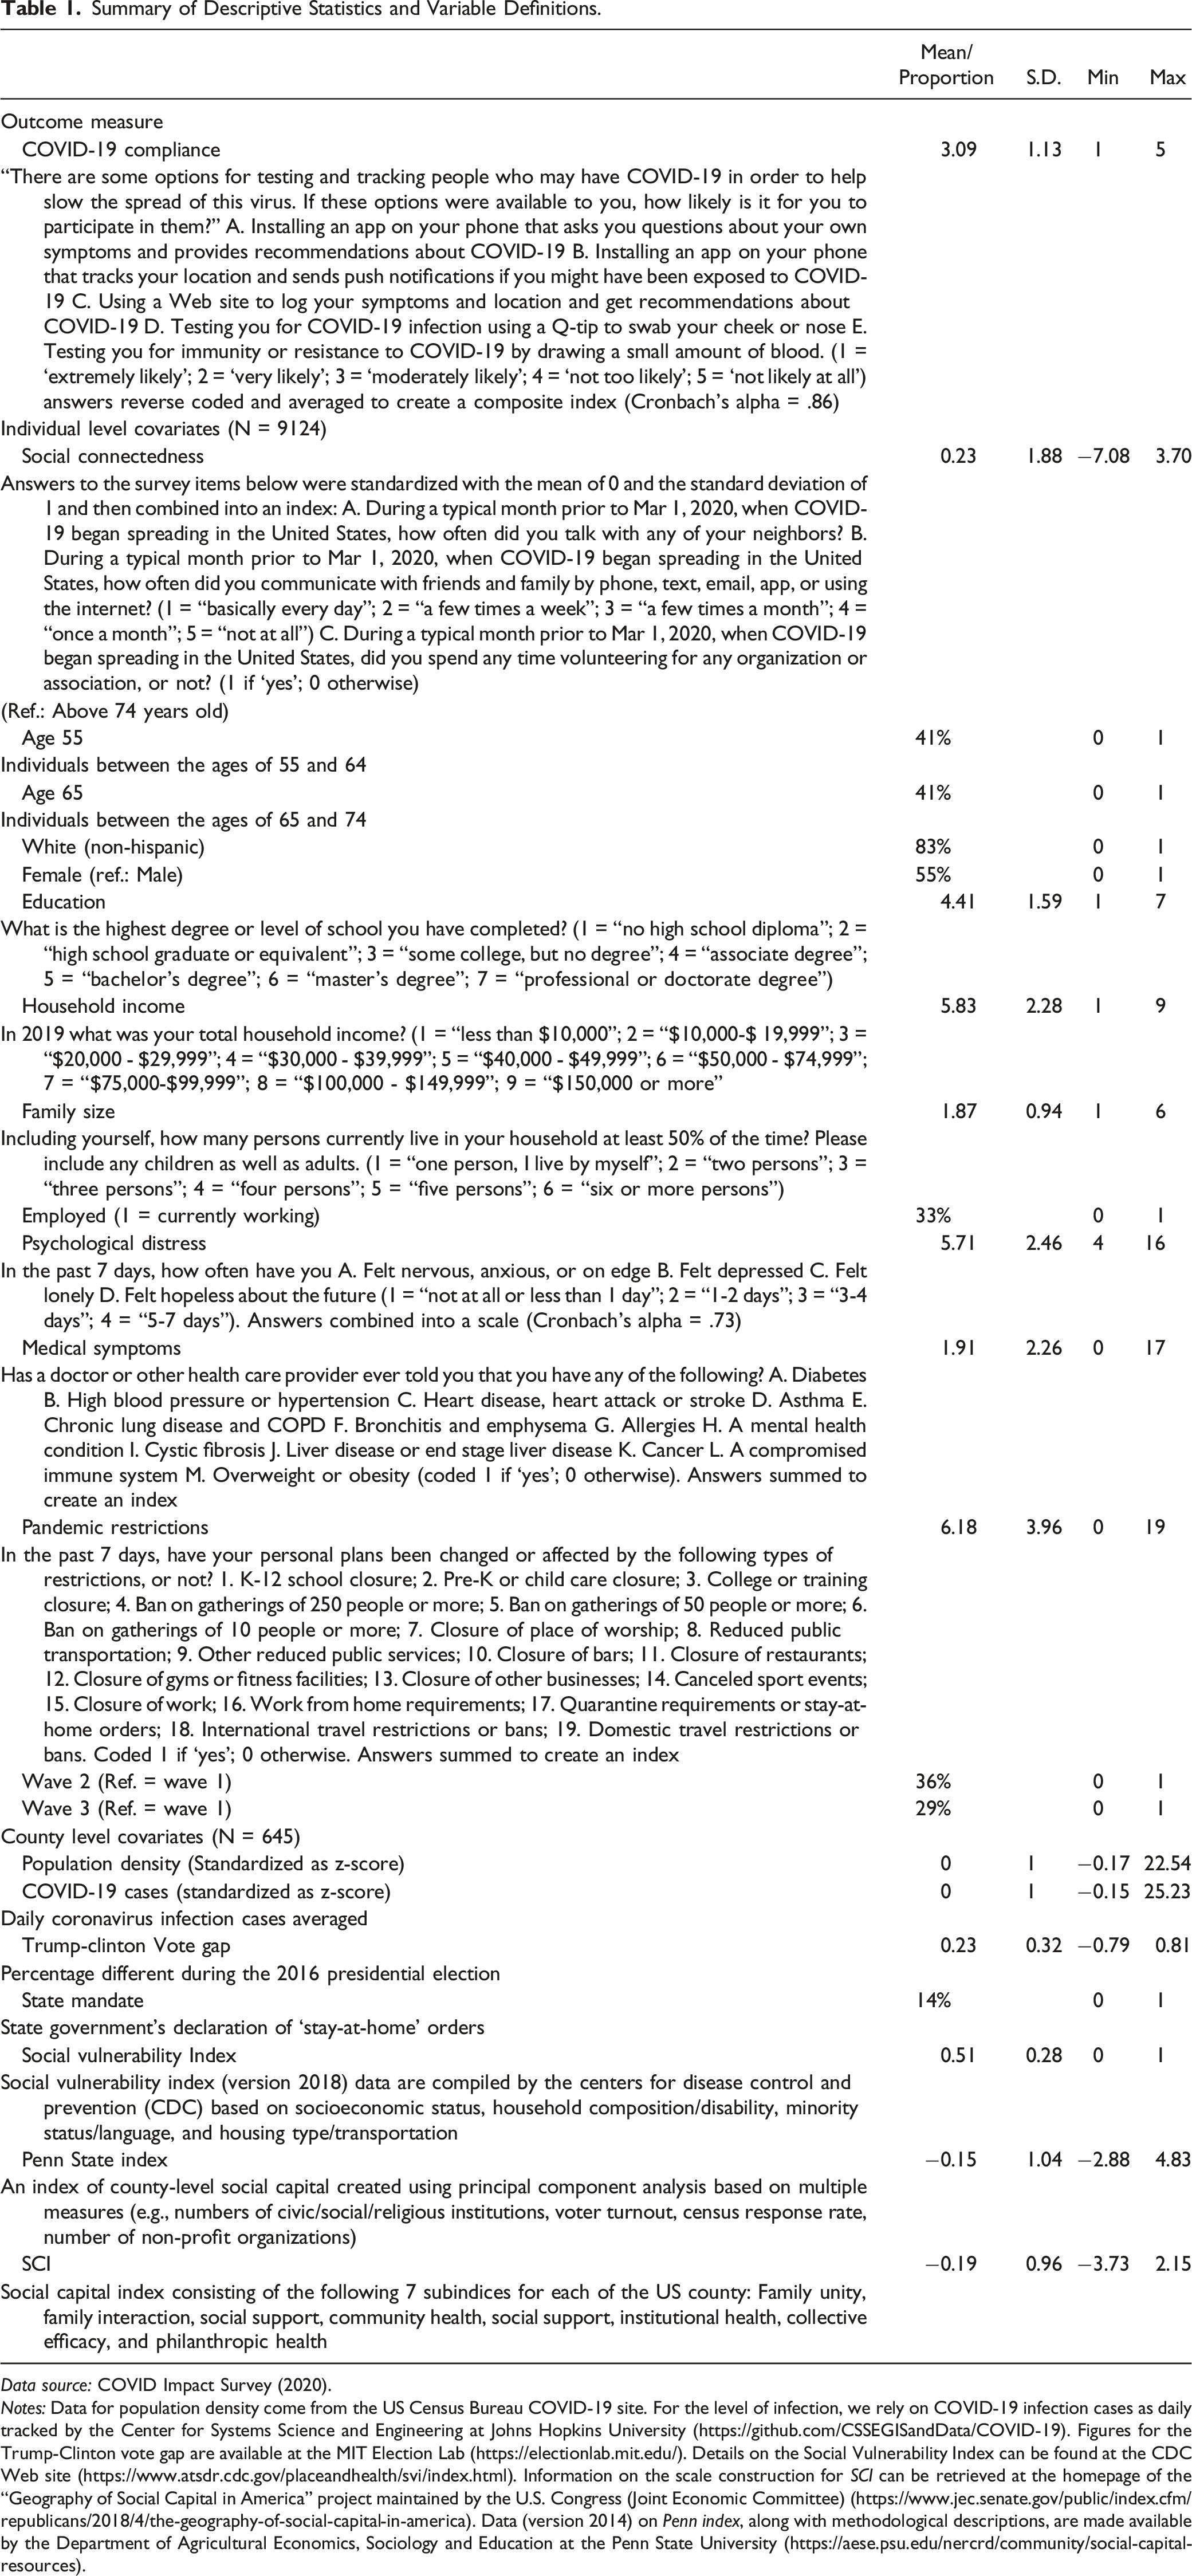
Data source: COVID Impact Survey (2020).
Notes: Data for population density come from the US Census Bureau COVID-19 site. For the level of infection, we rely on COVID-19 infection cases as daily tracked by the Center for Systems Science and Engineering at Johns Hopkins University (https://github.com/CSSEGISandData/COVID-19). Figures for the Trump-Clinton vote gap are available at the MIT Election Lab (https://electionlab.mit.edu/). Details on the Social Vulnerability Index can be found at the CDC Web site (https://www.atsdr.cdc.gov/placeandhealth/svi/index.html). Information on the scale construction for SCI can be retrieved at the homepage of the “Geography of Social Capital in America” project maintained by the U.S. Congress (Joint Economic Committee) (https://www.jec.senate.gov/public/index.cfm/republicans/2018/4/the-geography-of-social-capital-in-america). Data (version 2014) on Penn index, along with methodological descriptions, are made available by the Department of Agricultural Economics, Sociology and Education at the Penn State University (https://aese.psu.edu/nercrd/community/social-capital-resources).
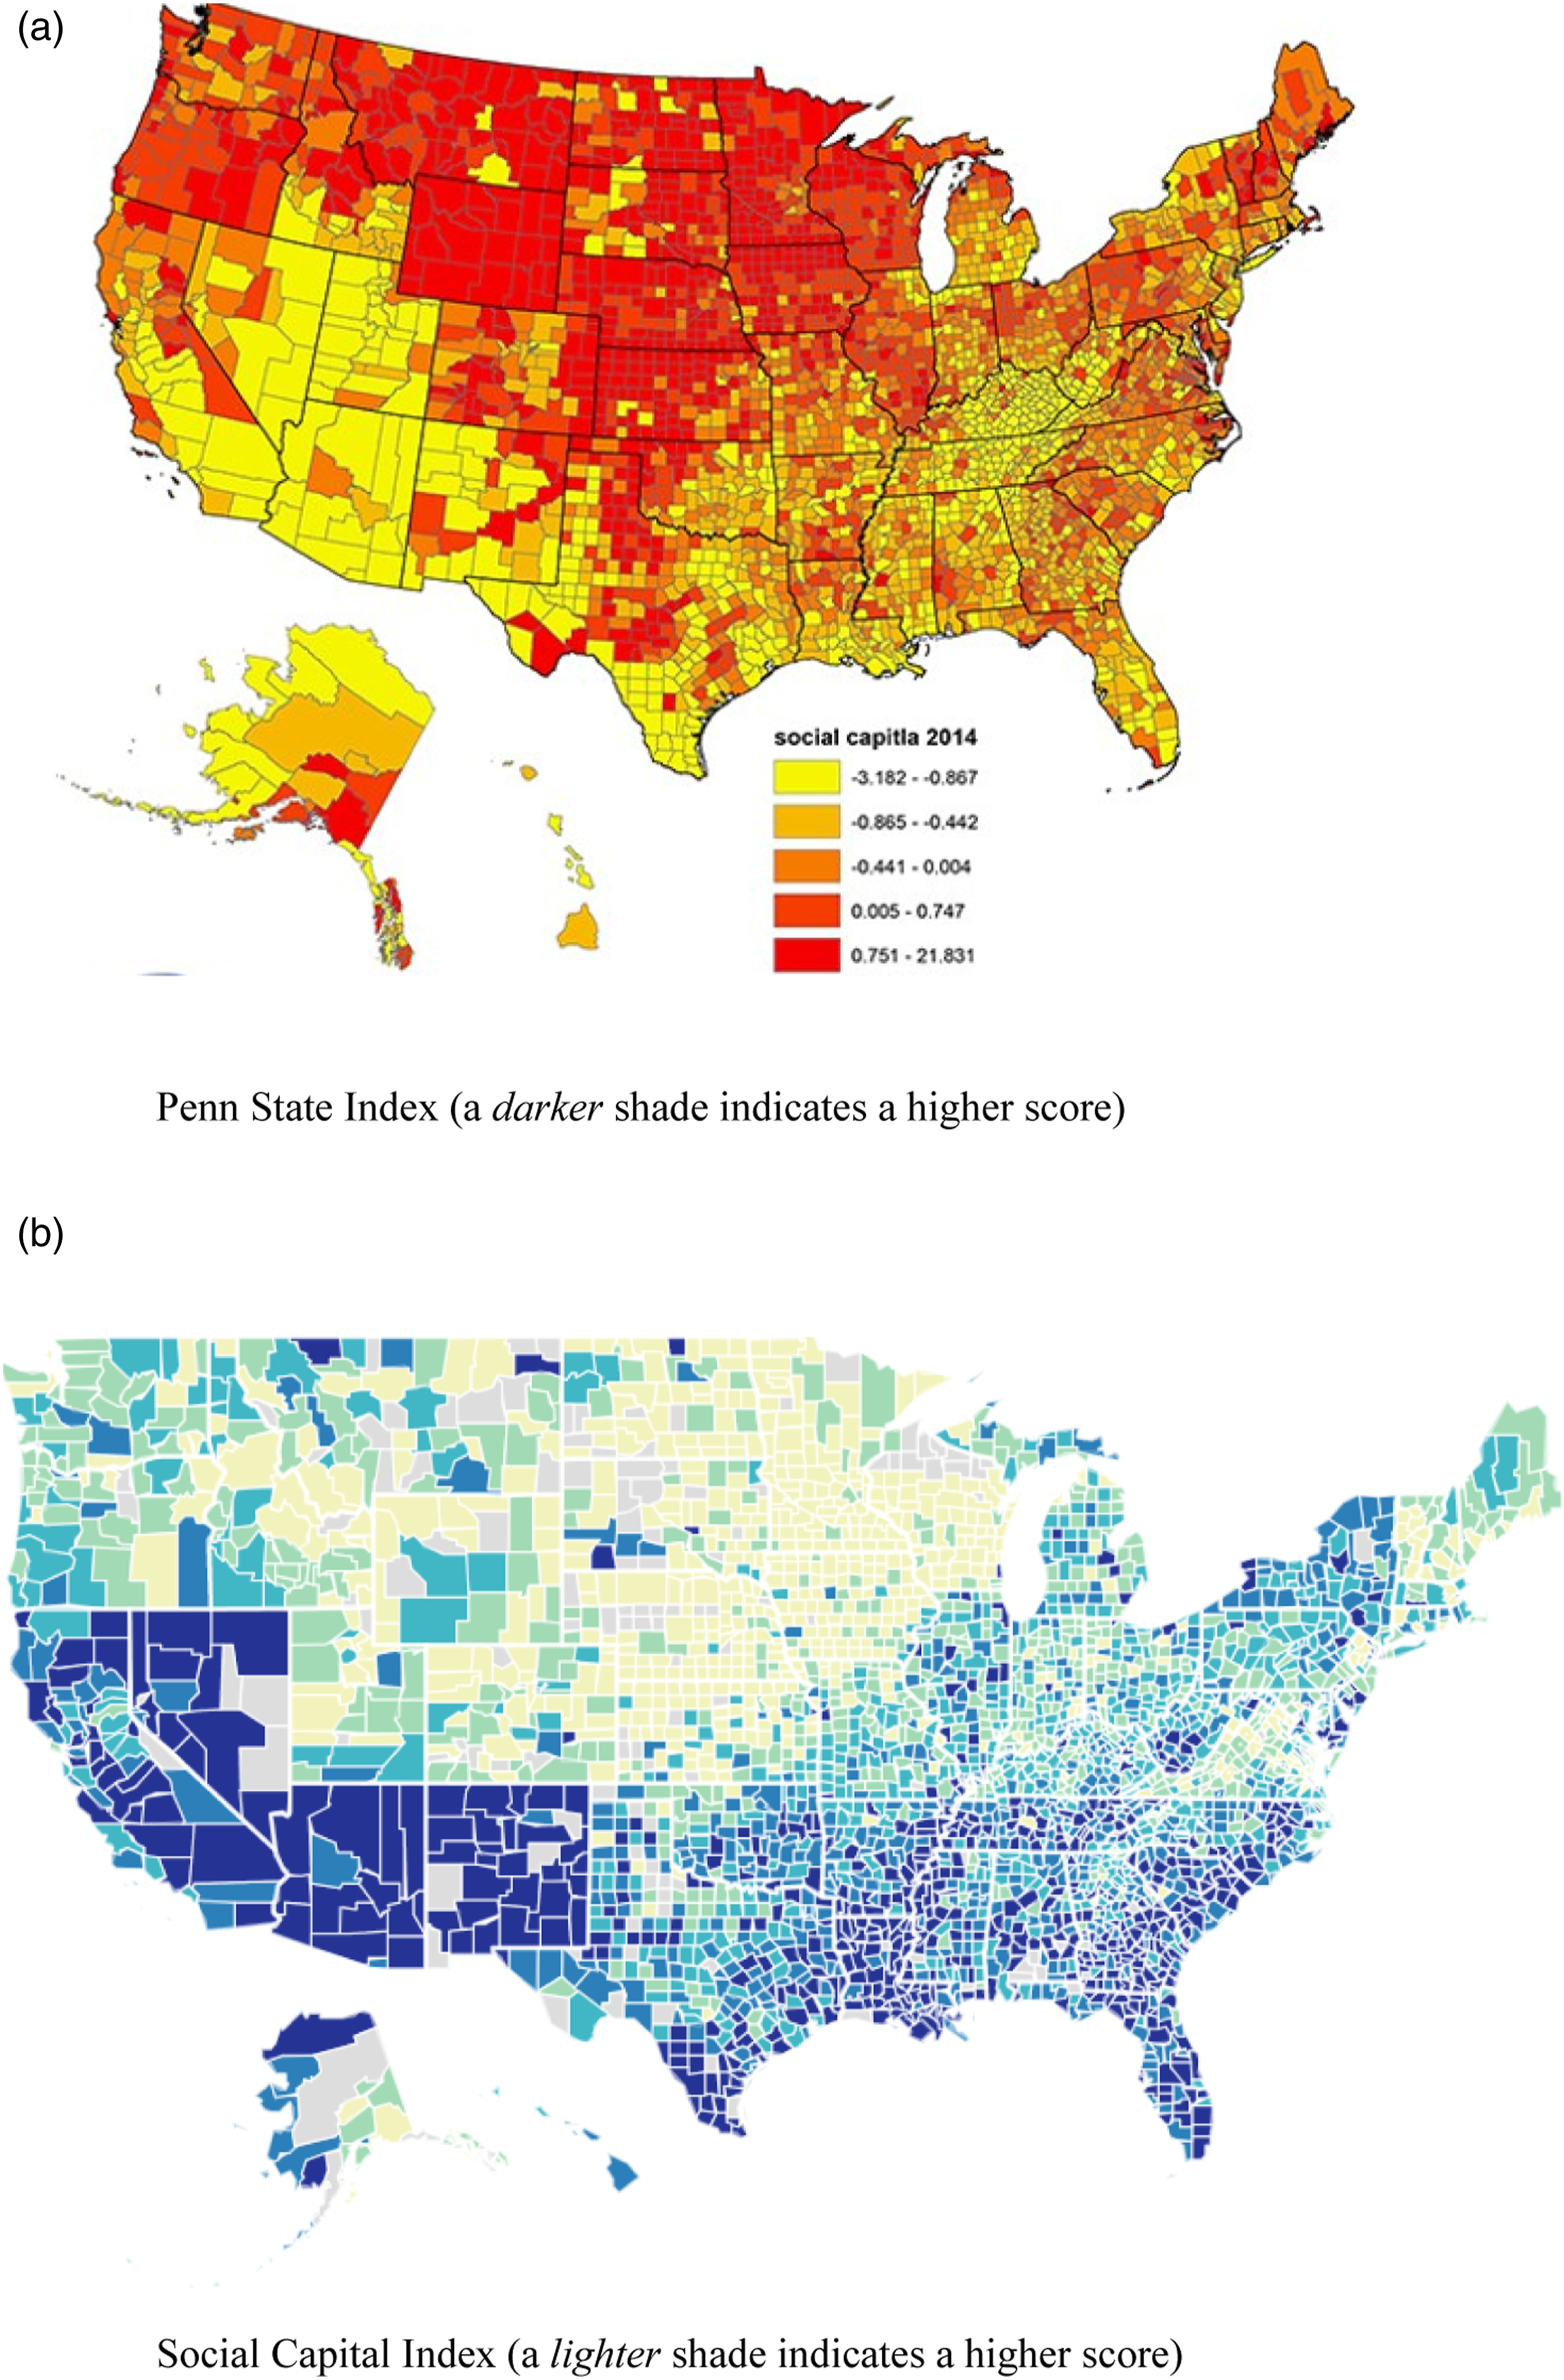
Distribution of community social capital across the U.S. counties. Panel A: Penn State Index (a darker shade indicates a higher score). Panel B: Social Capital Index (a lighter shade indicates a higher score).
Analytic Approach
Estimates from Multilevel Analysis Predicting COVID-19 Compliance among Older U.S. Adults.
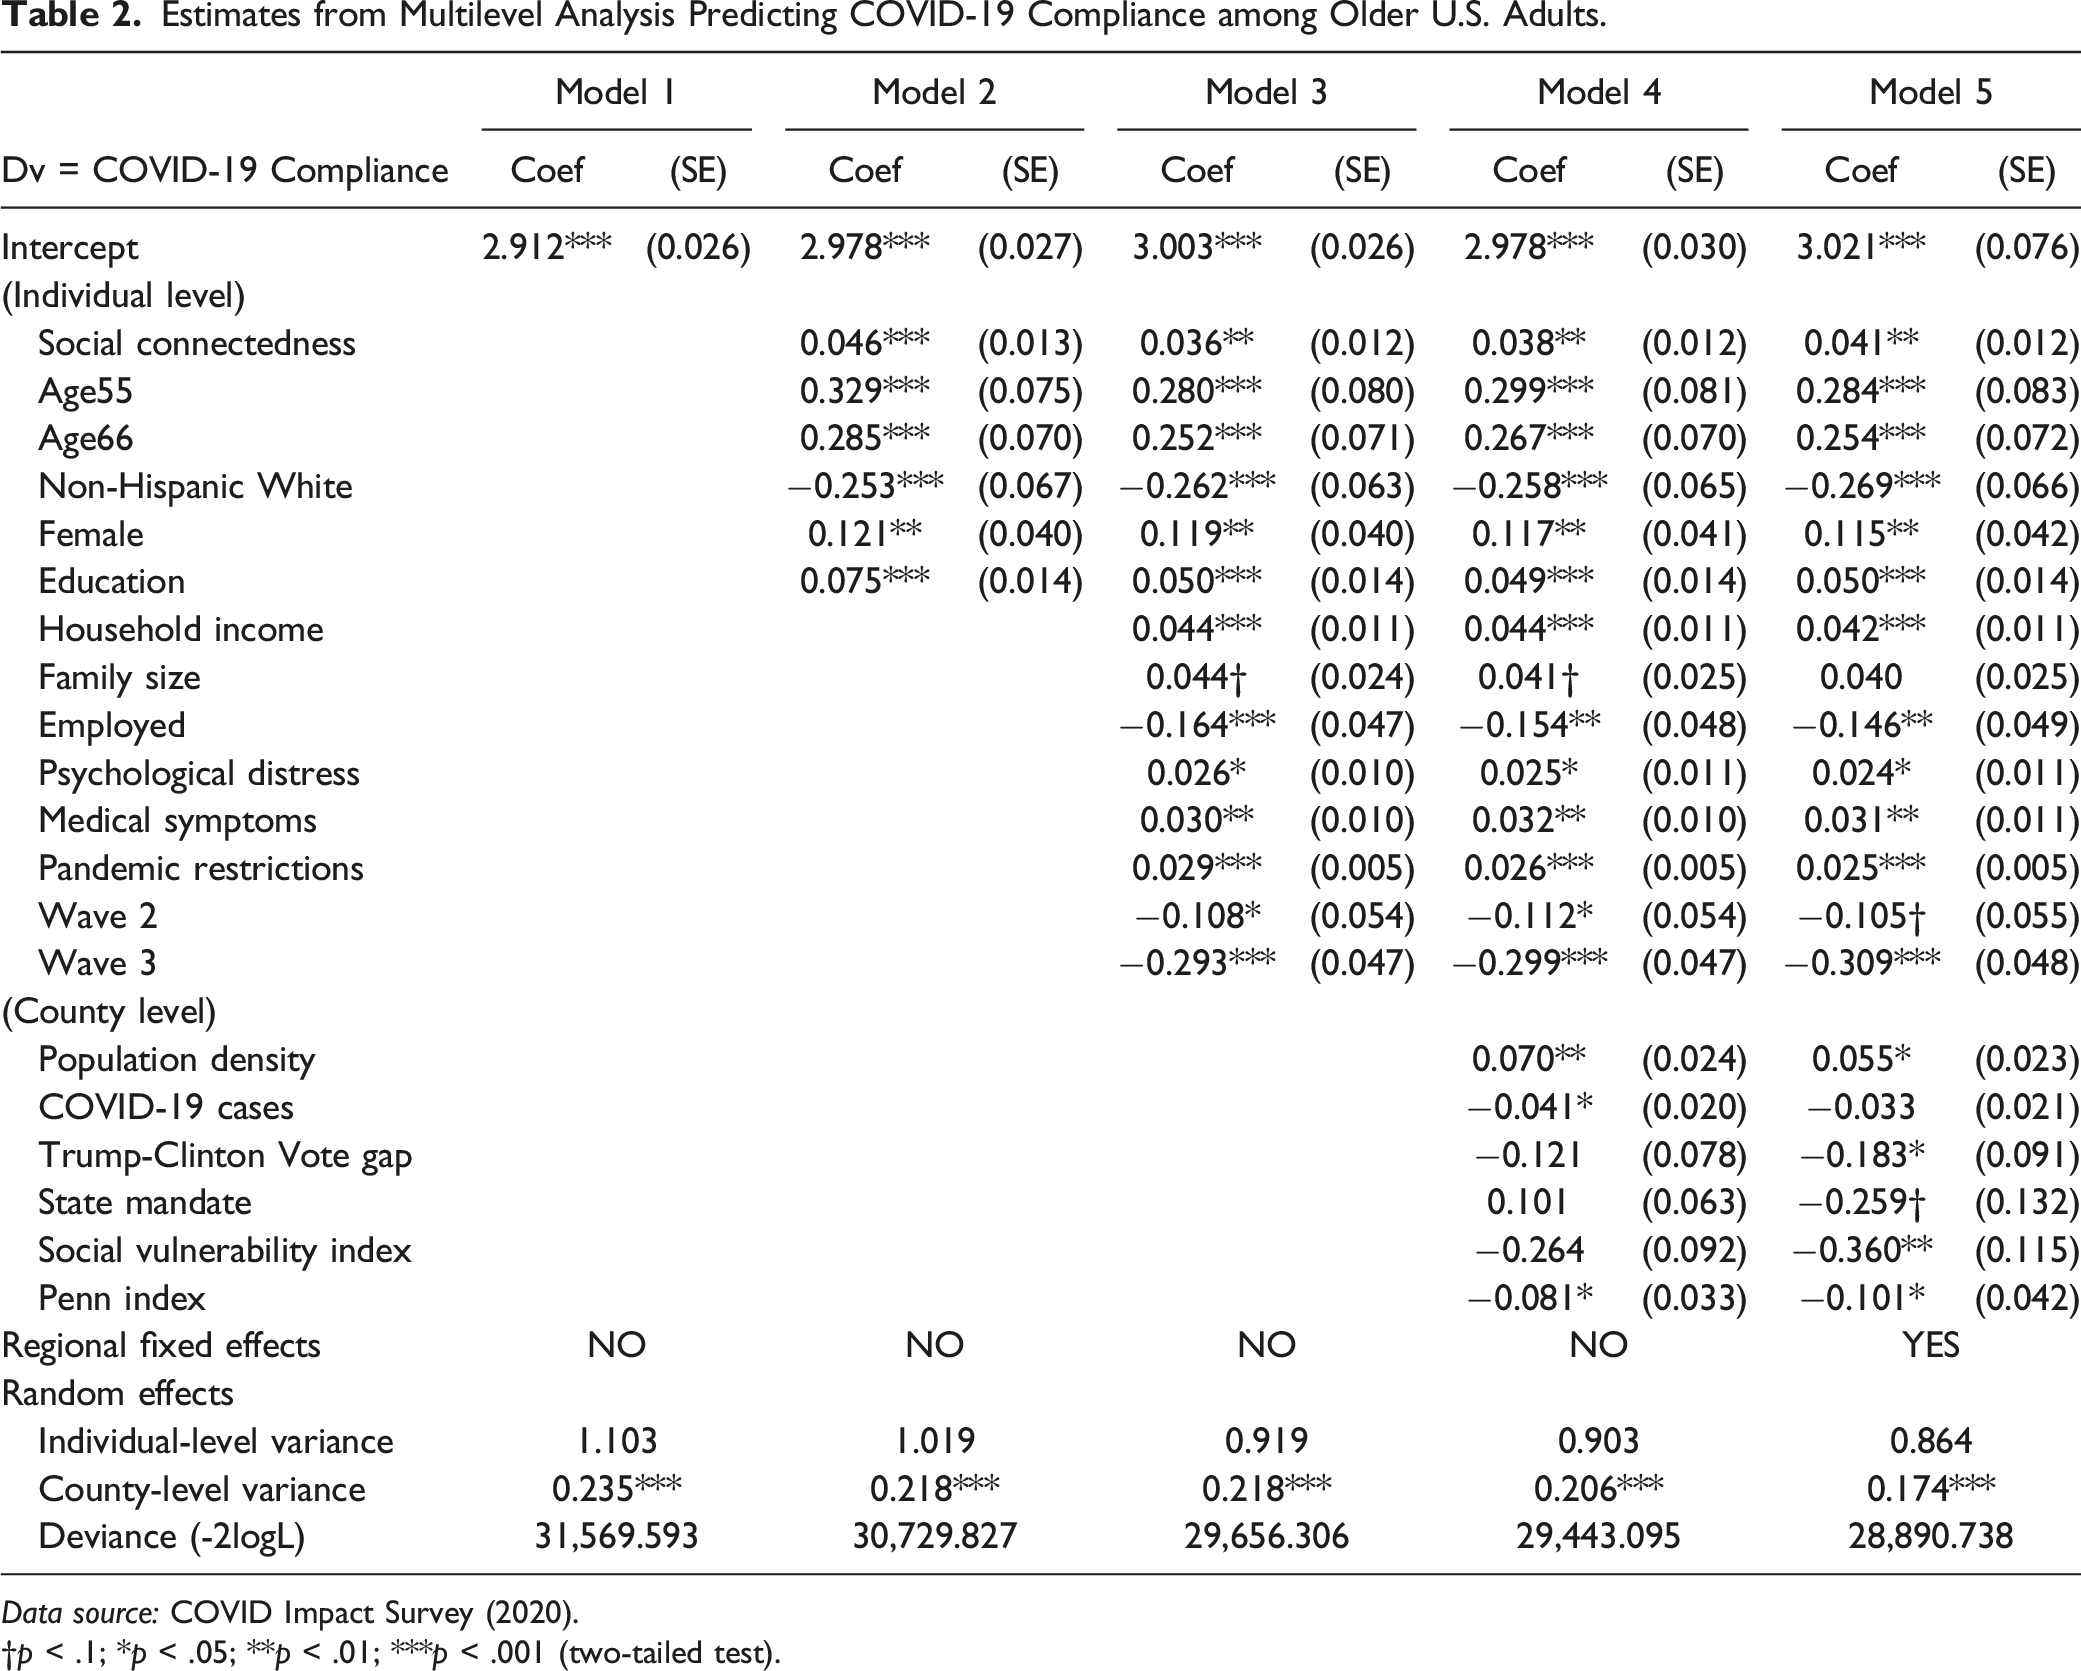
Data source: COVID Impact Survey (2020).
†p < .1; *p < .05; **p < .01; ***p < .001 (two-tailed test).
Within-Level and Cross-Level Interaction Effects between Social Connectedness and Moderators.
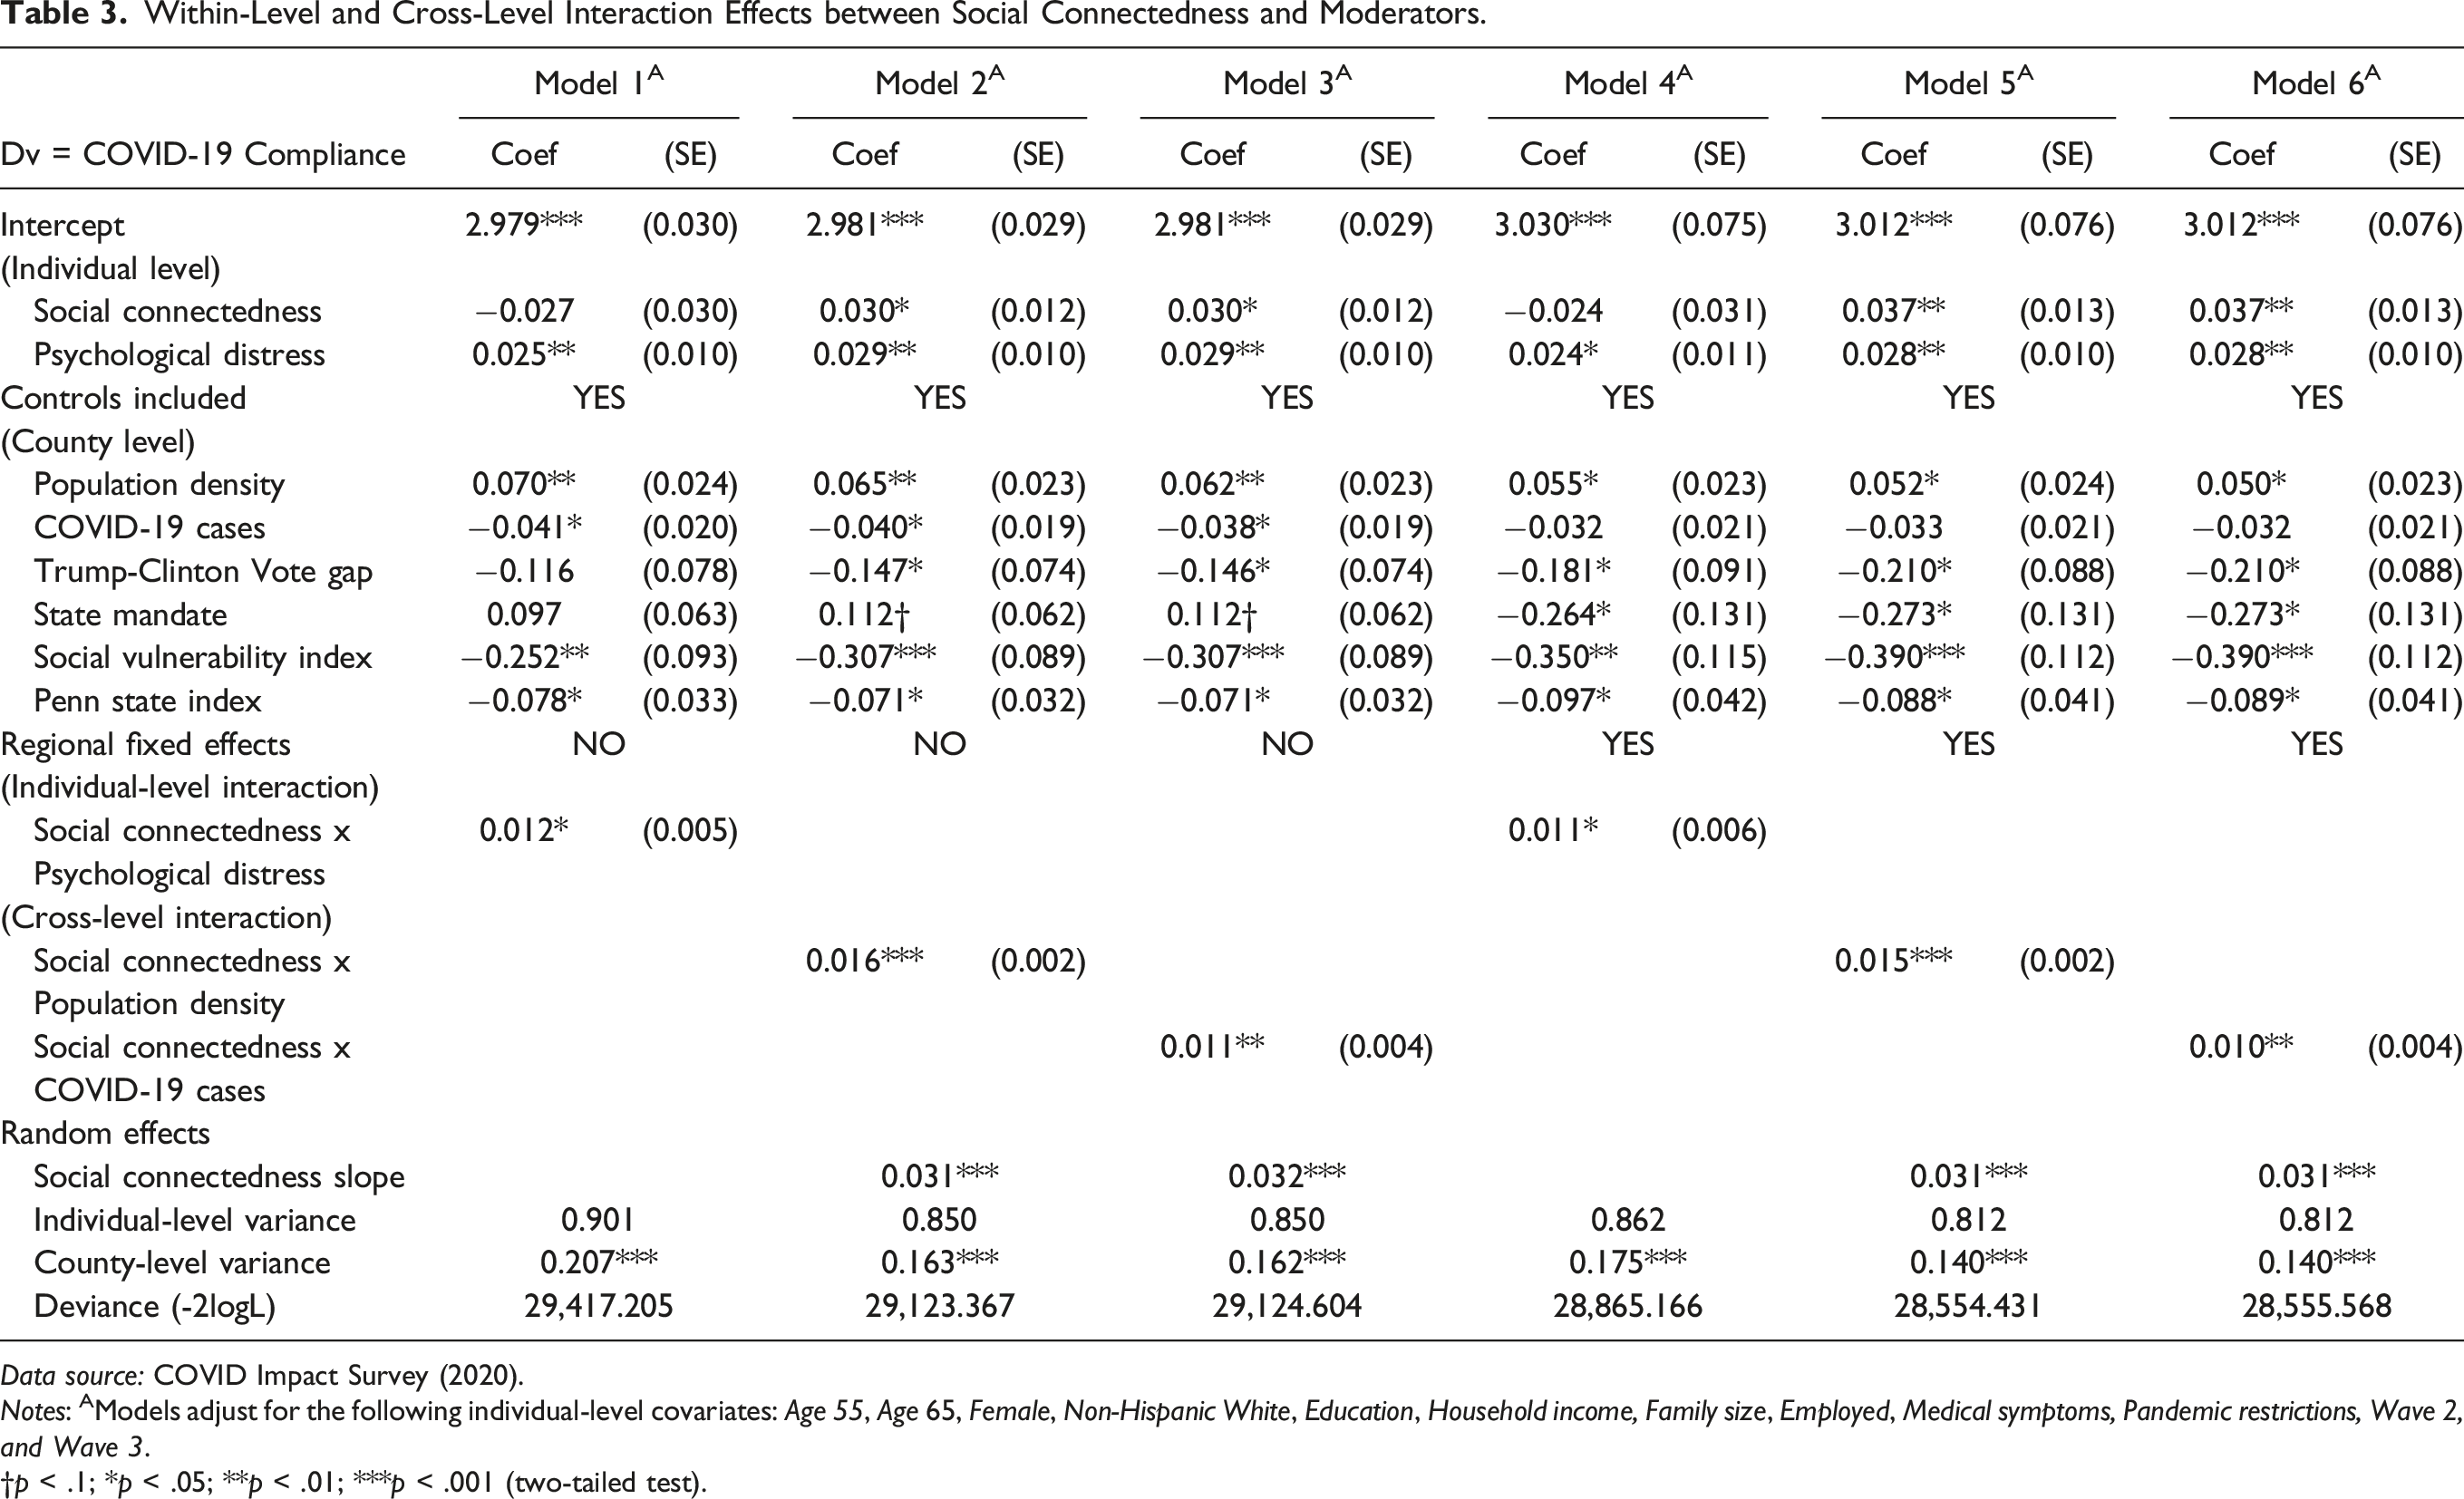
Data source: COVID Impact Survey (2020).
Notes: AModels adjust for the following individual-level covariates: Age 55, Age 65, Female, Non-Hispanic White, Education, Household income, Family size, Employed, Medical symptoms, Pandemic restrictions, Wave 2, and Wave 3.
†p < .1; *p < .05; **p < .01; ***p < .001 (two-tailed test).
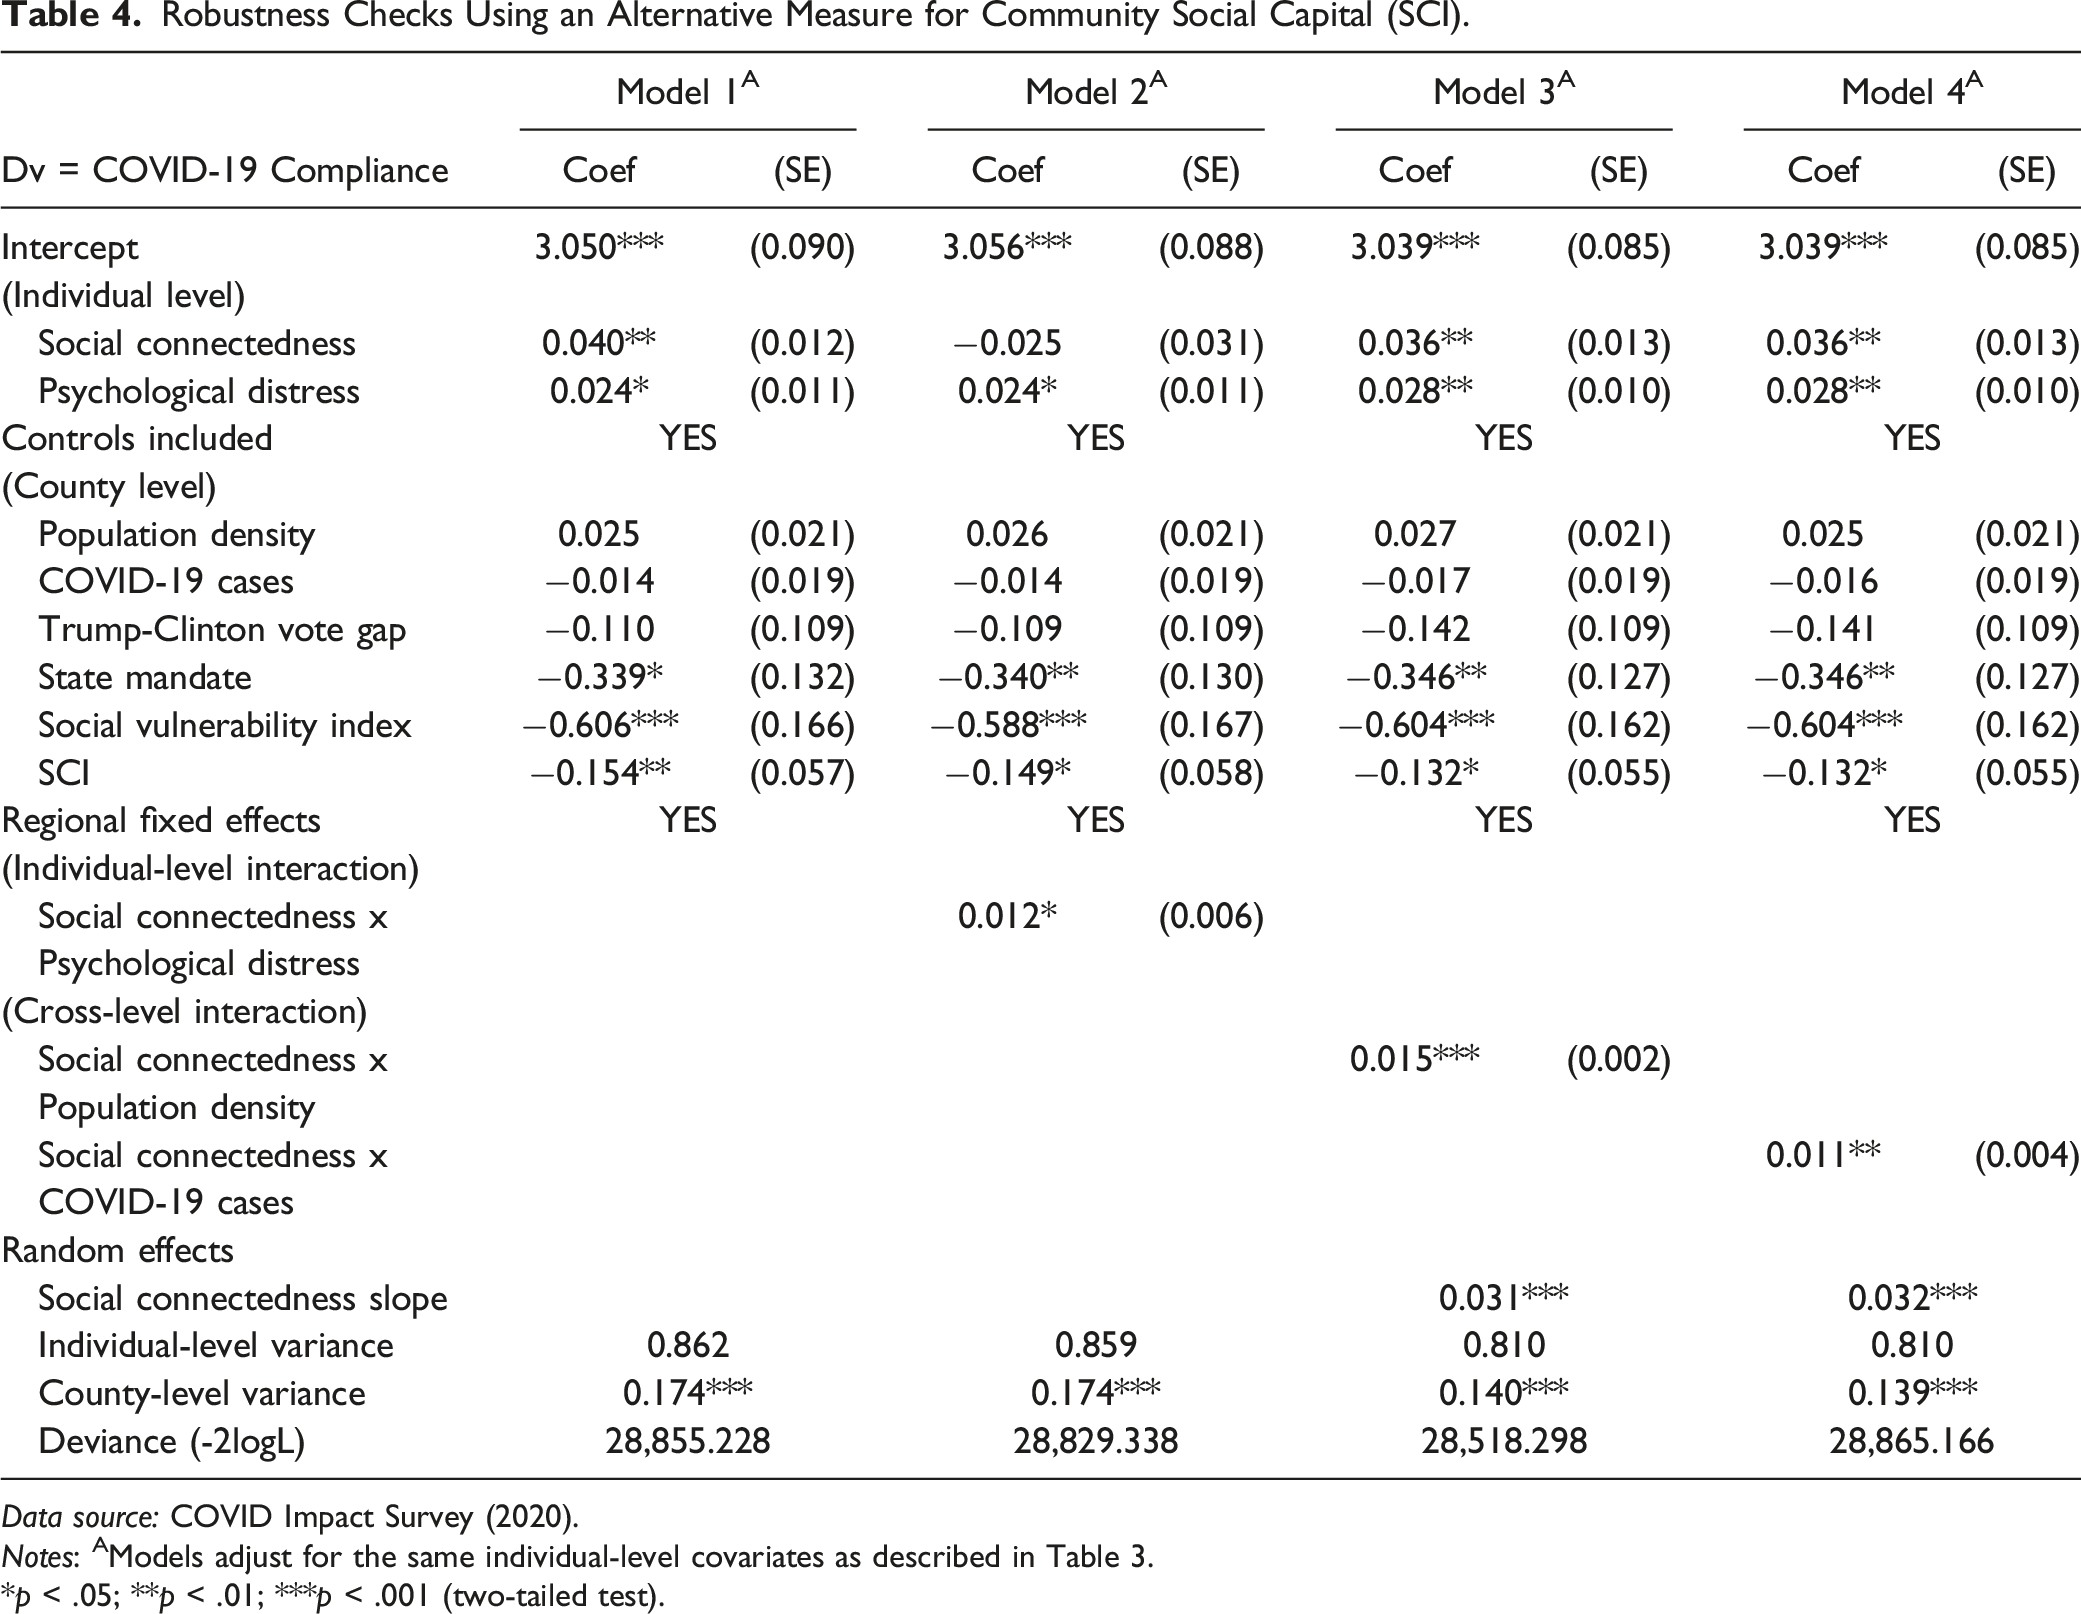
Robustness Checks Using an Alternative Measure for Community Social Capital (SCI).
Data source: COVID Impact Survey (2020).
Notes: AModels adjust for the same individual-level covariates as described in Table 3.
*p < .05; **p < .01; ***p < .001 (two-tailed test).
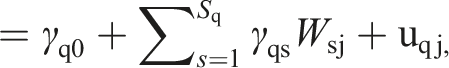
We fitted multilevel linear regression models using the latest version of HLM 8 (Raudenbush et al., 2019). Formally, at the individual level, we have the following equation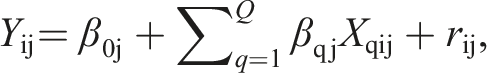

Results
According to the null or unconditional model (Model 1) in Table 2, the intraclass correlation is .173. That is, about 17.3% of the variance in the outcome variable, COVID-19 compliance, occurs between or across counties (τ = .235; df = 723; χ2 = 2090.16; p < 0.001). Having confirmed the validity of estimating multilevel models due to data clustering, we now proceed with the substantive findings as shown in Models 2 – 5 in Table 2. Initially, in view of potential posttreatment bias, Model 2 contains results from including our main predictor along with the ‘pre-treatment’ individual-level covariates only: age, gender, race, and education. As the coefficient for Social connectedness indicates, social capital is significantly positively related to the outcome (ß = .046, SE = .013, p < .001). This relationship, however, could be spurious due to additional confounding. To check it, we introduce all the individual-level controls, results of which are shown in Model 3.
Except for family size which is only marginally significant (p = .068), other controls are all related to the outcome below the conventional level of significance (p < .05). On average, older individuals, female participants, and ethnic minorities (vis-à-vis non-Hispanic whites) show greater willingness for compliance behavior, as do those with higher household income and educational attainment. To the contrary, the employed are less willing. There is also a significant time trend: older U.S. adults surveyed in the latter waves are less supportive of the government intervention plans to control the pandemic. Finally, preexisting medical symptoms and experienced COVID-19 restrictions are both positively related to the outcome. Also, Psychological distress, one of the hypothesized moderators (in
In an alternative analysis, to compare effect sizes, we replicated the findings (as shown in Appendix 1) by standardizing all non-dichotomous covariates as z-scores. According to the fully specified model (Model 3), one standard deviation-increase in Social connectedness is equivalent a corresponding increase of 0.075 (SE = .023, p < .001) in the outcome variable, which is quite substantial in comparison with two key covariates of compliance behavior in the literature, namely Medical symptoms (ß = 0.07, SE = 0.024, p < .01) and Psychological distress (ß = 0.059, SE = 0.027, p < .05). Its effect size is only slightly smaller than that for Education (ß = 0.079, SE = 0.023, p < .001), another well-recognized predictor in prior research.
In Model 4, for a more conservative estimate, we now include all county-level (L2) controls including Penn index, a proxy for the stock of community social capital measured across contextual units.
2
In other words, we are examining the role of social capital measured at the individual level, net of community social capital taken from an independent source of data, along with the Trump-Clinton vote gap, social vulnerability index, population density, state mandate, and level of coronavirus infection. The main finding is that even after additionally controlling for L2 covariates, the coefficient for Social connectedness remains largely unchanged (ß = .038, SE = .012, p < .01). In our final and fully specified model (Model 5), we incorporate fixed effects that adjust for all unobserved heterogeneity across the regional clusters. Inclusion of the dummy variables does not lower the effect size or the significance level for our main predictor (ß = .041, SE = .012, p < .01). Based on these results from multilevel models as reported in Table 2, we conclude that our main hypothesis (
To address our research questions, we proceed with the contents in Table 3. According to the parameter estimate for the interaction term (Social connectedness x Psychological distress), as shown in Model 1, the impact of our main predictor increases among individuals who are more psychologically distressed (ß = .012, SE = .005, p = .033). Models 2 and 3 contain results from running cross-level interactions. As the former indicates, the interaction term (Social connectedness x Population density) is similarly positive and significant (ß = .016, SE = .002, p < .001). That is, the magnitude of the focal relationship grows in more densely populated counties. As Model 3 reveals, a similar interaction emerges between Social connectedness and COVID-19 cases (ß = .011, SE = .004, p = .002): the strength of the relationship between social connectedness and compliance attitudes is greater in counties with higher levels of infection. To check the sensitivity of these cross-level findings, we add county fixed effects in Models 4 – 6. As the results show, including them does not substantively alter what we reported in the earlier three models in Table 3. In other words, conditioning on covariates at both individual and regional levels of analysis, the three (within-as well as cross-level) interaction effects hold. Based on these findings, we conclude that three moderators—psychological distress, population density, and level of infection—all strengthen the focal association between social connectedness and the outcome as stated in the main hypothesis.
Lastly, we conducted a set of robustness tests by replacing P. index with SCI as an alternative proxy for community social capital, the results of which are summarized in Table 4. The bivariate correlation between the two county-level measures is 0.63 (p < .01). While they purport to gauge the same concept (i.e., social capital), they diverge in terms of measurement. Among others, Penn index uses administrative data on voter turnout, Census response rate, and numbers of political establishments and recreational facilities—none of which is used in measuring SCI. As such, the two indices represent related yet distinct approaches to measuring social capital. To confirm the validity of our findings, we reran our key models using SCI instead of P. index. Model one in Table 4 is a replication of Model 5 in Table 2. The main result is consistent: in support of
Discussion
Since its initial outbreak in late 2019, COVID-19 has developed into a full-blown pandemic wreaking havoc across the world. Especially prior to the availability of vaccines, non-pharmacological protective (i.e., social distancing) measures played a crucial role in combatting the transmission of the disease. Undoubtedly, governments everywhere have sought to implement various anti-pandemic guidelines and restrictions, yet with varying success. As noted, adherence to the COVID-19 preventive measures inherently entails a social dilemma (Cato et al., 2020; Van Lange et al., 2013), a situation where rational (selfish) individual interests are at odds with the demands of collective well-being. How can public health and safety be preserved if societal members choose not to contribute to its provision but simply free ride on the efforts of others? This social dilemma has motivated interdisciplinary research on why some people are more cooperative, or prosocial, than others in the pandemic context (Frounfelker et al., 2021; Hayashi et al., 2022; Moran et al., 2021; Wright et al., 2021).
Our research advances the scholarship by shedding light on an explanatory concept that has not been systematically examined: social connectedness or individual-level social capital (Ehsan et al., 2019). In the present study, we applied this theoretical perspective in understanding older Americans’ willingness to support or accept anti-pandemic government interventions (to be tracked, tested, etc.) even at the cost of partially compromising personal privacy. To discredit the alternative argument that compliance is a product of concern for one’s own well-being, our models adjusted for a host of confounders including psychological distress and preexisting health conditions, among others. Using multilevel modeling, we also incorporated a set of contextual covariates (e.g., Trump-Clinton vote gap, coronavirus infection, structural vulnerability) that might confound the focal relationship. Analyses based on alternative measures of community social capital offer assurance that our findings are not a mere statistical artifact but highlight a valid set of direct and interactive findings among individual-level social capital, risk factors (moderators), and compliance attitudes.
We operationalized the concept of social connectedness, our main predictor, in terms of interaction with neighbors, communication with friends and family, and civic involvement (volunteering) prior to the pandemic—allowing us to establish proper temporal ordering. And we hypothesized a dual (internal and external) mechanism underlying its association with the outcome measure, a composite index of items measuring people’s willingness to comply with COVID-19-related government interventions. Specifically, we reasoned that people who are more socially connected are internally motivated to contribute to collective efforts in containing the virus (providing public health safety). That is, ceteris paribus, a person who interacted more often with neighbors, communicated more frequently with family and friends, and participated in volunteering activities would care more about the welfare of others and, as a result, be more willing to support the government in its fight against COVID-19. Similarly, we further conjectured that the same (i.e., socially better connected) person may experience greater external influence to be more prosocial in complying with health protective guidelines and mandates. That is, s/he would be more likely to receive suggestions, encouragements, and even normative pressures from socially significant others to help overcome a public health crisis created by the pandemic—even if it means downloading an app on their phone to be daily monitored and be tested invasively by having their blood drawn.
Our analysis also produced three distinct interaction effects. The theoretical rationale for doing so was that the three moderators (psychological distress, population density, and infected cases) are risk factors. More specifically, the first relates to subjective or perceived vulnerability, while the latter two measure aggregate-level (county-level) objective threat. As such, we asked whether in the context of greater vulnerability/threat, the magnitude of the focal relationship might shift. Across different model specifications, we found this to be the case. First, the positive association between social connectedness and compliance attitudes became stronger among subjects who are psychologically distressed (i.e., more vulnerable). Second, its magnitude was stronger in U.S. counties that are more densely populated (i.e., under greater threat). And third, a similar conclusion was drawn with respect to areas hit harder by the pandemic in terms of the number of daily infections (i.e., under greater threat). The three modifiers can be seen as “stressors” that worsen worries and anxieties stemming from the pandemic. As such, people who are more distressed and live in densely populated areas with higher rates of infection would be, all else equal, more willing to comply with government interventions to stop the spread of COVID-19. Hence, what we find empirically is a compounding effect: these risk factors, or stressors, independently strengthen the connection between pre-pandemic social capital and post-pandemic compliance attitudes.
Our study has some data limitations that can suggest potential avenues for future research. As is the case with all microlevel surveys, the statistical results discussed above are based on cross-sectional data. Although we controlled for various confounders at individual and county levels, given the nature of the data analyzed, it is not possible to conclusively establish causality. In other words, though unlikely, we cannot rule out the possibility of reverse causation: that willingness to comply with the anti-pandemic measures could have shaped how people responded to questions about their earlier interpersonal relations and civic participation. Relatedly, there may be a tendency for study participants to have exaggerated the level of social involvement prior to the pandemic, even though we included measures for medical symptoms and pandemic restrictions that would covary with subjective assessment of social capital. Despite the fact that using retrospective survey items was unavoidable in operationalizing the main predictor, our analysis nevertheless could have benefitted from more objective sources of data. As the causal direction remains moot concerning our main argument, findings shown above should be interpreted as largely correlational in nature. Additional sources of unobserved heterogeneity remain in our models. For example, COVID Impact Survey (2020) does not contain information on the participants’ scientific literacy or trust in government, both of which have been linked with social distancing as well as vaccination intentions and behaviors.
Another omitted variable bias may arise from the fact that we could not control for such factors as religiosity and political ideology at the respondent level. Religiously and politically conservative individuals (e.g., Trump supporters) may think and behave very differently toward health protective protocols compared to their more liberal counterparts (e.g., Trump critics). Also, factors such as personality types and proclivity to trust may pose additional sources of unobserved, along with unobservable, heterogeneity. Consequently, we caution readers from inferring that fostering social capital may necessarily, or in and of itself, result in greater cooperation in the form of COVID-19 compliance behavior. More causally valid findings are required to draw such a conclusion. In our data, the higher-level unit of analysis was county. Access to geocoded data at a granular level (e.g., Census tract, commuting zone, zip code) would allow for more nuanced analyses, although unfortunately data on community social capital as used in the present study (i.e., Penn State Index and Social Capital Index) are unavailable at a level smaller than the county.
Lastly, our findings have limited external validity since the data we analyzed are regionally representative of the U.S. population. Despite these aforementioned methodological issues, to our knowledge, the present study is one of the very few that measures social connectedness at the respondent, not ecological or aggregate, level to probe its association with COVID-19 compliance attitudes while adjusting for community-level social capital. To eliminate the alternative argument that our findings are driven by self-interests and not concern for collective well-being, our models adjusted for respondent-level measures for psychological state, health condition, and experienced pandemic-induced restrictions. In doing so, we contributed to the literature by underscoring a highly relevant, yet relatively neglected, explanatory concept (i.e., social capital) and related mechanisms. Research using longitudinal data that can address the above-mentioned limitations would further improve our understanding of why and when individuals are willing to forgo short-term private interests and contribute to resolving the pandemic-induced social dilemma.
Footnotes
Author Contribution
Authors KWC and HHK contributed to conception and design of the study. Author HHK procured the data. Authors KWC and HHK contributed to data analysis, interpretation of study findings, and writing the manuscript.
Declaration of Conflicting Interests
The author(s) declared no potential conflicts of interest with respect to the research, authorship, and/or publication of this article.
Funding
The author(s) received no financial support for the research, authorship, and/or publication of this article.
Notes
Appendix
Data source: COVID Impact Survey (2020). Note: Standard errors in parentheses. All non-dichotomous variables at the individual level have been standardized (converted to z-scores). *p < .05; **p < .01; ***p < .001.
Model 1 (Based on Model 3 in Table 2)
Model 2 (Based on Model 4 in Table 2)
Model 3 (Based on Model 5 in Table 2)
Coef
(SE)
Coef
(SE)
Coef
(SE)
Constant
(Individual-level)
Social connectedness
0.075***
0.023
0.075***
0.023
0.075***
0.023
Age 55
0.279***
0.083
0.278***
0.083
0.279***
0.083
Age 66
0.251***
0.071
0.252***
0.071
0.253***
0.072
Non-Hispanic White
−0.276***
0.064
−0.272***
0.066
−0.272***
0.066
Female
0.115**
0.042
0.117**
0.042
0.117
0.042
Education
0.080***
0.023
0.078***
0.023
0.079***
0.023
Household income
0.099***
0.026
0.094***
0.026
0.093***
0.026
Family size
0.037
0.024
0.038
0.024
0.038
0.023
Employed
−0.144**
0.049
−0.143**
0.049
−0.142**
0.049
Psychological distress
0.061*
0.027
0.059*
0.027
0.059*
0.027
Medical symptoms
0.069**
0.024
0.070**
0.024
0.070**
0.024
Pandemic restrictions
0.101***
0.020
0.099***
0.020
0.099***
0.020
Wave 2
−0.107
0.055
−0.108
0.055
−0.108
0.050
Wave 3
−0.311***
0.048
−0.312***
0.048
−0.314***
0.048
(County-level)
Population density
0.058**
0.020
0.054*
0.023
COVID-19 cases
−0.037*
0.017
−0.033
0.021
Trump-Clinton vote gap
−0.181*
0.077
−0.189*
0.090
State mandate
0.094
0.065
−0.259
0.134
Social vulnerability index
−0.317***
0.094
−0.361**
0.114
Penn index
−0.076*
0.034
−0.095*
0.042
Regional dummies
No
No
Yes
L2 variance (τ)
0.168***
0.153***
0.146***
L1 variance (σ2)
1.074
1.074
1.074
Deviance (-2LL)
25,405.747
25,382.593
25,369.493