
Abstract
A range of research, including analyses of quantitative data, has demonstrated the existence of inequalities for women and people of colour in the screen sector’s workforce. There has been less data collection in relation to class inequalities, and therefore less analysis of this aspect of the workforce. This paper considers this historic absence of data relating to class and considers a new source of data. Analysis of applicants to the British Film Institute’s Film Fund provides new insight into class inequalities and how they intersect with other demographic categories. This analysis demonstrates the classed patterns of application and success in relation to funding for screen industries in the UK, with the dominance of those from middle class origins throughout each stage of funding. Intersectional analysis of these inequalities shows which groups, at the intersection of class, race and gender, are more likely to receive funding. Drawing on Nwonka’s groundbreaking work on race and data in the screen sector, the paper concludes by highlighting the limitations of solely ‘data-driven’ responses to screen- and creative-sector inequalities, and the need for broader considerations of the structural factors in play.
Introduction
Questions of inequality in the screen sector have become increasingly important to academic, policy and public discourses. This importance has partially been driven by a range of scandals, and social movements seeking justice and equitable treatment such as #MeToo and #BlackLivesMatter. It has also been driven by the particularly ‘public’ demonstration of inequalities, such as the absence of women and people of colour as nominees and winners of prominent industry awards, for example #OscarsSoWhite. Despite the American focus of much activity around these prominent campaigns, these issues stretch beyond Hollywood, as various research projects focussed on national film industries have demonstrated (e.g. De Beukelaer and Spence, 2018; Smith et al., 2023; Steedman, 2023).
Just as research has intervened in these public and industry discourses, a wealth of academic work has demonstrated the longstanding and deeply embedded nature of inequalities in the screen sector. Research has shown the types of discrimination that women and people of colour face when they attempt to get into, and get on in, all parts of the screen industries. Analysis of quantitative data pertaining to gender and racial inequalities in the screen sector have shown that there are exclusions, discrimination and inequality in screenwriting, directing, producing and acting, as well as ‘below the line’ roles, and access to finance. Moreover, even where films are produced by diverse teams, or with diverse themes, they may receive less support (or even outright hostility) from distributors and marketing teams.
Class inequality in the screen industry has not been subject to the same level of quantitative analysis as race and gender. This comparatively lower level of quantitative analysis can be set against the rich interest in class in film and television studies (Deery and Press, 2017), exploring the history of the industry and histories of genres. Indeed, there is particular depth in British research on this issue (e.g. Forrest and Johnson, 2017; Minor, 2023; Skeggs and Wood, 2011; Williams, 2023; Wood and Kay, 2021), and the issue of social class has also received prominent media (e.g. Bakare, 2024) and policy (DCMS Select Committee, 2024) concern in recent periods.
This lower level of quantitative analysis of class has partially been driven by issues of data availability. This is where this paper seeks to make a key contribution. Since 2014, researchers have had access to high quality, nationally representative, data on the class backgrounds of workers across the UK as a result of the addition of questions on the topic of class to the Office for National Statistics’ (ONS) UK Labour Force Survey (LFS). This has been used to understand issues of class inequality in the creative sector generally (O’Brien et al., 2016; Brook et al., 2020; Oakley et al., 2017), and specific subsectors such as journalism (Spilsbury, 2023). Carey et al. (2021) used class data from the LFS to produce information on the overall picture of the screen workforce, but this data did not enable a ‘deep dive’ into specific roles or a more detailed consideration of specific career stages.
In light of these limitations, this paper presents, for the first time, an analysis of applications to and awards by a key funding stream for the UK film industry. It uses data from the British Film Institute (BFI)’s Film Fund to demonstrate classed patterns of application and access, highlighting the severe class inequalities at all stages of the film industry. The paper also adopts an intersectional approach to class, highlighting how class inequalities interact with other characteristics, and cannot be understood in isolation from them. Drawing on Nwonka’s (2020, 2021a) work on BFI data, the paper concludes by highlighting the critique of responses to screen- and creative-sector inequalities that are solely focussed on data analysis.
Diversity policy in the screen sector: The great moving nowhere show?
Inequalities in the creative industries are now a well understood problem. Academic research has long shown that cultural and creative sectors are sites of precarious working conditions, favouring those already in positions of relative privilege (e.g. Banks and Hesmondhalgh, 2009; Gill and Pratt, 2008; McRobbie, 2002). The screen sector reflects these wider conditions. Labour in the film and television industries has been the subject of extensive research, almost all of which has offered a critical perspective on working conditions, career trajectories and industry inequalities.
Quantitative data has been important to public and industry, as well as academic, discussions. Most recently, the Annenberg Inclusion Initiative (Smith et al., 2023) has shown a range of on and off screen inequalities in Hollywood films; Verhoeven and associated coauthors (Loist et al., 2024; Verhoeven et al., 2020) have identified how networks in global screen production and distribution underpin the exclusion of women; Cobb, Wreyford and colleagues (Cobb, 2020; Wreyford et al., 2019; Wreyford and Cobb, 2017) have demonstrated gendered inequalities, in British film; and Nwonka (2021a, 2021b) has examined how racial inequalities play out in government support for the British film industry.
The latter two research examples were developed against the backdrop of institutional commitments to greater industry diversity (e.g. Nwonka and Malik, 2021: 14). Indeed, the post-2000 period saw an increased emphasis by relevant sector bodies in the UK on the importance of tackling issues of inequality (e.g. Nwonka, 2020, 2021a, 2021b; Randle et al., 2015). Despite this, a lack of meaningful change also characterises this period (Newsinger et al., 2024). Whilst data availability may have somewhat improved from its poor earlier state (Bhavnani., 2007, Creative Diversity Network, 2023), the patterns revealed by this data show continued inequalities (Nwonka, 2021a) and progress from key policy organisations has continued to be relatively slow to develop, with Nwonka (2020) noting that ‘as late as 2018 neither BBC Films nor Film 4 – the UK’s other major public film-funding body – had specific diversity guidelines’ (p. 38).
As recently highlighted by Nwonka and Malik (2021: 19) race and ethnicity, and sex and gender remain the most researched issues in relation to workforce diversity. This is, at least in part, driven by the data availability and access issues noted above (cf. Creative Diversity Network, 2023). To take one example, before its closure in 2011, the UK Film Council published a ‘statistical yearbook’ containing data on the sex of directors and writers of UK films released in the UK annually (e.g. UKFC, 2008). The BFI has continued this practice (e.g. BFI, 2022a). At best, these data show no major change over the course of this period. Moreover, the data does not allow for a detailed analysis of, for example, issues of seniority, production budgets or genre.
More recent data from the Covid period could be argued to show some movement towards gender parity (with the % of male directors and writers of UK films released in the UK dipping below 80% for the first time (BFI, 2022a: 16, see also Taylor et al., 2024), although following Cobb (2020), this may be in no small part an artefact of the shrinking absolute number of films released in this period. Even where this data exists for ‘visible’ (Percival, 2020) elements of the film industry, for example directors and writers, Nwonka (2021a: 436) notes the lack of similar figures being consistently published with regards to race and ethnicity.
The continued relative absence of data in key areas has hindered deeper understanding of, and responses to, inequalities (Nwonka and Malik, 2021: 18). Yet even as more data has been made available, both Cobb (2020) writing on gender, and Nwonka (2021a) writing on race, highlight how a change in the level of rhetoric and availability of data around inclusion has not been accompanied by significant change in actual levels of inclusion.
The field thus has two lessons. Data is a major issue in the context of inequalities in the screen sector; and a comprehensive understanding of the demographic characteristics of those who work in the industry remains a work-in-progress. Yet even as more detailed demographic data has emerged, quantitative data alone has not resulted in a significant impact on levels of inequality, but such data has nevertheless enabled closer monitoring of the ongoing absence of diversity in the screen sector.
What about social class?
As with race and gender, social class has been a major subject of interest for media studies scholars. The field has a long history of engagement with class issues (see e.g. Deery and Press’s, 2017 summary, and Williams, 2023 as an example case study). Television has been a particular area of interest for class and screen industries research (Forrest and Johnson, 2017). On screen representations of class, particularly of working class individuals and communities, in comedy (Minor, 2023), reality TV (De Benedictis et al., 2017; Skeggs and Wood, 2011), drama (Johnson, 2016) and more generally (Hesmondhalgh, 2017) have all received significant attention.
Much of this discussion has focussed on the misrepresentation of working class life, coupled with an often idealised or fantasy version of middle class ‘costume’ history. Whilst the political economy of media, in terms of costs and assumptions about likely market success, is an important element here (De Benedictis et al., 2017; Hesmondhalgh, 2017), the literature also suggests the importance of commissioning to on-screen representations.
Friedman and Laurison’s (2019) study of commissioning, as part of the wider qualitative study of class and workers in screen industries (e.g. Dent, 2020; Grugulis and Stoyanova, 2012; Randle et al., 2015), shows the importance of class to decision making. This plays out in several ways: the closed middle class space of this subsector of the industry; the lack of lived experience in commissioning working class stories; assumptions about what will and will not, find an audience – all these contribute to struggles over representation on screen.
Interestingly, aside from the ‘class ceiling’ project associated with Friedman and Laurison’s (2019) work, social class has not seen similar research programmes to those reviewed in the previous section. Indeed, this point was part of the motivation for Randle et al.’s (2015) qualitative work on class and the screen workforce. Initiatives to generate data relating specifically to class (e.g. Carey et al., 2021) have been slow to develop. This may to some extent be attributable to the particular methodological and conceptual challenges of measuring social class (Oman, 2019). Initiatives to generate data relating specifically to class have been particularly slow to develop. This may to some extent be attributable to the particular methodological and conceptual challenges of measuring social class (Oman, 2019).
Following a joint research project with Arts Council England, Oman identified a range of conceptual and practical issues associated with asking class related questions in the context of gathering equality and diversity data. The ‘best practice’ (see Friedman et al., 2017) of asking respondents to specify parental occupation was greeted with concern by Oman’s cultural-sector participants, illustrating a practical barrier to data gathering. In addition to measurement issues, class is not a protected characteristic under UK equality legislation, meaning organisations face lower levels of scrutiny on this issue.
Randle (2015) has argued that these factors underpin a sense that class has been given less prominence within the diversity agenda for the film industry, and these issues form part of the explanation for what Nwonka (2015) identifies as an ‘alarming reluctance on the part of the industry to consider how socio-economic factors and the dominant class composition of the film sector undermined the diversity agenda’ (p. 73), with class remaining a ‘perpetual void in contemporary conceptualisations of diversity in British film’ (p. 79).
Recent research has attempted to intervene to correct the absence of data – particularly industry-wide quantitative data – on class in the screen sector. Whilst echoing Oman’s findings around the difficulties associated with the monitoring and recording of class origins, Carey et al. (2021) and Taylor et al. (2024), show a UK screen industry dominated by those from middle class social origins. This analysis drew on data from the ONS’ LFS. As noted, ONS began asking respondents about their class background in 2014. Carey et al. (2021) were able to track 5 years of LFS data to suggest a decline in working class representation in the UK screen industry, noting that: ‘In 2020, only one in four of the UK Screen workforce came from lower socio-economic backgrounds, compared to 38 per cent of those across the economy – the lowest level since social mobility questions were introduced in the Labour Force Survey in 2014’ (p. 6). Taylor et al. (2024) found similarly low levels of working class participation in film and TV occupations, using 9 years of LFS class origin data. We follow the same approach to the definition of class boundaries as these papers, considering data on the occupation of respondents’ parents grouped via the categories of the National Statistics Socio-Economic Classification (NS-SEC) schema. Those with at least one parent from NS-SEC categories 1 and 2 we label ‘managerial/professional’ (and ‘middle class’); those from NS-SEC categories 3–5 we label ‘intermediate’; and those from NS-SEC categories 6–8 we label ‘working class’.
These approaches have limitations. As with the UKFC and BFI statistical yearbook data, ONS datasets do not offer detail and granularity relating to class and film. Recent initiatives from BBC (2018) and OFCOM (2023) notwithstanding, data availability remains a challenge, and as Carey et al. (2021) note ‘the majority of [Screen Sector Organisations] interviewed did not systematically measure the diversity of their workforce, although there were notable exceptions, particularly amongst larger businesses’ (p. 43). Indeed, class inequalities and class data collection is seen by many employers as ‘a relatively new development’ (p. 42).
Context, data and methods
The BFI and film funding
The circumstances traced above provide the context for new modes of data collection and new policy frameworks for class and the UK film industry. A key example is the British Film Institute (BFI)’s commitment to monitor information regarding class background as part of their ‘Diversity Standards’ initiative. This began in 2018.
The BFI has existed in some form since the 1930s, and its role in funding film has been variable in its near century of existence. No funds were allocated to the production of film until the small Experimental Film Production Fund was established in the 1950s, which Dupin (2012) characterises at this point as a ‘marginal BFI activity’ (p. 199), noting ‘a total budget hardly sufficient to produce a feature film trailer in the commercial sector’. After a period of dormancy, funds for film production were revived in 1966 under the BFI Production Board. Again, the scale of funds remained small, with predominantly short films being produced, ‘on shoestring budgets’ (p. 202). Nowell-Smith (2012) notes that whilst production funds rose throughout the course of the 1970s, this ‘barely kept pace with inflation’ (p. 170), and a significant change in the scale of funding available came only in the 1980s due to a co-production agreement with the newly established fourth terrestrial television channel in the UK (‘Channel 4’) ‘almost doubl[ing] the Production Board budget’ (Dupin, 2012: 209). Dupin (2012) provides a useful reference point on the scale of demand for elements of BFI funding following this:
the establishment of the New Directors scheme in 1988 [. . .] selected nine projects from over five hundred applications (the number would rise to over two thousand a year in the late 1990s; in total, the scheme produced more than seventy films over twelve years). (p. 212)
The BFI’s funding remit was transferred to the newly established UKFC in 2000. UKFC was abolished in 2011, with the remit returning to the BFI, along with most of UKFC’s functions and a majority of its posts (Schlesinger, 2015: 473). Over the transition period of 2010–2012, BFI/UKFC supported more British film production projects than any other public investment source (BFI, 2013: 209), which remains the case for the BFI in the 2020s (e.g. BFI, 2022b).
In stark contrast to earlier periods, the upcoming iteration of the Film Fund considered by this paper (the ‘BFI National Lottery Filmmaking Fund’) will allocate £54 million from 2023 to 2026 (BFI, 2023). So, whilst we must bear in mind in consideration of the data below that the BFI fund only a small overall proportion of UK films (less than 10% over the decade 2005–2014, for instance – see Follows et al., 2016: 37), the Institute is clearly at this stage a key organisation in the funding of UK film, and certainly so with regards specifically to the attribution of significant levels of public funding.
Diversity and the BFI Film Fund
The BFI Film Fund is an open access fund to which filmmakers can submit applications against eligibility criteria set out in Fund Guidelines, and Fund Priorities are used to assess these applications. Projects are therefore not directly commissioned by the BFI; rather than ‘actively’ identifying people or projects for support, funding is only attributed to applications received.
Before considering levels of success for applicants, therefore, we should first consider what information is available on the characteristics of those even seeking funds. It may be the case that it is not so much that those who ‘ask’ do not ‘receive’, but that some do not even get to the point of ‘asking’, having been ‘filtered out’ prior even to this point (see Carey et al., 2021).
Nwonka (2021a) highlights that in 2016 the BFI introduced ‘Diversity Standards’ for all Film Fund applicants to ensure data collection in relation to equality and diversity. The standards are designed to support projects meeting diversity criteria (p. 460). Yet it is clear that there have been major challenges to gathering meaningful data in relation to diversity. In turn, these challenges have limited analysis on diversity in the funding process. Here, it is worth quoting the BFI’s response to a Freedom of Information request by the authors of a major 2016 report on gender inequality seeking information on the characteristics of funding applicants at length:
The BFI Film Fund reviewed and updated the diversity form attached to application forms just over 2 years ago. This was due to applicants not filling in the diversity questions. Despite our efforts we continue to receive less than 30% of applications with the diversity section filled thus making it difficult to get a true picture of applicants. As you may know, there is no legal obligation for applicants to divulge the information at the point of application. Unfortunately, due to the incomplete data we are unable to share any data as this would not be a true reflection of applicants. (Follows et al., 2016: 40)
The continuing calls for data relating to class in this period (e.g. Moody, 2017: 418) were thus hampered not only by the fact that questions were not asked, but that other similar questions were not answered. The efforts made in data collection by the BFI Film Fund have made progress in addressing both of these issues, and so our analysis offers a unique chance to understand not only who is being funded, but also who is not.
The BFI Film Fund data
The three strands of the Film Fund considered here cover support for early-career applicants, the development of feature films and the production of feature films:
BFI NETWORK (‘NETWORK’), is the BFI’s talent development programme, which awards National Lottery funding to support, develop and champion new filmmakers looking to kick-start their career, with the majority of cases considered here representing application for short film funding,
The BFI Development Fund (‘Development’) awards National Lottery funding to support formal development of original live action, emerging media and animation fiction feature filmmaking and
The BFI Production Fund (‘Production’), which awards National Lottery funding to support the production of such filmmaking.
It is important to clarify here that this and other equality monitoring data is not made accessible to those making funding decisions, and so is not directly considered in the attribution of funds. The analysis presented here is based on an anonymised version of this dataset pertaining both to unsuccessful and successful funding applicants in three roles – writer, director and producer.
In providing a picture of both who ‘asked’ and who ‘received’ from the BFI Film Fund, this recent data provides a major step forward in both response levels and topic coverage even from the relatively recently state of play in the mid-2010s noted above. It is clear, at least in terms of data availability, that meaningful change is being made in the wake of the introduction of the BFI Diversity Standards. Not only is this data now available for the first time, but data collection is planned to continue into the next iteration of the Film Fund referenced above.
As noted, the provision of all demographic data by applicants is voluntary. In the dataset considered here, information is available on the demographic characteristics for at least one applicant (writer, director or producer) in the majority of cases. That said, Table 1 shows the relative level of provision of class data in relation to other demographic characteristics.
Non-provision of data in relation to key characteristics.
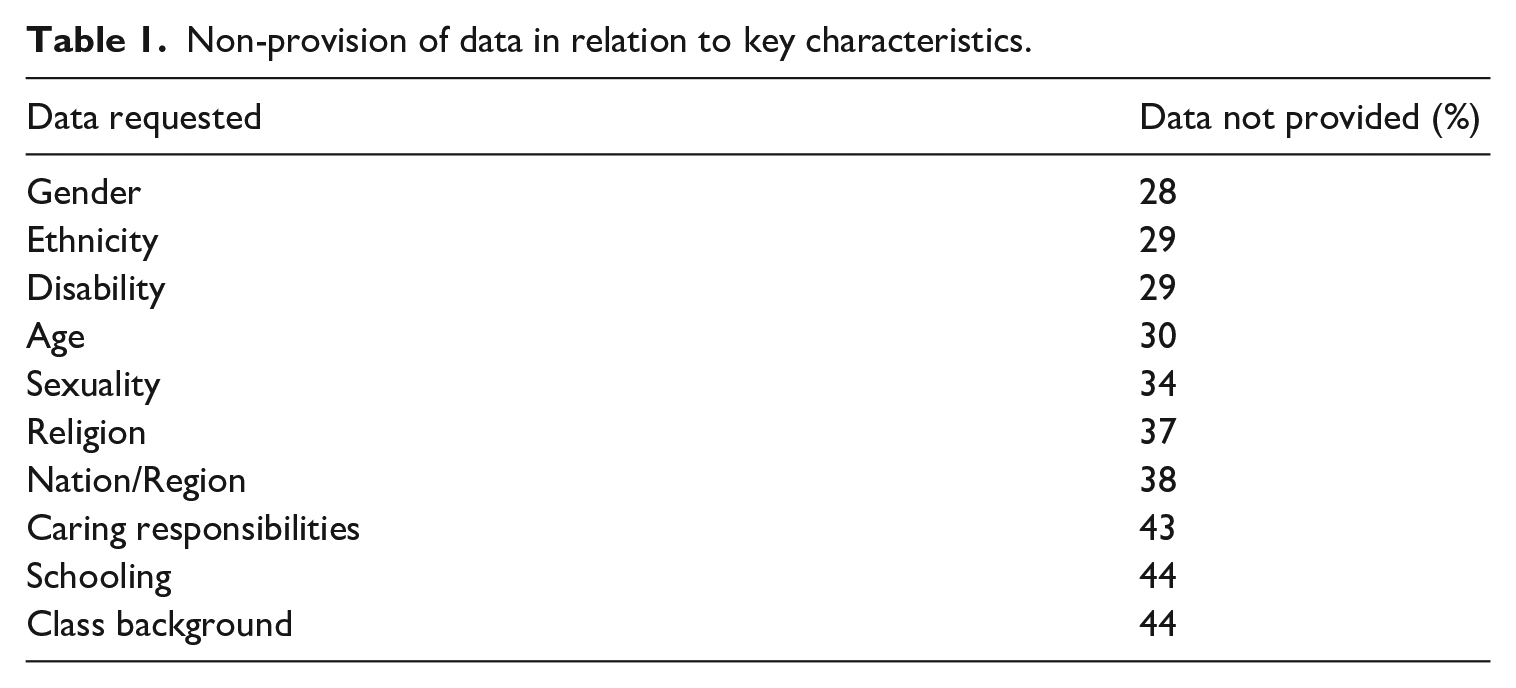
The fact that class background is the least available of all information requested returns us to the points above regarding the particular challenges associated with the collection of this data.
Prior to considering the relative patterns of success in relation to these characteristics, first we consider the level of application to each of the three strands, as presented in Table 2, which also shows the percentage of applicants who did not include information about their class background, illustrating how availability differs between programmes and over time.
Number of applicants per fund (% missing class background).
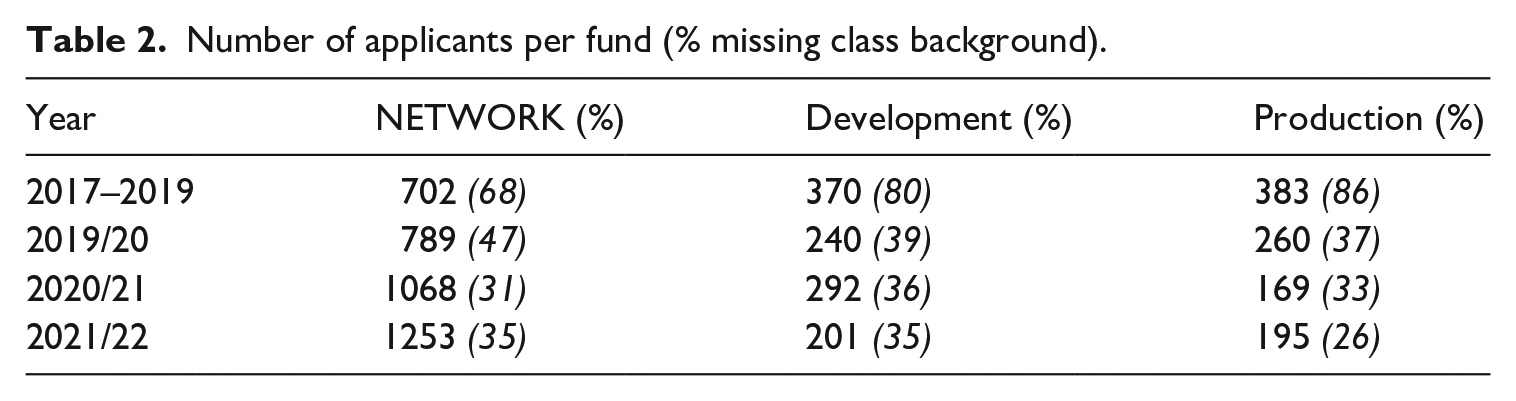
As might be expected, there is clearly relatively high (and rising) demand for NETWORK funding from those at the start of their career, with applications for the support and production of feature films being smaller in number and more stable year-on-year. ‘Missingness’ is significantly higher for all schemes at the outset of data collection, mainly as the initial recording period runs from 2017 to 2019, and so covers a period prior to the prioritising of gathering data. The vast majority of the data analysed below comes from the period 2019 to 2022.
Who asks for, and who receives, funding?
Applications
In concert with the existing research considered above, we see those from managerial/professional (‘middle class’) backgrounds dominating applications to the three Film Fund strands, as shown in Table 3.
Application rates by role and fund (%).
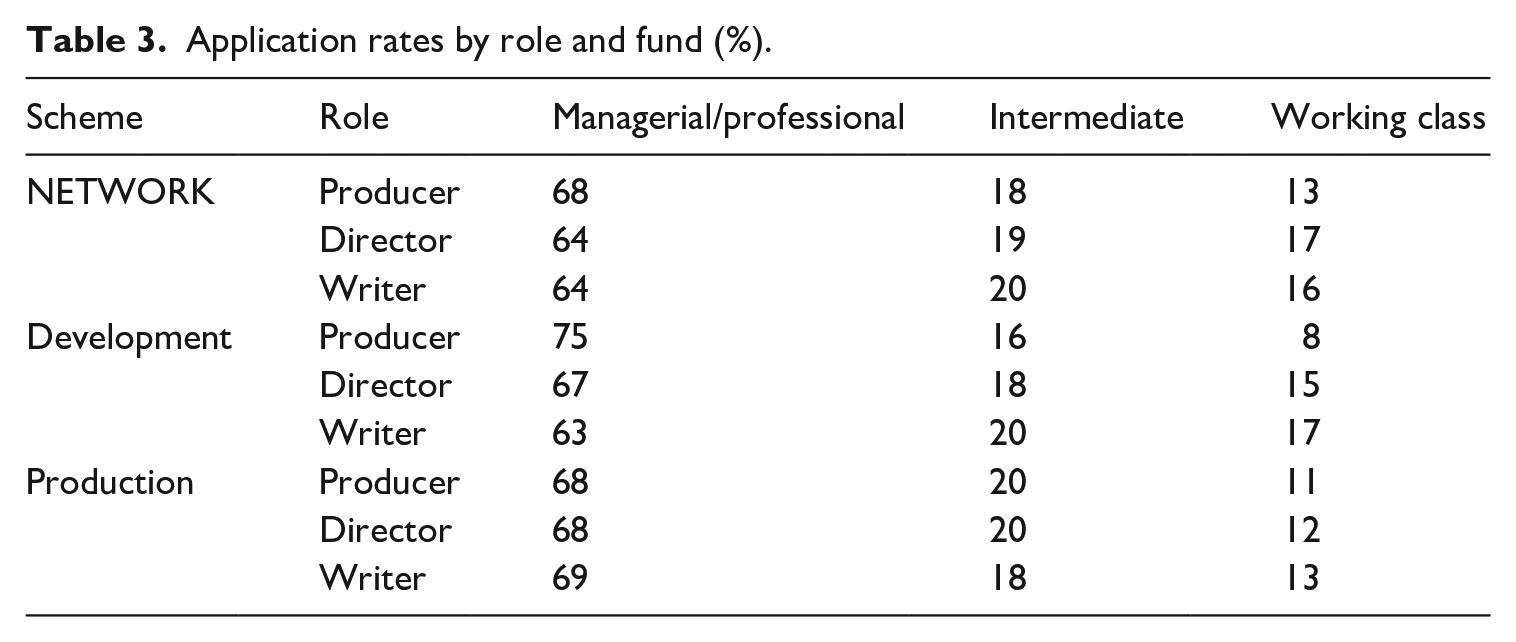
Overall, two thirds of applicants are from managerial/professional backgrounds, as compared with 37% of the total workforce from this background in 2022. Across the different funds and the three lead creative roles, the percentage of applications from middle class applicants ranges from a low of 63% (Development applications by writers) to a high of 75% (Development applications by producers).
Applicants from working class backgrounds are heavily under-represented in applications to BFI Film Fund strands as compared to their proportion of the UK workforce (39%) in 2022. The lowest application rates are among producers to the Development fund, making up just 8% of applications.
There is further evidence here that certain groups have been ‘filtered out’ before they get to the point of even making a request for funding. However, applying for funding is just the first stage of a process where class inequalities are present. Next, we turn to examine rates of success, in the context of the demographics of applicants.
Success
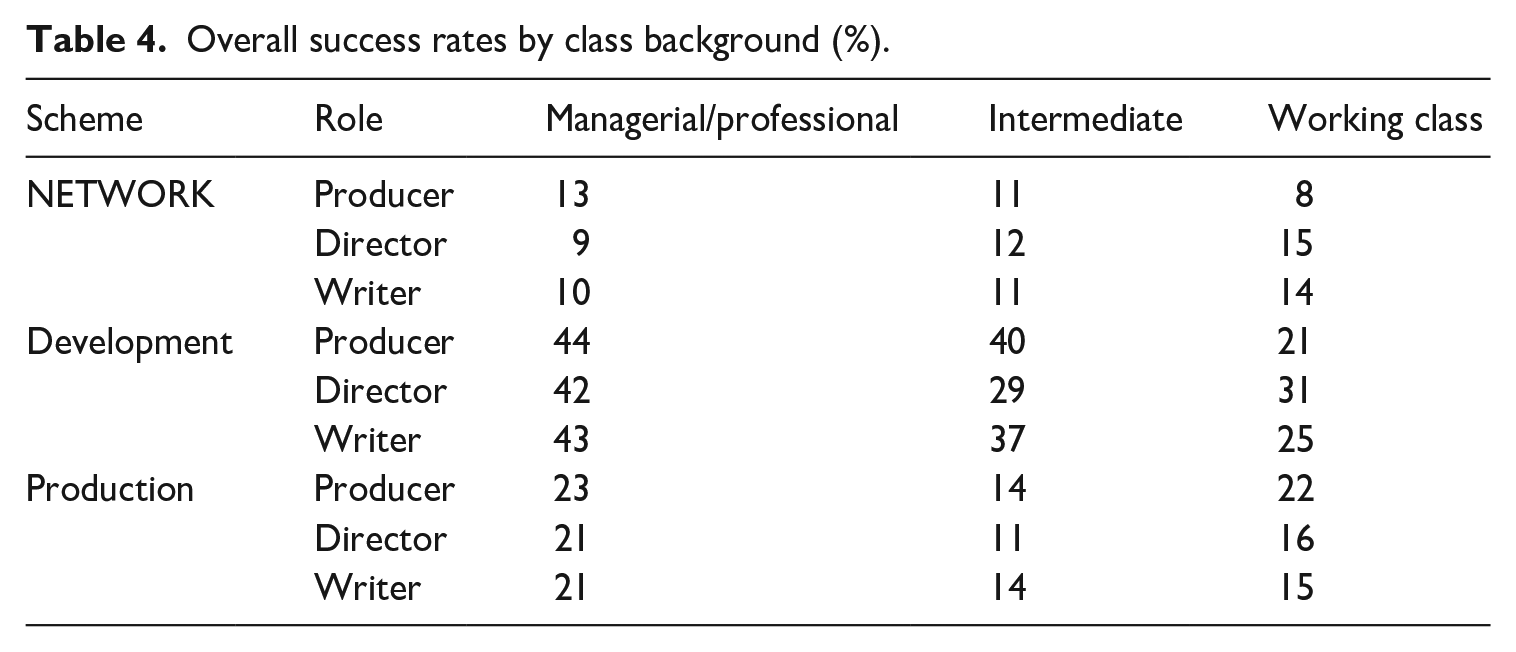
Overall, partly reflecting the overall application rates shown in Table 3, success was consistently higher for the Development fund, and low and lowering for the ‘earlier’ NETWORK strand. How this success is broken down by role and class background is shown in Table 4.
Overall success rates by class background (%).
This level of success results in the overall composition of successful groups shown in Table 5.
Composition of successful groups by role and fund.
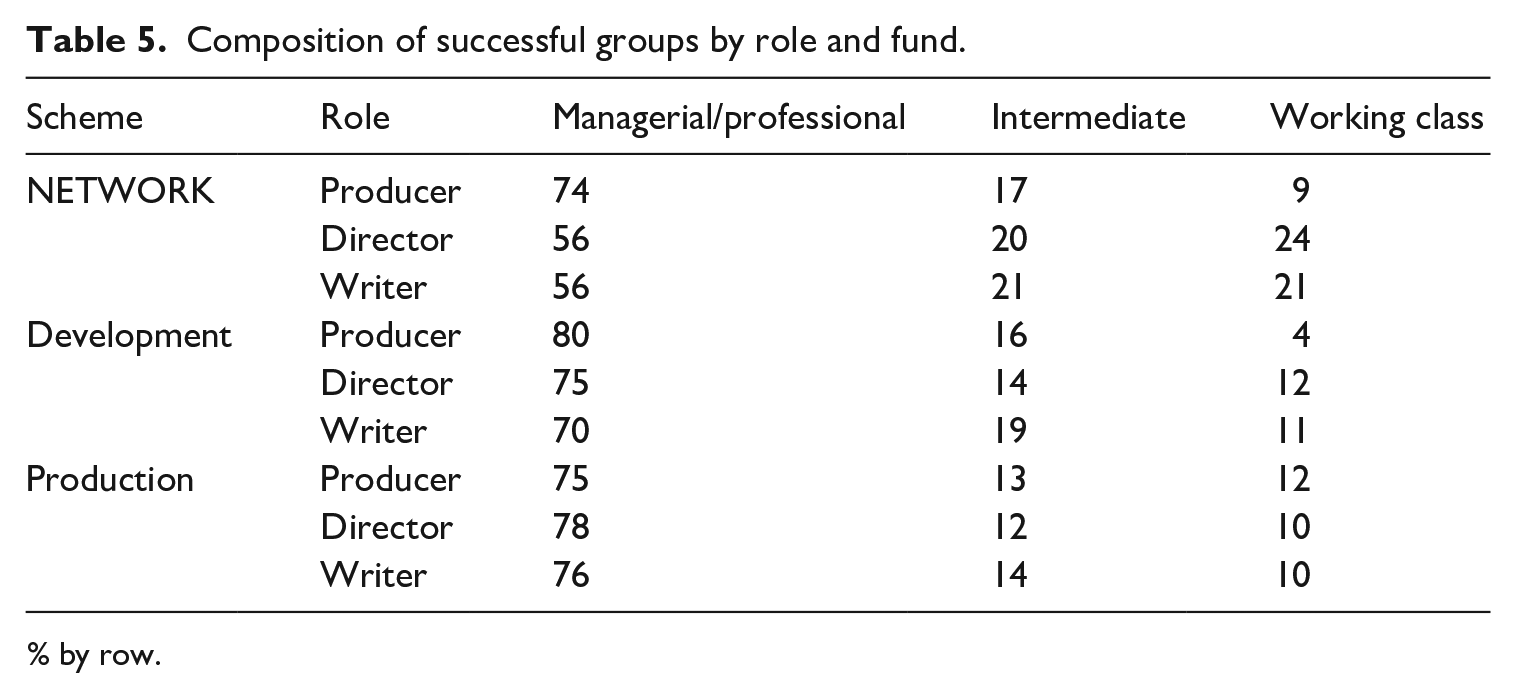
% by row.
For successful applications, the picture is markedly different between the ‘earlier’ NETWORK fund and ‘later’ Development and Production funds. In the ‘talent pipeline’ of the NETWORK fund, although the majority of successful applications are still from managerial/professional backgrounds, compared with their lower application rates, writers and directors from working class backgrounds are actually more likely to be awarded funding in this strand.
This pattern is not repeated, however, in the Development and Production funds. Here, applicants from middle class backgrounds are awarded funding more often across all lead creative roles, even taking their over-representation among applicants into account. As seen in Table 4, for instance, 43% of middle class writers who apply for Development funds are successful, compared to 25% of working class writers. This suggests that the support for working class development at early career stages is not currently likely to continue on to support for fully realised projects.
Of the three lead creative roles considered, the pattern of disproportionate middle class success is most pronounced for producers. Even among those applying for NETWORK funds, producers from working class backgrounds are less likely to have successful applications, and for Development funding the success rates of working class producers are only half of those for people from managerial/professional backgrounds. In total, only 4% of awards to the Development fund go to producers from working class backgrounds. Conversely, 75% of producers applying to the Development fund are from middle class backgrounds, while making up 80% of successful applications.
In summary, across all lead creative roles applying to the Development and Production funds, the proportion of successful middle class applicants is greater than that of the original applicant pool, and in all lead creative roles applying for support to the BFI Development and Production funds, middle class applicants are more likely to be successful than working class applicants.
How does class intersect with gender and ethnicity?
Our analysis has so far focussed exclusively on differences between social class backgrounds. We have shown that while directors and writers from working class backgrounds are more likely than their middle class peers to receive funding through the NETWORK talent development schemes, this pattern is reversed once we reach ‘later’ work stages.
However, unequal rates of funding between people from different class backgrounds should not be seen in isolation. Other demographic characteristics also represent crucial differences both in overall representation and probability of success.
The importance of different characteristics has been acknowledged directly by the BFI. In the context of the launch of the BFI Diversity Standards (Nwonka, 2021a, 2021b), and in response to the campaign for 50% of public funds to be allocated to women directors (see Follows et al., 2016), the director of the Film Fund qualified agreement with this goal by noting, ‘if those women are all white, middle class and based in London or the southeast, it won’t be enough’ (Roberts, 2016).
We now, therefore, consider class background, ethnic group and gender simultaneously. In so doing, we aim to compare the probability of success for people from different groups, while also recognising that people do not only hold single characteristics.
As noted, many applicants do not provide data about all their characteristics. Table 6 presents information on those applying for each category in each role, and the percentage providing data on class background and ethnic group, and gender. This figure is highest for writers applying for NETWORK funding and lowest for directors applying for Development funding.
Sample sizes and missingness for Figure 1.
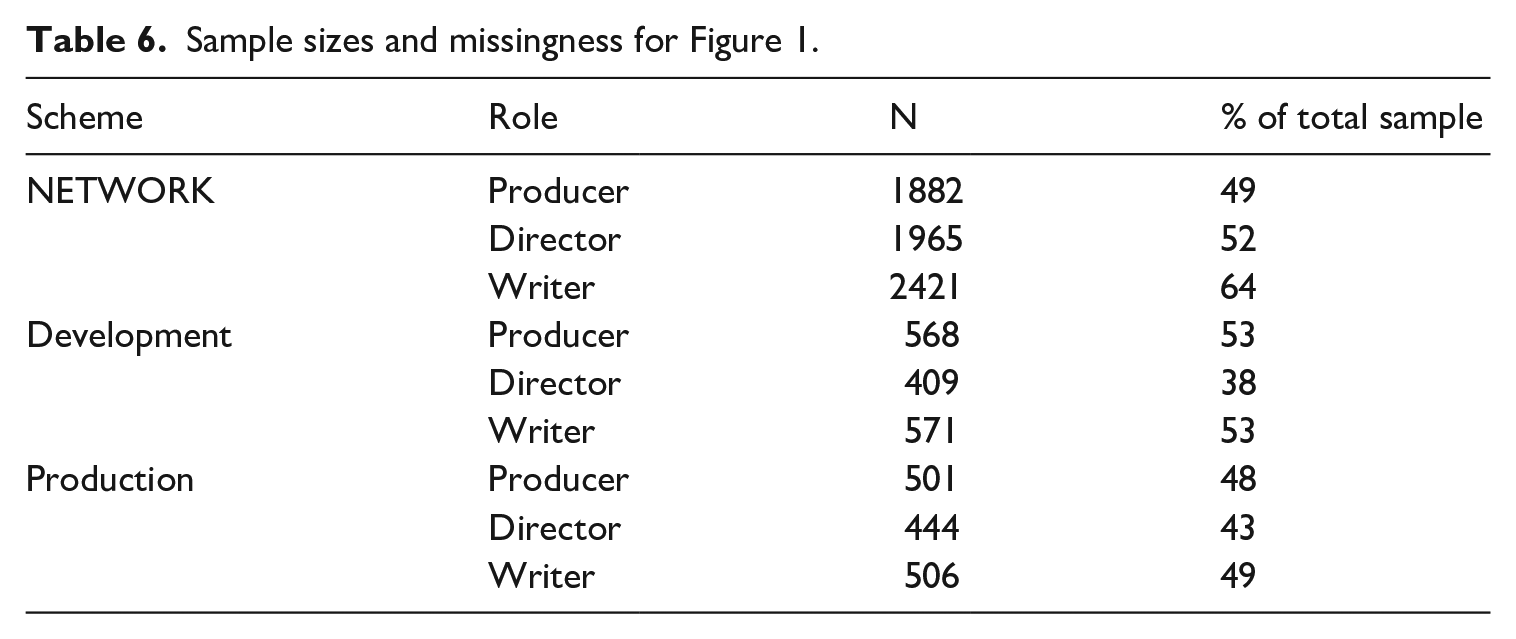
Figure 1 shows the results of logistic regressions, where applicants are given the value 1 if successful, and 0 otherwise. We fit separate logistic regressions for each combination of role and fund, reflecting the differences by class background discussed in the previous section. Where coefficients are greater than zero, with zero denoted by the dashed vertical line, members of that group are more likely to receive funding than the reference group for that category. The reference category for class background is middle class; for ethnic group, White; for gender, male. We do not distinguish between different minority ethnic groups because of small numbers in the data.
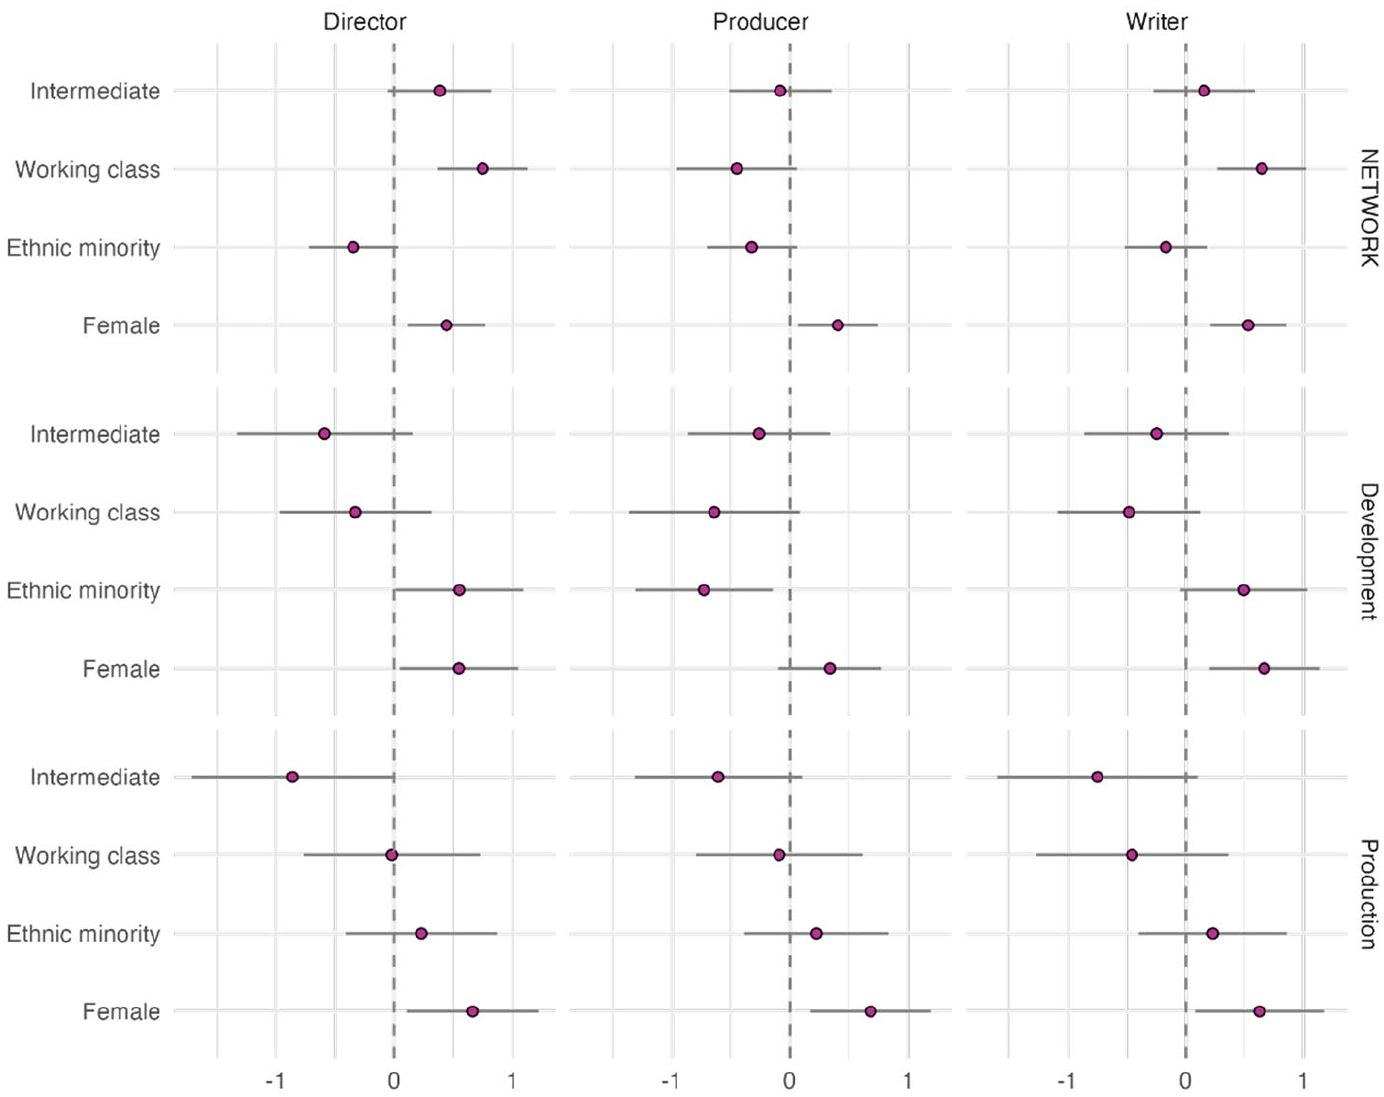
Results of logistic regressions by role and fund.
We include confidence intervals in each case, but should acknowledge that this is not a random sample of observations; it is in fact a population sample, made up of all observations where all relevant questions have been answered. This means that confidence intervals are more illustrative of a measure of the size of differences, rather than their statistical significance.
This approach means that we cannot draw any conclusions about people who have not stated their class background, ethnic group or gender.
The findings in Figure 1 reinforce our earlier analysis, with differences in success rates between people of different class backgrounds persisting once gender and ethnic group are taken into account.
This still includes the patterns where directors and writers from working class backgrounds applying for NETWORK funding are more likely to be successful than their peers from middle class backgrounds. This pattern reverses (albeit not as strongly) for Development funding, while directors and producers from working class backgrounds are as likely to be awarded Production funding as their middle class peers. However, the confidence intervals for Production are significantly wider, reflecting the far smaller numbers of applicants from working class backgrounds applying for projects at this scale in the first place.
The patterns around ethnic group do not show a consistent pattern, but they are nevertheless important. Members of ethnic minorities are slightly less likely to receive NETWORK funding than their White counterparts; ethnic minority directors and writers are slightly more likely to receive Development funding, while ethnic minority producers are significantly less likely to receive Production funding. Differences are minimal across roles for Production funding with none of the three roles having coefficients statistically significantly different from zero; as with class background, this likely reflects the very small numbers of ethnic minorities applying for this funding in the first place.
Finally, women are more likely to receive funding for all roles and funds. The scales of these differences varies, but not significantly; the coefficients vary from 0.338 (producers applying for development funding) to 0.665 (writers applying for development funding). As with class background and ethnic group, this partly reflects the smaller fractions of women applying for funding in the first place.
Figure 2 puts these coefficients into context. It shows the predicted probability of success as we change all three characteristics, comparing people from middle and working class backgrounds, White people and ethnic minorities, and men and women. These predicted probabilities are derived from the logistic regressions themselves, and illustrate how the scales of these differences manifest in practice.
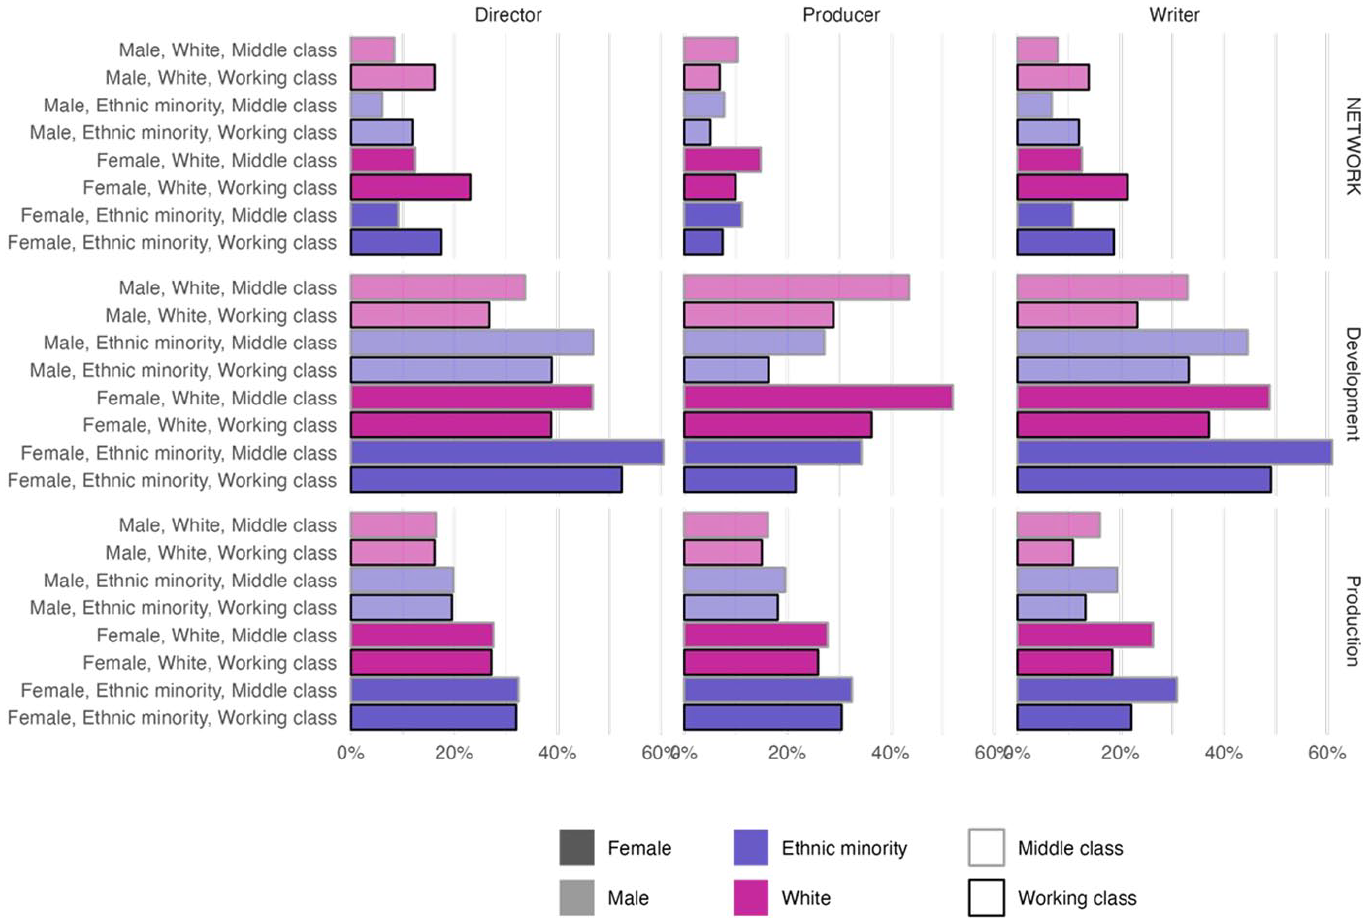
Predicted probabilities of successful funding given application for eight archetypes, based on results in Figure 1.
Figure 2 highlights the crucial difference between the three funds: the success rate for the NETWORK talent development scheme is significantly lower than it is for Development or Production funding. Where people from working class backgrounds have greater success than their middle class counterparts, their success rates are still low. For example, a White male writer from a working class background applying for NETWORK funding has a predicted probability of success of 14%, compared with 8% for someone otherwise similar but for their class background. Drawing the same comparison for a writer applying for Development funding, the figures are 23% and 33%. While the relative difference may be smaller – with accompanying smaller coefficients – the absolute difference is larger, at ten percentage points’ difference compared with six.
The group least likely of all to receive funding, based on predicted probabilities, are male ethnic minority producers from working class backgrounds applying for NETWORK funding, with a probability of just 5%, compared with 10% for White men from middle class backgrounds.
Overall, the largest differences can be seen among producers applying for Development funding. A White woman from a middle class background has a predicted probability of 52% of receiving funding; for an ethnic minority man from a working-class background, the figure is less than a third of this, at 16%.
The picture of class as it intersects with race and gender is complex, and deserving of the fuller, in-depth research. Nevertheless, the picture that emerges above highlights an ongoing class imbalance in both applicants to the BFI Film Fund and those who are successful and awarded funding.
Conclusion
At the time of writing the screen sector in the UK is facing a series of crises, with high levels of un- and under-employment for screen workers (BECTU, 2024). More globally, the screen sector is seeing a clear pushback against programmes that encourage and support diversity. Writing in 2024, the BBC’s former head of creative diversity Joanna Abeyie reflected on the absence of improvement in workforce diversity, suggesting this absence called into question the screen industry’s commitment change.
The analysis in this paper should be seen in this context. It has, for the first time, been able to offer a quantitative approach to the analysis of class inequality in the screen sector. Using application and award data from the BFI’s Film Fund, we have shown persistent inequalities in applications and success rates.
Across all lead creative roles applying for Development and Production funds, the proportion of successful middle class applicants is greater than that of the original applicant pool, and middle class applicants are more likely to be successful than working class applicants.
In some ways, the patterns shown here reflect a broader pattern wherein diversity schemes focus particularly on emerging talent (e.g. Nwonka and Malik, 2021: 5). Policy assumes (cf. Carey et al., 2021) that if there is a diverse input going in to the ‘talent pipeline’, then a diverse output will emerge at the other end. However, as the existing, and longstanding, literature demonstrates, this approach has, at best, created a very slow pace of change.
In its early years, it was recommended that the BFI ‘not undertake the collecting or collating of statistics relating to production and distribution of films or to cinema audiences’ (Radcliffe, 1948: 7). Clearly, the data collected in recent years represents a dramatic difference in this position from the mid-20th century. It is also a major development when compared to data collection on UK Film only 10, or perhaps even 5, years ago. The establishment of formal data collection regimes is welcome. Also welcome is the response to data gathering and dissemination. Certainly with regard to race and gender, BFI data, as part of a broader trend towards using data to demonstrate inequalities in the UK and international screen industries, has supported practitioner and public demands for change (e.g. Hall, 2023). The BFI class dataset is part of this trend. It enables analysis of the characteristics of those already ‘inside’ the house of UK film, as is often the case with funding and demographic data, but also gives information on those requesting entry.
Nevertheless, we must exercise caution regarding the role which data analysis of this kind can play in isolation. An exclusive focus on numerical data – what Gray (2016) refers to as the ‘demography and representation’ approach to diversity – can move researchers’ (and practitioners’ and policymakers’) focus away from examining broader questions of inequality (cf. Newsinger et al. (2024)’s recent work on the limits of diversity ‘reforms’ to screen industries). Inequality can be related to the political economy of screen industries, through issues associated with inequalities in on-screen representations, to broader social inequalities that are crucial in explaining issues that are seemingly specific to the screen sector. Examples based on analysis of class data at the BFI might include the way labour in UK film in particular has an extremely long-established, ‘institutionalised’ instability (see Blair, 2001), which shows signs of potentially worsening in the post-covid era (Gilmore et al., 2024). It might also touch on the fact class-based inequalities and exclusions are reflected not only in the broader creative sector (Brook et al., 2023), but the structure of the wider economy (Carey et al., 2021: 82). Class inequalities apply across the life course, not only to ‘entry’ levels of the workforce (Brook et al., 2020).
In addition, structural challenges include how ‘diversity’ itself is conceived. As Saha (2018) notes, ‘inclusion’ itself may open up some space for change. It will not automatically lead to a radical transformation of the way screen industries themselves are structured, nor the nature of the work produced. Major inequalities persist in areas, such as race and gender, where data has been available for some time. These ongoing inequalities indicate a likely limited impact of gathering and publishing class data. Demonstrating inequalities is never sufficient for change, but does shed light on where we are, and from where such change needs to progress.
It is this reflection on data limitations that is perhaps most pertinent to media scholars. The analysis here adds to the quantitative base for broader discussions on the absence of working class voices in media industries. For scholars examining the quality of on screen representations, the analysis demonstrates a lack of access and support for those from working class backgrounds, adding details from specific funding streams to general data on the workforce overall. Moreover, the intersectional perspectives crucial to contemporary media scholars’ modes of analysis, offer similar evidence for both theorists and qualitative scholars.
Footnotes
Funding
The author(s) disclosed receipt of the following financial support for the research, authorship, and/or publication of this article: This work was supported by AHRC grant AH/S001298/1 ‘Centre of Excellence for Policy and Evidence in the Creative Industries’, and AH/S004483/1 ‘Understanding and challenging inequality in culture’.