
Abstract
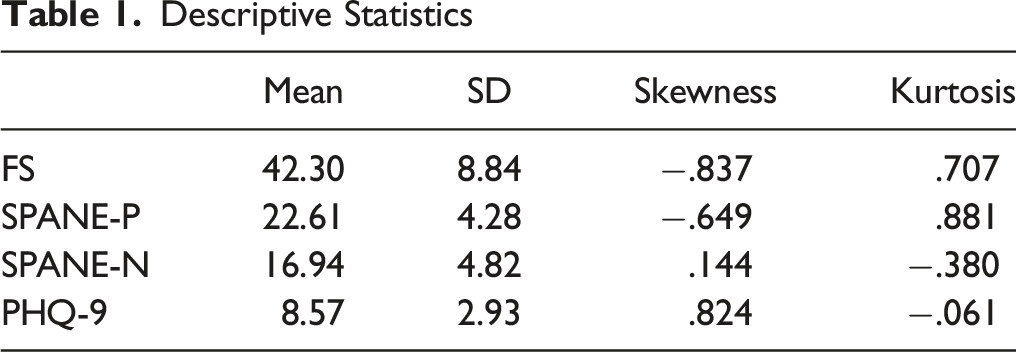
The Flourishing Scale (FS) was developed to measure individual psychological well-being. The FS was developed based on psychological well-being theories that include meaning and purpose in life, involvement in activities, social relationships, and feelings of competence. The psychometric properties of the FS have been studied in several countries. However, research that provides reports on reliability and validity for the Indonesian version of the FS is limited. The aim of the study was, therefore, to evaluate the psychometric properties of the Indonesian version of FS which include reliability, internal structure, and convergent validity. 1129 respondents completed the FS, Scale of Positive and Negative Experience (SPANE), and Patient Health Questionnaire 9 (PHQ-9). The Cronbach’s Alpha coefficients indicate a good internal consistency of the FS. The result of the Confirmatory Factor Analysis confirmed that a single-factor structure of the FS fit to the data. The result of the Multi-Group Confirmatory Factor Analysis showed measurement invariance across two subsamples. The results of the correlation test show a significant correlation between the FS with the SPANE and PHQ-9. Taken together, the Indonesian version of the FS can be considered a reliable and valid instrument to measure psychological well-being for Indonesian people.
Introduction
Well-being is a psychological construct that is widely studied in the area of positive psychology. Ryan and Deci (2001) define well-being as the optimal state of an individual’s psychological functioning. In more detail, Diener et al. (1998) explained that well-being includes how individuals are in control of things around them, as well as how individuals make progress in their lives by engaging in enjoyable activities and building positive social relationships.
The World Health Organization (2005) defines well-being as a state of mental health in which individuals: are aware of their own abilities, are capable of coping with the normal stresses of life, can work productively and fruitfully, and are able to make a contribution to their community. In addition, those who experience well-being, and positive emotions, are better psychologically protected from the onset of depression, while those who experience negative emotions are considered at risk for developing mental illness (Zhang, 2022). According to Zhang (2022) positive and negative emotional states mediate the relationship between levels of mental health distress and well-being.
The term flourishing is frequently used to describe a heightened state of psychological well-being (Compton & Hoffman, 2013) in which an individual feels good and functions effectively in their daily routine (Huppert & So, 2013). This definition seems to amalgamate two distinct notions of well-being: (1) that a person can achieve a state of hedonic bliss, yet (2) within a eudemonic degree of functioning (Ryan & Deci, 2001). Hone et al. (2014) conducted a comparative literature review of the existing theories on flourishing (Diener et al., 2010; Huppert & So, 2013; Keyes, 2002; Seligman, 2011) in order to properly define its theoretical construct, which was found to be regarded as a high degree of subjective well-being.
Within this consideration, Diener et al. (2009) encourage future researchers to explore the psychological underpinnings of flourishing in order to determine its potential correlations with: life meaning and purpose, supportive and rewarding relationships, engagement and interest, the well-being of others, the demonstration of competency, self-acceptance, optimism, and receiving respect from others. These theoretical associations imply that psychological well-being promotes optimal human functioning, and distinguishes psychological well-being from subjective well-being, which is more concerned with an individual’s evaluation of their own life (Diener et al., 2009).
It has been found that those who do not experience flourishing experience many problems, for instance: adult populations are more susceptible to developing physical and mental illnesses (Keyes, 2016), as well, they are less resilient to face challenges in life (Schotanus-Dijkstra et al., 2016); whereas teenagers do not learn how to adopt efficient coping mechanisms (Tessy et al., 2022). Moreover, low subjective well-being is considered to significantly correlate with symptoms of depression (Grant et al., 2013).
Measuring psychological well-being can provide information on whether an individual has a high or low level of well-being. Psychological scales can be a tool to measure well-being. There are various wellbeing scales. Ryff (1989) developed a scale based on six dimensions of well-being namely self-acceptance, positive relations with others, autonomy, environmental mastery, purpose in life, and personal growth. Keyes (1998) developed a social well-being scale consisting of the dimensions of social integration, social contribution, social coherence, social actualization, and social acceptance. Butler and Kern (2016) developed the PERMA-profiler, which is based on Seligman’s concept of flourishing, and consists of five pillars namely Positive Emotions, Engagement, Relationships, Meaning, and Achievement (PERMA). Diener et al. (2010) more specifically emphasize that flourishing includes having supportive and rewarding relationships, contributing to the happiness of others, being respected by others, having a purposeful and meaningful life, being engaged and interested in one’s activities, having self-respect and optimism, and feeling competent and capable in the activities that are important to oneself.
Literature Review
Among the existing psychological scales, the Flourishing Scale (FS) is widely used to measure flourishing. Diener et al. (2010) developed the FS to measure individual psychological well-being based on psychological well-being theories that include meaning and purpose in life, involvement in activities, social relationships, and feelings of competence. The FS has strong psychometric properties, and according to Diener et al. (2010) the FS has a strong Cronbach Alpha reliability (α = .87) and moderate test-retest reliability (r = .71). The results of the Cronbach Alpha reliability test indicates that there is internal consistency for each of the FS items in measuring well-being. In addition, the test-retest reliability measurement indicates that the FS items were responded to consistently over a given period of time.
Validity is another important psychometric property of psychological instruments. One of the types of evidence of a psychological scale’s validity is based on examining its internal structure (American Educational Research Association [AERA], American Psychological Association [APA], & National Council on Measurement in Education [NCME], 2014). A psychological scale that is intended to describe a single construct should have a clear unidimensional structure (Furr, 2011). Diener et al. (2010) conducted a factor analysis to examine the internal structure of the FS. After conducting a factor analysis, it was revealed that the FS contains a single predominant factor that accounts for 53% of the item variance with a factor load ranging from .61 to .77 (Diener et al., 2010). Based on the results, it is clear that the FS items form a structure that measures one construct, namely - well-being.
More so, validity is confirmed when a high correlation value exists between the psychometric scores of theoretically related psychological scales (AERA, APA, & NCME, 2014; Furr, 2011). Diener et al. (2010) conducted a Pearson correlation analysis of the FS and Ryff Scales of Psychological Well-being and found a correlation coefficient ranging from r = .4 to r = .7.
Sumi (2014) states that the main advantage of the FS, when compared to other psychological well-being instruments, is that it is concise and easy to understand. Another advantage is that the FS has been translated into various languages, such as Arabic, Chinese, Indonesian, English, and Japanese. The multilingual translation of the scale makes it easier for researchers and practitioners to use the FS across a diverse range population.
Bartram et al. (2018) state that researchers who adapt psychometric instruments need to verify the reliability and validity of the adapted version of the test for the intended population. The International Test Commission (2017) emphasizes that it is important to determine the linguistic equivalency between the original language version and the target language of the instrument. Many studies apply Confirmatory Factor Analysis (CFA) to evaluate whether the factor structure of the original version is consistent with that of the adapted version (Byrne & van de Vijver, 2014). Van de Vijver and Tanzer (2004) emphasize that convergent validity can be obtained through conducting a correlational analysis of a set of constructs and by examining the stability of correlations across language and/or cultural groups.
Research on the psychometric properties of the FS has been conducted in various countries such as Egypt (Salama-Younes, 2017), Portugal (Silva & Caetano, 2013), Spain (De la Fuente et al., 2017), and France (Villieux et al., 2016). The reliability of the FS found in those studies ranged from r = .81 to r = .89. The reliability coefficient values in these studies are similar to the reliability coefficient values obtained by Diener et al. (2010). Furthermore, the factor analyses conducted in other studies (De la Fuente et al., 2017; Villieux et al., 2016) confirm the unidimensionality of the FS. Salama-Younes (2017) found through a CFA that the FS was a fit single-factor model. Evidence of convergent validity for the FS scale was found by De la Fuente et al. (2017) and Villieux et al. (2016) in its relationship to the Scale of Psychological Well-Being and the Satisfaction with Life Scale respectively.
The psychometric properties of the FS have also been considered in eastern countries such as Japan (Sumi, 2014), China (Tang et al., 2016; Tong & Wang, 2017), and India (Singh et al., 2016). Out of the three countries, the Cronbach’s Alpha coefficient (α = .95) for the FS was found to be the highest when tested for in Japan. It was also revealed through these studies the existence of a single-factor model, and Singh et al. (2016) found a convergent validity for the FS when correlated with the Mental Health Continuum-Short Form.
Aryanto (2018) tested for the psychometric properties of the FS in Indonesia using two separate translators to validate the translation of the scale from English into Indonesian. The two translators then cross-referenced their results, which were then provided to an independent translator who translated the FS back into English. This process was conducted to ensure the similarities in meaning between the English and Indonesian versions of the FS.
Aryanto (2018) conducted a content validity study on the FS items that had been translated into Indonesian. It was found that the Indonesian version of the FS had an acceptable Aiken V-coefficient value ranging from .75 to .92 (Aryanto, 2018). A high Aiken V-coefficient value indicates evidence of content validity (Aiken, 1985). However, Aryanto (2018) did not report other psychometric properties for the FS scale, such as reliability or other indicators of validity.
Research Problem
There is limited literature available which verified the reliability and validity for the Indonesian version of the FS. Thus, the research question for this current study is whether the Indonesian version of the FS is reliable and valid. Therefore, the aim of this study is to evaluate the psychometrics properties of the Indonesian version of the FS, including reliability, internal structure validity, and convergent validity.
There are three hypotheses for this research: 1. The FS has a highly consistent internal reliability. 2. The FS has a single-factor structure. 3. The FS has convergent validity with a depression scale.
Method
Respondents
The respondents were recruited through online media using non-probability sampling and participation was voluntary. Inclusion criteria were that the respondents had to be Indonesian citizens and were able and willing to complete the online form.
In order to examine the internal structure of the FS, the respondents of the study were divided into two sub-samples, namely respondents from Java Island, Bali Island, and those who live outside of Java and Bali. The purpose of this sub-sampling was to determine whether the FS can be interpreted equally in both samples, and if there were any individual differences in participant responses related to well-being. Muzakki and Sukim (2022) found that there are differences in economic distribution between the Java-Bali region and outside of Java-Bali, and that the majority of economic investment is still centered in Java and Bali. This factor was considered as a potential confounding influence on participants’ responses in regards to their psychological well-being.
The data collection procedures for this study, involving the use of human subjects, was granted ethical approval from the Ethics Committee of the Faculty of Medicine, Udayana University – review board number 2757/UN14.2.2.VII.14/LT/2022 with protocol number 2022.03.1.1204.
Instruments
The Flourishing Scale
Participants were instructed to complete the Flourishing Scale (FS), which consists of eight items scored on a Likert scale ranging from one (strongly disagree) to seven (strongly agree). The possible total-score can range from eight (strong disagreement with all items) to 56 (strong agreement with all items). Higher scores on the FS indicate that respondents experience a higher degree of well-being. Examples of the FS items are “I lead a purposeful and meaningful life” and “My social relationships are supportive and rewarding”. In this study, the online Indonesian translation of the FS was used (https://eddiener.com/scales/9).
The Scale of Positive and Negative Experience
The Scale of Positive and Negative Experience (SPANE) measures respondents’ positive and negative experiences. It consists of 12 items, six items for measuring positive feelings (SPANE-P) and six items for measuring negative feelings (SPANE-N) (Diener et al., 2009). A prompt is provided with the SPANE which asks participants to think about the experiences that they had over the four weeks prior to completing the scale, then participants are asked to report on the degree to which they experienced those feelings. For each item, participants were asked to select a number from one (very rarely) to five (very often). Examples items for the SPANE-P are ‘good’ and ‘pleasant’, while the examples items for the SPANE-N are ‘bad’ and ‘sad’.
Diener et al. (2010) revealed that the Cronbach’s Alpha score for the SPANE-P’s and SPANE-N’s reliability was .87 and .81 respectively. The factor analysis of the SPANE-P was found to contain a single factor that contributed to 61% of the variance with a loading range from .58 to .81, while it was found through the factor analysis of the SPANE-N that one factor contributed to 53% of the variance with a loading range from .49 to .78 (Diener et al., 2010). Aryanto (2018) translated the SPANE from English into Indonesian using the same procedures described in the previous section for the FS.
The Patient Health Questionnaire 9
The Patient Health Questionnaire 9 (PHQ-9) is an instrument used for assessing depressive symptoms. Kroenke et al. (2001) stated that the PHQ-9 is a reliable and valid diagnostic instrument for measuring the degree of respondents’ depression. The scale consists of nine items, in which each item is responded to on a scale from zero (not at all) to three (nearly every day). Thus, the possible total-score can range from zero to 27, indicating no depressive symptoms to serious depressive symptoms respectively. One example item for the PHQ-9 is “Over the last 2 weeks, how often have you been bothered by the following problems? Little interest or pleasure in doing things, feeling down, depressed or hopeless”.
Dian et al. (2022) translated the PHQ-9 from English into Indonesian involving two translators using a forward-translation method. After reaching co-validating the translation, the results were back-translated. The results of the back-translation were then compared with the initial scale to ensure a similarity of meaning. The PHQ-9 scale was found to have an alpha coefficient of .885 (Dian et al., 2022).
Analysis
Internal consistency was applied to estimate the reliability of the FS. Internal consistency is a type of reliability that is determined for measurements involving multiple items (Gravetter & Forzano, 2012). The internal consistency of the FS scale was analyzed using the Cronbach Alpha coefficient on the SPSS AMOS-24 statistical software. The Cronbach’s alpha coefficient values range between 0 - 1.00, where high coefficient values indicate a high degree of internal consistency or reliability.
The internal structure of the FS was examined through CFA to confirm the single-factor model. Multi-Group-Confirmatory Factor Analysis (MG-CFA) was performed in order to examine any invariance between the subsamples. The CFA and MG-CFA were performed using SPSS AMOS-24 statistical software.
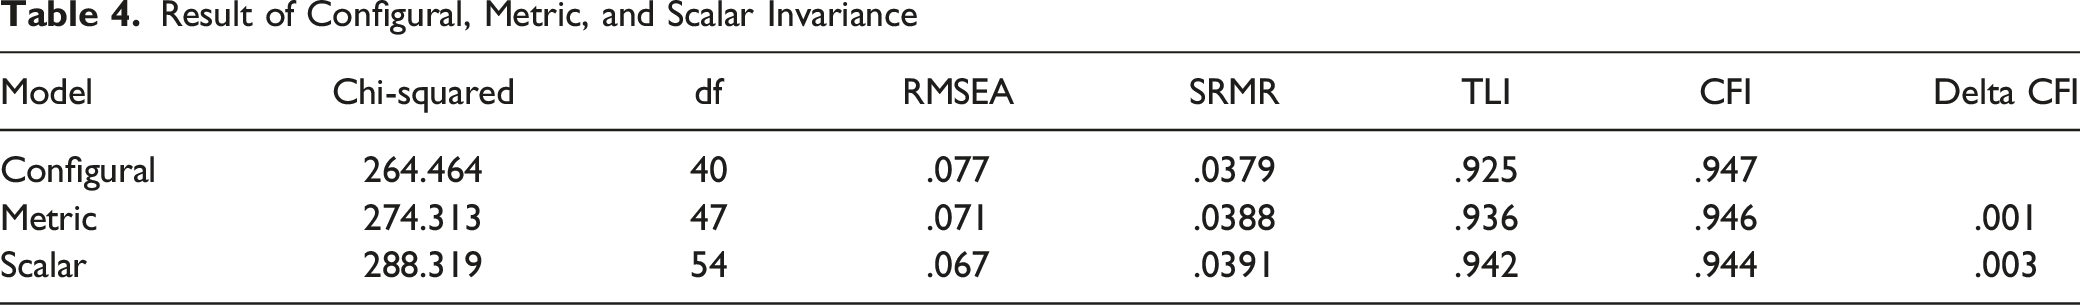
The MG-CFA was conducted in order to test for any invariance in the items based on the recommendations of Byrne (2016). Initially the baseline model for the Java-Bali and non-Java-Bali samples was tested for in order to determine the best fit model for the two groups separately. The different models included a configural model, in which no equality constraint was imposed on the data; a metric invariant model, in which the loading factors were constrained equally across the groups then estimated; and a scalar invariant model, in which factor loading and intercepts were constrained in order to be equally assessed. All tests for equality were compared against the configural model.
The model fit for the CFA and MG-CFA was assessed using several goodness-of-fit indices: the Chi-squared (χ2), the Root Mean Square Error of Approximation (RMSEA), the Standardized Root Mean Square Residual (SRMR), the Comparative Fit Index (CFI), the Goodness of Fit Index (GFI), and the Lewis Tuker Index (TLI). Values greater than .90 indicate a good fit for the CFI, GFI, and TLI, while for the RMSEA and SRMR, values lower than .08 indicate a good fit (Hu & Bentler, 1999). Differences found on the CFI were used to determine invariance, which is indicated by the difference in the CFI values, which do not exceed .01 (Cheung & Rensvold, 2009).
Convergent validity involves applying two different scales to measure the same construct and determines the existence of any strong relationships between the scales (Gravetter & Forzano, 2012). In this study, convergent validity was analyzed through assuming a correlation between the FS and SPANE, as well as PHQ-9. The FS was predicted to have a positive correlation with the SPANE-P because the two instruments measure individual well-being. On the contrary, the FS was predicted to have a negative correlation with the SPANE-N and PHQ-9 because they measure opposite conditions.
Results
Out of the 1179 respondents who participated in this study, 50 did not fill out the google form completely, and thus were excluded from the analysis. The total remaining (N = 1129) respondents in this study were between the ages of 12–65 years old (M = 21.09; SD = 7.33). The identified gender of the respondents was 831 (74%) women, and 298 (26%) men. Sample 1 consisted of 741 respondents (76.5% females, M age = 21.92, SD age = 8.748, age range = 12 – 62. Sample 2 consisted of 388 respondents (68% females, M age = 23.48, SD age = 9.020, age range = 15 – 65).
Descriptive Statistics
Reliability
Factor Loading & Corrected Item-Total Correlation Coefficient
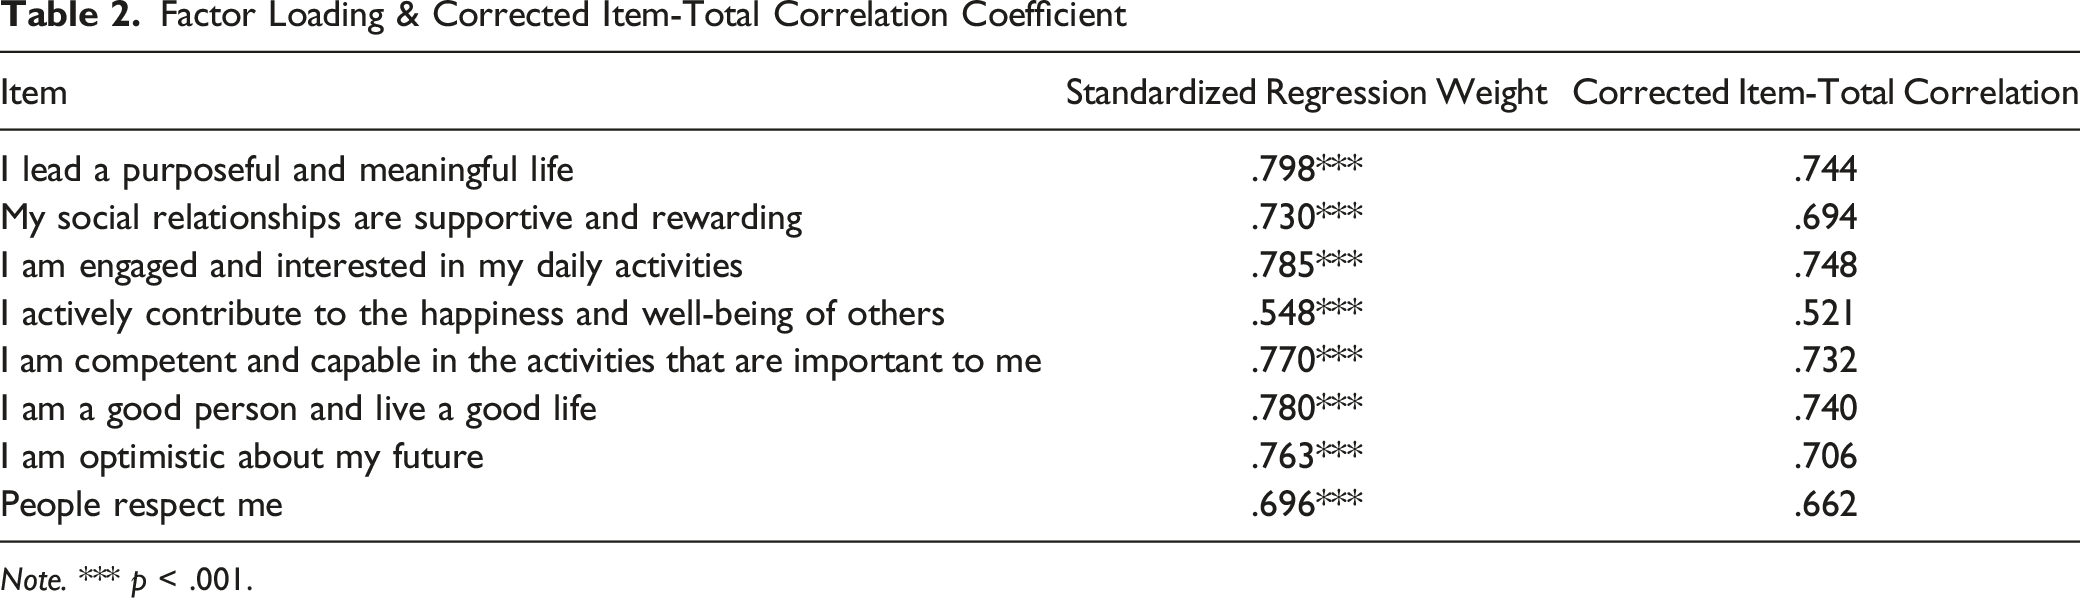
Note. *** p < .001.
Confirmatory Factor Analysis of the FS
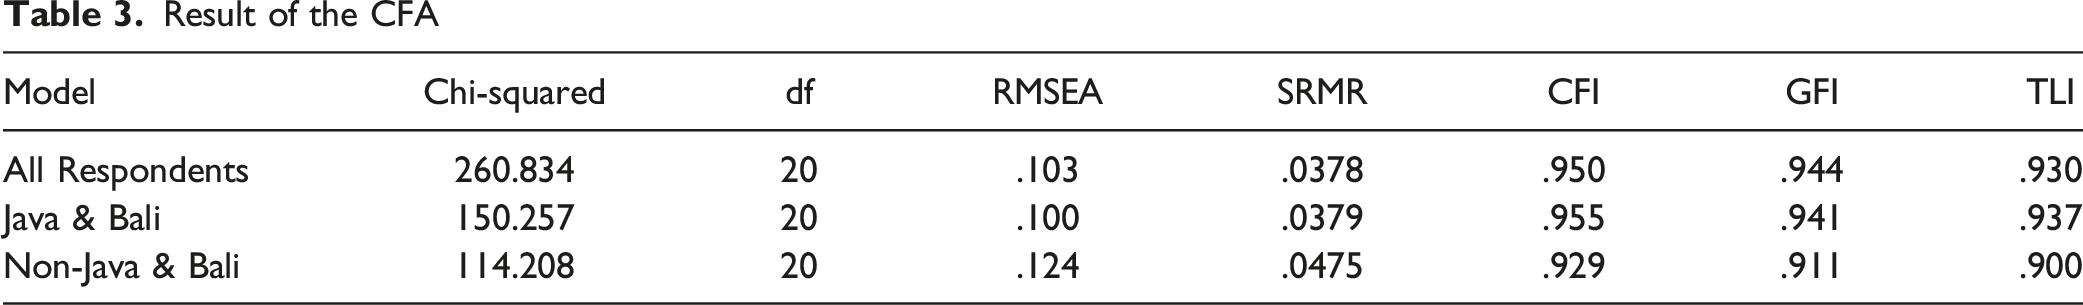
Result of the CFA
The factor loadings for each item ranged from .548 to .798. The factor loading of all items was significant at p < .01 (Table 2).
Multi-Group Confirmatory Factor Analysis of the FS
Further analysis was conducted for determining FS invariance across the subsamples. In order to establish a well-fitting baseline model for each group separately, a CFA was conducted for sample 1 (n = 741) and sample 2 (n = 388). Table 2 shows the CFA results for the two samples. The CFI, GFI, and TLI values for both models were found to be a good fit (>.90). Likewise, the SRMR values were less than .08 for both samples. However, the RMSEA value for both samples was higher than .08.
Result of Configural, Metric, and Scalar Invariance
Convergent Validity
A significant correlation exists between the FS, SPANE, and PHQ-9 (Table 5). The FS score was found to be positively correlated with the SPANE-P score (r = .600, p < .01), and negatively correlated with the SPANE-N (r = − .364, p < .01) and PHQ-9 scores (r = − .659, p < .01). This confirms the convergent validity of the FS.
Discussion
The aim of this study was to explore the psychometric properties of the Indonesian version of the FS, namely reliability and validity. The Cronbach’s Alpha reliability coefficient for the FS was found to be .903. According to Gable and Wolf (1993) good affective instruments report reliability as low as .70, therefore the FS has good reliability. The reliability scores determined in this study support the findings, mentioned in the literature review, of the previous studies conducted in Japan (Sumi, 2014), Portugal (Silva & Caetano, 2013), and New Zealand (Hone et al., 2013), in which the majority of the Cronbach’s Alpha coefficient scores were higher than .80.
It was confirmed through the factor analysis the fitness of the single-factor model for the FS. The results of this study align with those of previous studies (Checa et al., 2018; Diener et al., 2010; Giuntoli et al., 2017; Howell & Buro, 2015; Silva & Caetano, 2013; Villieux et al., 2016), which reveal the unidimensionality of the FS. Thus, it has been confirmed that all the items included in the FS measure a single construct, namely well-being.
The single-factor model of the FS is supported by the factor loading of each item. The factor loading of the FS ranges from .548 to .798. Items with a high factor loading denote a high contribution to the FS and vice versa. The item with the highest loading factor (λ = .798) was ‘I lead a purposeful and meaningful life’, while the item with the second highest loading factor (λ = .785) was ‘I am engaged and interested in my daily activities’. Both of the item statements emphasize the importance in understanding oneself by recognizing life goals and daily activities. On the other hand, the item with the lowest factor (λ = .548) loading was ‘I actively contribute to the happiness and well-being of others’, while the item with the second lowest loading factor (λ = .698) was ‘People respect me’. Both of these items emphasize the importance of having social relationships with other people.
It is evident that the results of MG-CFA refer to a structure invariance in the responses of the Java-Bali and non-Java-Bali participants. Therefore, it can be concluded that flourishing is capable of being measured with equal accuracy in both samples using the FS. Such measurement invariance was also found in De la Fuente et al. (2017) study, which involved the comparison of two samples from different locations. Measurement invariance has also been found for the FS related to gender (Carmona-Halty et al., 2022; Martín-Carbonell et al., 2021; Romano et al., 2020; Tan et al., 2021).
The FS scale structure was found to be invariant between the Java-Bali and non-Java-Bali samples. This means that the items of the FS scale were interpreted equally in both sub-samples. Differences in the participants’ backgrounds, between the two samples, were not found to affect the way that they interpreted the FS items. This implies that the FS can be used to determine the well-being of Indonesian people.
The convergent validity of the scale was analyzed by comparing the FS with the SPANE and PHQ-9. It was found that the FS scale was positively correlated with the SPANE-P, while negatively correlated with the SPANE-N and PHQ-9. The positive correlation indicates that the individuals who reported having a high well-being experienced positive feeling over the weeks leading up to completing the FS. On the other hand, the negative correlation indicates that the individuals who reported having a low well-being experienced negative feeling over the weeks leading up to completing the FS, as well as the presence of depressive symptoms.
Therefore, a negative correlation between flourishing and depression has been determined through this study. Keyes (2002) emphasized that flourishing conditions are associated with superior psychosocial functioning profiles. In contrast, individuals who experience low levels of well-being were referred to as languishing; those who experience languishing in life are prone to develop major depression. Individuals who experienced languishing and depression were associated with significant psychosocial disturbances in terms of perceived emotional health and limitations in their daily activities (Keyes, 2002).
Experiences of well-being include negative as well as positive emotions (Diener et al., 2009). According to Fredrickson (2001), negative emotions contribute to how individuals adapt to life-threatening situations, while positive emotions contribute to an individual’s capacity to act in particular. Therefore, well-being is determined by how an individual manages his/her positive and negative emotions (Gross & John, 2003).
Limitations
This study was conducted during the COVID-19 pandemic, during which the Indonesian government implemented social restriction policies that limited community on Java and Bali Islands (Kominfo, 2021; Royani, 2021). The restriction was made in consideration of the population size and economic activity of Java and Bali. Therefore, COVID-19 is considered as a potential confounding variable in the study and could have negatively impacted how the participants responded to the FS. Similarly, Graham and Eloff (2022) found that college students who responded to the FS indicated experiencing a decrease in well-being before and during the pandemic. These findings are further reinforced by Nyunt et al. (2021) who used the FS to assess college students’ sense of well-being, of which they responded to experiencing a significant decrease in from before and after the onset of the pandemic during the school semester.
Result of the Correlation Analysis
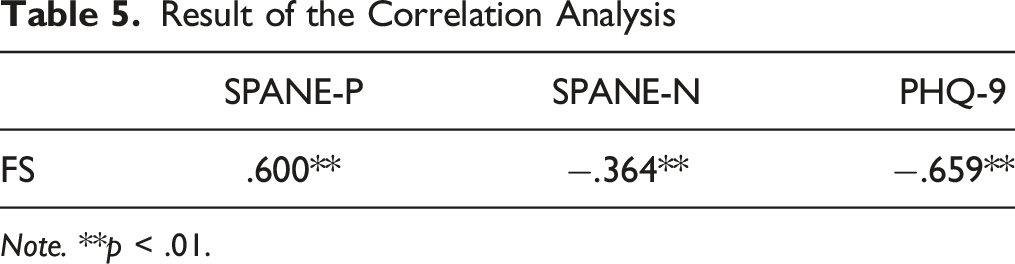
Note. **p < .01.
Recommendation
A good psychological instrument comprises many types of validity, which are evidenced by data related to: test content, response process, internal structure, relationships to other variables, and testing consequences (AERA, APA, NCME, 2014). The response process and consequences of using the FS need to be considered in order to strengthen the existing evidence of validity. Moreover, the test–retest reliability of the FS Indonesian version should be evaluated in further research.
In conclusion, the results of this study indicate that the Indonesian version of the FS has good psychometric properties which include reliability, internal structure, and convergent validity. Therefore, this version of the FS can be used as a measure of well-being for Indonesian people.
Footnotes
Declaration of Conflicting Interests
The author(s) declared no potential conflicts of interest with respect to the research, authorship, and/or publication of this article.
Funding
The author(s) disclosed receipt of the following financial support for the research, authorship, and/or publication of this article: This work was supported by Research and Community Service (LPPM) Udayana University, awarded to Dr. Tience Debora Valentina and Dr. Firmanto Adi Nurcahyo [Decree of the Rector of Udayana University No. 668/UN14/HK/2023].