
Abstract
Cancer health disparities persist across the cancer care continuum despite decades of effort to eliminate them. Among the strategies currently used to address these disparities are multi-institution research initiatives that engage multiple stakeholders and change efforts. Endemic to the theory of change of such programs is the idea that collaboration—across institutions, research disciplines, and academic ranks—is necessary to improve outcomes. Despite this emphasis on collaboration, however, it is not often a focus of evaluation for these programs and others like them. In this paper we describe a method for evaluating collaboration within the Meharry-Vanderbilt-Tennessee State University Cancer Partnership using network analysis. Specifically, we used network analysis of co-authorship on academic publications to visualize the growth and patterns of scientific collaboration across partnership institutions, research disciplines, and academic ranks over time. We presented the results of the network analysis to internal and external advisory groups, creating the opportunity to discuss partnership collaboration, celebrate successes, and identify opportunities for improvement. We propose that basic network analysis of existing data along with network visualizations can foster conversation and feedback and are simple and effective ways to evaluate collaboration initiatives.
Keywords
Background and Introduction
Cancer Health Disparities and Research Partnerships
Cancer is the second leading cause of death in the United States, affecting over two million people in 2022 alone (Siegel et al., 2022). A disproportionate number of cancer-related burdens fall on minoritized racial and ethnic populations (Siegel et al., 2022). For example, Black men have higher incidence rates of prostate cancer than White men while Hispanic and Black women have higher incidence rates of cervical cancer than White women; death rates from prostate and cervical cancer are also higher among these populations relative to those of Whites (Cancer Health Disparities Research, 2018). Minoritized populations are also substantially underrepresented in cancer clinical trials, impacting their access to potentially effective drugs and other treatments (Duma et al., 2018; Robinson & Trochim, 2007; Shavers-Hornaday et al., 1997). Reviews and scholarly cases have shown that the causes of cancer-related health disparities are complex, being linked, for example, to social determinants of health like lack of access to timely, high-quality preventive care (Gerend & Pai, 2008; Tucker-Seeley, 2021) and to biological factors like the genetic predisposition to some cancers among some ancestry groups (Ellsworth et al., 2019).
In recognition of the complexity of health disparities research around cancer and other chronic and acute health conditions, such research is increasingly conducted through collaborative, “team science” partnerships that involve multiple investigators, institutions, and/or research disciplines (Hall et al., 2018; Wooten et al., 2014). Some of the known benefits of collaborative research include accelerated knowledge production and an enhanced ability to translate scientific knowledge into effective solutions (Liu et al., 2020). Thus, consistently incorporating collaboration into the theories of change that undergird health disparities research programs could hasten progress toward eliminating cancer health disparities.
The Meharry-Vanderbilt Cancer Partnership (later the Meharry-Vanderbilt-TSU Cancer Partnership, or MVTCP) was established in 1999 to facilitate collaborative cancer research. The partnership won inaugural funding from the Comprehensive Partnerships to Advance Cancer Health Equity (CPACHE) Program in 2001 and has operated continuously since that time (Pal et al., 2022). The CPACHE program is one of several National Cancer Institute (NCI) initiatives focused on reducing health disparities among racially and ethnically minoritized populations. Like all CPACHE sites, the MVTCP consists of institutions that serve underserved health disparity populations and underrepresented students (ISUPSs) (Meharry Medical College and Tennessee State University) and an NCI-designated Comprehensive Cancer Center (the Vanderbilt Ingram Cancer Center).
Institutions that comprise each CPACHE site are expected to collaborate with one another to: (1) increase the research and cancer education capacity of the institutions that serve underserved populations and underrepresented students, (2) increase the number of minoritized students and investigators engaged in cancer and/or health disparities research, (3) increase the effectiveness of health disparities research programs at the Comprehensive Cancer Centers, and (4) engage in cancer-related activities that benefit local underserved communities (National Cancer Institute, n.d.). As these goals suggest, the expectation for collaboration within CPACHE sites is both an intermediate outcome of the program (that is, the program itself is intended to produce and facilitate collaboration) and a mechanism through which cancer and health disparities outcomes are expected to change in the long run. (In this paper we focus on collaboration as an intermediate outcome, as this is mostly within the purview of program managers and leaders while the longer-term impacts of collaboration on cancer and health disparities often are not.) The MVTCP pursues these goals through “cores” and “projects,” most of which involve a faculty lead from each of the three institutions. The projects include 3–4 full and pilot research projects that are selected through a competitive application process and funded for 2.5 years of the 5-year grant cycle. Projects must include at least one investigator from at least two of the institutions, with preference given to projects that include investigators from all three institutions. The cores include three that are required for all CPACHE sites (Cancer Outreach Core, Research Education Core, and Planning and Evaluation Core) and three cores that exist to support the MVTCP projects and otherwise develop research infrastructure at the ISUPS institutions (Biostatistics Core, Translational Pathology Shared Resource Core, and Population Research and Clinical Trials Core). Beyond the leadership of these cores, faculty and students from all three institutions are engaged through research project opportunities, core participation, and core services.
Roles of Collaboration in Research Partnerships
As we subsequently describe, literature on collaborative research suggests that at least four types of collaboration are suited to achieving CPACHE goals: interinstitutional collaboration (i.e., collaboration between academic institutions), interdisciplinary collaboration (i.e., collaboration between research disciplines), cross-rank collaboration (i.e., collaboration between faculty members and students or between mentors and mentees more generally), and community-university collaboration (i.e., collaboration that recognizes the expertise and priorities identified by non-academic members of communities most affected by cancer health disparities). Combining all four forms of collaboration at each CPACHE site is desirable, as each supports different components of CPACHE program goals. For example, research collaborations between different institutions are often more productive and impactful than single-institution efforts, in part due to their ability to leverage different institutional strengths and forms of capital (Hall et al., 2018). Combining the expertise and experiences of different disciplines has been shown to produce more innovative solutions (Wooten et al., 2015) and novel technologies (Lee et al., 2015) as well as lead to greater numbers of publications, a more diverse range of publication venues, and higher citation counts (Hall et al., 2018). Collaboration between faculty and students via formalized mentoring programs increases the persistence, academic achievement, and research productivity of students, particularly those who have been historically marginalized in higher education and/or science (Viets et al., 2009). Community-university collaborations can be effective in improving diversity in study populations (De Las Nueces et al., 2012; Moreno-John et al., 2004) and facilitating the translation of research into practice (Cashman et al., 2008).
Given the roles that collaboration may play in achieving CPACHE goals, understanding if and to what extent collaboration occurs at CPACHE sites is a critical dimension of site evaluations. We suggest not only that collaboration should be formally measured as part of site evaluations but also that each type of relevant collaboration (interinstitutional, interdisciplinary, and cross-rank) be formally evaluated and monitored. As we show below, this can be accomplished through network analysis. Moreover, network analysis may be an especially attractive method for evaluating CPACHE collaborations because it can be conducted with publication data that are already collected and reported in annual CPACHE Research Performance Progress Reports (RPPRs). Publication data, in general, provide insight into a research program’s progress (Behar-Horenstein et al., 2022; Birnholtz et al., 2013; Dhand et al., 2016; Sud & Thelwall, 2016). When publication data are analyzed as a network, this insight is expanded to include the type(s) and extent of collaborations that undergird research progress. Relative to network analyses that rely on self-reported data from network members, those based on publications are less burdensome to participants and may have added benefits like reduced non-response bias. We address several limitations of using publication data to evaluate research collaborations in the discussion section.
Methods
Data Construction
Publication citations are the primary data source for this analysis. Publication co-authorship serves as the primary indicator of collaboration between investigators from different MVTCP institutions, disciplines, and ranks. Because bibliometric analyses are not well suited to measuring community-university collaborations, we have not included that domain of collaboration in this study despite recognizing its importance to the partnership. In order to enumerate all publications related to the MVTCP, we began by creating a list of all MVTCP-affiliated investigators from the program’s inception until the beginning of this study (2020). The list was compiled from administrative records and included the investigator’s name, institutional affiliation (i.e., Meharry Medical College, Tennessee State University, Vanderbilt), and years of MVTCP involvement. A data analytics team then generated a list of all publications indexed in PubMed for all investigators during the years they were involved plus two (in order to adjust for extended publication timelines). Publication citations were then piped into REDCap, an electronic data capture tool hosted at Vanderbilt University (Harris et al., 2009, 2019), through which investigators confirmed that the publication belonged to them and indicated if and how the publication was related to MVTCP work. Specifically, investigators indicated whether each publication was (1) health disparities and/or cancer relevant and (2) connected to their work with the MVTCP (e.g., used an MVTCP core to support the research reported in the paper or the investigator’s salary was supported by the MVTCP). Publications identified as relevant (i.e., cancer health disparities related) and MVTCP-supported (i.e., developed using MVTCP funding, personnel, or resources) were included in the network analysis. The same general process was repeated to identify the publications of MVTCP-affiliated students. We restricted the analysis to publications from 2009 onward because 2009 was the year in which Tennessee State University (TSU) was first engaged as a collaborative partner. (TSU was included as an officially funded partner institution in the grant cycle beginning in 2011; see Pal et al., 2022). The final analytic sample consisted of 323 unique publications from 362 unique investigators and students.
Data on individual investigator’s characteristics were constructed from publicly available sources, including institutional web pages, online CVs, and LinkedIn profiles. For each year that an investigator was affiliated with the MVTCP, we collected the following: 1. Institutional affiliation (i.e., Meharry Medical College, TSU, or Vanderbilt) 2. Departmental affiliation (used to approximate and assign discipline) 3. Rank (e.g., Assistant Professor, student)
For investigators with ties to more than one MVTCP institution, the primary institution (e.g., place of tenured professorship) was recorded. The rank of graduate research assistants was recorded as “student.” Because all the above were gathered from existing data sources, there were no missing values with the exception of disciplines for high school and undergraduate students, all of which were coded as “not applicable.”
Disciplines were operationalized based on departmental affiliations. Four of the six disciplines included in the analysis—Basic, Clinical, Translational, and Population—are identical to the broad types of cancer research defined by NCI. Two others—Behavioral and Other—were added in order to have adequate coverage for all MVTCP investigators, some of whom are trained in disciplines like Health Education and Behavior. All high school and undergraduate student co-authors were assigned “not applicable” as their disciplinary affiliation, as we understand these students to be exploring their disciplinary and professional identities. Thus, 43 high school and undergraduate student co-authors had missing disciplinary affiliation, which comprised the only missing data in the networks. The first author (GML) made the initial coding decisions about investigators’ disciplinary affiliations. Her work was reviewed by the senior author (SVS). We recognize that this is an imperfect method for developing and assigning disciplinary categories. However, it reflects the main disciplinary categories requested in NCI grant reporting and allowed us to determine disciplinary categories for all authors regardless of their continued affiliation or contact with the partnership.
Network Analysis
Networks are spatial and mathematical representations of structures that form as a result of connections or “ties” between people, organizations, and other types of actors. Networks can be described with general descriptive measures (e.g., size, total number of ties), connectedness among actors (e.g., density), and strength of ties (e.g., the total number of ties between actors in a dyad). Individual actors within a network can be described in terms of their total number of unique connections within the network (i.e., degree) and/or their centrality (e.g., bridge, broker) (Borgatti et al., 2018; De Nooy et al., 2018; Freeman et al., 1979; Valente, 2010). Linking the characteristics of network actors to some of these measures may also be used to predict actor influence within the network (Birnholtz et al., 2013; Dhand et al., 2016; Gehlert et al., 2015).
Interpretations of network measures vary considerably among networks that define ties and actors differently (Pan & Saramäki, 2012). For example, in networks in which a tie between two actors represents a social connection like friendship, a dense network might be interpreted as one in which resources and information can be rapidly disseminated between different parts of the network structure (Smith & Christakis, 2008); this interpretation is consistent with the supportive function of friendship networks and the tendency of socially-connected actors to be geographically proximal (Liben-Nowell et al., 2005). In a network in which a tie represents co-authorship on a research article, however, it is knowledge and expertise rather than information that “flow” through the network. Accordingly, high density might indicate that research teams within the network are highly specialized (Moody, 2004), especially if the global network is also highly clustered. High network density as an indicator of high specialization does not suggest the ability to disseminate knowledge rapidly throughout a network, as specialization is also associated with knowledge silos and with efficient—rather than effective (i.e., performance enhancing)—knowledge transfer (Chinowsky et al., 2010). As this example suggests, interpreting network measures is a nuanced task that involves attention to operational decisions, decisions about structural representation, statistical properties, topology, and many other factors (Eisenberg & Swanson, 1996; Kadushin, 2012).
We agree with Eisenberg and Swanson’s (1996) proposal that within a program evaluation, interpreting network measures also requires keen attention to program context. Relative to the social sciences, program evaluation is often more idiographic (Scriven, 2007) and driven by the need for local knowledge production. This need for particular, rather than general, knowledge produces a premium on highly contextualized explanations and interpretations. In a program evaluation, for example, a publication network that is both dense and inter-institutional might be interpreted as an indication that barriers to collaboration across institutional and geographic boundaries (known challenges to inter-institutional work; Hall et al., 2018) have been effectively mitigated by program and/or institutional affordances.
This study focuses on measures of total network size, number and strength of ties, and network density with particular emphasis on describing network measures in relation to actors’ institutional affiliations, disciplines, and ranks. In this study, each publication that is directly related to the MVTCP is considered a tie between the co-authors. Measures are analyzed longitudinally, and interpretations are tailored to reflect the institutional and research contexts in which the network is located. Emphasizing select measures and context has generated results with the most bearing on local decision-making, an outcome consistent with practices that we as evaluators find most conducive to program monitoring and improvement. Our approach is similar but not identical to that of evaluators who advocate for mixed methods approaches to assessing and evaluating multidisciplinary, translational teams (e.g., Wooten et al., 2014). The difference primarily lies in our explicitly prioritizing the function of an evaluation over its form in the pursuit of “maximally useful” evidence about a program, as recommended by Cronbach and Shapiro (1982, p. 1). One concrete example of prioritizing maximum usefulness was the forgoing of more advanced social network analyses like as the exponential random graph model and the stochastic actor-oriented model (Block et al., 2019). Although these types of models provide uniquely meaningful insights, they require advanced training and may therefore be a barrier to the use of network data in interdisciplinary, applied contexts. We argue that even descriptive network data collected and monitored as we have done can provide sufficient insight for evaluators and meaningful visualizations for stakeholders. The conversations and insights gleaned from sharing findings and diagrams with the internal and external advisory committees (described more below) supported this approach.
We use the standard definition of network size to indicate the total number of actors in the network and the standard definition of density to indicate the total number of edges (i.e., dyad linkages or ties) in the network divided by the total number of possible edges in the network. Tie strength is a dyad-level characteristic that refers to the total number of ties between members of a dyad and can exceed one in this data set. Nodes are individual investigators/students with at least one MVTCP-related co-authored publication in the specified year; investigators and students with no MVTCP-related co-authored publications in a particular year were not included in the analysis for that year and thus do not affect density calculations. Ties between authors represent co-authored publications. All network diagrams (i.e., sociograms) were created in Gephi; nodes have been color-coded by institution, discipline, and rank.
Interpretive Discussions
Given the importance of stakeholder interpretation and program context for making sense of network data in evaluative contexts, the evaluation team presented our findings and network diagrams to the partnership’s internal and external advisory committees. The internal advisory committee comprises faculty from all three institutions who serve in a leadership role for various aspects of the partnership (i.e., PIs, Core leaders, or Project leaders). This group meets monthly. The meeting at which we presented the network analysis was held via Zoom, enabling all participants to view the network diagrams on their personal computers and to participate in a collective conversation about what they saw and how to interpret it. We then shared the network diagrams and interpretations with our external advisory committee at an annual meeting. Although there was less discussion regarding the network analysis with this group, they nevertheless used the findings to make recommendations for the partnership. We documented these discussions and recommendations and have included them in our findings section. We also discuss how data interpretation informed program planning and improvement.
Findings
The size and composition of the MVTCP network have undergone substantial but uneven changes over time. Many of these changes are aligned with CPACHE goals, and thus presenting the findings to MVTCP advisory committees was an opportunity to provide novel evidence of partnership effectiveness. Equally important, presentations to advisory committees led to actionable insights for specific program improvements.
The MVTCP Network Over Time
MVTCP Co-Authors, Publications, and Network Density by Year.
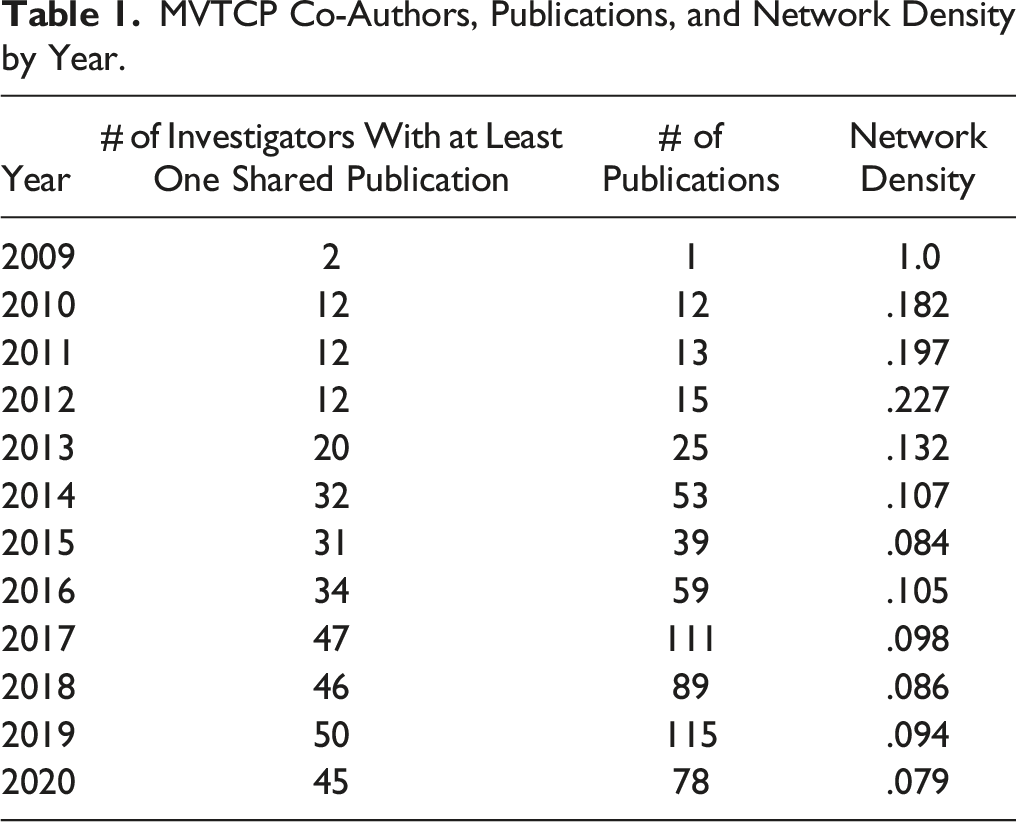
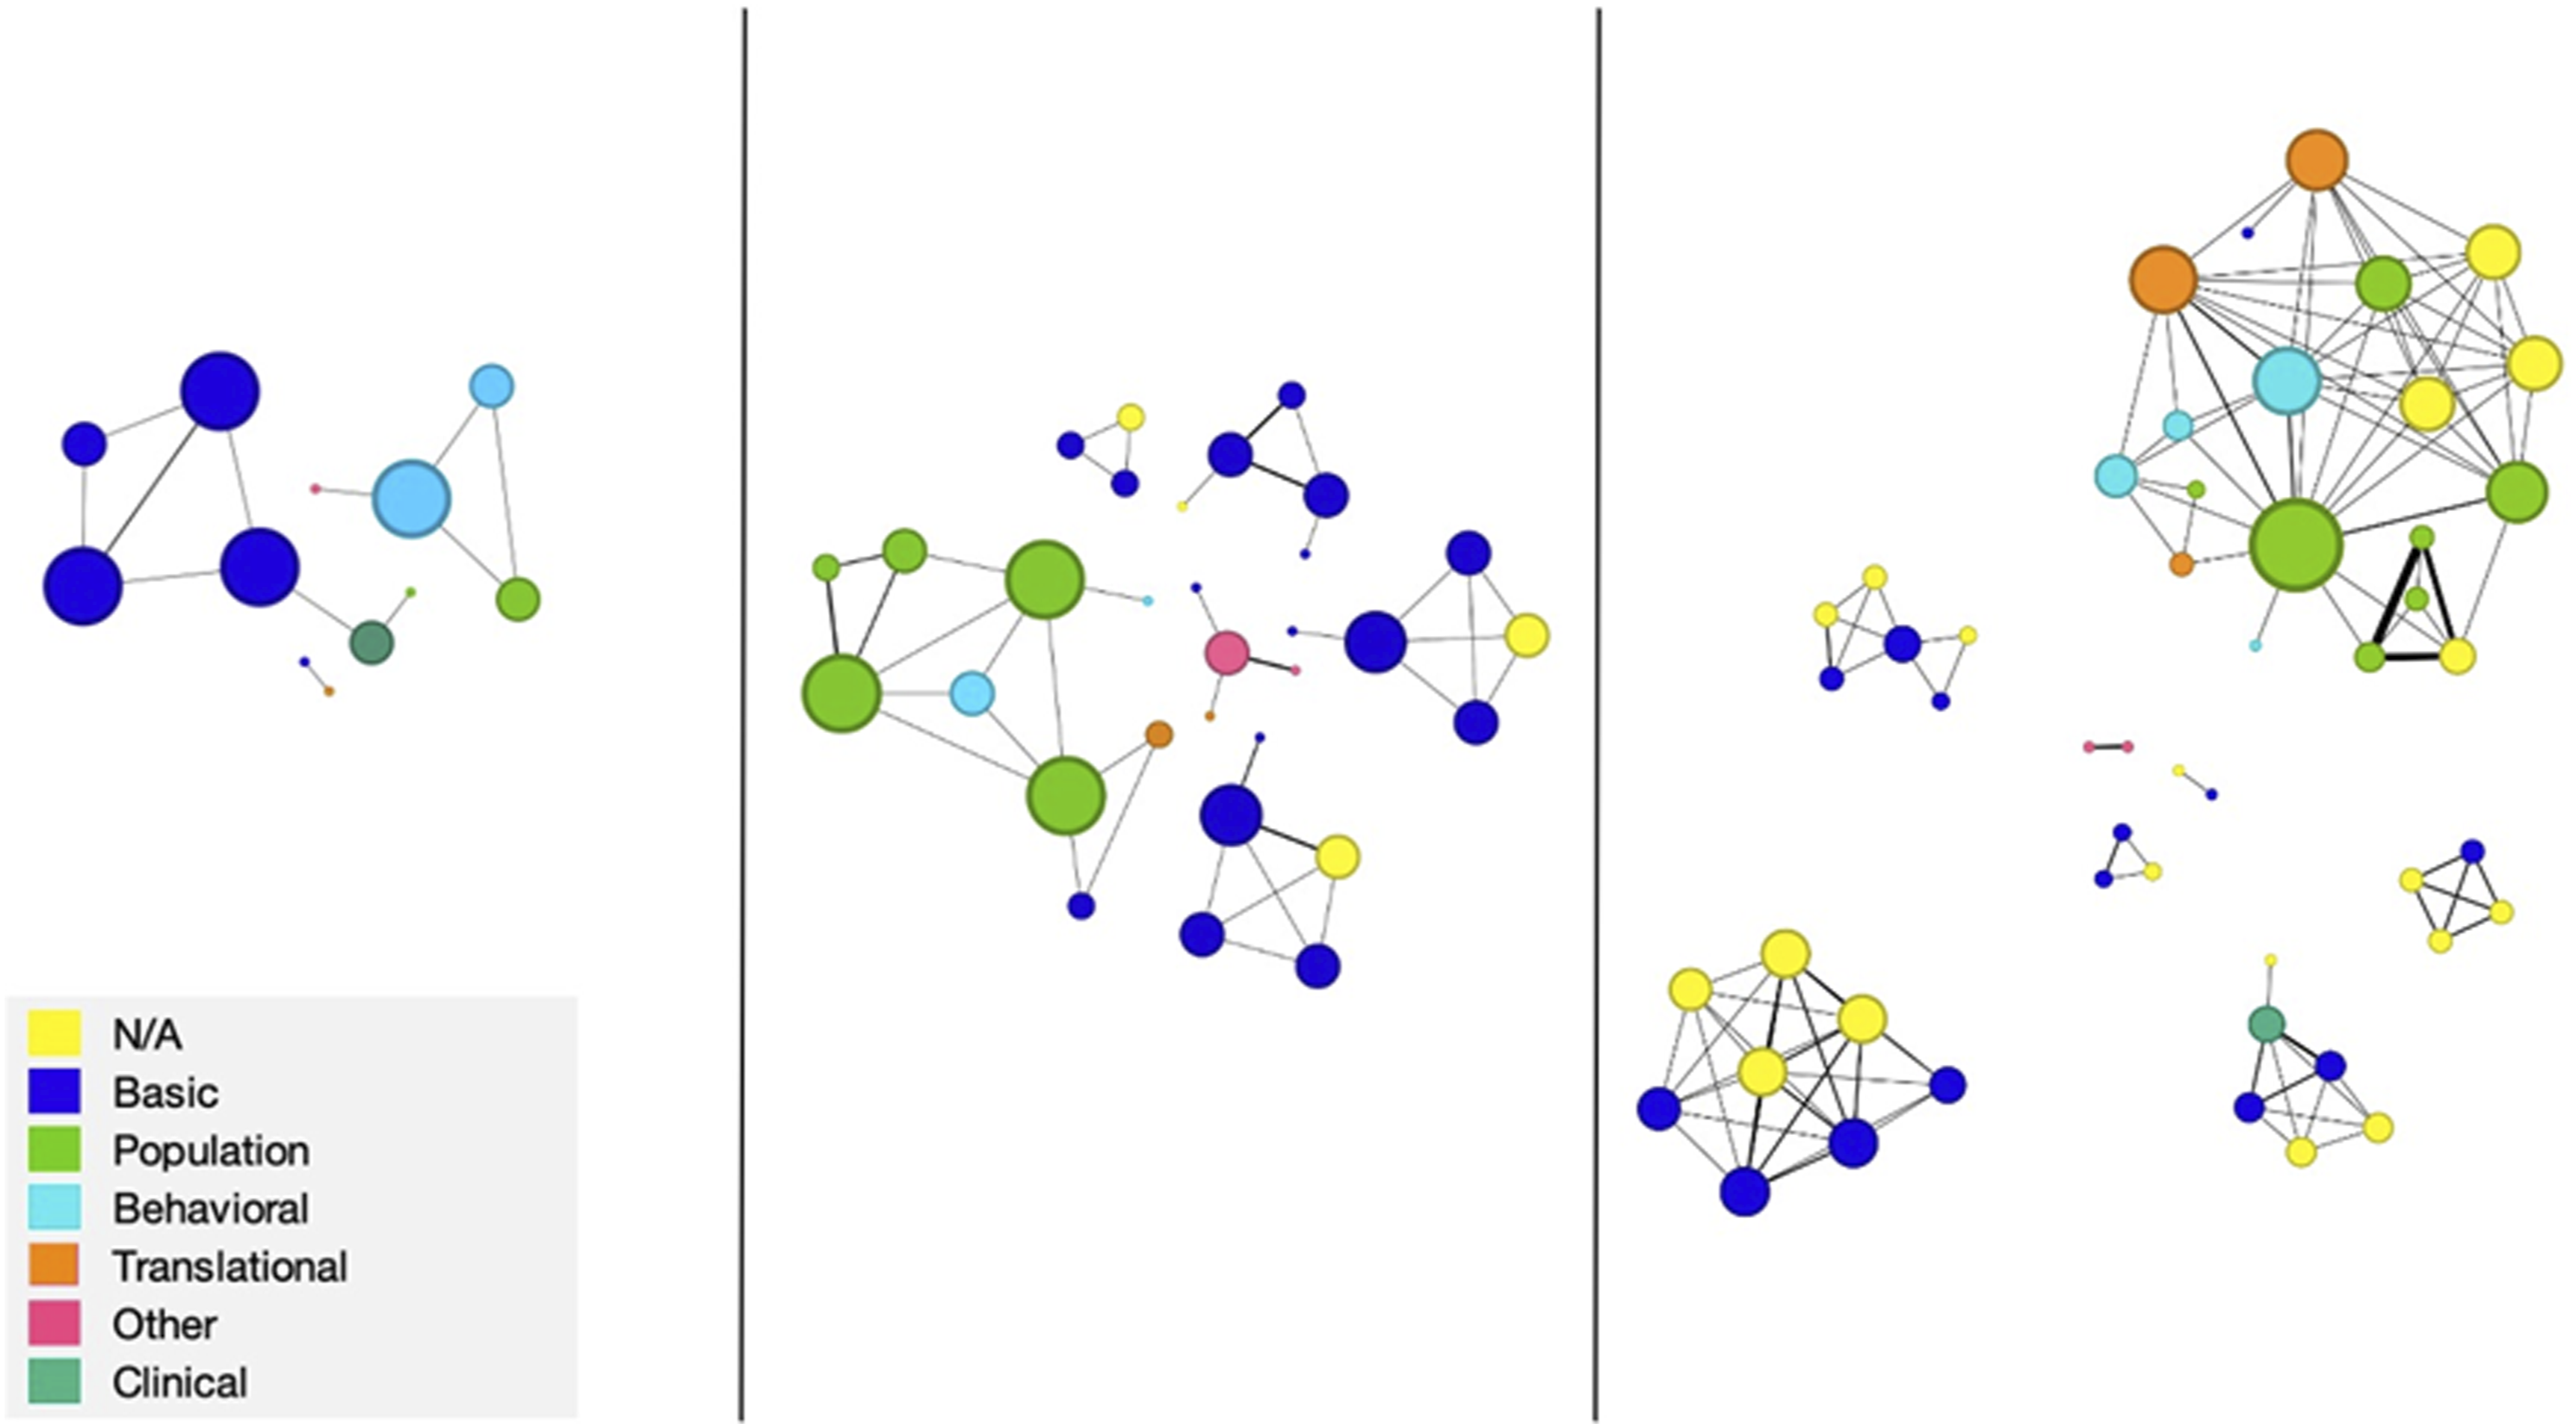
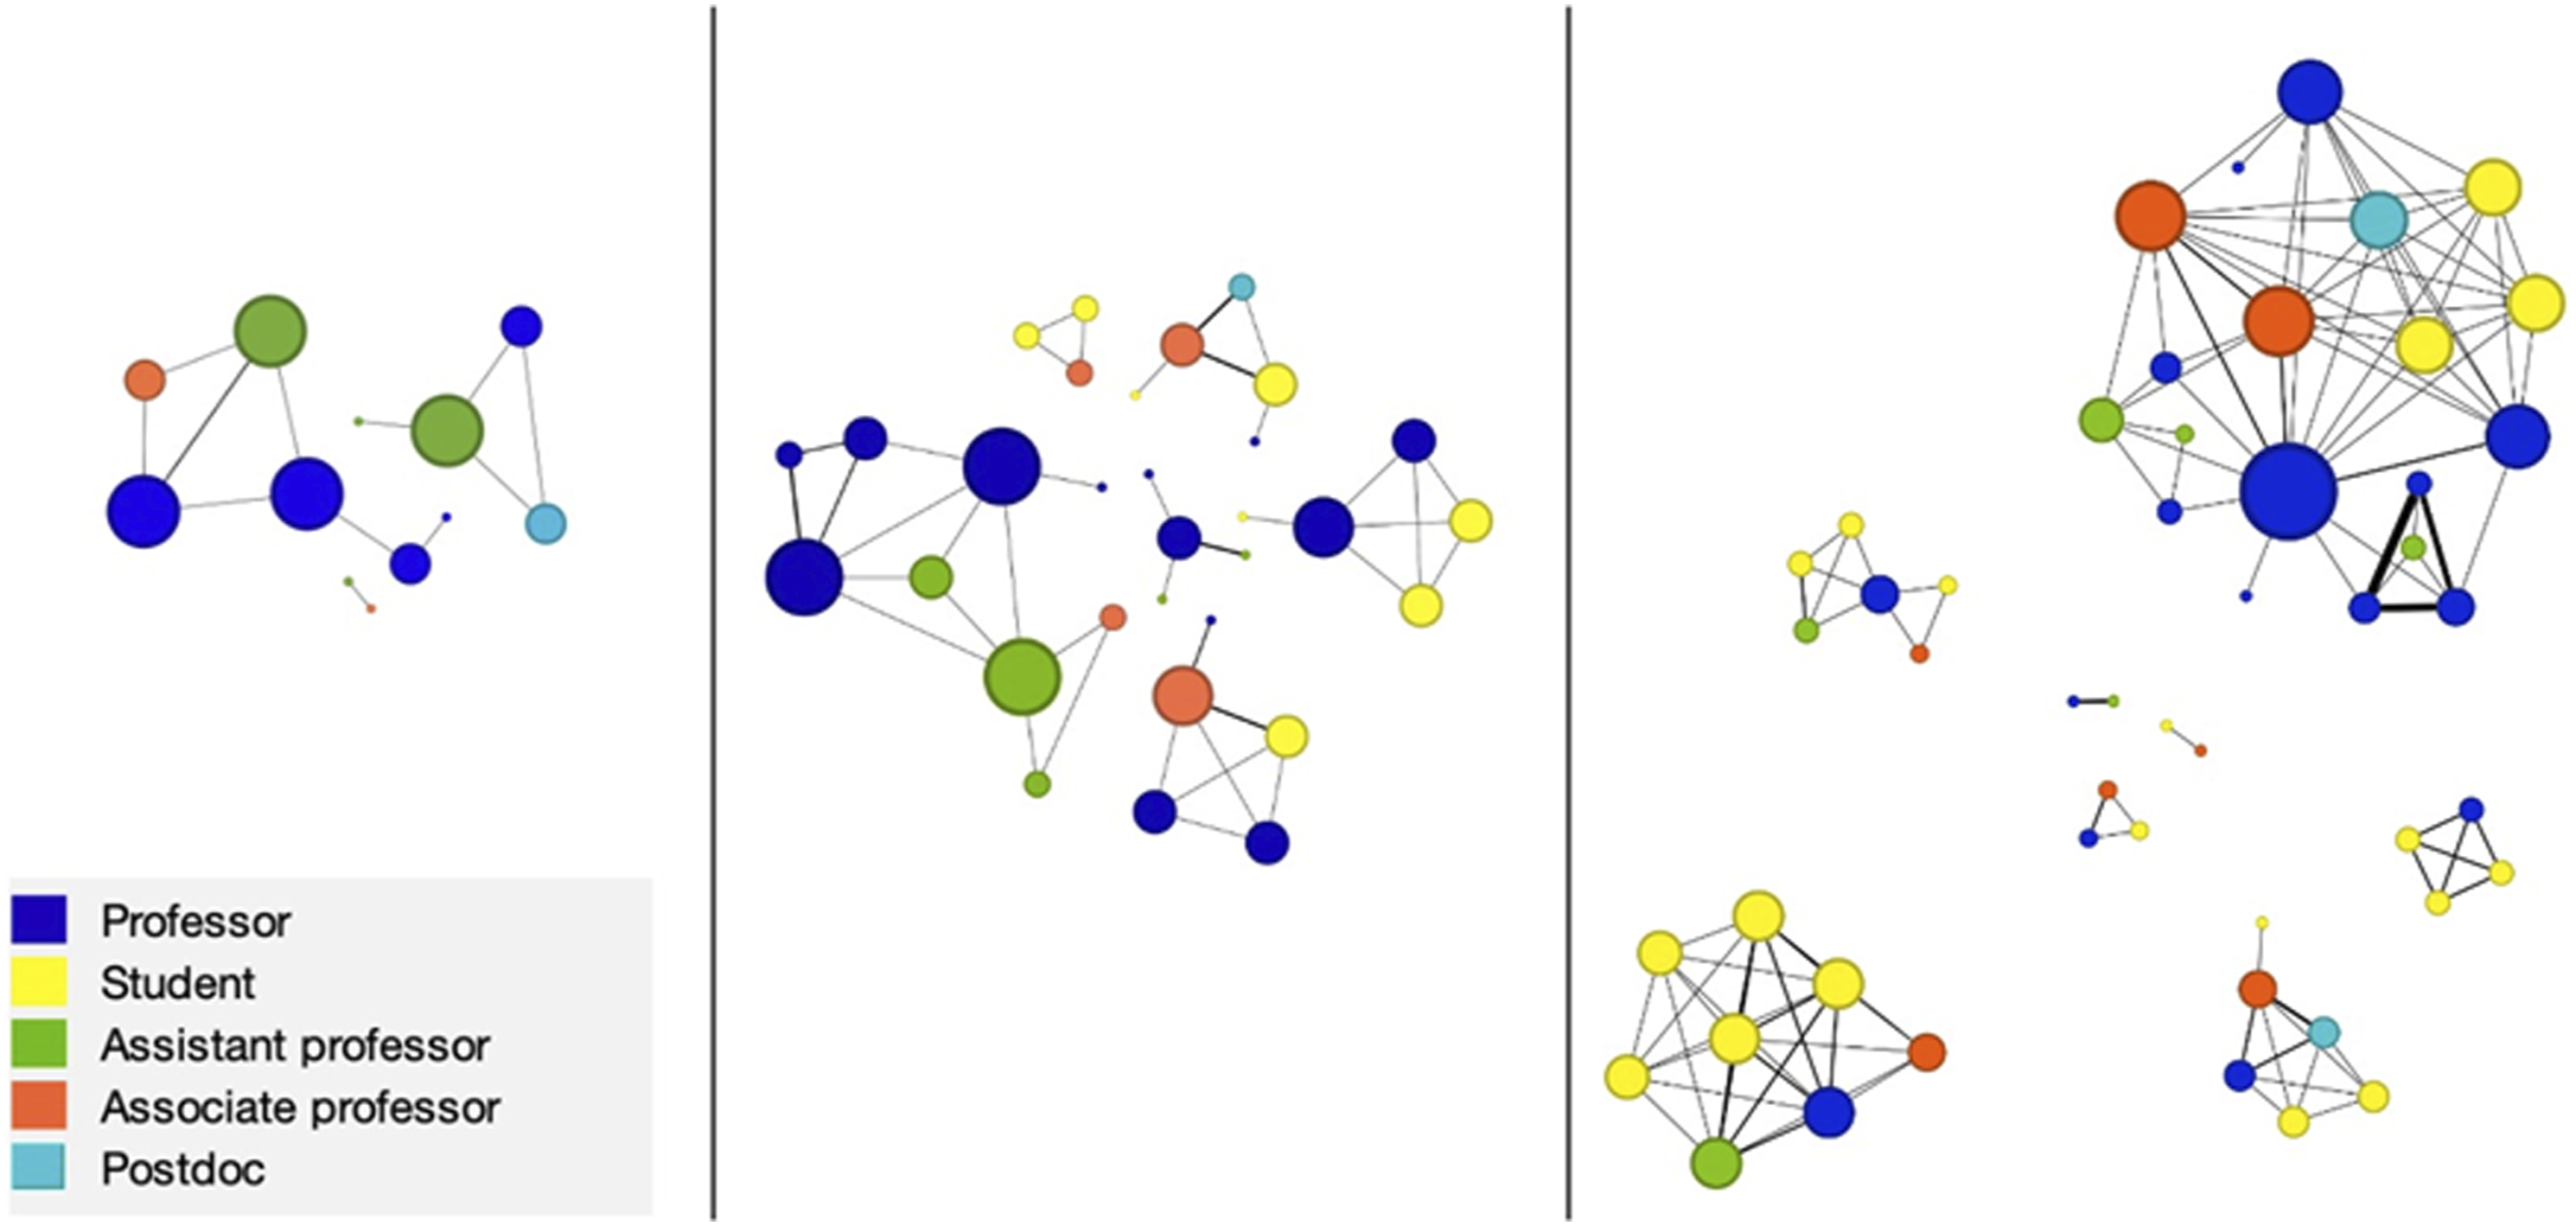
Figures 1–3 show the MVTCP network in its entirety at selected points in time (2010, 2015, and 2019); the total number of ties between two actors at each point is reflected in the weight of the edge between them, with heavier weights indicating more MVTCP-related co-authorships. Node size reflects the node’s degree or total number of unique co-authorship connections to other investigators in the network in the given year. MVTCP Network in Select Years (From Left to Right: 2010, 2015, 2019) with Nodes Coded by Institutional Affiliation. MVTCP Network in Select Years (From Left to Right: 2010, 2015, 2019) Coded by Disciplinary Affiliation. MVTCP Network in Select Years (From Left to Right: 2010, 2015, 2019) Coded by Rank.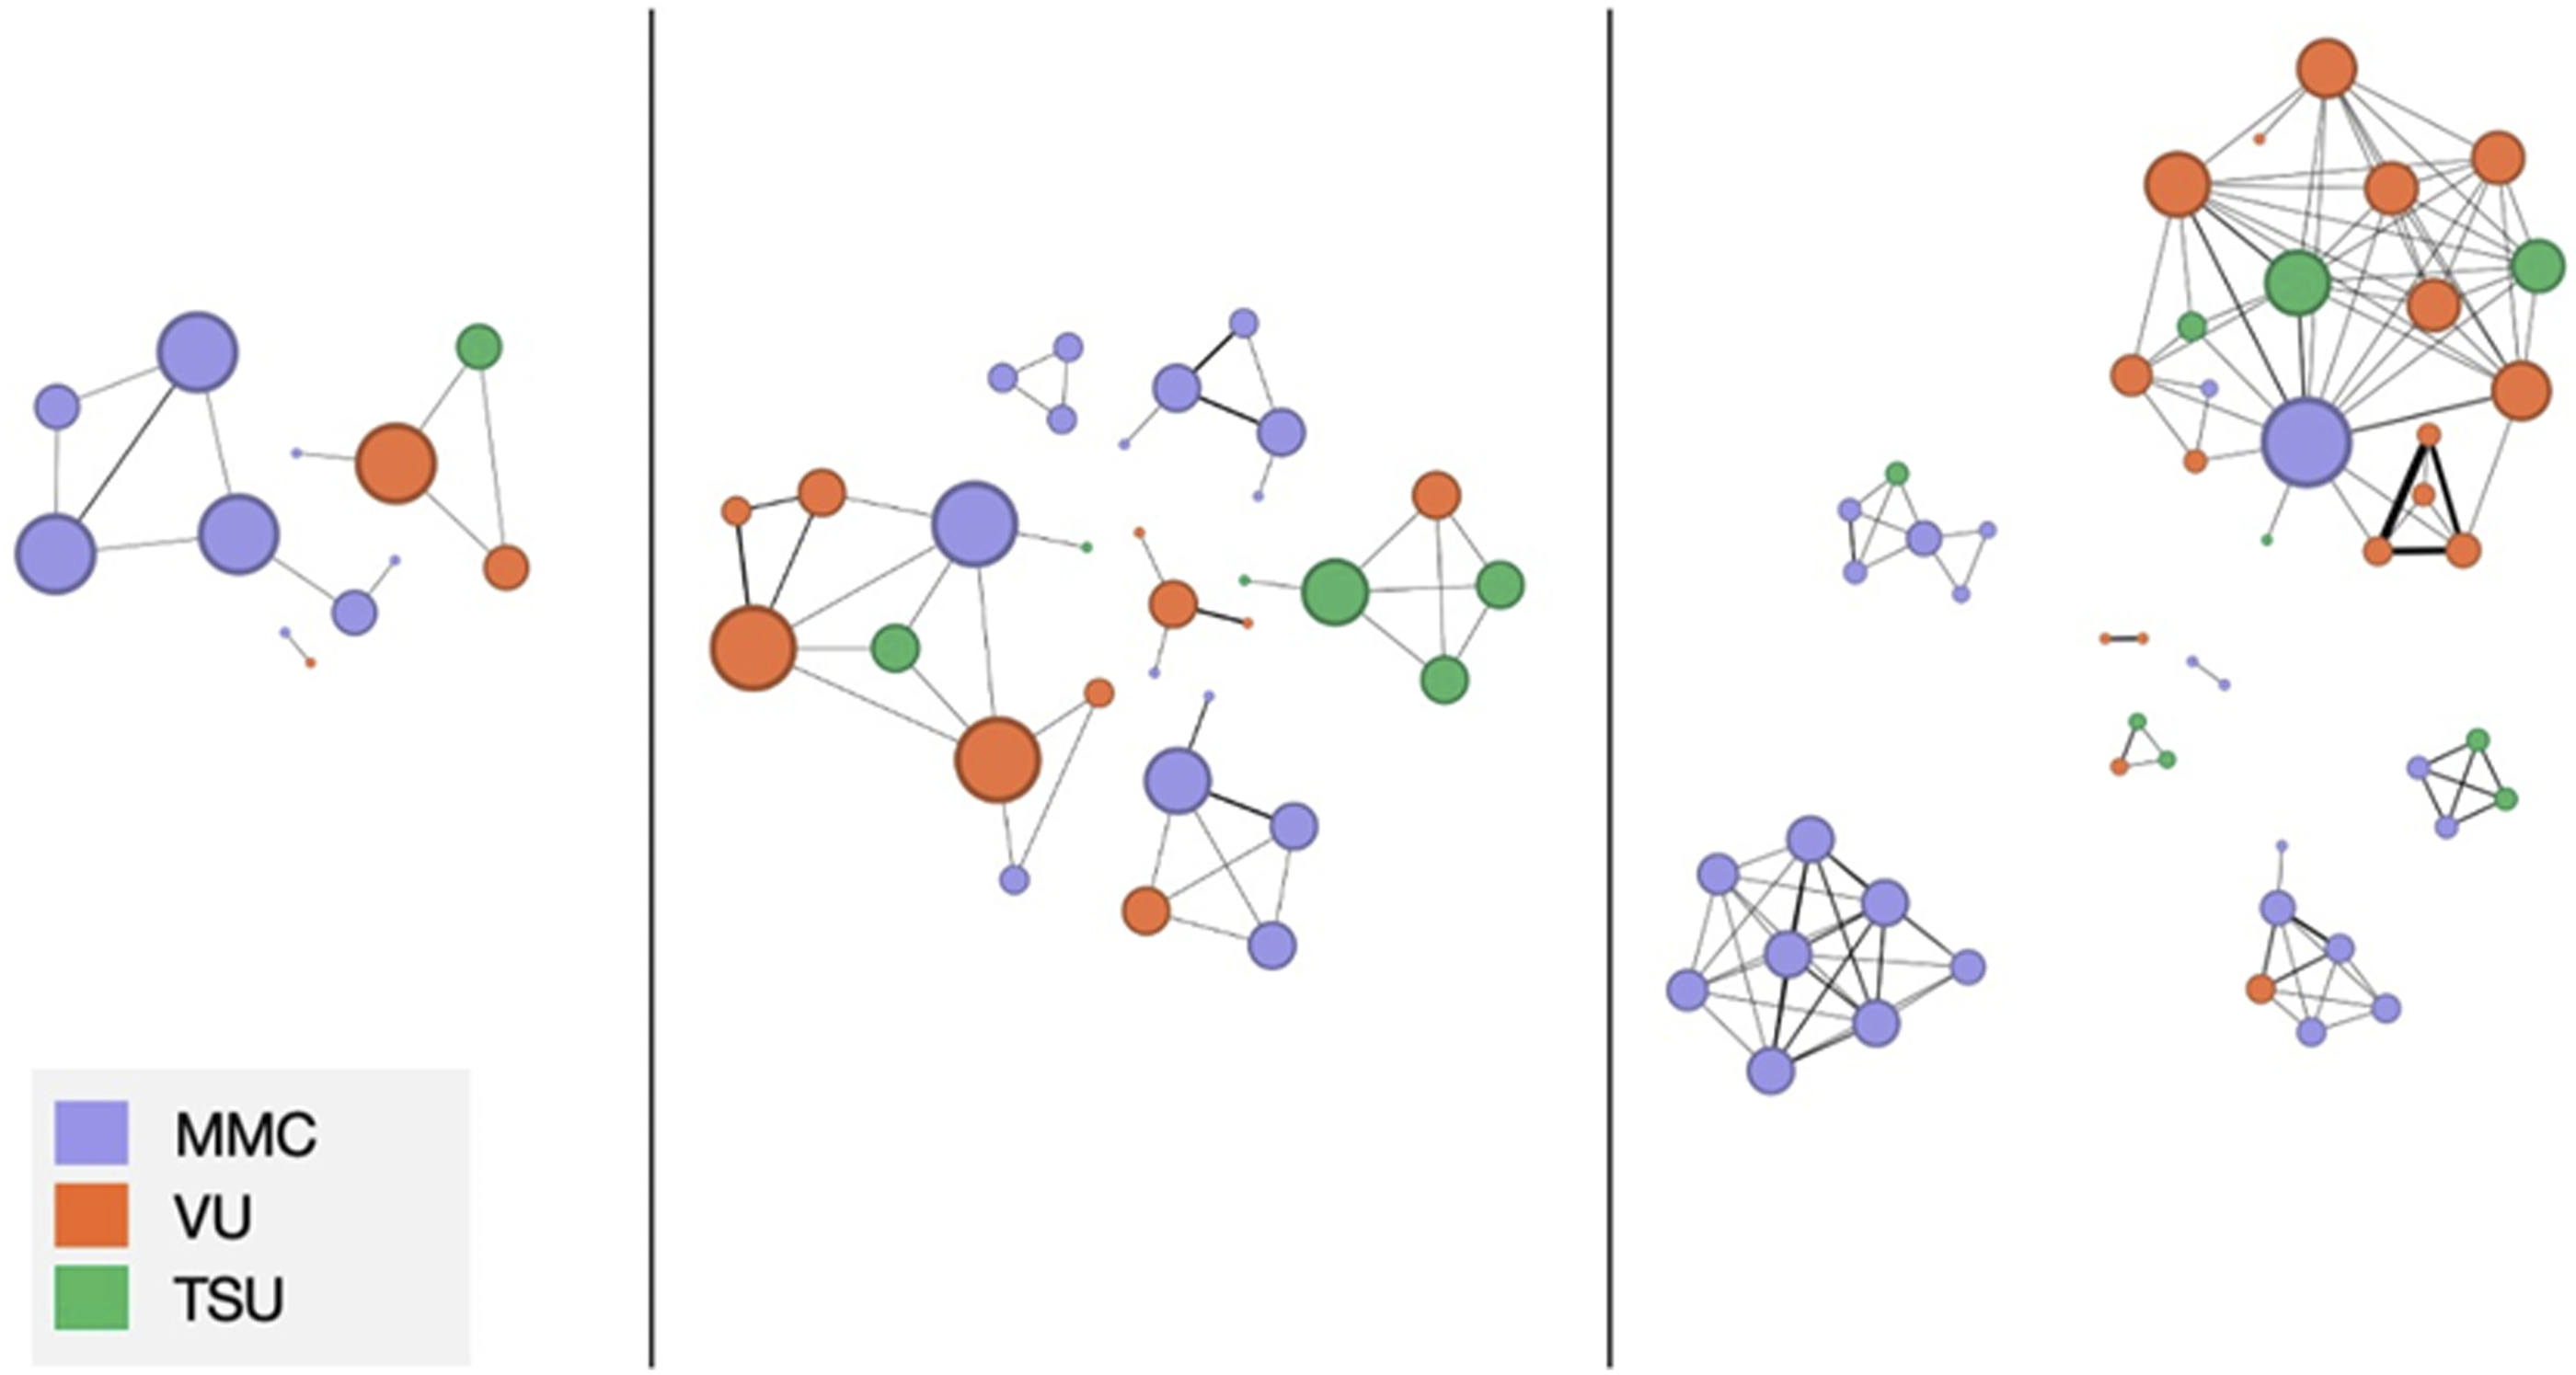
Inter-institutional Collaboration
Figure 1 indicates that interinstitutional collaboration remained modest across the MVTCP network over time. In 2010 (left sociogram), two out of three clusters (67%) were inter-institutional and one of these two (50%) included investigators from all three partner institutions. In 2015 (middle sociogram), new collaboration clusters formed as the network grew; four out of the six total clusters (67%) were inter-institutional and one out of these four (25%) included investigators from all three institutions. The 2019 sociogram (right) is more difficult to interpret, as it includes one large, isolated, and mono-institutional cluster (bottom left) and several clusters in the middle of the diagram that are nearly mono-institutional. One large cluster created by the bridging of several smaller clusters (top right) is also a key feature of the 2019 network. In 2019, as in previous years, only one cluster contains investigators from all three MVTCP institutions. In all 3 years, the dyads with the greatest total number of collaborations (indicated by edge weights) are consistently mono-institutional.
Interdisciplinary Collaboration
Figure 2 indicates that interdisciplinary collaboration may have been a characteristic feature of the network across time, but a precise description of the network by disciplines is difficult due to the increasing quantity of missing data across the sociograms. Missing data for disciplinary affiliation is positively correlated with student ranking, which is discussed in the next section. If student co-authorships consisted primarily of collaborations with research advisors (who are often affiliated with the same discipline as their students) inter-disciplinary collaboration has probably been modest over time. Comparing the fully specified parts of each sociogram in Figure 2 with corresponding parts in Figure 1, however, indicates that interdisciplinary collaboration has consistently occurred both across and within MVTCP institutions.
Cross-rank Collaboration
Figure 3 indicates that MVTCP collaborations across ranks (i.e., between faculty and students or between investigators of different seniority) have grown consistently and monotonically over time. While there were no student co-authored papers in 2010 (left sociogram), student co-authorships accounted for 26% of total network ties in 2015 and 38% in 2019; the number of students from each MVTCP institution also increased over time following the larger trend of student involvement. Between investigators of different ranks, collaboration was a consistent characteristic of the network across all 3 years. In total, cross-rank co-authorships comprise more than 60% of all unique collaborations in each year. We discuss this important dyad-level measure—which is suggestive of the extent of one-on-one mentoring within the network—in more detail in the discussion. Of the ten most collaborative dyads (indicated by edge weight), five are between persons of different ranks—two between a faculty member and a student and three between investigators of different seniority. At the cluster-rather than dyad-level, inter-rank collaboration is 100% across the 3 years shown in Figure 3.
Advisory Committee Discussion
When we discussed these findings with program advisory committees, we gained valuable insight into their perspectives on the growth of the partnership, areas for celebration, and areas for improvement. Specifically, the groups identified the overall growth of the network, expressed through the growing number of involved faculty over time, as an indicator of success. Similarly, the presence of inter-institutional, interdisciplinary, and inter-rank collaboration throughout all the network diagrams led program leadership to conclude that the partnership had been effective in fostering connections among researchers who might otherwise have been disconnected. The internal advisory committee, in particular, noted that seeing the most current diagrams gave them a better sense of the membership and scientific activity of the partnership as a whole, which could sometimes be difficult to grasp when focused on their day-to-day work for the partnership (e.g., leading a project). Although the advisory committees were clear that the mission of the partnership is not total and perfect integration (i.e., evidence of all forms of collaboration present in all clusters), repeated evidence of a lack of interinstitutional collaboration within a few clusters was noted as an area for improvement and growth. Additionally, the external advisory committee noted that they would like to see higher growth among investigators from one of the three institutions, both in terms of number of investigators involved in the network and the number of connections they have with other investigators. Finally, the advisory committees remarked that the network diagrams appeared to indicate that some investigators were the core of multiple collaborations and seemed to collaborate more often than others across institutions and disciplines. Because it was somewhat obvious who those people were and that they were more senior members of the partnership, the committees noted the importance of ensuring that junior members begin to fill high-collaboration roles.
Discussion
In this study, co-authored publications serve as the primary indicator of collaboration within the MVTCP research network. Between 2009 and 2020, the overall size of the MVTCP co-author network and the total number of co-authored publications within the network both increased substantially, indicating that within-network collaboration also grew in the same period. This change is consistent with the expectations of local leadership, with CPACHE program goals, and with NCI’s vision of practices that support effective health disparities research programs.
MVTCP network density, unlike total network size, has not increased over time. Because the number of edges needed to maintain network density is not a linear function of network size, it is reasonable to expect the overall density of a co-authorship network to decrease as network size increases beyond a particular threshold (Chinowsky et al., 2010). More specifically, there are practical limits on the number of co-authors who can be included on individual publications, and there also are capacity constraints on the number of publications that individual researchers can produce each year. This would not necessarily be true of a different type of network in which a tie represented a less demanding form of connection. In a network that represents a key form of academic productivity, however, practical constraints are likely to justify cases in which network density does not keep pace with network size. We draw attention to this example because it cautions against interpreting network measures outside of program context. More specifically, in the context of this program, one should not interpret decreasing network density as a sign of an unhealthy trend or a lack of programmatic success.
Within the overall trend of increased collaboration, growth has not occurred evenly across the different types of collaboration of interest to MVTCP leadership and funders. Specifically, inter-institutional and interdisciplinary collaboration remained steady across the study period while inter-rank collaboration showed substantial, monotonic growth. Inter-rank collaboration within the MVTCP network has been unequivocally successful, and this is true at the dyad-as well as the cluster-level. Measuring inter-rank collaboration at the dyad-level is important because it serves as a proxy for the extent of one-on-one mentoring within the network. Among other benefits, one-on-one mentoring has been shown to increase graduate students’ research productivity and self-efficacy over the long term, even after controlling for baseline abilities and other characteristics (Paglis et al., 2006). That students from Meharry Medical College and TSU (both historically Black institutions) are better represented within the MVTCP collaboration network than students from Vanderbilt (a predominantly White institution) thus suggests strong progress toward the CPACHE goal of increasing the number of minoritized students who are engaged in cancer and health disparities research.
Presenting network diagrams and findings to project advisory committees provided the opportunity to understand and interpret the networks vis-à-vis program goals and context with strong input from project leaders and decision makers. This insight led to more nuanced and actionable uptake of findings that might have been missed if the network analysis were conducted in the absence of local engagement. For example, it would be easy to assume that in a network focused on collaboration, network density, as well as all forms of collaboration, should demonstrate growth over time. However, the above explanation regarding density – informed by literature on social networks as well as local discussions and interpretations – demonstrates that a more nuanced understanding is required. Nuance allowed leadership to see specific areas of needed improvement (e.g., this particular group of collaborators is performing well with regard to inter-rank collaboration, and/but needs to focus more on interinstitutional collaboration), versus more general conclusions (e.g., network size has grown; network density has decreased).
Limitations
Conducting network analysis of publications generated through the MVTCP had the benefit of using existing data to visualize collaboration within the partnership. Furthermore, publications served as concrete evidence of collaboration that might have been more resistant to positive reporting biases among participants. At the same time, this method inevitably misses other forms and attributes of collaboration, such as collaborations with community-based partners who are essential to the research but might not be actively involved as publication authors, and the long-term investment of time and energy that developing fruitful partnerships requires. It also cannot account for unacknowledged/undocumented work, such as when students or staff make contributions to research projects but are not included as authors on papers. Although most disciplines have conventions related to assigning authorship, those conventions vary by discipline and individual investigator (Marušić et al., 2011). The step involving local interpretation of network findings yielded valuable insights as discussed above, but positive reporting biases may have been introduced in the process. Additionally, network analysis as we have used it fails to provide concrete benchmarks regarding collaboration (e.g., 50% of all papers published using research supported by MVTCP funds should demonstrate evidence of all three forms of collaboration) that might be used to drive improvement.
Conclusion
In this paper, we provide an extended example of generating actionable insight into the nature and extent of collaborations within the MVTCP research network. Though the institutions that comprise the MVTCP are explicitly tasked with conducting collaborative research by the program funder, measures of collaboration were not among the metrics used to assess MVTCP site performance. This “gap” in evaluation knowledge is potentially problematic, as it may eventually lead to a failure to be able to distinguish between program and theory failure if the long-term expected outcomes of the CPACHE program are not realized. Using investigator publication citations—which are already collected for grant reporting purposes—we were able to visualize and evaluate three different forms of collaboration with relatively little additional data collection. The evaluation method we described is a simple strategy for remedying this gap at CPACHE sites and others like them.
Footnotes
Acknowledgments
We would like to thank two anonymous Evaluation & the Health Professions reviewers for incisive feedback on our original manuscript.
Declaration of Conflicting Interests
The author(s) declared no potential conflicts of interest with respect to the research, authorship, and/or publication of this article.
Funding
The author(s) disclosed receipt of the following financial support for the research, authorship, and/or publication of this article: We would like to thank the National Institutes of Health/National Cancer Institute for support of the Meharry-Vanderbilt-Tennessee State University Cancer Partnership (U54CA163066, U54CA163069, and U54CA163072).
Author Note
Grace Liu is now affiliated with The Field School, Chicago, Illinois.