
Abstract
Technologies that enable individualization for students have significant potential in special education. Computerized Adaptive Testing (CAT) refers to digital assessments that automatically adjust their difficulty level based on students' abilities, allowing for personalized, efficient, and accurate measurement. This article examines whether CAT performs differently for students with and without special educational needs (SEN). Two simulation studies were conducted using a sample of 709 third-grade students from general and special schools in Germany, who took a reading test. The results indicate that students with SEN were assessed with fewer items, reduced bias, and higher accuracy compared to students without SEN. However, measurement accuracy decreased, and test length increased for students whose abilities deviated more than two SD from the norm. We discuss potential adaptations of CAT for students with SEN in the classroom, as well as the integration of CAT with AI-supported feedback and tailored exercises within a digital learning environment.
In the field of special education, technologies enabling maximum adaptation and individualization for students present significant opportunities. These advancements are particularly pertinent considering the current strides in machine learning and AI in education (Chen et al., 2022; Marino et al., 2023). A specific development geared toward achieving greater individualization in school assessments is the utilization of digital tests that automatically adjust their level of difficulty based on students' abilities (van der Linden & Glas, 2000). These tests, known as Computerized Adaptive Tests (CATs), have been in use for a while with individuals without disabilities (Oladele & Ndlovu, 2021). However, research on the performance and practicality of this technology for students with disabilities in the classroom remains limited (e.g., Ebenbeck, 2023; Stone & Davey, 2011).
What is Computerized Adaptive Testing?
A CAT comprises a substantial number of items, forming an item pool with various levels of difficulty, alongside a pre-programmed adaptive algorithm. This algorithm is tasked with selecting suitable items for each student from the item pool (Meijer & Nering, 1999). It allows test developers to exercise control over several aspects, such as determining the test’s initial difficulty level, specifying the statistical procedures used to select appropriate items for the student, and defining the stopping criteria for the test (van der Linden & Glas, 2000). Through this adaptive approach, CATs can offer customized item selections that align with each student’s unique abilities.
The primary aim of CAT is to present students with items that correspond to their abilities and yield accurate measures of those abilities (Meijer & Nering, 1999). Item response theory (IRT), a widely used psychometric theory in CAT, proposes that an item is most effective at assessing a student’s ability when the student has a 50% chance of answering it correctly (Embretson & Reise, 2013). If an item is too easy, the student is likely to answer it correctly without significant effort, which may not provide substantial information about their ability. Similarly, if an item is excessively difficult, the student is likely to answer it incorrectly, resulting in a highly predictable incorrect response. In such instances, the item fails to offer significant insights into the student’s abilities (Embretson & Reise, 2013; Segall, 2005). Hence, the most effective test presents students with items that closely match their abilities.
For CAT to offer students items of suitable difficulty, the algorithm continually estimates their ability based on their responses to each item (Meijer & Nering, 1999; van der Linden & Glas, 2000). This estimation guides the selection of the subsequent item in the test. The algorithm considers whether the student’s response was correct or incorrect to determine the next item. Typically, if a student answers an item correctly, the algorithm selects a more challenging item for the next question. Conversely, if the student answers incorrectly, an easier item is chosen for the next question. As the algorithm processes more items and the student responds to them, it gathers additional information to estimate the student’s ability more accurately (Kingsbury & Zara, 1989). With each response, the estimate of the student’s ability becomes increasingly precise, leading to a gradual alignment between the test’s difficulty and the student’s actual ability. This process results in a personalized and accurate assessment of the student’s skills.
Research has emphasized the impact of the termination criteria on both test accuracy and test length of a CAT, particularly when considering students with disabilities (Ebenbeck & Gebhardt, 2022; Ludewig et al., 2022; Michiel et al., 2008). CATs can be classified into fixed-length tests, which conclude after a predetermined number of items, and variable-length tests, which terminate based on criteria such as achieving a target measurement accuracy (Thompson & Weiss, 2011). Measurement accuracy in CATs is commonly assessed by evaluating the standard error (SE) associated with the estimation of an individual’s ability. A larger SE suggests a shorter test length, while a smaller SE indicates a longer test but a more reliable measurement (Michiel et al., 2008). The challenge lies in striking the right balance between test length and measurement accuracy (Ludewig et al., 2022).
Benefits of Computerized Adaptive Testing for Students with Disabilities
CATs are primarily utilized in higher education or vocational selection processes (Kalender & Berberoglu, 2017; Sands et al., 1997). They are less common in elementary schools or specifically designed for students with disabilities, despite the potential benefits CATs can provide for these students.
CATs demonstrate greater efficiency compared to non-adaptive tests, with CATs being, on average, 50–90% shorter in length (Gibbons et al., 2008). CATs exclude items that are either too easy or too difficult for the student. By selectively presenting items that align with the student’s ability, CATs gather adequate information while minimizing the number of required items. Consequently, CATs reduce testing and scoring time, enabling instructional resources to be utilized more effectively in supporting students with disabilities.
CATs can create a more conducive testing environment for students with disabilities. These students often encounter difficulties in maintaining focus during class (Lancaster et al., 2001; Stevens, 2001; Swanson & Howell, 1996). CAT addresses their concentration needs by reducing the test’s length. With a reduced number of items to complete, students are less likely to experience fatigue or feel either overchallenged or underchallenged (Rudner, 1998; Tian et al., 2007). They are presented with items that are appropriate challenging but not excessively difficult, which may also enhance their motivation (Reed et al., 2020).
CATs provide a higher level of individualization in testing compared to non-adaptive tests (Green, 1983) since they curate a customized set of items for each student. This distinctive attribute enables the evaluation of student groups with varying learning backgrounds and performance levels using a single tool (Weiss, 2004).
CATs offer the advantage of precise measurement of the performance spectrum, particularly at the extremes (Georgiadou et al., 2006). The accurate evaluation of the performance of students with disabilities serves as a fundamental reference for determining appropriate instructional strategies (Schildkamp et al., 2012). Thus, it is crucial to emphasize the testing and supporting students with disabilities in the school context. Presently, most school assessments are non-adaptive, featuring a relatively narrow range of item difficulty. While these tests effectively measure students of average ability in the middle range, they may result in higher SE when assessing students of lower ability. In contrast, CATs employ item pools with a broad range of difficulties and numerous items, making them particularly suitable for evaluating students with low ability profiles (Davey et al., 2015).
Furthermore, CATs encompass all the benefits of computer-based non-adaptive tests, including reduced susceptibility to error and diminished test administrator effects, automated scoring, and the potential incorporation of multimedia task formats (Liebers et al., 2019; Parshall et al., 2000; Schaper, 2009; Walter & Schuhfried, 2004).
Development of Computerized Adaptive Tests for Students with Disabilities
The primary factor contributing to the limited use of CATs in schools is the high effort required for their development. Several approaches exist for developing CATs, with the most prevalent one involving the utilization of item parameters, such as item difficulty, within the framework of IRT.
The development of a CAT using an IRT framework involves several essential steps (Meijer & Nering, 1999; van der Linden & Glas, 2000). Initially, an item pool is constructed, tested, and fitted to an IRT model to ensure the items align with the model’s underlying psychometric properties. Subsequently, the CAT algorithm is tailored for the specific target population and evaluated through simulation studies. After the design phase, the CAT is implemented, and its performance and accuracy are assessed. Depending on the chosen IRT model, administering the entire item pool in a non-adaptive format to a sample of several hundred students is necessary to estimate the difficulty of each item within the item pool (Şahin & Anıl, 2017). These item difficulty parameters are crucial for subsequently selecting appropriate items for students based on their ability level in a CAT (Segall, 2005).
CAT item pools can be purpose-built or acquired by utilizing existing item pools from non-adaptive tests (Mills & Stocking, 1995; Mizumoto et al., 2019; Thompson & Weiss, 2011). For CAT construction, it is recommended to have large item pools comprising several hundred items, ensuring enhanced test security for a frequently administered test. In the context of university CATs, constructing and testing large item pools is feasible due to the cognitive capabilities of university students, enabling them to engage with these items for extended durations to obtain item parameters. Conversely, CATs designed for elementary school use smaller item pools (Ludewig et al., 2022; Turner et al., 2022). Testing large item pools poses a challenge, particularly in elementary school where both concentration and learning time are limited (Hoyer et al., 2021). Managing numerous items in a single session can be overwhelming, especially when focusing on young students or students with disabilities as the target group, as it may lead to exhaustion (Stone & Davey, 2011; Thurlow et al., 2011).
In contrast, a smaller item pool may be simpler to pretest and more student-friendly, as students do not need to take as many items. However, due to the limited number of items in the CAT’s item pool, it becomes challenging to ensure the availability of items for every ability level (He & Reckase, 2014; Reckase, 2010).
Research Questions
CAT is a promising technology with the potential to substantially influence to customization, efficiency, and digitization of diagnostics in special education. Further progress in this field demands the resolution of technical concerns associated with developing CATs for students with disabilities. Consequently, our investigation delves into the suitability of CAT for precise assessment of students with disabilities and whether the CAT algorithm exhibits differential behavior for students with and without disabilities. To address these inquiries, we conducted two studies aiming to answer three key questions: 1. How does the size and difficulty distribution of the item pool influence the measurement of CAT for students with and without disabilities? 2. What are the comparative benefits of a variable or fixed test length CAT for students with and without disabilities? 3. How does CAT effectively assess students with disabilities?
Materials and Methods
CAT Simulation Settings
In both studies, we simulated multiple CATs using the R programming environment (R Core Team, 2018) and the R package catR (Magis et al., 2018). We then compared the performance of the simulated CATs for various groups of students with and without disabilities.
To configure the CAT algorithm for simulations using catR, four settings need to be predefined: 1. The “start step” selects the first item in the test. Typically, the CAT begins with a medium difficulty item, which aligns with our chosen approach for the CATs. 2. The “test step” establishes the rules for item selection and ability estimation after each response. We employed a procedure recommended by Magis et al. (2017), wherein item selection during a test run is based on Fisher information, the most commonly used method of item selection (Barrada et al., 2009) in combination with the Bayesian modal estimator (Birnbaum, 1969). 3. The “stop step” outlines one or more rules for concluding the CAT. We compared three variable-length stopping rules based on the minimum SE of the ability estimation. An SE ranging from 0.3 and 0.5 is recommended, with SE = 0.3 yielding the most accurate tests, while SE = 0.5 is still considered acceptable (Forkmann et al., 2013). Additionally, we implemented an additional maximum length stopping rule of 36 items, considering the practicality of tests within a school setting (Ludewig et al., 2022). 4. The “final step” involves estimating the person’s ability after completing the test. We used the default setting of maximum likelihood.
Study 1 Data and Workflow
In Study 1, three different item pools are used. Item pool 1 is derived from an existing non-adaptive test (Ebenbeck et al., 2022) designed to assess phonological awareness in third-grade students based on the identification of a sound’s position within a graphically presented word. Students are required to identify either the first, last, or another letter. The test was specifically developed for inclusive schools, targeting students with lower reading proficiency. The item pool contains a larger number of easy items to differentiate for students with low reading skills. It comprises 36 items and adheres to the Rasch model (Jungjohann et al., 2023). In the Rasch model, a unidimensional IRT model, the probability of students correctly answering the item is solely contingent on the item difficulty, with no dependence on any other item parameters.
To estimate the values of person ability and item difficulty values for CAT simulations, a group of 709 students participated in a non-adaptive paper-pencil test, with 175 of them having disabilities. These students were from both regular and special schools in Germany. The majority of the students with disabilities were enrolled in segregated special schools catering to various types of disabilities, including learning, speech and communication, and social and emotional development needs. The students in these schools typically have an IQ ranging from 70 to the normal range, often coming from backgrounds marked by poverty or migration.
The study included students with disabilities, with 71% having learning disabilities, 14% with speech and language impairments, and 15% with social and emotional needs. On average, students with disabilities were 10.99 years old (SD = 0.81, Min=9.43, Max=13.01), whereas students without disabilities were on average 9.76 years old (SD = 0.55, Min=8.43, Max=12.10). 45.7% of the students were female.
Item pool 2 is generated by multiplying the original 36 items to expand the item pool to 216 (36 × 6) items. This approach ensures that the distribution of the original item pool remains unaltered while effectively increasing the size of the item pool, as 36 items are considered small in the context of CAT (Kingsbury & Weiss, 1984). Item pool 3 is generated following a normal distribution using the R package catR, comprising 200 items. This allows for a performance comparison of the workflow on an item pool without an abundance of easier items. The distribution of item difficulty for item pools 1, 2, and 3 is shown in Figure 1. Item difficulty distribution of item pool 1 (left, 36 items of fixed-item test), 2 (middle, 216 multiplied items of fixed-item test) and 3 (right, 200 normal distributed items). Negative logit values indicate easier items while positive logit values indicate harder items.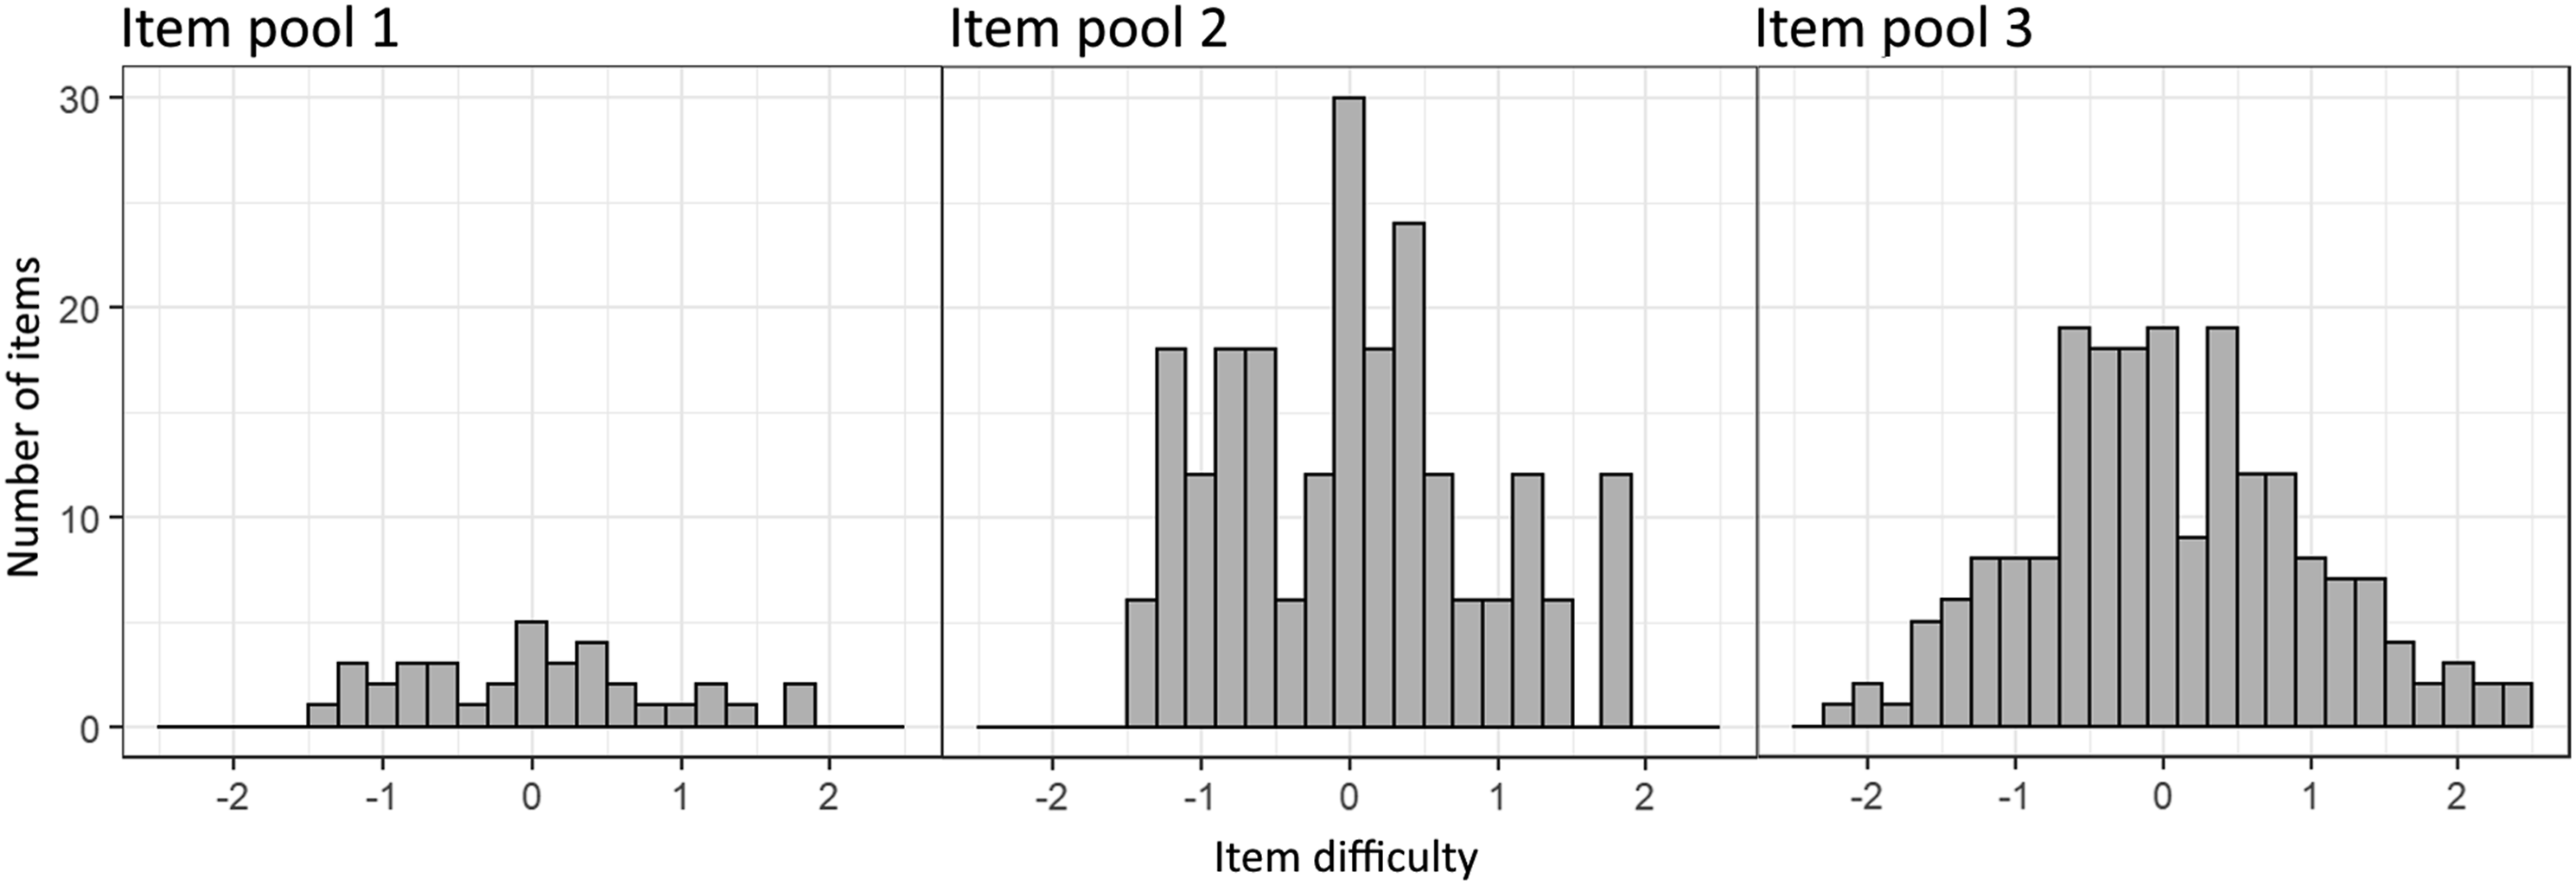
To assess the performance of the CATs, distinct simulations were carried out for students with and without disabilities. The test was particularly designed for students with lower reading skills, leading to ceiling effects during the estimating of these students’ abilities. To account for this ceiling effect and ensure precise simulations, two separate samples of 1000 students each, one comprising students with and the other without, were generated based on the M and SD of the ability of the respective sample groups (students with disabilities: M=1.69, SD=1.56; students without disabilities: M=2.19, SD=1.51). Figure 2 offers an overview of the workflow implemented for each item pool. Workflow of CAT Simulations: Person abilities and item difficulties are estimated based on the test results within an IRT model, person abilities are splitted and generated for students with and without SEN, before serving as input for the simulation studies of study 1.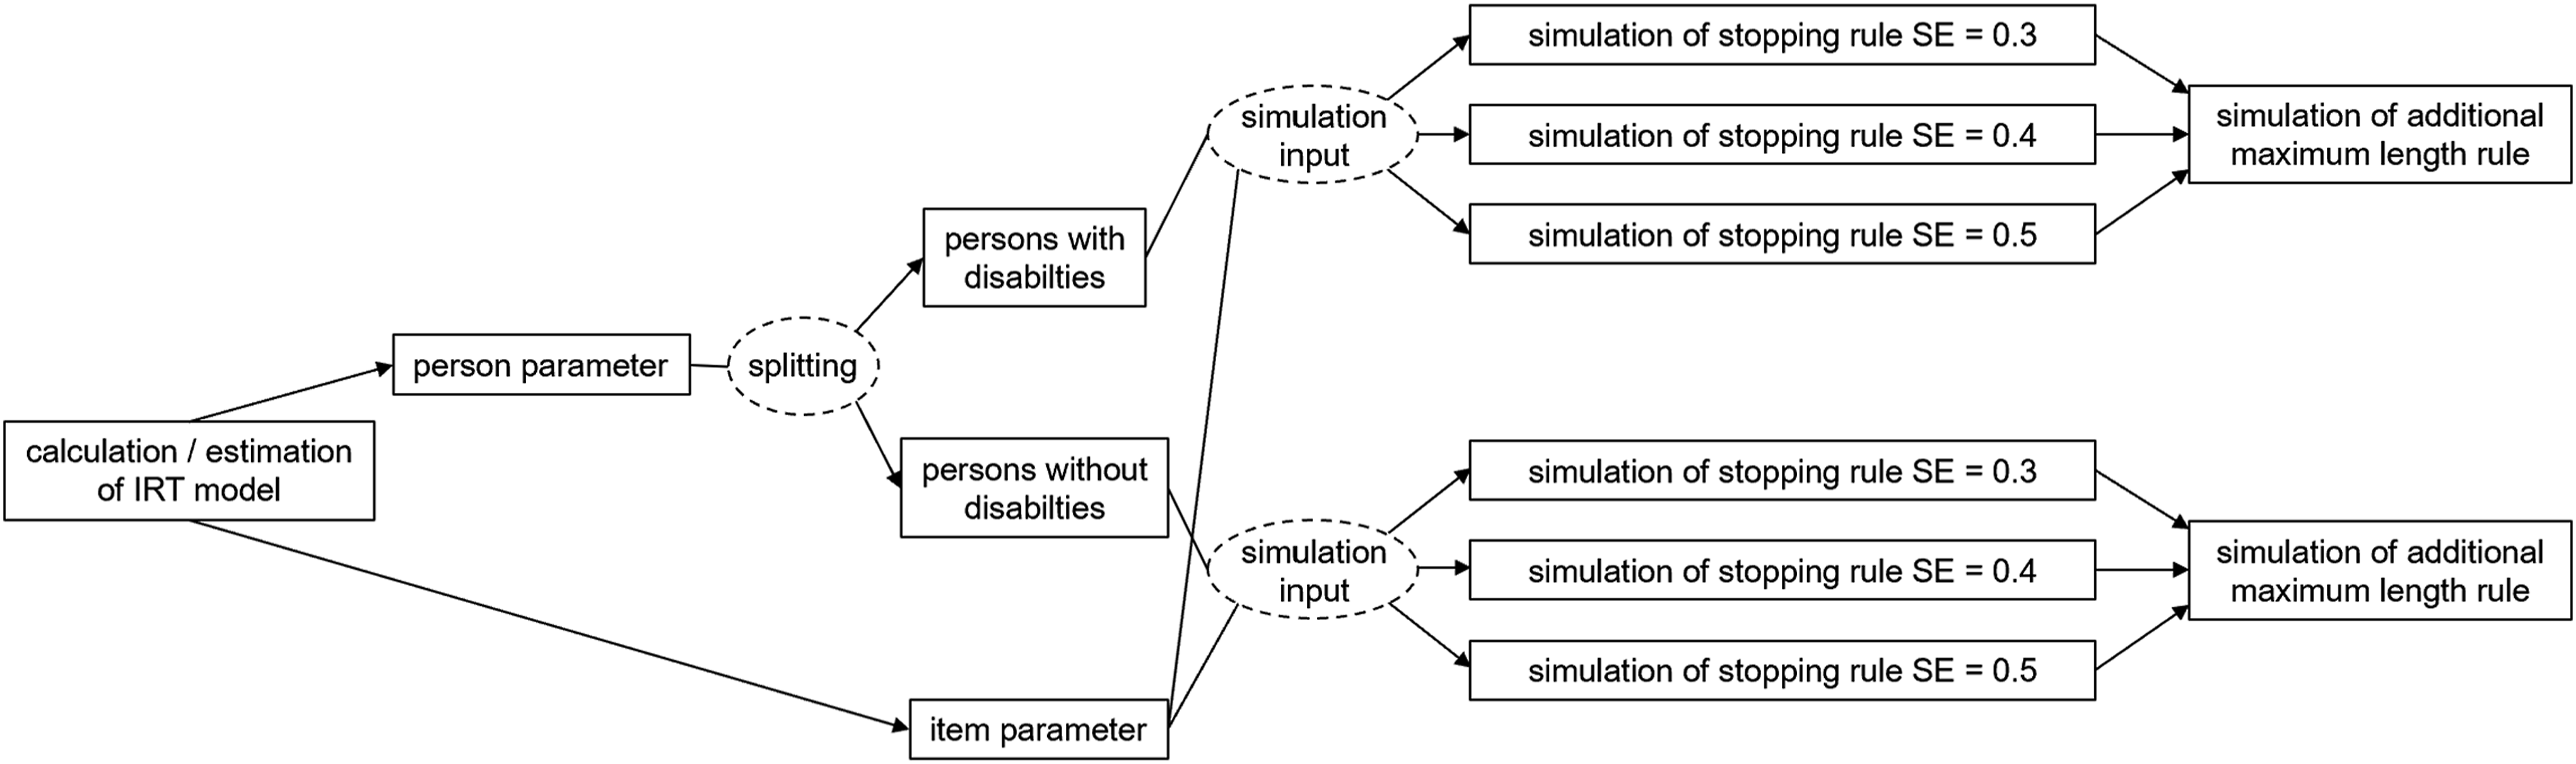
Study 2 Data and Workflow
In Study 2, only item pool 2, comprising 216 items, was used. For this study, we did not use the student sample from Study 1; instead, we generated three sets of person ability values (n = 1000) with distinct ability ranges to simulate low-performing students. Group 1 was characterized by normally distributed person abilities, with an M of 0 and an SD of 1. Group 2 had equally distributed person abilities spanning one SD below the mean, with an M of −1 and an SD of 1. Group 3 featured equally distributed person abilities spanning two SDs below the mean, with an M of −2 and an SD of 1. For each group, a fixed-length CAT was simulated, employing a stopping rule of SE = 0.5 and a maximum test length of 36 items. The performance and length of the CATs were compared across the three groups to assess measurement accuracy and test length.
Results
Study 1
Results of Simulations With Three Different Item Pools Comparing Different Stopping Rules.
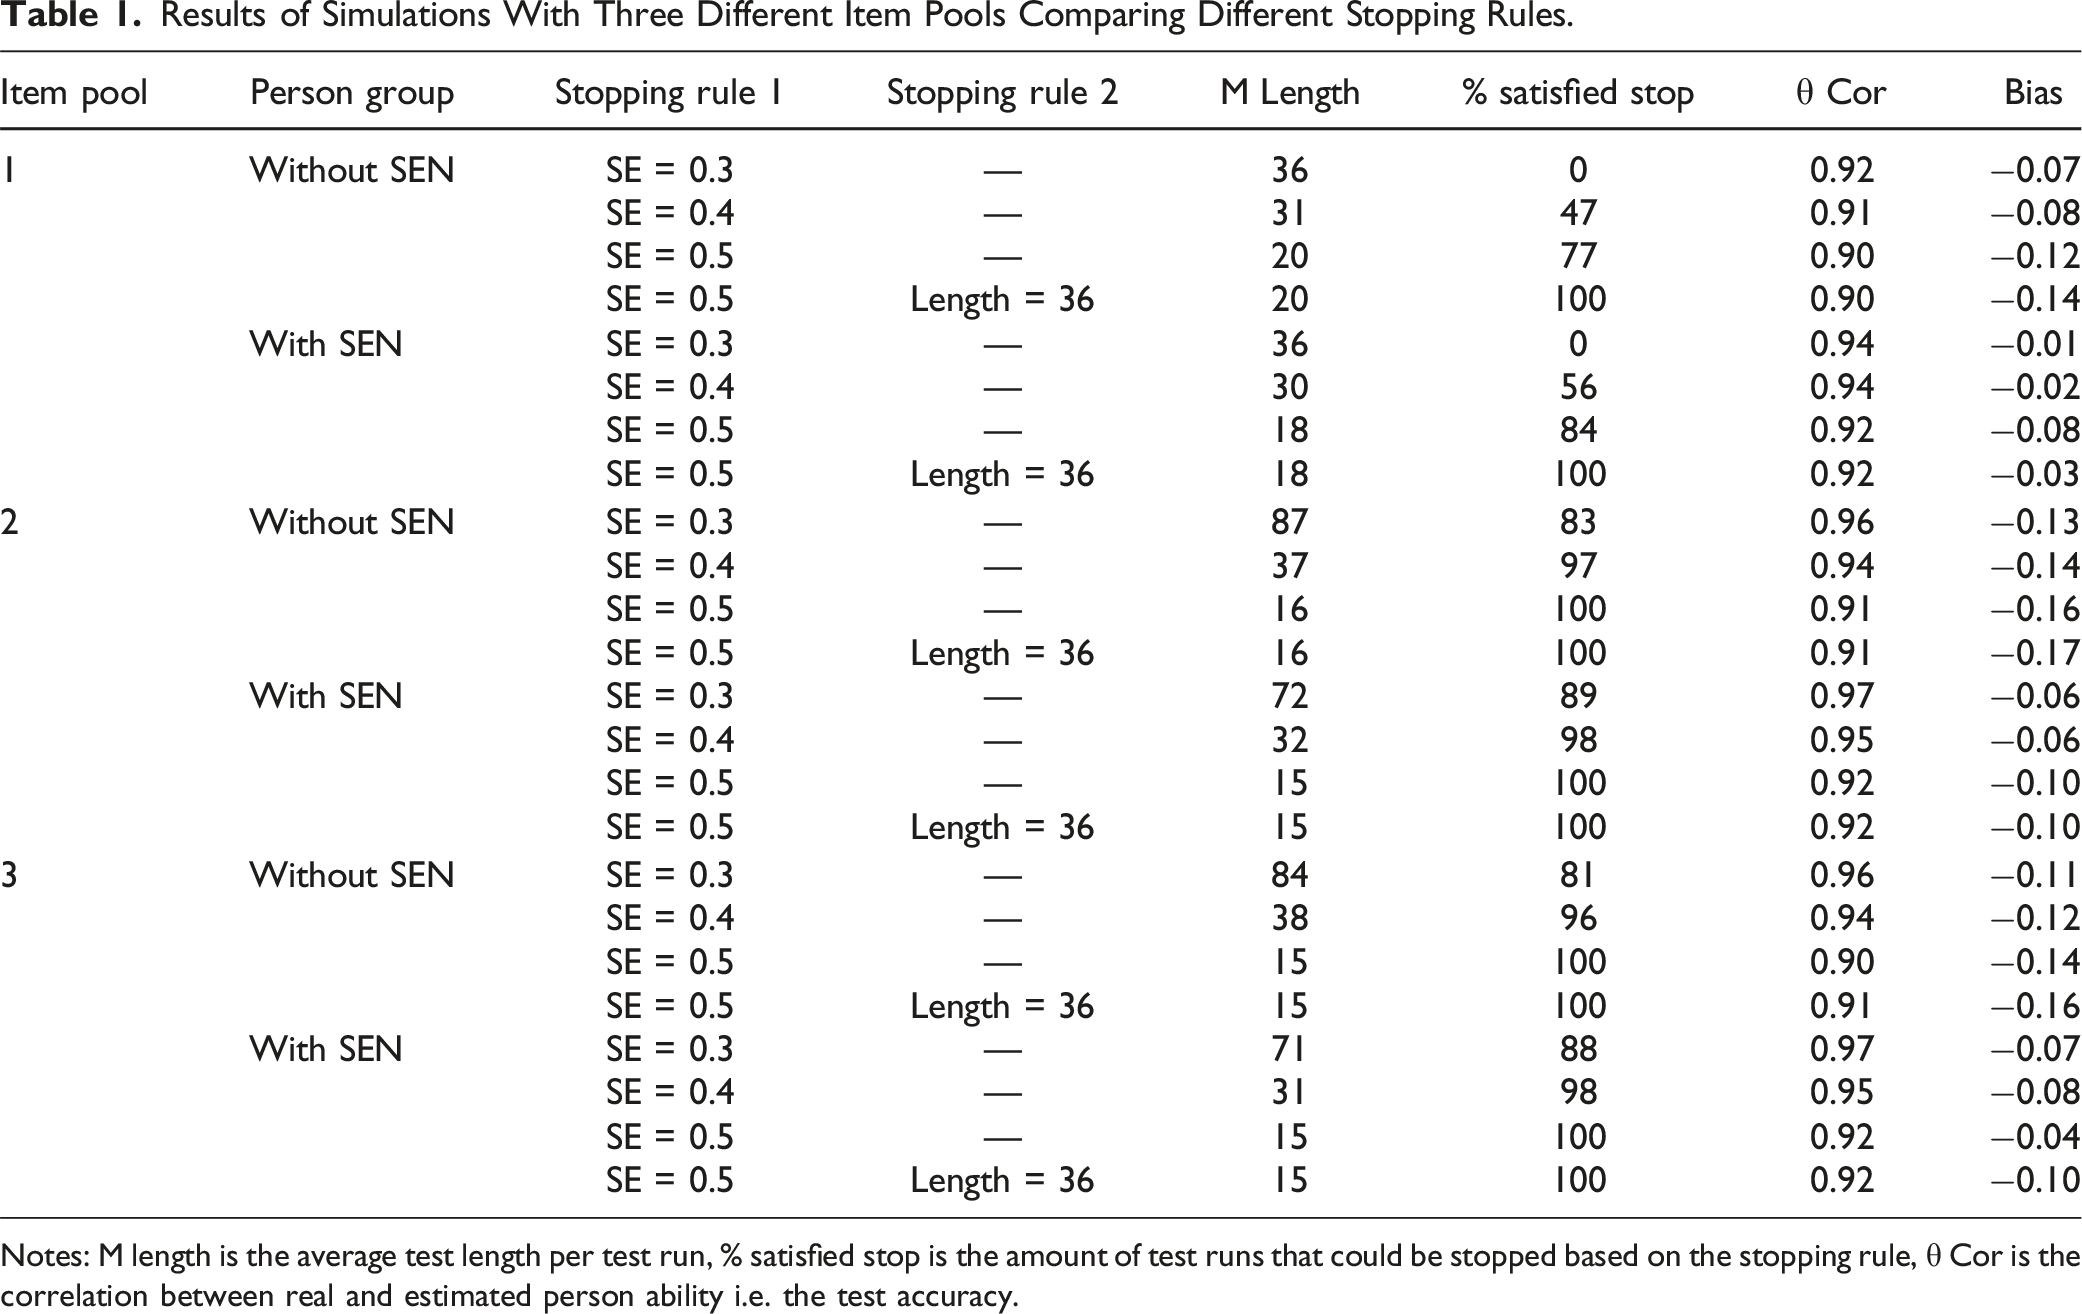
Notes: M length is the average test length per test run, % satisfied stop is the amount of test runs that could be stopped based on the stopping rule, θ Cor is the correlation between real and estimated person ability i.e. the test accuracy.
Among the different stopping rule configurations, the implementation of an SE of 0.5 led to a notable decrease in test length while upholding a high correlation. Hence, this stopping rule appears to be the most favorable choice for our item pools, especially when the aim is to ensure efficient in-class use of the test. With this particular stopping rule, most students, both with and without disabilities, could be accurately estimated within the designated SE threshold. Furthermore, the CAT could be halted for 77% to 100% of all students, in accordance with the stopping rule based on the measurement’s accuracy.
While the utilization of a maximum test length might prove beneficial for large item pools, it does not offer added value in our simulations. In scenarios where the CAT cannot be halted in accordance with the stopping rule, administering the complete item pool would potentially result in a test spanning over 200 items. Nevertheless, by aiming for a target accuracy of SE = 0.5, all students can be accurately assessed without necessitating the administration of the entire item pool. The inclusion of the maximum test length does not impact the average length or accuracy of measurement for students with and without disabilities. However, it does prevent the occurrence of excessively long tests featuring hundreds of items. As a result, all tests are concluded within a maximum of 36 items, equating to an approximate administration time of 5 minutes.
The average reduction in test length, in comparison to the original non-adaptive test, was approximately 45% to 50%. The magnitude of the reduction in test length in influences by the size of the item pool. In Item Pool 1, consisting of 36 items, the CAT yielded an average test length of 18 items for students with disabilities and 20 items for students without disabilities. Conversely, Item Pool 2, featuring a larger item pool with an identical difficulty distribution, led to slightly shorter tests. On average, a CAT based on Item Pool 2 contained two to three fewer items while maintaining the same accuracy.
The size of the item pool influences the percentage of simulations that are stopped based on the accuracy stopping rule. With an item pool size of 36 items, even when stopped at a lower accuracy, only 77% of the simulations were stopped because of their accuracy, while the remaining 23% were stopped as a result of exhausting all items in the item pool. In contrast, for item pools 2 and 3, both of which have larger item pool sizes, all SE options resulted in a greater proportion of simulations being stopped because of their accuracy. Larger item pools offer a more extensive selection of items with various difficulties, increasing the likelihood of matching items for each student and leading to a shorter test length, which directly impacts the number of simulations that can be stopped at the intended accuracy level. Moreover, with larger item pools, the completion of all items becomes increasingly impractical and the probability of achieving the specified SE is enhanced.
When examining the performance of students with and without disabilities, the impact of item pool size and distribution becomes evident, particularly concerning simulation accuracy (Figure 3). Each point within the graph represents a student whose ability was estimated by the test. The proximity of the point to the red line signifies the accuracy of the estimated ability. Accuracy of CAT with different item pools for students with and without disabilities.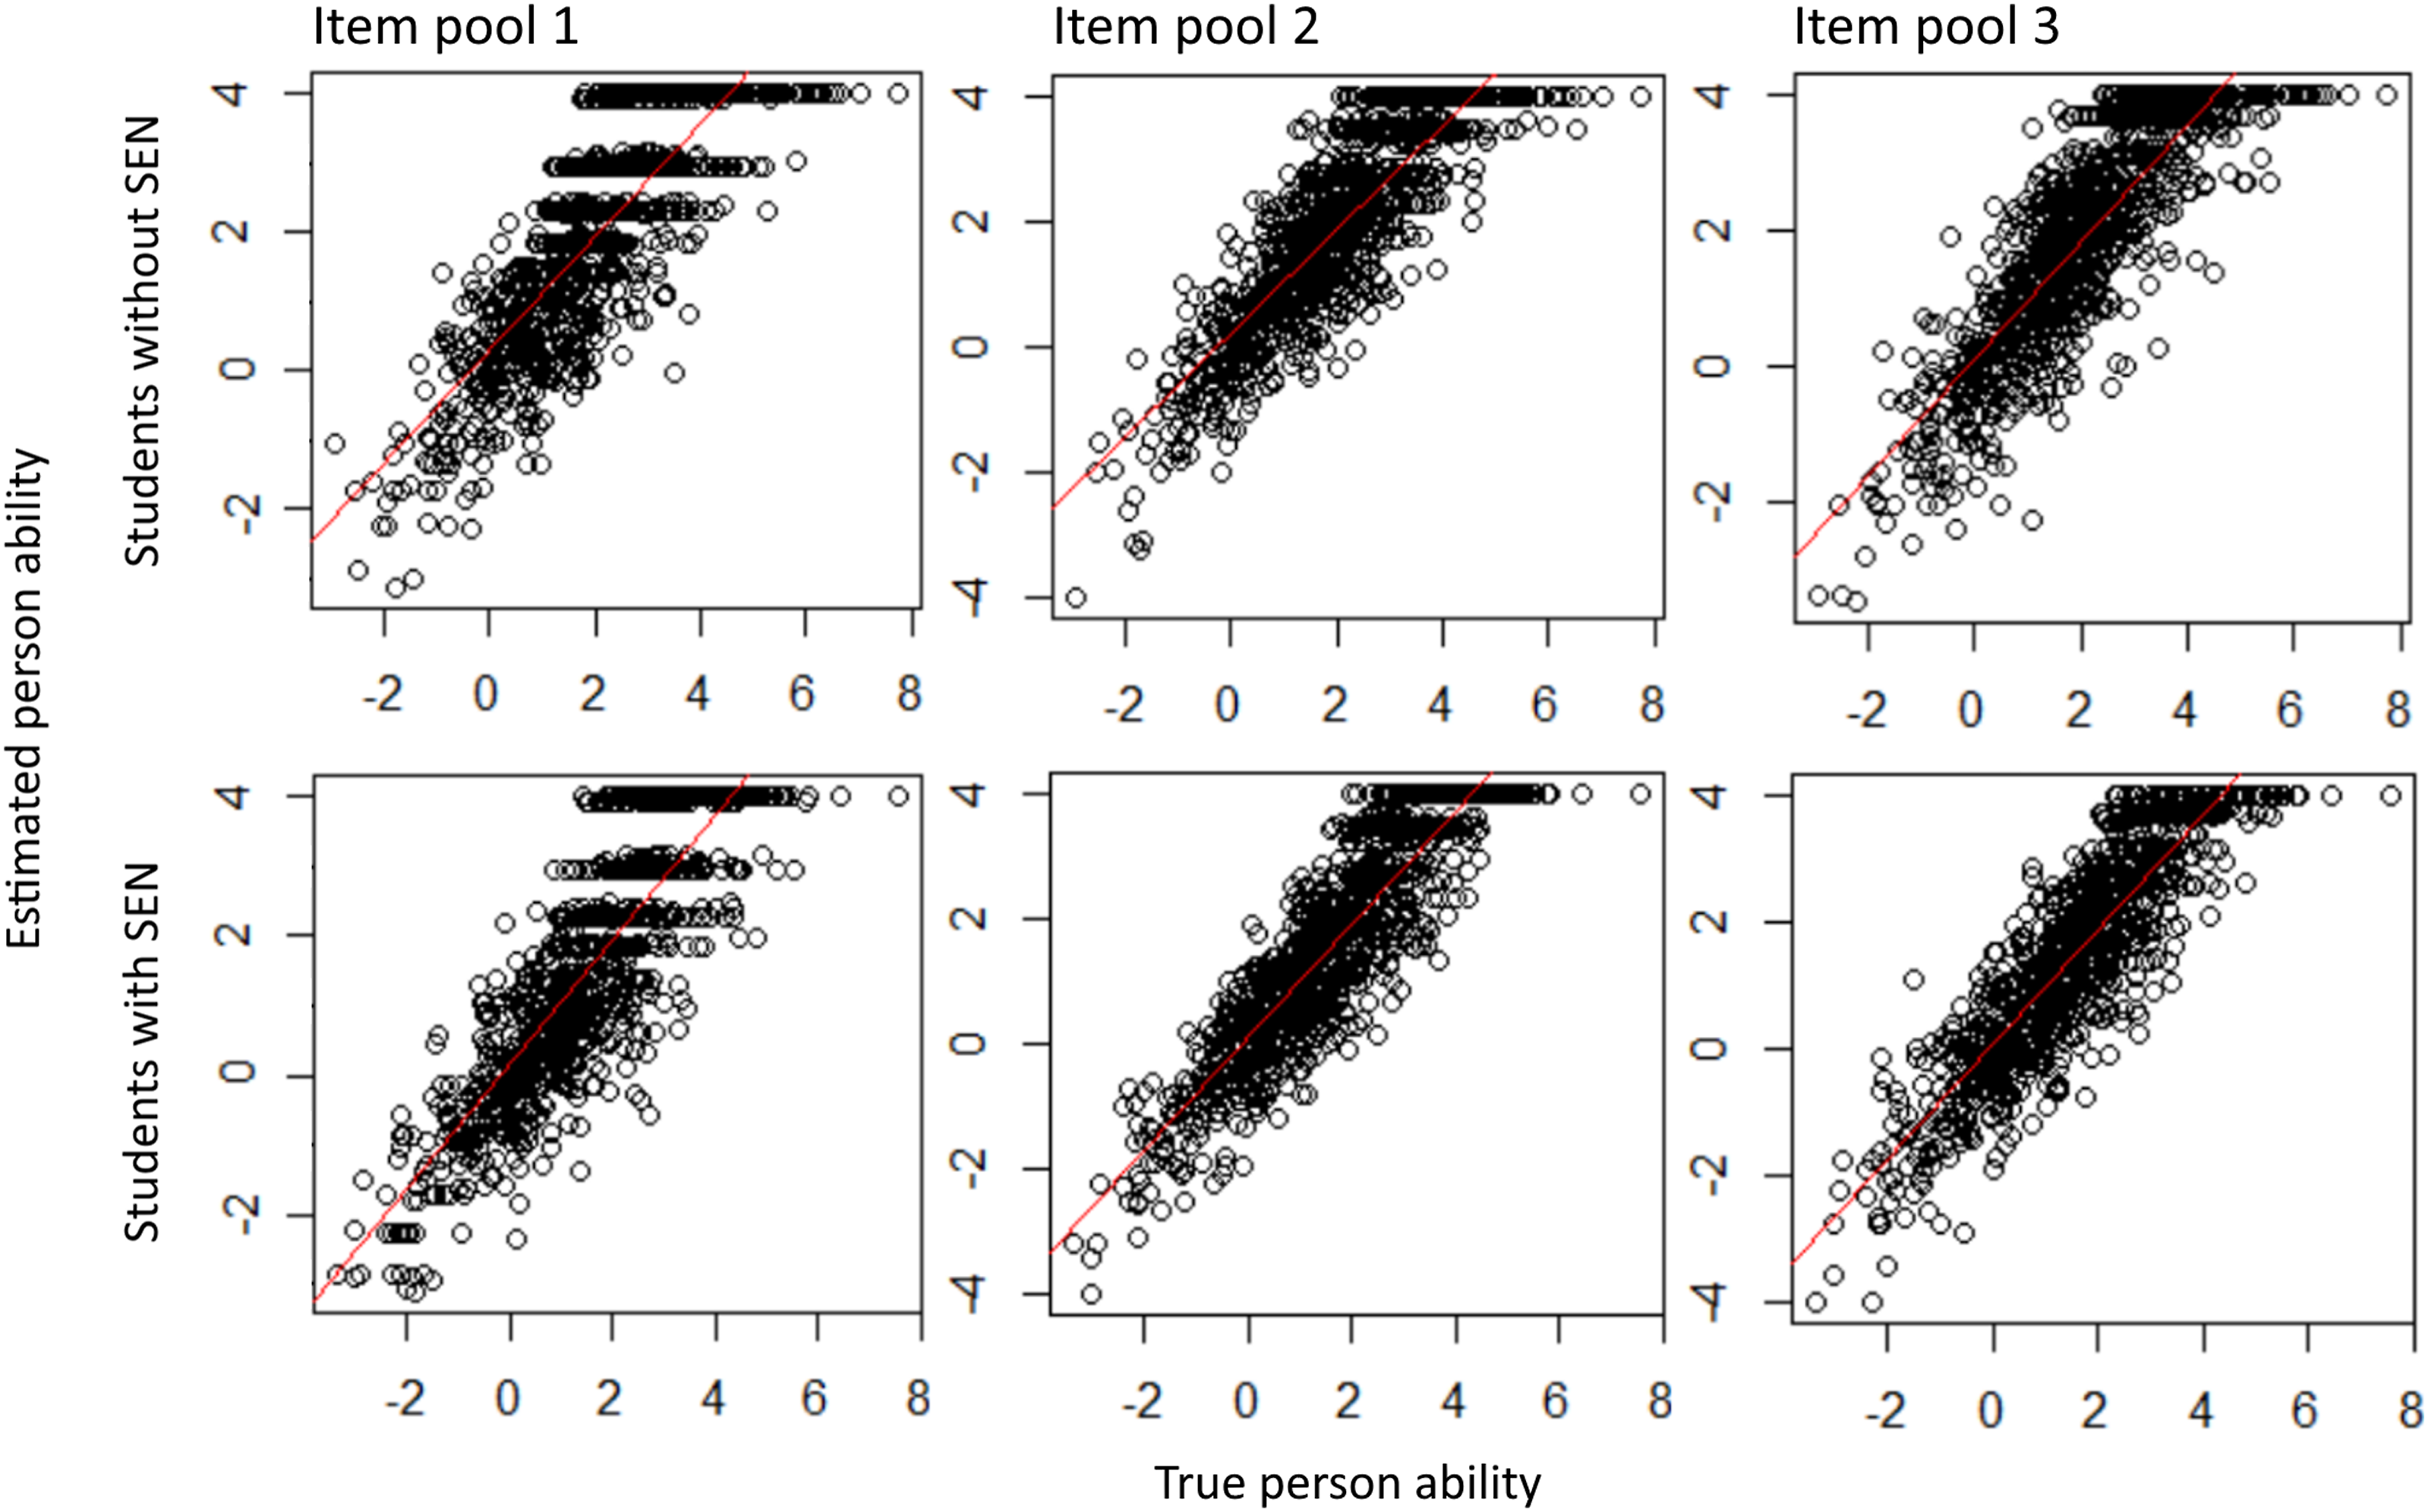
Item pool 1, despite containing the fewest items, is tailored to focus primarily on the lower performance range, enabling the measurement of an individual’s ability up to a logit of −3 and providing the most accurate measures within the logits of −3 and 2. However, as the values increase, the estimation accuracy diminishes. This limitation s apparent as only specific values (2.5, 3, 4) are estimated, leading to reduced variability. To counteract this effect, the addition of more items to the pool while maintaining a distribution that prioritizes the lower range can be beneficial.
Item pool 2 demonstrated higher accuracy and a broader range for estimating the person’s ability. Similarly, Item pool 3 displays slightly improved accuracy for person abilities between 2.5 and 4 but experiences a decline in accuracy for values of −2 and lower. These findings remain consistent for both students with and without disabilities. However, given that students with disabilities exhibit significantly lower person abilities (t(292.64) = 3.60, p < .001), inaccuracies within the lower performance range have a more pronounced impact on this group, resulting in a greater number of students falling within this range.
Study 2
Results of Simulations Comparing Groups With Different Ability Distributions.
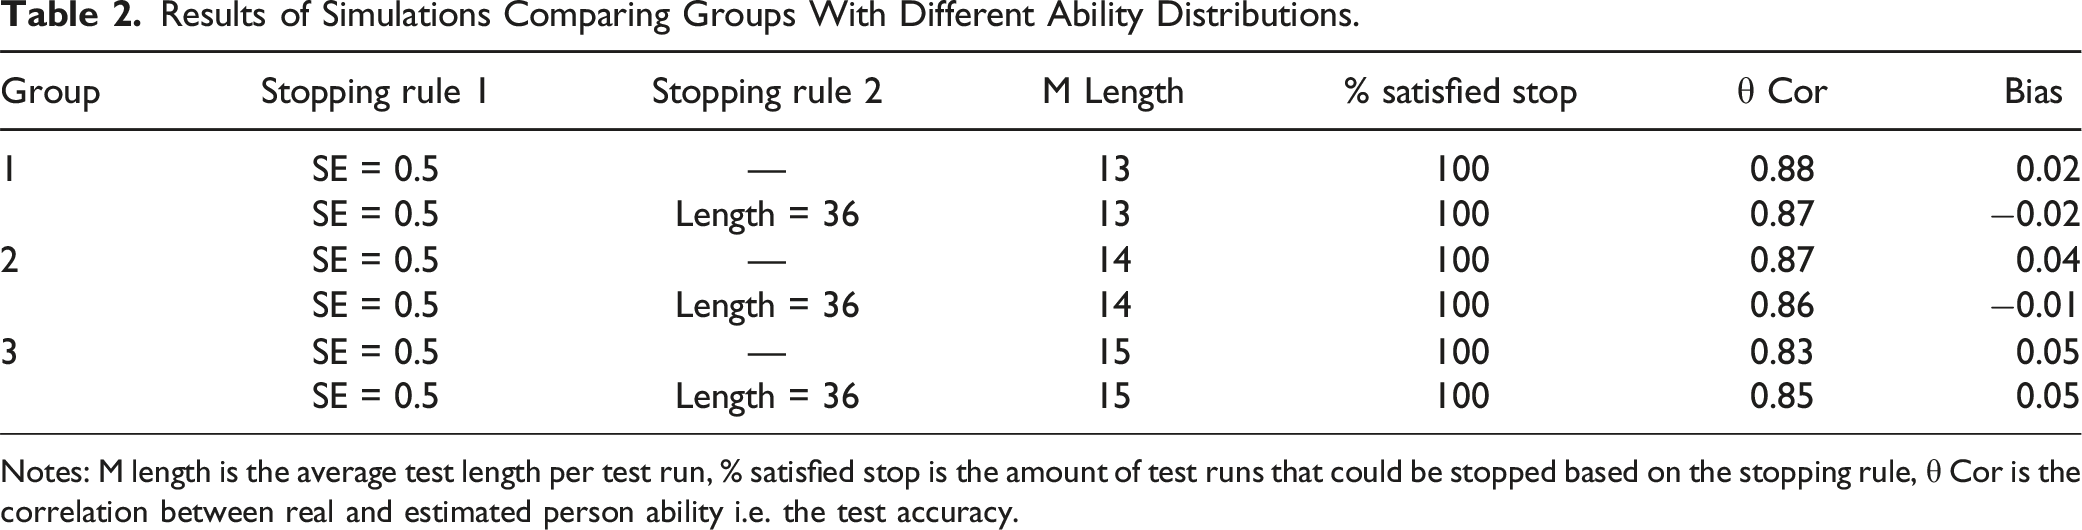
Notes: M length is the average test length per test run, % satisfied stop is the amount of test runs that could be stopped based on the stopping rule, θ Cor is the correlation between real and estimated person ability i.e. the test accuracy.
The CATs can accurately assess students whose reading test scores deviate up to two SDs from the norm (Figure 4). However, students whose scores deviate by more than two SDs experience less accurately assessments by the CAT. Hence, we observe a similar pattern as in the case of higher ability ranges in Study 1, wherein only specific values are estimated with reduced variability. This inaccuracy effect becomes more pronounced at lower ability levels and is particular prominent in Group 3. The presence of such floor effects is likely contributing to lower accuracy and longer test times for students with abilities that deviate more than two SDs from the norm. Accuracy of CAT for different distributed student abilities.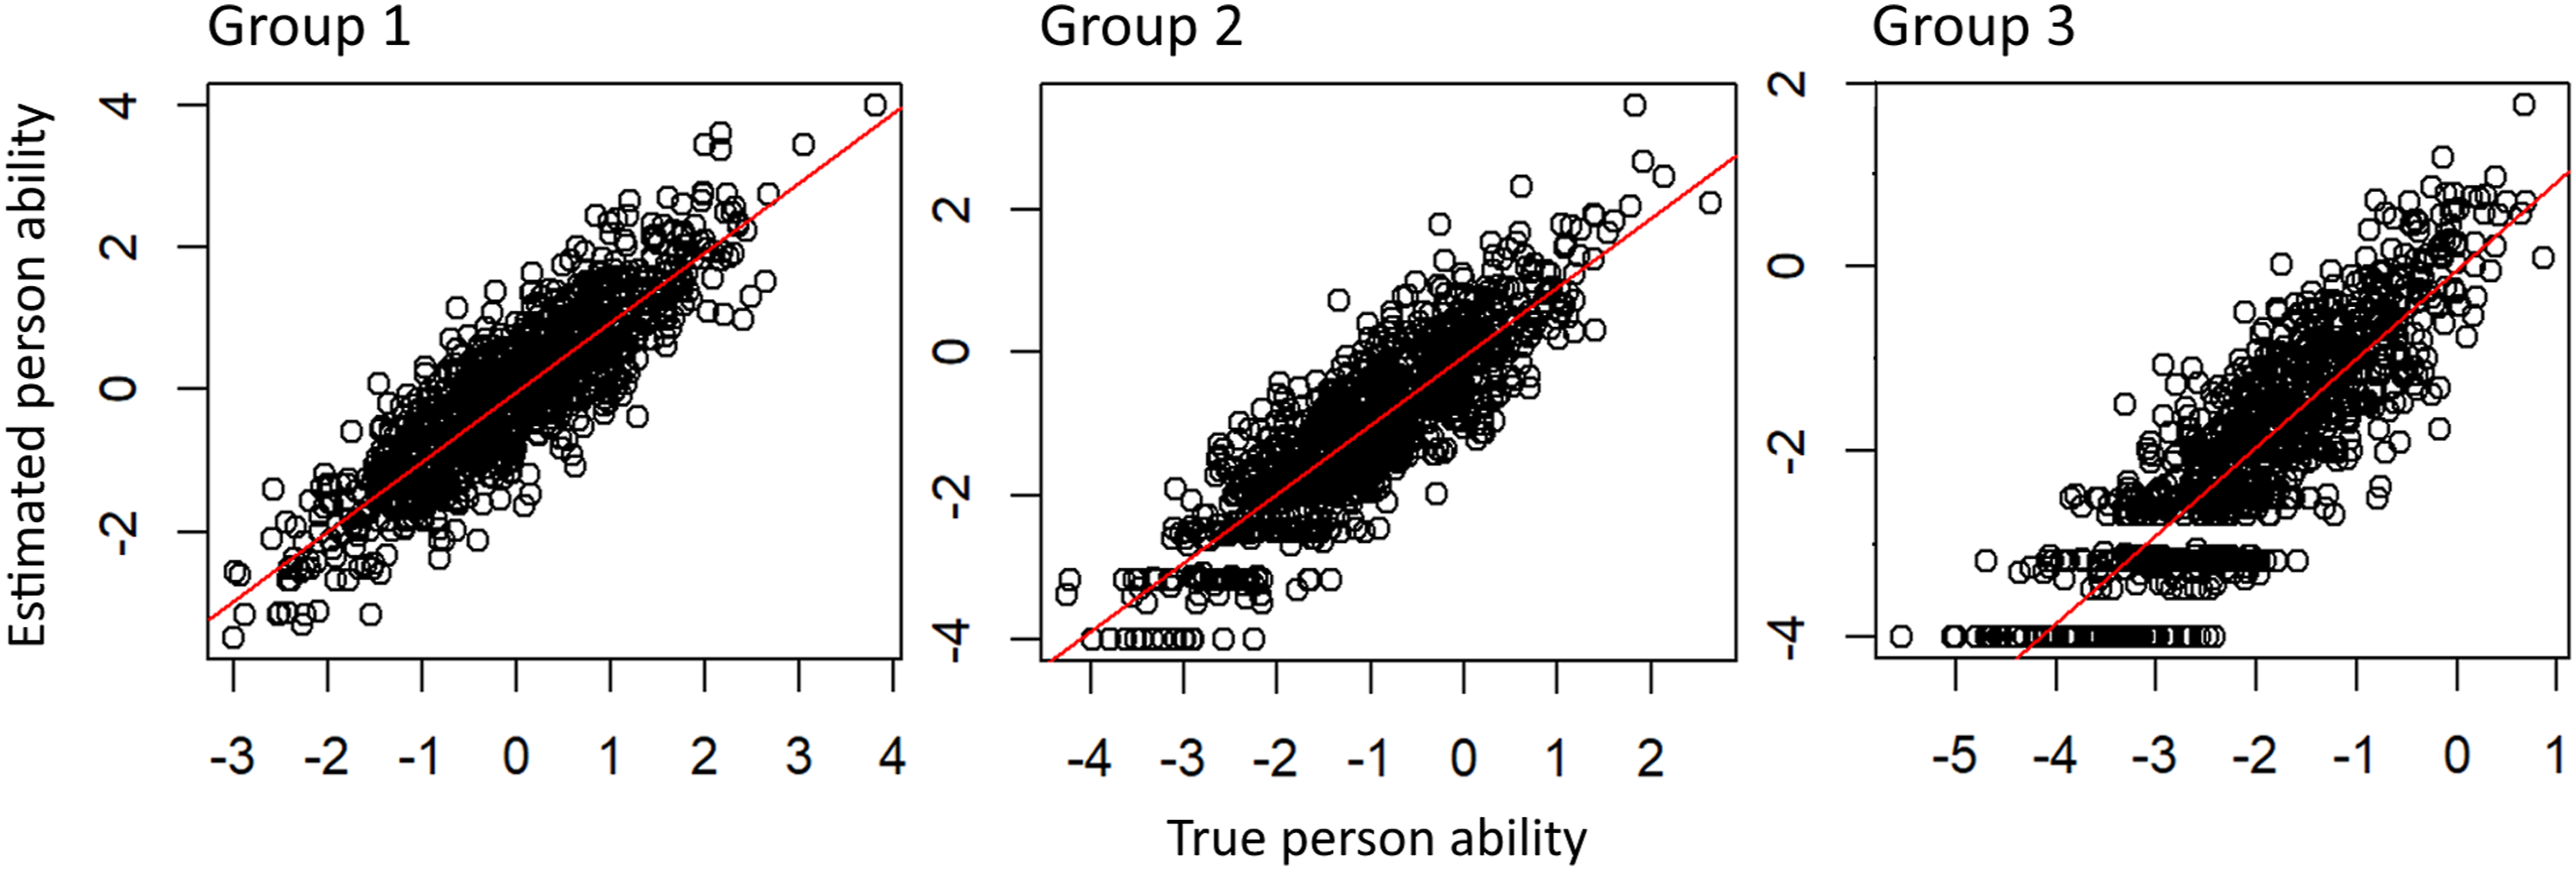
Discussion
CATs are innovative testing methods that are well-suited for the efficient and accurate assessment of students with disabilities. Thus, we can empirically support the assertion posited by Stone and Davey (2011) concerning the potential advantages of CATs for students with disabilities. CATs provide a range of technical and psychometric adaption options at various levels, facilitating the customization of assessments to students with disabilities.
At the level of the adaptive algorithm, the desired test accuracy can be specified. Our results suggest that greater test accuracy is correlated with an extended test duration, aligning with the conclusions drawn by Ebenbeck and Gebhardt (2022), Michiel et al. (2008), and Ludewig et al. (2022). On average, students with disabilities are evaluated with the same test accuracy as their peers without disabilities, yet with fewer items. This is generally beneficial as students with disabilities may encounter challenges in maintaining focus, and shorter tests may be more accommodating (Lancaster et al., 2001; Stevens, 2001; Swanson & Howell, 1996). Nevertheless, in educational settings, it might also be advantageous to assess students with disabilities or lower abilities using the same or slightly more items, rather than fewer items, to ensure a more precise measurement. This approach would provide a more accurate foundation for subsequent educational decisions and instruction. In such cases, it could be considered to accept a lower SE, such as 0.4 or 0.3, for students below a certain threshold to attain a more accurate measurement in areas of weaker performance.
Furthermore, adaptation can occur at the item pool level during the test development phase. Our study finding suggest that the distribution of item difficulty, particularly a higher proportion of easier items in the item pool, is more crucial in accurately measuring students with disabilities than merely the quantity of items in the pool. Our results indicate that small item pools (r = 0.94) can yield nearly as accurate measurements as large item pools (r = 0.97) in a CAT. By considering the type, difficulty, and quantity of such items, the specific skill areas of students with disabilities can be targeted and accommodated in the construction of CATs.
Moreover, a more focused item pool offers the advantage of requiring fewer items overall. With a smaller item pool, the necessary pretesting becomes less burdensome for students, as they have a reduced number of items to complete during the development phase. This simplifies the process of developing CATs for schools with smaller sample sizes and limited time and resources.
To assess the reliability and fairness of the CAT, it is beneficial to conduct separate analyses of the results for low-performing students. By simulating CATs separately for students with and without disabilities, the presumed fairness and measurement accuracy can be evaluated and compared between the two groups. Furthermore, any disparities in measurement accuracy, particularly in the very high and very low ability ranges, as observed in our studies, can be identified early on, prompting the creation of additional items to address these disparities.
Such analyses are especially feasible with digital tests, while assessing the fairness of a paper-pencil test presents greater challenges. Overall, conducting fairness analyses through CAT and using CAT itself leads to a decreased necessity for test accommodations and other test adaptions (Thurlow et al., 2011; Vidal Rodeiro & Macinska, 2022), as the test inherently enables the required adaptations. Additionally, other test accommodations, including using larger fonts or creating visually less stimulating test environments, can be effortlessly and promptly implemented in a digital format.
Limitations
In our approach, we used simulation as a convenient and time-efficient method for investigating adaptive testing. Simulations, by their nature, are based on models and assumptions that may not fully capture the intricacies of real-world testing scenarios. This limitation is mirrored in the field of assessing students with disabilities, where real-world testing is influences by various contextual factors, such as student engagement and test motivation during the administration process. These crucial issues should be thoroughly examined in future empirical studies conducted in authentic educational settings.
Furthermore, it is essential to note that our study focused solely on specific types of disabilities. Therefore, our findings do not offer specific insight into students with intellectual disabilities or physical limitations. While expanding of the simulated sample in Study 2 broadened our scope, it still limits the direct applicability of our findings to students with more profound performance limitations.
Future Directions and Implications
CATs can form an integral part of a comprehensive learning environment that incorporates AI-based feedback and personalized practice tasks for students (Chen et al., 2022; Choi et al., 2020; Georgiadou et al., 2006). Following completion of a CAT, students can receive immediate and tailored feedback based on their performance, enabling them to pinpoint areas for improvement and hone their skills. Moreover, data gathered from practice tasks can inform and enhance the CAT measurement process. Insights gleaned from student performance can be used to refine item pools, adjust item difficulty levels, and fine-tune adaptive algorithms to ensure more accurate assessments.
This continuous feedback loop between assessment and learning fosters the development of more accurate and customized measurement tools that align with students' abilities and learning requirements. Consequently, a comprehensive learning environment facilitates ongoing monitoring of learning progress. Teachers and special educators can monitor student growth over time, identify patterns, and make informed instructional decisions based on the collected data (Schildkamp et al., 2012). They can also use this information to develop appropriate interventions and tailored instruction for their students.
Footnotes
Declaration of Conflicting Interests
The author(s) declared no potential conflicts of interest with respect to the research, authorship, and/or publication of this article.
Funding
The author(s) disclosed receipt of the following financial support for the research, authorship, and/or publication of this article: This work was supported by the German Federal Ministry of Education and Research, 01NV2116D.