
Abstract
The political integration of the European Union (EU) is fragile for many reasons, not least the reassertion of nationalism. That said, if we examine specific practices and infrastructures, a more complicated story emerges. We juxtapose the political fragility of the EU in relation to the ongoing formation of data infrastructures in official statistics that take part in postnational enactments of Europe’s populations and territories. We develop this argument by analyzing transformations in how European populations are enacted through new technological infrastructures that seek to integrate national census data in “cubes” of cross-tabulated social topics and spatial “grids” of maps. In doing so, these infrastructures give meaning to what “is” Europe in ways that are both old and new. Through standardization and harmonization of social and geographical spaces, “old” geometries of organizing and mapping populations are deployed along with “new” topological arrangements that mix and fold categories of population. Furthermore, we consider how grids and cubes are generative of methodological topologies by closing the distances or differences between methods and making their data equivalent. By paying attention to these practices and infrastructures, we examine how they enable reconfiguring what is known and imagined as Europe and how it is governed.
Introduction: From Standardization to Multiplicities
The aftermath of the Brexit vote has revealed numerous political fissures that make up an already precarious and fragile European Union (EU). It has also rekindled solutions such as appeals for a “two-speed” Europe but also a flexible Europe whereby different state groupings can coexist within the same EU club ( The Economist 2016). From the Eurozone and Schengen passport-free zone to Britain’s effort to negotiate an à la carte arrangement, the EU has since its inception operated at different speeds and degrees of integration of its member states. Recently, at a panel of the 2017 World Economic Forum, Mario Monti appealed again to a looser EU based on the concept of a “topic geometry” in which national governments could play a greater role. 1
In many ways, Europe has always been a multiplicity composed by practices based on different social and spatial orderings. It is in this sense that we approach the question of Europe through two recently adopted and practiced geometries in official statistics, specifically the cubes of cross-tabulated social categories and the spatial grids of maps. By geometries, we mean the characteristics of a “shape” through which social and spatial relations are established between people. 2 As documented in histories of statistics, geometry is a property of all population statistics (Desrosières 1998; Kitchin and Dodge 2011; Porter 1995) such as the shapes of cross-tabulations that corelate two population categories (e.g., age and sex) and maps that locate population categories in administrative and political geographic units (e.g., municipalities). Historically, these social and spatial geometries have been produced and organized within and as national spaces and then combined to constitute Europe. From maps to statistical tables, the population of Europe is typically composed of as the sum of nationally bordered geographies (France, United Kingdom, etc.) and population categories (ages, genders, etc.). However, the two new infrastructures of cubes and grids will enable Europe to be combined not according to such national orderings but standardized transnational ones. To anticipate our argument, the conventional geometries of Europe are being innovated through investments in infrastructures that affect how European populations can be assembled, known, and made governable. In this way, we follow scholarship that has demonstrated that knowledge infrastructures are central to statecraft, not only in telling about but also in making up the modern nation (Anderson 1991; Savage 2010).
Population geometries practiced as combinations of nation states are also prevalent in institutional arrangements such as the Council of Europe or United Nations Economic Commission for Europe (UNECE). However, technical practices have long traversed the institutional and political boundaries of member states and composed Europe as a multiplicity of social and geographic spaces. Or, as we argue in relation to the making of EU census data, Europe is composed of multiple social and spatial geometries. This multiplicity is enacted by technological practices and infrastructures that seek to meet practical problems such as transversal processes that do not recognize national borders like labor migration or the living arrangements of flexible workers.
The two emerging infrastructures that we examine are coordinated by the European Statistical System (ESS) 3 and will enable composing various populations within and across the national spaces of Europe. The first is the aggregation and combination of national census data in a geometry of detailed and multidimensional cross-tabulations of population categories (also referred to as topics). 4 Beginning in 2008, the European Parliament passed legislation for the submission of standardized national census data for the 2011 enumerations for the purposes of centralized dissemination. The legislation is part of a broader census harmonization program that aims to align different national census methods and practices through the establishment of standards such as on topic definitions (e.g., marital status) and spatial units. This led to the technical specification of an online infrastructure, the Census Hub. 5 It enables users to aggregate and compare population data from different countries according to multiple combinations of topics and at varying spatial scales. 6
Of interest to our argument is that data in the Census Hub are organized in a new social geometry referred to as hypercubes. Generally, Eurostat refers to hypercubes as a system of cross-tabulations supporting combinations of more than two topics. They function both as a dissemination program and an IT infrastructure (Eurostat 2011). We will return to the IT infrastructure later, but as a program, hypercubes are prescribed multidimensional tables that each member state is required to produce and which combine standardized census data for specified topics. For instance, hypercube 24 (of 60) for the 2011 census required combining data for the following topics: place of residence, persons working abroad, educational attainment, industry, country of birth, and continent of birth; EU/non-EU of citizenship; continent of citizenship; and year of arrival. For each cube, data were broken down into sufficiently small geographic areas and/or subcategories of the population to allow for flexible combinations. Described as “mesodata,” the breakdowns are smaller than “macrodata” at a national scale (regions and states), yet larger than “microdata” at the individual level (discrete persons; Radermacher et al. 2014). The social geometry of hypercubes thus enables a multiplicity of combinations of topics across Europe that were not previously possible.
From 2021, the Census Hub will also include a new spatial referent for population statistics. In addition to nationally defined administrative and political units such as regions and local areas, member states will provide data in standardized 1 km2 spatial grids. The introduction of grids follows two decades of international work that has established common georeferencing systems to link all data to a stabilized and standardized location. This is achieved by creating “point-based” spatial referents in the form of geocoordinates (x [longitude] and y [latitude] points) and then assigning each point an “identifier” so that myriad data can be linked (Inspire Thematic Working Group 2014; Field notes, ESS Meeting, December 9, 2015). The 1 km2 grid is the standard adopted by the ESS to overcome the incomparability of existing geographic units and enable combining data in variable geographies that can cut across national borders. Once incorporated into the Census Hub, they will enable novel spatial groupings according to flexible combinations of different population topics.
In later sections, we elaborate the rationales and technical specifications of cubes and grids. What we highlight here is that they are proposed to standardize, organize, and disseminate population data so that Europe can be known in new and myriad ways. When grids and cubes conjoin in the 2021 census, it will be possible to combine the geographical and social spaces of Europe in novel ways and in orderings that traverse national borders. What marks this moment is that infrastructural innovations mixing conventional geometries with new ones are enabling populations of Europe to be enacted in ways that have consequences for how it is imagined, known, and governed.
To identify and interpret these consequences, we engage with the concept of the performativity of methods as advanced in Science and Technology Studies (STS) (Law 2004; Mol 2002), from which it follows that data practices such as population censuses do not represent European populations but take part in bringing them into being. That is, censuses are not tools that discover populations as realities “out there” but involve sociotechnical relations that bring into being and reproduce them. That is, from the definition and adoption of categories such as marital status to their enumeration, censuses do not simply reflect or describe but also enact versions of populations through relations between people, methods, and technologies. We aim to highlight that this involves political struggles about what “is” Europe and that such struggles take place not only in parliaments but also through the design of infrastructures that seek to enact and know Europe as more than the sum of national parts. Our focus concerns what these infrastructures potentially set up, anticipate, and enable through their design. As we argue in our empirical analyses, the design of statistical infrastructures—the procedures, agreements, and software and hardware for assembling, analyzing, and disseminating European census data—can only seek to configure and enable such possibilities. What they come to enact is not predetermined. Rather, how they function in practice depends on how they are taken up and embedded in social relations and local practices (Bowker and Star 1999; Star 1999).
The concept of “geometries” may imply that cubes and grids are infrastructures designed, agreed upon, and then imposed in standardized forms on EU member states. Our study of cubes and grids instead shows their emergent and contingent qualities by drawing on several years of collaborative ethnographic research in the field of European official statistics, which involved following their developments and implementation across numerous national and international institutions. 7 The core of this article is based on our analysis of data from that research, most notably the observation of meetings of an ESS task force that met from 2015 to 2016 to decide on standards for European census regulations. However, this analysis is also informed by ethnographic fieldwork (interviews, participant observation, and the collection of official reports and other documentation) conducted during a longer period (2014-2017) and at other international organizations such as the UNECE and numerous National Statistical Institutes (NSIs). We compiled, classified, and shared our data in an NVivo, version 10 qualitative software database. For this article, we conducted a “thematic analysis” (Boyatzis 1995) of discussions on cubes and grids, enabling us to trace the diverse practices, interpretations, and struggles within and between statisticians and institutes. Our analysis resulted in the identification of several themes, which we narrate in this article in relation to examples from the ESS meetings to provide more specific insights about their meaning and implications for European statistics.
In what follows, we first step back to elaborate conceptions of geographic and social spaces that have inspired our interpretive work. Next, we take up these framings to analyze our ethnographic material with a focus on how cubes and grids are debated and prescribed and on the “topological orderings” of European populations that they enable and perform. It is in reference to the latter that we now turn.
Flexible Europe: Topologies
The making of European statistics involves specific practices, forces, and dynamics that cut across numerous NSIs and international statistical organizations (Scheel et al. 2016). This calls for moving beyond nationally bounded case studies, a research practice that has been described and problematized as “methodological nationalism” (Wimmer and Glick-Schiller 2003). Instead, statistical practices make up a transversal field of power where scales of the local, the national, and the transnational overlap and intersect. Cubes and grids are two such transversal practices. To capture what types of relations and spaces cubes and grids enable and in turn their implications, we draw on the concept of topology.
In human geography, topology has been adopted to escape the spatial trappings of Euclidian geometry and to approach scale and territory, networks, and relations in a less rigid manner to address how power is exercised (Allen 2016). Drawing from insights of Leibniz, Deleuze (2006), and Serres and Latour (1995), Allen notes how geographers have come to conceive of the “distortions” of territories, “twists” in political spatial arrangements, and “folding” of the global and local, such that “here” and “there” are less a measure of kilometers than relations. That is, while topographies consist of measures of distances, topologies are based on measures of relations. So, for example, power relations can be understood less as a matter of fixed distances and proximities, as suggested by Massey’s (1999) “power-geometries” 8 than as a matter of presence through their reach and intensity. That is, power, rather than being produced by places or points in a network, is something leveraged by actors and felt through practices that can have reach across distant places. However, as Allen (2016) notes, power topologies can include topographical orderings in practice, that is, the familiar and conventional measurements of distances and flat surfaces (p. 18). In sum, to think in terms of topology is to find ways of addressing that “our experience of what is near and what is far, what is past and what is present, even how it is possible for others to be more or less present in the here and now of daily life, has been shifting for a while, for some at least” (Allen 2016, 8).
While Allen and others approach topology to examine the exercise of government power and the folding of spatial arrangements, researchers in sociology, STS, and related fields have adopted topology to understand relations between people and technologies as heterogeneous and unstable mixtures that may fold spatial, temporal, and social relations in new ways (Law and Singleton 2005; Lury 2009; Law and Mol 2001; Bauman et al. 2014; Basaran et al. 2017; M’charek 2014). For instance, De Laet and Mol (2000) study how a seemingly standardized water pump is used in variable and mutable ways in the villages of Zimbabwe. While the water pump may travel to distant sites, it is part of unstable relations with people and other things. Combining these insights with Allen’s work, what matters for us is how grids and cubes are potentially generative of two kinds of topological orderings. First, by enabling forms of mixing, merging, and combining spatial and social relations that transcend national population orderings, they can be generative of novel enactments of what is Europe. As we will describe below, distant locations and social groupings can be brought closer together and combined in ways that suppress national differences. We refer to these forms as spatial and social topologies that “denationalize” Europe in the sense that national orderings persist (as do Euclidean geometries) but are folded into postnational ones that are not based on national borders or constituted by different scales that are layered and stacked (Isin 2007; Sassen 2008). Instead, the national and international coexist and their relative force and meaning become matters of empirical investigation (Aradau et al. 2015).
Second, we engage with topology to consider how grids and cubes also enable the closing of distances and differences between methods by bringing their data together as equivalences. Grids and cubes twist and fold the data produced by myriad statistical methods and technological practices of standardization. They do so by doing away with methodological differences by treating their data as equivalent. In this regard, we adopt how topology is conceived in STS research where knowledge practices are understood as made up of heterogeneous mixtures of elements that can be discontinuous, unpredictable, and generate varying arrangements, while at the same time retaining some stable properties (Law and Mol 2001). We take up this understanding by referring to “methodological topologies” to capture the variations in methods that come to make up the data of cubes and grids and denationalize in the sense that they suppress national methodological differences by folding them into a postnational sameness.
“Technological zones,” as argued by Barry (2006), create common standards by reducing the differences between technical practices, procedures, and forms and thereby support forms of government not inherently tied to territorial borders. However, we suggest that while infrastructures such as cubes and grids may smooth out such differences through the standardization of methods, they mostly achieve this by enabling differences to coexist. In our empirical analysis, we identify how standards “in practice” are generative of differences for several reasons, not least because of differences in methods. Standardization is also often resisted because methods involve “locked in” infrastructural investments on the part of NSIs that have gone through long processes of sedimentation, which makes it difficult to think and do otherwise (Law, Ruppert, and Savage 2011). 9 Furthermore, the practices of NSIs are part of other state statistical practices (in education, for example) and expertise (in computation, for example) that influence how standards are interpreted and implemented.
It is with these understandings that we think about how grids and cubes make it possible to enact Europe not as a whole but as multiple spatial, temporal, social, and methodological topologies. Different elements can be combined enabling different versions of Europe as multiple (de-national) populations. As we will argue below, rather than comparing states for differences and likenesses, they enable establishing and comparing relations not between states but between small social and spatial groupings across Europe. For example, social spaces of European labor mobility or social deprivation can be enacted by combining parts of multiple countries that are similar. As our discussion of the practical negotiations involved in the making of cubes and grids points out, to divide up Europe is not to simply zoom in on something already there or to partition an existing population (Grommé 2016). It is the work of setting up new relational spaces through specific practices and infrastructures by which Europe can be (re)composed. To say so does not mean that technical practices add up to a single whole (Mackenzie 2012; Strathern 2005; Latour et al. 2012). Rather than the “whole” of Europe, we attend to how multiple and variable relations and parts can be combined in myriad ways to constitute Europe as a multiplicity.
We begin our analysis with the geometry of cubes. Drawing on observations of discussions among ESS statisticians at meetings on the design of hypercubes and supporting documentation, we highlight their potential for enacting a combinatorial Europe through methodological topologies.
Cubes: Combinatorial Europe
In the integrated European Union, national censuses are of greater value if their results can be compared between Member States. This is why the European Union is taking steps to harmonise census outputs. (Eurostat 2011, 3)
This changed with the 2011 censuses and the 2014 launch of the ESS Census Hub (Figure 1). The motivation, as expressed in a promotional booklet, was to provide data in a way that is more user-friendly in terms of comprehensiveness (accessing standardized data for all of Europe) and at a level of detail that would enable users to generate their own multidimensional tables of topics by “selecting and arranging the tables as you need and then ‘cut and paste’ them” (Eurostat 2014, n.p.). To return to the example, the Census Hub interface as shown in Figure 1 allows users to generate tables that show how many men across Europe’s regions are fifty to fifty-four years old, unemployed, and divorced. In the words of Eurostat, it enables a wider user group “to explore the context of socio-economic phenomena better in the light of people’s background, e.g. their household and family situation or migration history” (Eurostat 2011, 3).
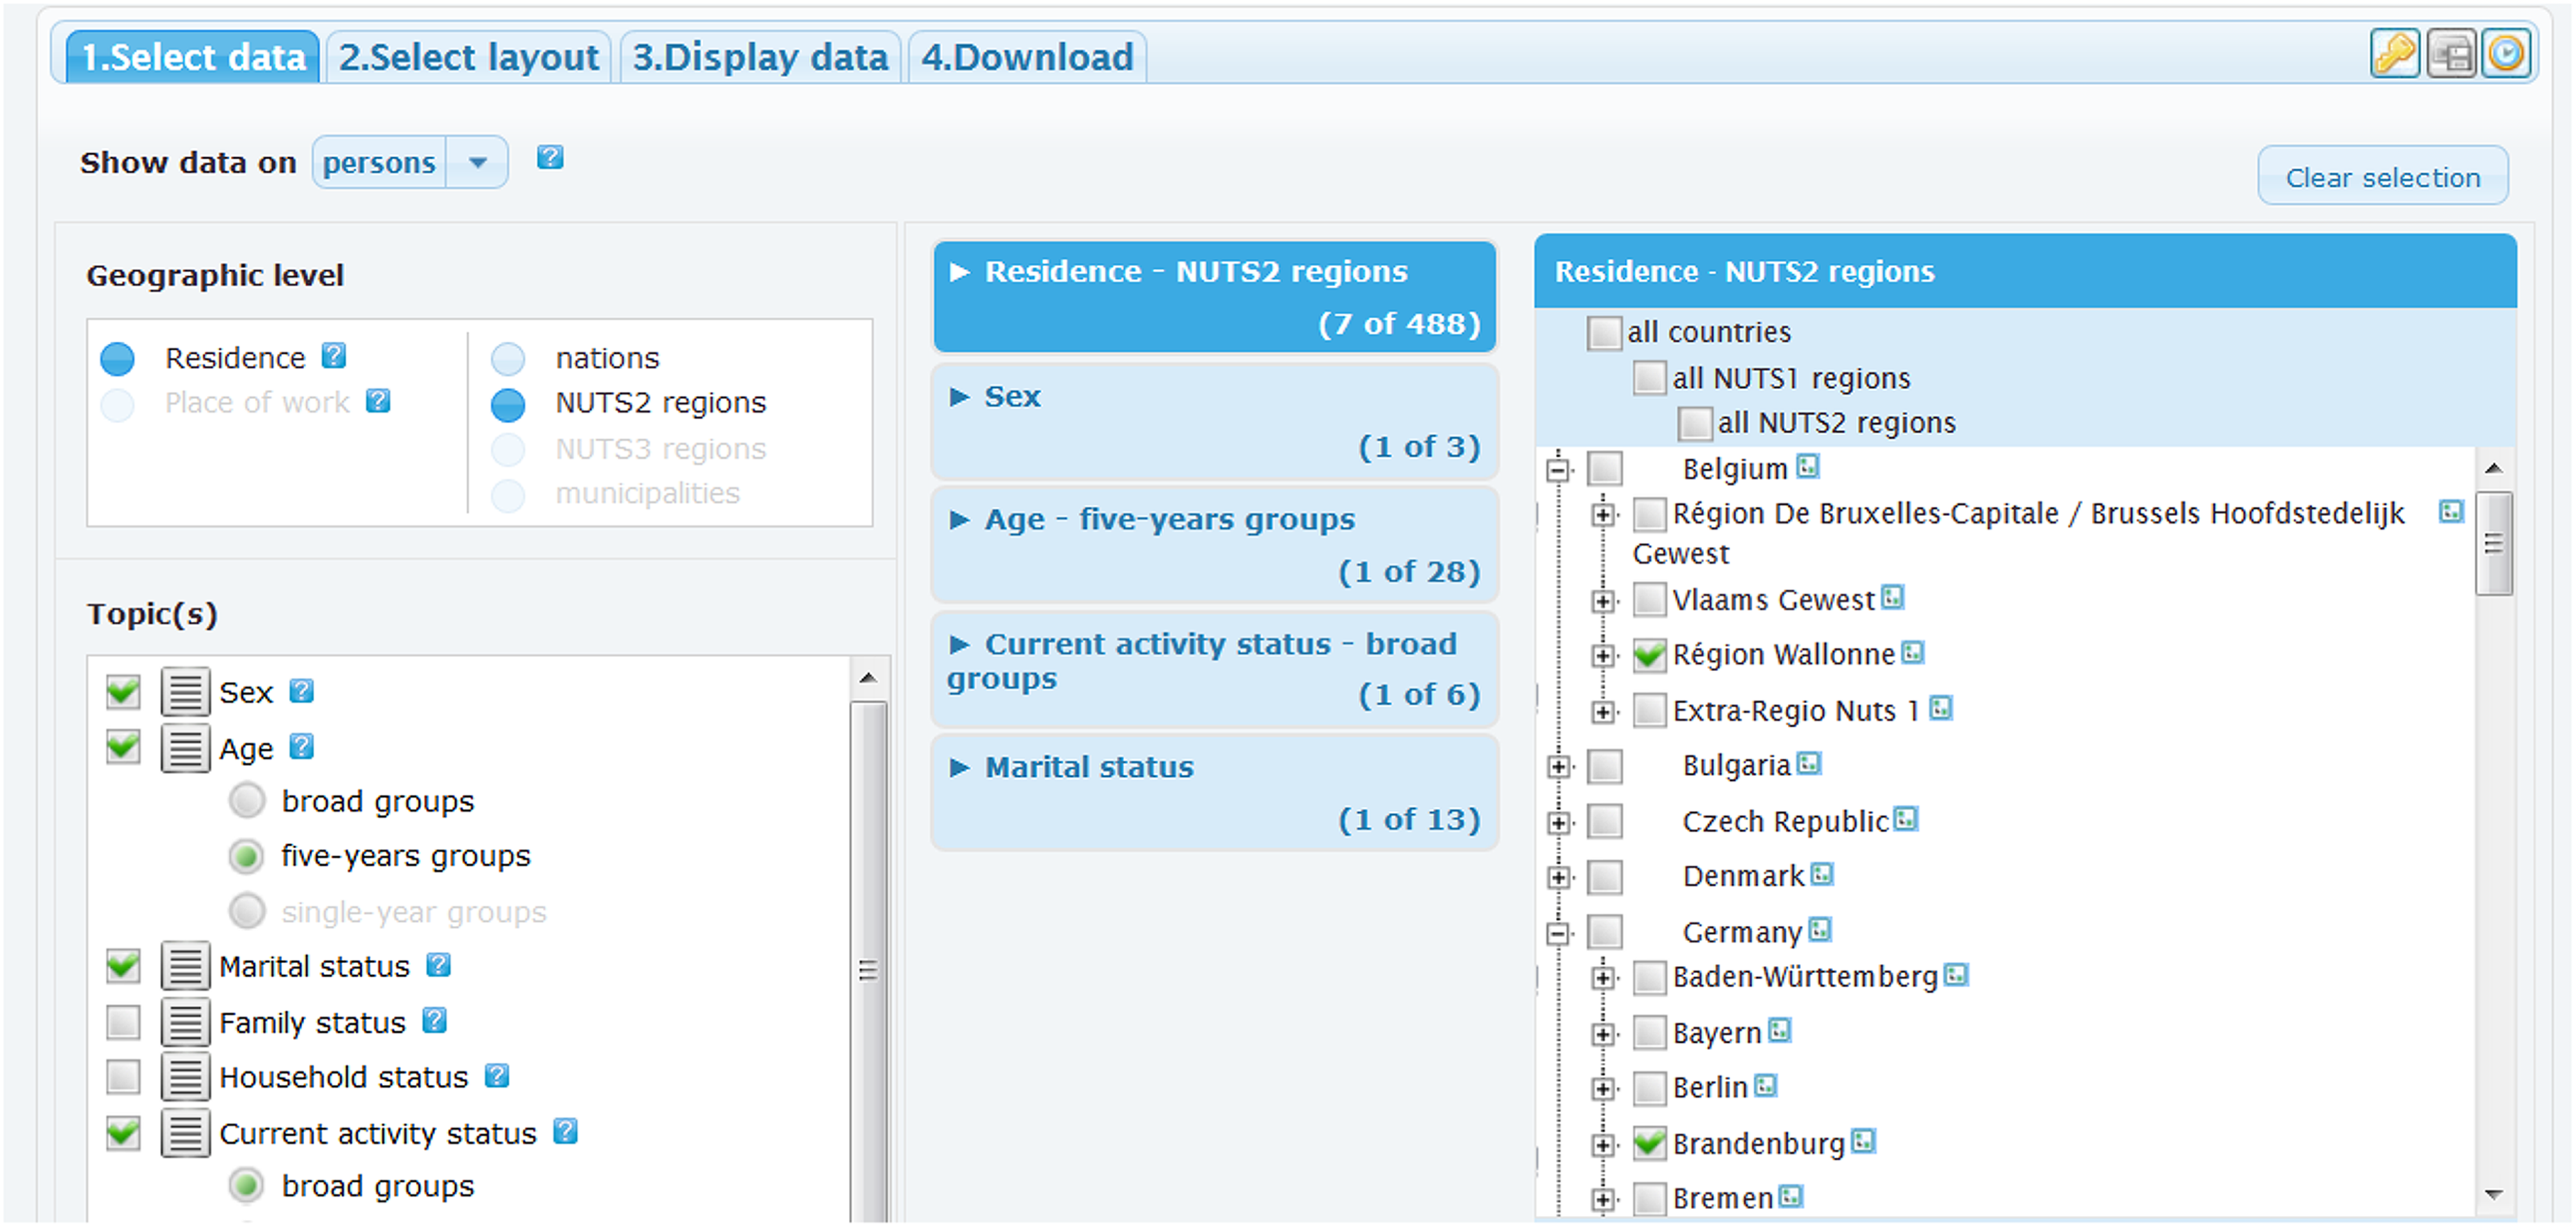
Combining topics across Europe: Screenshot of the Eurostat Census Hub. Source: https://ec.europa.eu/CensusHub2/query.do?step=selectHyperCube&qhc=false (accessed October 18, 2017).
In these ways, the platform not only facilitates comparisons between member states. It makes it possible to combine various topics and enact the European population as a series of variable social parts or what we later suggest is a combinatorial Europe. This is made possible by the infrastructure of “hypercubes” that make up the Census Hub. As mentioned in the Introduction section, Eurostat generally refers to hypercubes as a system of cross-tabulations supporting combinations of more than two topics. To illustrate, a hypercube on current activity status (employment) includes fifty- to fifty-four-year-old men, subcategories of men and women in five-year groupings, activity status, and marital status.
Next to a program of cross-tabulations, the hypercubes are also referred to as an “IT infrastructure” existing of “electronic tables” (Eurostat 2011, 12). These tables are produced by each NSI using a technical standard for the exchange of database information (Statistical Data and Metadata eXchange). XML files prepared for the Census Hub contain what some NSI statisticians refer to as an “additional layer” of standardized topics and categories for each hypercube (Process Developer, Statistics Netherlands, interviewed on September 29, 2015). Each NSI is responsible for establishing dedicated servers to host the Census Hub data, which are separate from servers used to manage and disseminate national data for statistics. When users query the Census Hub, data are pulled from these dedicated national servers. The IT infrastructure thus consists of a distributed network of servers across all European NSIs from which data can be pulled into the Census Hub server. Figure 2 is an example of a query result and constitutes a single cell of a hypercube.
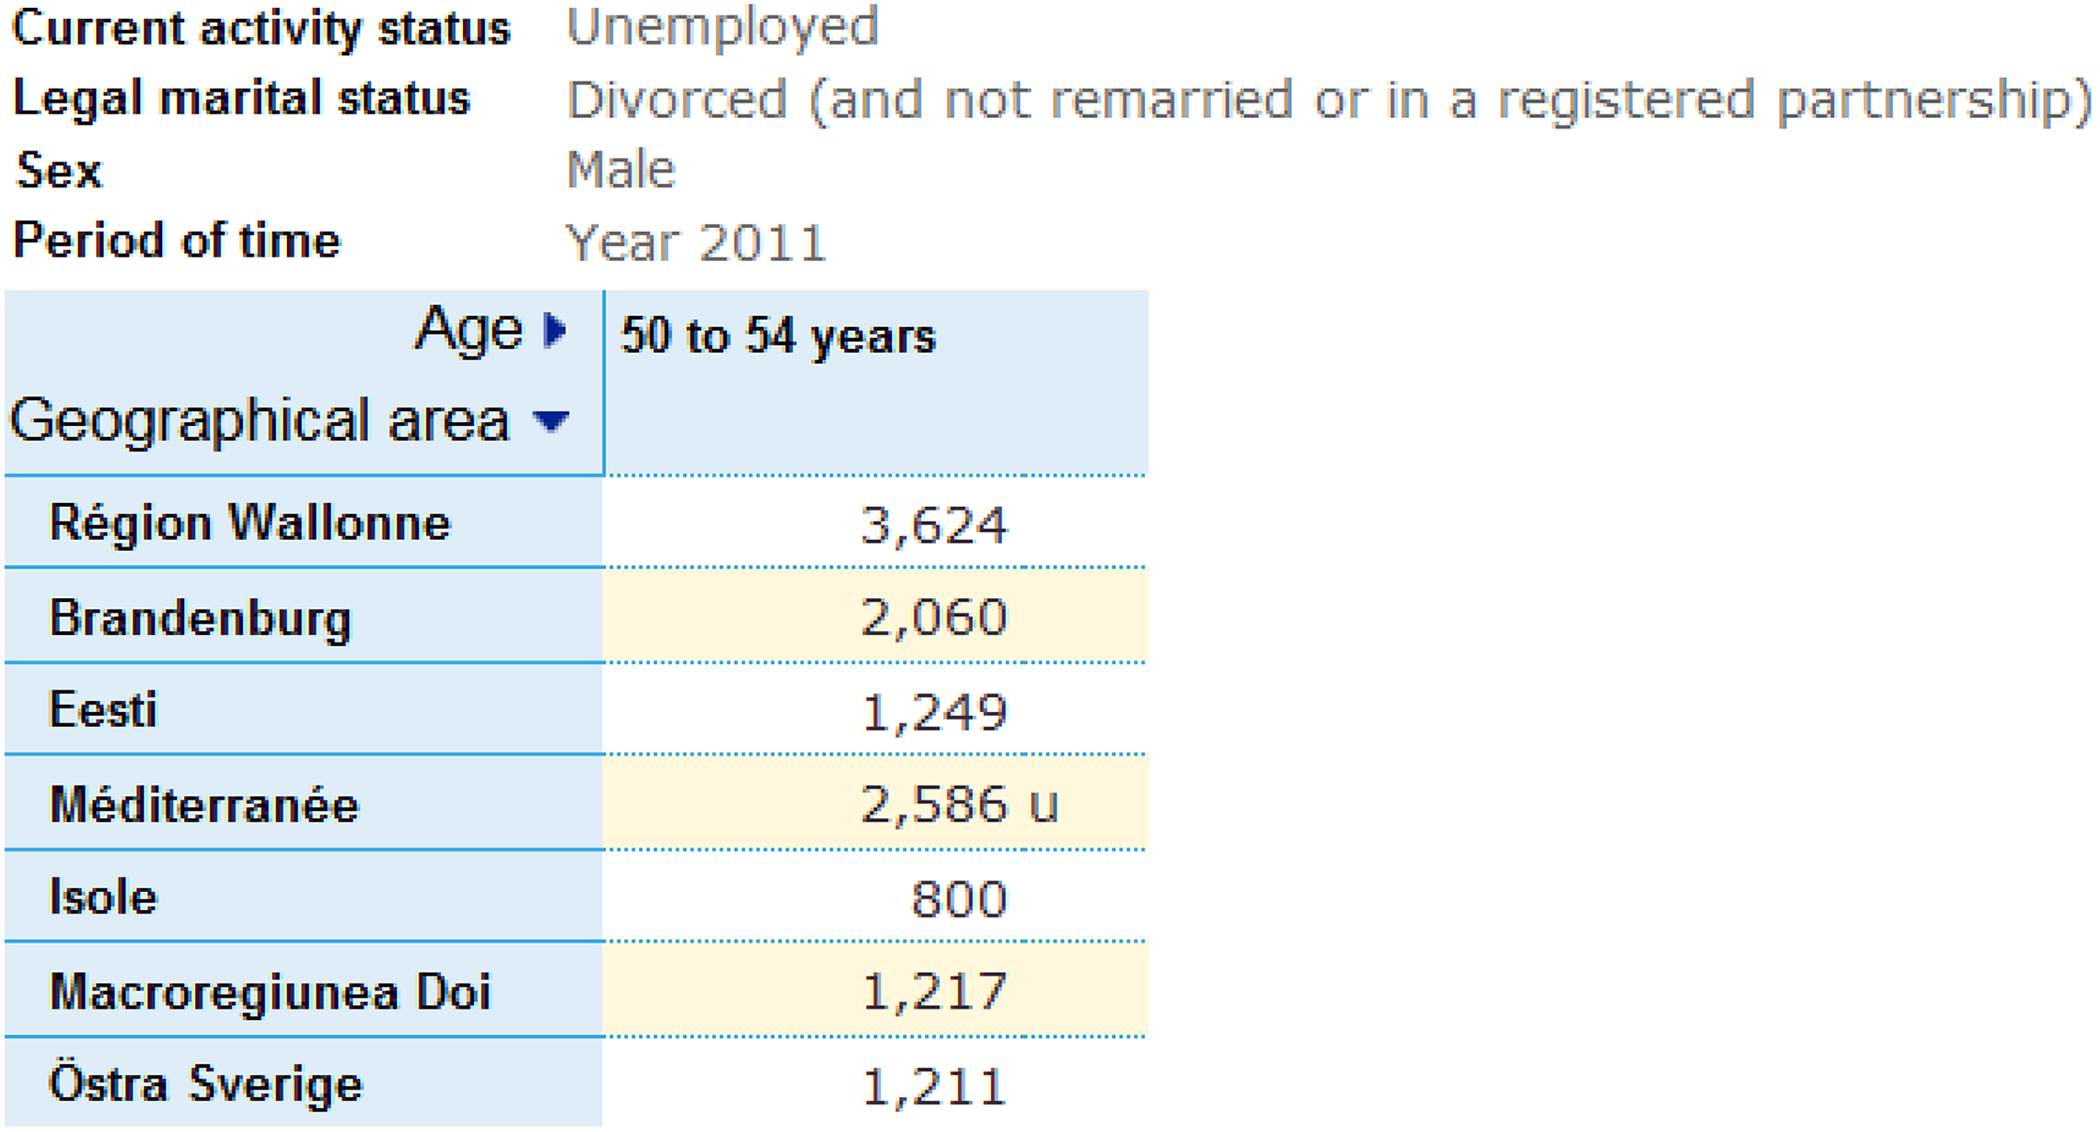
A Census Hub output combining census data across a random selection of European Union regions (left column, displayed by Eurostat in the vernacular languages of the regions) combining fifty- to fifty-four-year-old men, marital status (divorced), and current activity status (unemployed). Source: https://ec.europa.eu/CensusHub2 (accessed October 18, 2017).
The 2011 census regulations prescribed sixty hypercubes for the Census Hub consisting of different combinations of up to eight topics. Consequently, each NSI had to generate billions of hypercube cells and store them in their dedicated servers, many of which were empty because data were unavailable, while other cells duplicated data, and yet others were based on “unreliable” data. While enabling new combinations of topics across Europe, the geometry of cubes thus generated practical “data problems,” which led to NSI statisticians calling for its simplification. As one NSI statistician noted: “We would never have published [data] like this ourselves, this calls for drastic reduction of dimensions to get sensible tables (…) Too many dimensions also sacrifices quality” (Field notes, ESS Meeting, March 23, 2015). These data problems were thus the subject of intense negotiations conducted at meetings convened by the ESS to consider proposed revisions to the Census Hub for the 2021 census program.
However, as we discuss below, while the result of these negotiations was the agreement to reduce the number of dimensions of some hypercubes, many of these data problems will persist in part as a result of continuing methodological differences in how data are produced by NSIs. Of interest to our argument is how this was justified on the grounds that high-dimensional combinations are necessary to meet European policy needs. Below, we discuss this rationale as generative of methodological topologies that will be performative of social spaces of Europe that otherwise would not exist. We demonstrate this in relation to data problems concerning three topics: educational attainment, marital status, and family status (with regard to same-sex unions).
On educational attainment, several NSI statisticians protested combining this topic with others. As one statistician stated: Whenever education is introduced then you introduce estimation and this raises a quality issue; how crucial is [hypercube] 160-163? Can we say that there are users who see this as crucial? For instance, we ask users to make the trade-off between maximizing detail and quality and optimizing both is the objective. (Field notes, ESS Meeting, June 30, 2015)
One consequence for the topic of educational attainment is that many NSIs relying on registers do not have complete data on education due to, among other reasons, the variety of educational programs and degrees. NSIs in this position instead acquire data on educational attainment from existing sample surveys. However, because surveys do not cover all educational programs or all categories of a population (e.g., all age ranges), they often have to estimate data using elaborate weighting models. When combinations of more topics are proposed, these estimations become even more complex, as one NSI statistician noted: “we get many of these variables via LFS [Labour Force Survey, a routine sample survey]; the more detailed and higher the number of crosstabs means the more difficult to estimate” (Field notes, ESS Meeting, June 30, 2015). The types of problems vary among NSIs and hypercubes, but one is that a question in a sample survey may only be answered by a few people within a certain age bracket, region, or type of educational attainment, employment status, and so on. Thus, an estimation model for a combination of these topics will be less reliable as it would be based on a small number of observations (Statistics Netherlands 2014). By contrast, such data problems do not apply to hypercubes based on full enumeration questionnaires.
In response to these complexities, some NSI statisticians proposed reducing the number of hypercube dimensions. Eurostat, however, favored enabling as many combinations as possible between education, economic, and mobility topics as these are “highlighted as priority data on free movement as part of the basic rights of EU citizens” by European Commission policy Directorates (European Parliament and Council 2016, 4). Furthermore, “it would not be possible to accept this proposed change without significantly changing the multi-dimensional nature of the census data––which would represent a major reduction in the value of these data to users” (European Parliament and Council 2016, 5-6). The adopted solution was that data marked as “unreliable” by NSIs would not be available for extraction in the Census Hub on a low geographic level in combination with subcategories of other topics, but “could be used in the calculation of EU aggregates” (European Parliament and Council 2016, 6).
In this way, the geometry of cubes will be generative of methodological topologies by closing the distances (differences) between methods and enabling the data they generate to be brought together and treated as equivalent. These differences include the temporalities of methods, which produce data according to varying measurement periods (week, month) and reference points in time (specific dates). Yet, queries to the Census Hub will flatten these differences into a single census date—January 1, 2021—and thereby allow a Europe that is methodologically “multitemporal” (Serres and Latour 1995). 11 Following M’charek’s (2014) uptake of Serres’s work, the social geometries of cubes will “underline a particular version of time,” in this case a “snapshot” of Europe (p. 48). To use Serres’s well-known imagery, the cubes will “crumple” the temporalities of methods together as you would do with marked points spread on the surface of a handkerchief, enabling Europe to hang together through a single census date (Serres and Latour 1995, 60). So, it is by folding together myriad differences that the geometry of cubes will enable the enactment of a European space of labor mobility characterized by educational attainment that would otherwise not exist but which will now enable it to become a target of policy interventions.
Methodological topologies will also be performative in relation to the solution to a second data problem—the inclusion of the category of same-sex unions as part of the topic of marital status—one of many supposedly “small” and “difficult to measure” population categories (Field notes, ESS Meeting, June 30, 2015). Notwithstanding difficulties NSI statisticians reported for generating data on same-sex unions, the ESS negotiations resulted in the inclusion of the category so that it can be combined with other topics. In doing so, the ESS followed international recommendations calling for data to meet the increasing legal recognition and importance of same-sex partners in a society about which little demographic information is available (UNECE 2006, 111; cf. Steenhof and Harmsen 2003; Statistics Canada 2004).
The solution that was eventually agreed upon was different to that for the topic of educational attainment because the category of same-sex unions introduced three particular data problems. First, some member states do not legally recognize same-sex unions and therefore do not collect data about them. Second, NSIs with register-based censuses do not collect the data because it is not “asked explicitly and cannot be derived” from the registers (Field notes, ESS Meeting, March 23, 2015). Third, even for NSIs that do collect the data, reported numbers are relatively low, so for many cells of a hypercube, data would need to be suppressed when marital status is cross-tabulated with other topics or at low levels of geography due to confidentiality requirements. These cases would thus produce numerous cells with “zeros.” To avoid investing time and effort in generating “zero-value” cells, the solution was to only distinguish the categories of opposite-sex and same-sex unions in hypercubes with few combinations and to collapse them into the general category of “married or registered partnership” in hypercubes involving multiple combinations of topics (European Parliament and Council 2016). As such, depending on the hypercube, same-sex unions will be visible or invisible.
This solution is related to a third and final example, that of data problems concerning the topic of family status and the category of same-sex consensual unions and “marriage-like” relationships that do not have a legal status. As in the case of marital status, the ESS agreed early on that opposite-sex and same-sex consensual unions would not be distinguished because they are not included in registers and including them in questionnaires was undesirable because of religious objections and a risk of unreliable answers (European Parliament and Council 2016). However, as one NSI statistician pointed out, for those countries that do not or are not able to identify such unions in a separate category, they will still be counted in the category of “married or registered partnerships” (Field notes, ESS Meeting, June 30, 2015). That is, same-sex consensual unions will be implied because the absence of legal recognition does not make their existence as a “union” disappear but only their recognition in a separate census category (Field notes, ESS Meeting, June 30, 2015). Same-sex consensual unions will therefore become an absent presence, only visible for some countries but not others because of their methodological and legal regimes, which will make them an implied presence. Consequently, family status will become “not a singular object but rather a pattern of various elements, some of which are made present and others absent” (M’charek, Schramm, and Skinner 2014, 264).
Yet, as in the case of educational attainment, if a user queries the Census Hub for data on the EU, then a social space of same sex-unions will appear and those differences will disappear. In this regard, methodological topologies will be performative of a social space that would otherwise not exist and render it a potential EU social policy target. In a geometry of cubes, then, methodological topologies will do away with such differences and thereby enable the enactment of multiple European social spaces. When grids are made the spatial referent of hypercubes, such multiplicity will be further extended as the “what” of census data is linked to the “where” of geospatial data (Field notes, ESS Meeting, April 27, 2016).
Grids: Flexible Europe
Conventional and New “Official” Geographies
“One reason I love the grid” is because it addresses the standardization issue; even comparisons between cities in a country is a problem; being identical across space is what makes it powerful. (Field notes, ESS Meeting, June 18, 2015)
These values and concerns expressed by statisticians echo rationalities of government initiatives such as the United Nation’s Global Geospatial Information Management initiative and 2030 Agenda of Sustainable Development Goals (adopted in 2015). In general, statistics at detailed geographies are asserted as key to meaningful measurement, monitoring, and policy-making of many transnational phenomena (Field notes, CES Meeting, April 27, 2016). These aspirations are expressed in EU initiatives such as the ESS’s Vision 2020, which calls for the integration of geospatial information with statistical data. The EC’s INSPIRE Directive also aims to create a spatial data infrastructure for the purposes of environmental policies to assist policy making “across boundaries” (European Commission 2017). 12 A key principle is that most phenomena (e.g., pollution, epidemiology) are of a “spatial nature,” that is, linked to a location, and as such standardized geographical units can best serve as the basis for linking data. Additionally, since the boundaries and reach of environmental phenomena are transversal and variable (e.g., agricultural vs. coastal geographies), geocoding enables analyses and policies at flexible scales. In total, INSPIRE establishes geographic standards for thirty-four themes including several related to populations such as administrative units and demography.
Grids are thus part of broader transnational initiatives to establish spatial standards. However, they are unique as they serve as a common referencing scheme for the standardization of all spatial objects (rivers, demography) across themes. That is, they are not configured by the requirements of a specific phenomenon such as hydrology but can be used for all phenomena such as cross-border human migration or river basins. 13 In relation to the convention adopted by the ESS, member states will create grids in relation to a common international geographic point of origin and standardized location and size of grid cells of 1 km2. They will then create a unique identifier for each grid, and all geocoordinates contained within a grid will be categorized according to their applicable identifier (Figure 3). 14 Grids will then become additional spatial referents (along with local administrative and regional ones) within the infrastructure of the hypercubes. Rather than directly referencing each geocoordinate, data on combinations of population topics (e.g., age, sex, and nationality) will be averaged within grids to reduce the complexity of spatial data sets and enable the reporting of spatial variability while retaining confidentiality. 15
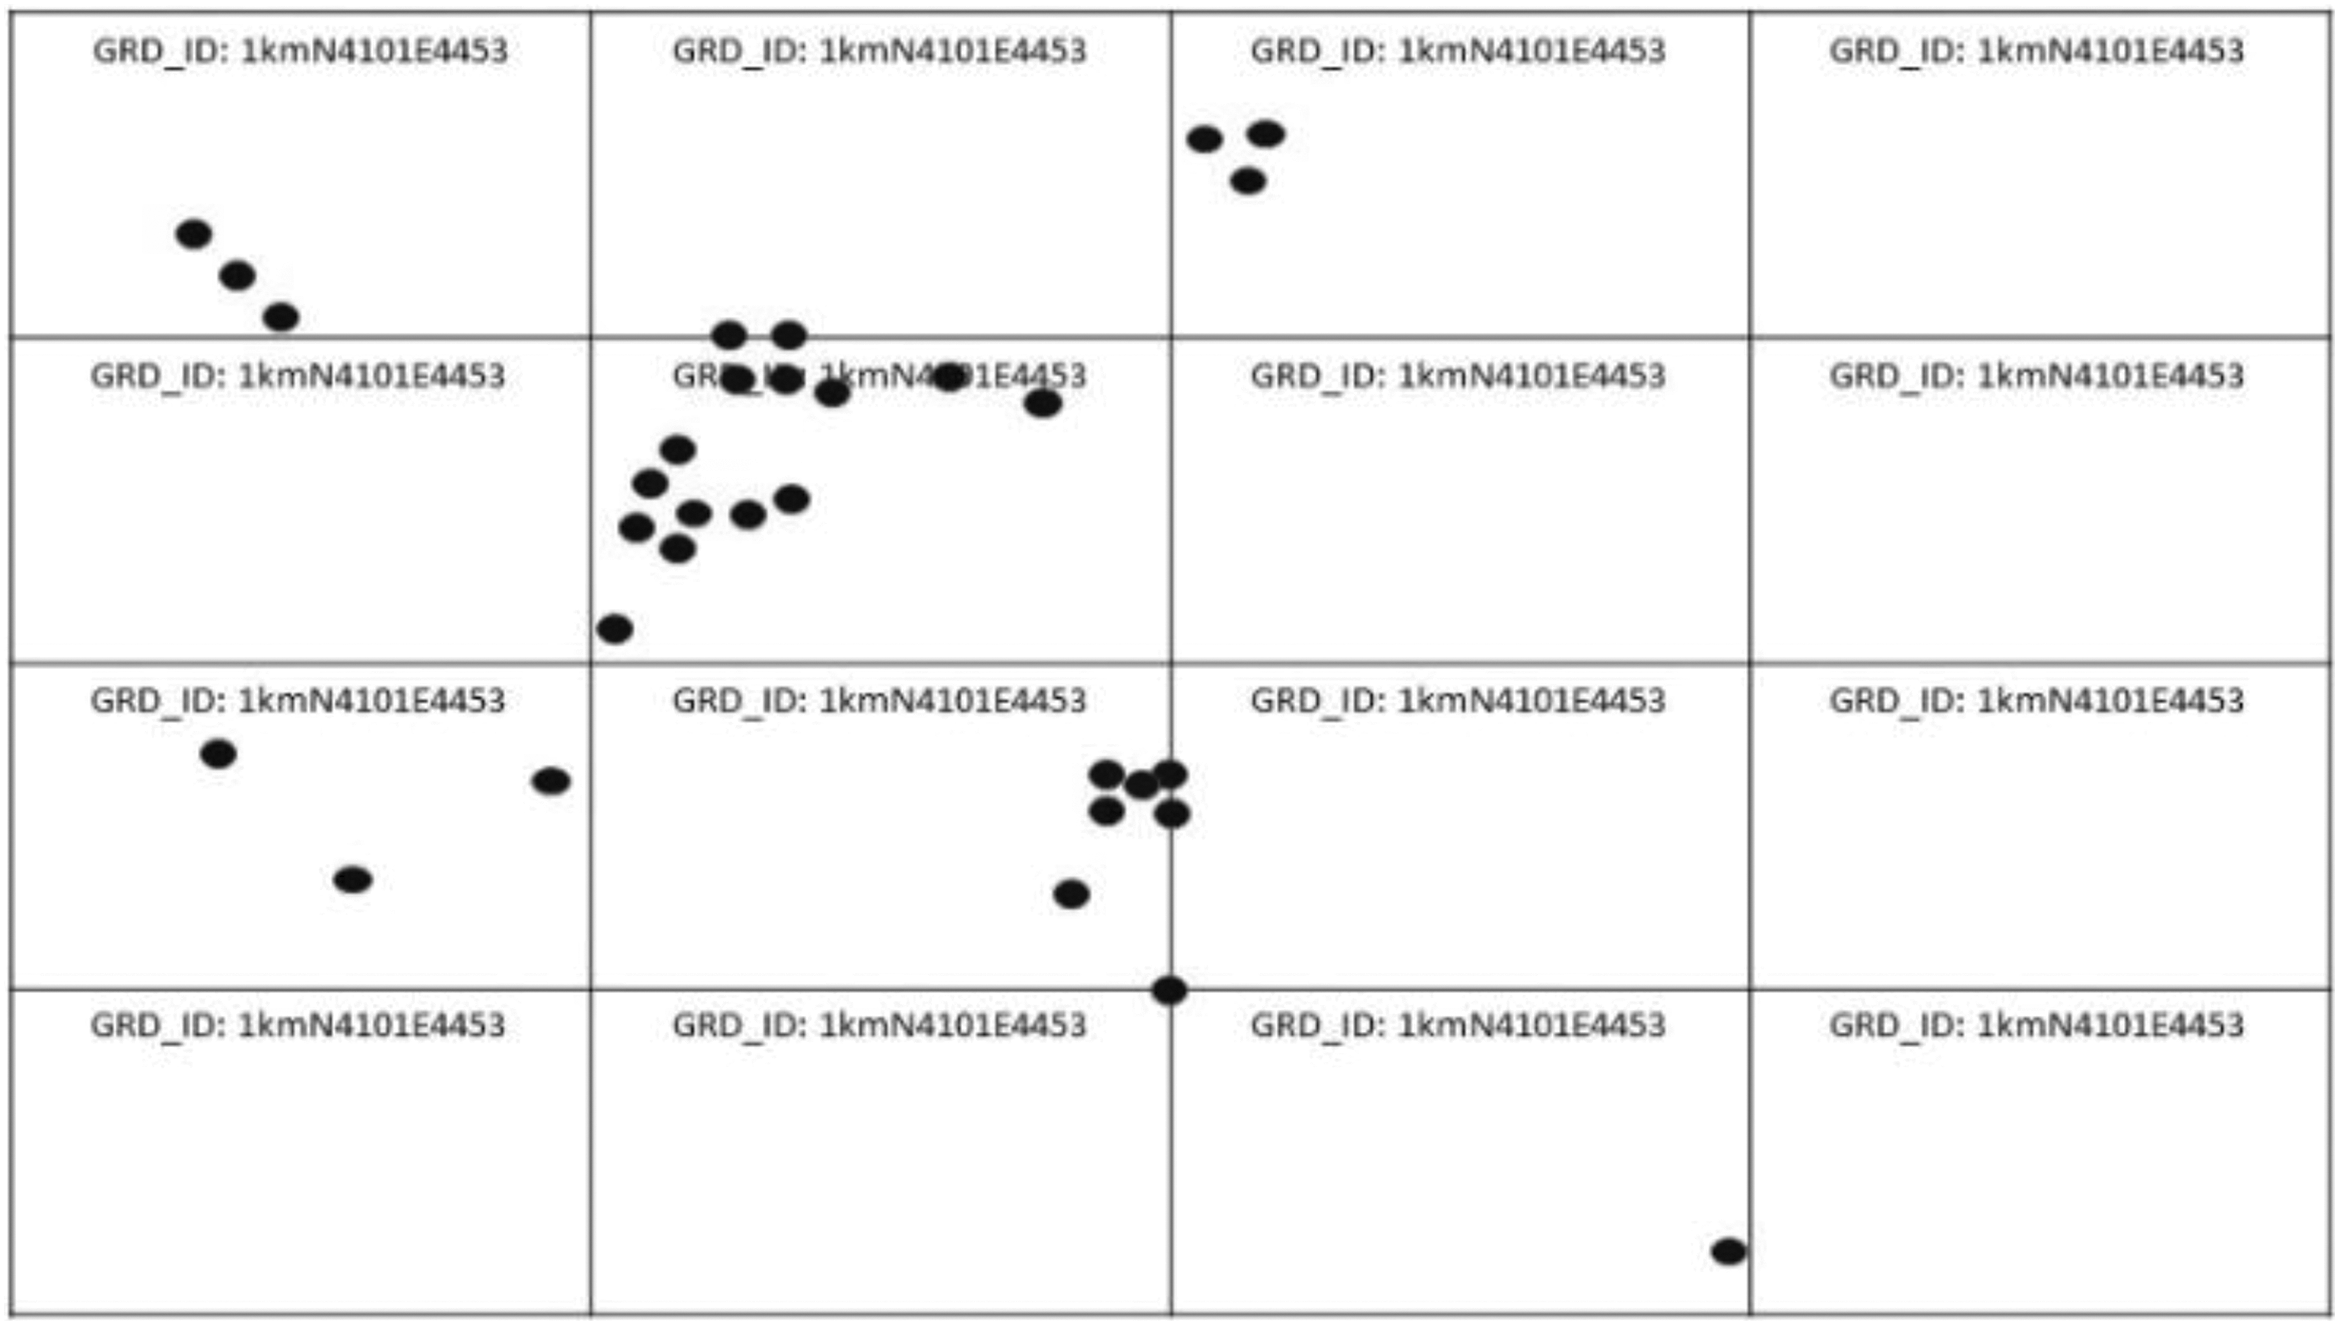
Graphic illustration of grid identifiers and geocoordinates.
In these ways, grids not only map locations but also provide standard and stable identifiers for linking and mapping population data that make up hypercubes. It is for this reason grids are talked about as core to the “modernization” and legitimacy of official statistics. Beyond technical arguments, they hold the promise of transcending historical and national spatial boundaries that make up conventional mappings of Europe by enabling a standardized “bottom up geography rather than top down definitional approach” (Field notes, ESS Meeting, June 16, 2015). As one speaker at an international conference expressed, in the last century there was no geographical equivalent to the hour, minute, or second and he lamented the diverse landscape of administrative regional units. He noted that not only do such units differ in size and shape, they are mostly the outcome of historical processes. But, he said, history also does not stop and that means administrative units will never be stable. As a result, official statistics are left with broken time series and incomparable data (Field notes, CES Meeting, April 27, 2016). For him, the move to a “bottom-up” geography is a way to secure comparable data across space and time.
Statisticians also identify 1 km2 grids as a quality that can differentiate the census from other sources of social statistics such as surveys, which cannot provide comparable geographic detail over time (Field notes, ESS Meeting, September 23, 2015). Grids are thus advanced to secure the future value of official statistics by meeting user or “customer demands,” but also to compete with new sources of geo-located and granular data generated by the private sector, especially mobile phone operators. Statisticians perceive these new sources as challenging one of the historic foundations of statecraft: authority over the production of official statistics and knowledge of whole populations.
However, grids are understood not as replacements but supplements to existing spatial units. Their introduction will allow for different geographies to coexist within the Census Hub such that the spaces of Europe can be flexibly combined and generate multiple spatial logics of what is Europe. Through the standardization of social and geographical spaces, conventional geometries of organizing and mapping populations through national practices will be deployed but folded into postnational ones. That is, the technical force of grids will be the capacity to assemble data at various scales not constrained by national administrative or political boundaries. These logics concern not only how Europe can be known as variable geometries but also how it can be governed. We attend to these generative capacities in the following section.
Spatial Topologies: Folding Space and Anticipating the Future
Consider commuter regions across national borders. Here peoples’ daily activities are spread over different administrative areas that themselves are very heterogeneous in shape and size. In other words, grid based data shines where administrative boundaries do not reflect the social land-use (any more). (Field notes, CES Meeting, April 29, 2016)
So, while grids within nationally bounded spaces are composed as contiguous, they can be extracted along with their data and reassembled with grids from other nationally bounded spaces in ways not possible with administrative or other existing spatial units. This capacity to fold together data from topographically distant locations is made possible by retaining stable properties over time, that is, standardized geocoordinates, grid boundaries, and identifiers. Through this stability, their potential combinations can be discontinuous (vary over time) and change with different phenomena (one combination for comparing educational attainment and another for population densities, for example). Grids thus have the potential to denationalize how Europe is known and governed by bringing topographically distant areas closer together based on their social similarities such that small areas of Liverpool can be brought closer to small areas of Lisbon, for example. Degrees of social cohesion are thus measured not as relations within national borders but as transversal and European ones. It is in this sense that small areas that are topographically distant and located in multiple countries can be folded together into a common social space.
Being flexible to such possibilities is also based on an anticipatory logic. As other researchers have elaborated, such anticipatory logics underpin both governing and technical practices (Harvey, Reeves, and Ruppert 2013; Mackenzie 2013). While identified as necessary to meet current policies such as social cohesion, grids will not be implemented until the 2021 round of censuses and reported in 2024. Thus, the adoption of grids involves anticipating policy needs yet unknown. One NSI statistician expressed this in relation to the “chicken-and-egg” problem: Without the availability of publicly accessible statistics on the grid level, the purpose is difficult to prove; without proving its purpose, resource-allocation for researching grid-based data analysis is difficult to acquire. Moreover, a lot of real-world use-cases develop only once appropriate data has been made available to the public. It is our customers who finally show us, where grid-based census results will be used. But it is our task to get the ball rolling. (Field notes, CES Meeting, April 22, 2016)
Conclusions
The multiple ways of enacting European populations that we have analyzed are not taken from speeches or political pamphlets. Rather, they are the consequences of geometries designed by statisticians to answer today’s and tomorrow’s policy questions that cross concerns, national and regional borders, and the boundaries between human and natural worlds. Simultaneously, their anticipatory mode also generates potentials. Even though not always clearly articulated, grids and cubes have the power, or potency, to name, frame and realise flexible and combinatorial populations across and between national boundaries (Taussig, Hoeyer, and Helmreich 2013). This was exemplified by the potential of hypercubes to create European social spaces of labor mobility characterized by educational attainment or same-sex unions despite their absence in different national social spaces. In light of discussions about methodological nationalism inherent in statistical practices (Brubaker 2009), this would perhaps be an unexpected finding for researchers but also national and EU statisticians. While an anticipatory logic underpins the rationalities for these infrastructures, our analysis highlights the generative potentials and unexpected effects such as enacting European social spaces––including those not formally acknowledged (M’charek, Schramm, and Skinner 2014)––and rendering them as objects of imagination, knowledge, and governing. Cubes and grids do this as their geometries allow for multiple and flexible combinations that enable the folding of spatial, temporal, and social relations in ways that allow national differences to coexist with postnational sameness.
Our analysis also shows that realizing the combinatorial and flexible potentials of cubes and grids requires suppressing methodological differences. In contrast to Barry’s argument on standardized technological zones, we highlighted how differences in method persist as part of statistical harmonization programs. Even though methods are made equivalent in geometries of cubes and grids, the result is not a homogenous technological zone but a topological one. While such methodological topologies can be critiqued, what we have emphasized are their performative effects. They enable potential spaces for governing through policies such as the allocation of social cohesion funding in ways that transcend national borders by relating and bringing socially closer distant parts of Europe. That is, they facilitate knowing and imagining parts of Europe in relation to degrees of social cohesiveness but also affect what is the social cohesion of Europeans. In this regard, infrastructures of cubes and grids can be understood as part of historical national practices such as standardized measurements, institutions, taxation, maps, and museums through which governments have held their populations together as a people (Anderson 1991; Best 2009). However, in distinction to these practices, what topological orderings open up is a mode of thinking in which the “whole” (Europe, nation states) is not the sum of constituent parts. Instead, Europe can be enacted as a multiplicity of variable parts, at no time constituting an intrinsically and singular bounded whole.
Footnotes
Acknowledgments
We are grateful for the criticisms and suggestions of two anonymous peer reviewers, the guest editors of this special issue on “Peopling Europe through Data Practices” and the editors of Science, Technology, & Human Values. This article has also benefited from conversations, input, and support from our ARITHMUS colleagues (see Note 7) and the time and contributions of our research subjects in European national and international statistical institutes (see Note 7).
Declaration of Conflicting Interests
The author(s) declared no potential conflicts of interest with respect to the research, authorship, and/or publication of this article.
Funding
The author(s) disclosed receipt of the following financial support for the research, authorship, and/or publication of this article: The research leading to this publication has received funding from the European Research Council under the European Union’s Seventh Framework Programme (FP/2007-2013)/ERC Grant Agreement No. 615588, Peopling Europe: How data make a people (ARITHMUS). Principal investigator, Evelyn Ruppert, Goldsmiths, University of London.