
Abstract
This study aims to establish and validate an ultrasound radiomics nomogram for preoperative prediction of central lymph node metastasis in papillary thyroid microcarcinoma (PTMC) before operation. A retrospective analysis conducted on ultrasonic images and clinical features derived from 288 PTMC patients, who were divided into training cohorts (n = 201) and validating cohorts (n = 87) in a ratio of 7:3 base on the principle of random allocation. Radiomics features were extracted from the PTMC patients after ultrasonic examination, followed by dimension reduction and characteristic selection to construct the radiomics score (Radscore) using LASSO regression analysis. Subsequently, the models, ultrasound features plus clinical features (US-Clin), radiomics score model, and combined model of clinical features plus ultrasound features and Radscore (Combined-model) were built through multi-factor logistic regression analysis. After that, the nomograms were developed for visualization and presentation of these models. The discriminative power, calibration and clinical utility of the nomogram models were evaluated in the training and validating cohorts. The Radscore model comprised 12 carefully selected features. The independent risk factors for conventional ultrasound features and clinical features of PTMC in predicting CLNM included age <45 years, tumor envelope invasion, male gender and presence of microcalcifications, while the enhanced ultrasound features risk factor was extrathyroidal expansion. The combined model showed good performance in predicting PTMC CLNM, with AUCs of 0.921 and 0.889 in the training and validating cohorts, respectively. And DCA based on the prediction model showed good clinical utility. The nomogram developed based on preoperative clinical data, ultrasound features, and Radscore of PTMC patients can more accurately predict central lymph node metastasis (CLNM) in PTMC patients. However, it needs to be validated for clinical applicability in multicenter studies with larger sample sizes and combined with genomic mutation analyses of the tumors.
Keywords
Introduction
Papillary thyroid microcarcinoma (PTMC) accounts for approximately 80% of all thyroid malignancies and represents the predominant histologic subtype of thyroid cancer. According to the World Health Organization (WHO), PTC is defined as papillary thyroid microcarcinoma (PTMC) with a maximum size not exceeding 10 mm. 1 Although PTMC typically exhibits a favorable prognosis and an indolent clinical course, the presence of cervical lymph node metastasis is observed in approximately 20% to 64% of PTMC patients in clinical practice, which is significantly associated with postoperative local tumor recurrence and disease-specific mortality. 2 Therefore, precise preoperative screening of the cervical lymph nodes is imperative for surgical decision-making. Generally, cervical lymph node metastases occur first in the central lymph node and then in the lateral lymph nodes depending on the lymphatic drainage pathway. As a result, compared with LLNM, the prevalence of CLNM in patients with PTMC is relatively high, ranging from 20% to 64%. 3 At present, high-resolution conventional ultrasound (US) is the first choice for preoperative evaluation of the cervical lymph nodes in PTMC. However, due to interference of anatomical structures such as thyroid coverage and trachea, preoperative US exhibits limited sensitivity towards CLNM in PTMC (about 33%), and even when combined with computed tomography (CT), its accuracy remains only about 70%. 4
The recent emergence of machine learning-based radiomics techniques is mining quantitative image features from medical imaging data. Generally, existing works first combine the data extracted by radiomics technology with other relevant clinicopathological features. Then, they apply it to the clinical decision support system to improve the accuracy of diagnosis and prognosis prediction. 5 Several studies have shown that contrast-enhanced ultrasound (CEUS) can visualize tumor distribution and microvasculature associated with tumor growth and can evaluate the biological behavior of thyroid nodules.6-7 Herein, we attempt to study the radiomics features of PTMC to derive a radiomics score (Radscore). Based on the radiomic score (Radscore) and clinical risk factors, a nomogram is developed and validated to predict the risk of preoperative central lymph node metastasis (CLNM) in PTMC to assist in clinical treatment decision-making.
Materials and Methods
Materials
A total of 288 patients diagnosed with PTMC in South China Hospital of Shenzhen University and Shenzhen Hospital of Southern Medical University from October 2020 to December 2022 were selected. The inclusion criteria were as follows: (1) patients who underwent thyroidectomy and prophylactic central lymph node dissection (pCLND) within two weeks of undergoing neck ultrasound; (2) patients with pathologically confirmed PTMC; and (3) complete clinical data, including thyroid hormones. Patients who had received preoperative radiotherapy or radiation therapy and patients with unclear ultrasound images and incomplete clinical data were excluded.
Routine Ultrasound Examination and Feature Evaluation
PTMC patients were examined by experienced sonographers using a Mindray RESONA 7(Mindray, Shenzhen, China ) and GE Logiq E9 (GE Healthcare, Wauwatosa, USA) scanner and linear transducer with a frequency of 3 to 9 MHz or 4 to 10 MHz for each equipment, respectively. All selected thyroid nodules were evaluated with ultrasound features, including nodule size, echogenicity (significant hypoechogenicity, hypoechogenicity, and iso/hyperechogenicity), invasion situation of the envelope, calcification (microcalcification was defined as the diameter ≤1 mm and coarse calcification was defined as the diameter >1 mm.), whether the nodule was multifocal, and whether the margins were regular.
Contrast-Enhanced Ultrasonography and Feature Evaluation
Contrast-enhanced ultrasound (CEUS) was performed at the end of the conventional ultrasound examination, using the same instrument and transducer as the traditional ultrasound examination. The patients were instructed to stop swallowing and breathe calmly during the examination. The contrast agent (SonoVue) was mixed with 5 mL of saline until a homogenous mixed suspension was obtained. Then, 1.8 to 2.0 mL of the suspension was rapidly pushed into the patient’s peripheral vein through a probe. The ultrasound machine timer was activated when the contrast agent was injected, and the entire imaging procedure was recorded. Thyroid nodules were evaluated with CEUS features, including enhancement uniformity (homogeneous or heterogeneous), enhancement intensity (hyperenhanced, isoenhanced, or hypoenhanced), enhancement border (well-defined or ill-defined), extrathyroidal expansion (nodule enhancement confined to thyroid envelope or extending beyond the thyroid envelope) (Figure 1(C)), enhancement direction (centripetal or centrifugal enhancement), enhancement time (earlier, simultaneous or later) which was divided into the relative time of contrast wash-in and wash-out of the nodule concerning surrounding normal thyroid parenchyma.
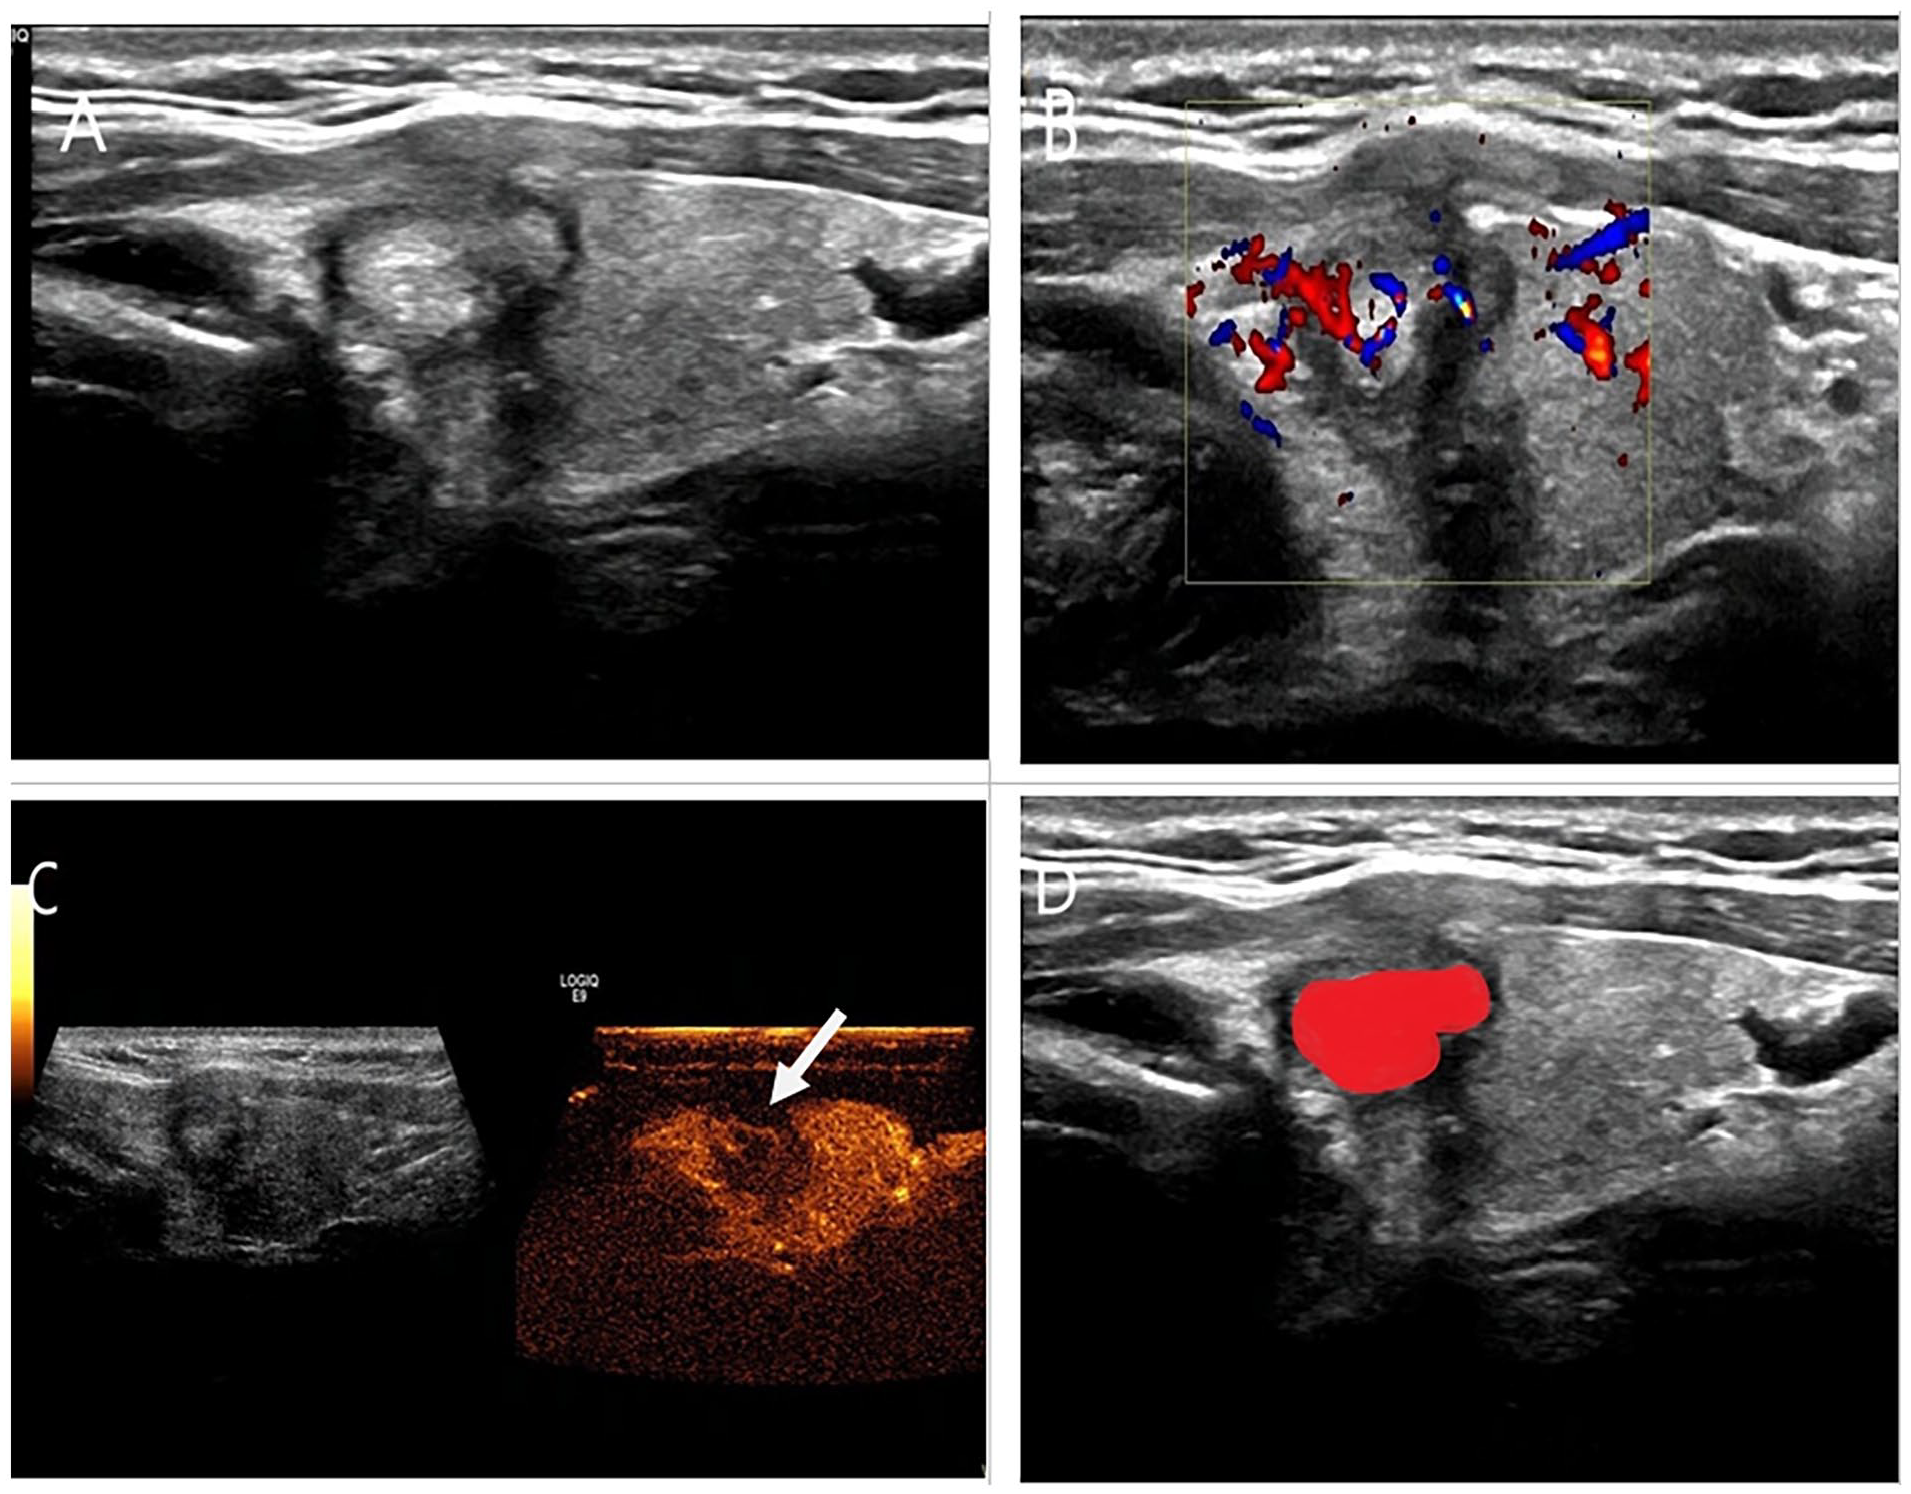
Schematic illustration of a 42-year-old female with 9.5 mm papillary thyroid carcinoma and central cervical lymph node metastasis. (A) Gray-scale ultrasonography shows a solid nodule with regular margins in the left lobe of the thyroid gland and an intact envelope in the adjacent thyroid; (B) Color doppler imaging shown intra-nodal and peripheral blood flow signals; (C) Contrast-enhanced ultrasound shown that the tumor appeared inhomogeneous hypoenhancement with partially defined enhancing borders compared with normal thyroid parenchyma, that the ring enhancement was incomplete and that the adjacent thyroid envelope was discontinuous, which suggested an extrathyroidal expansion, as shown by the white arrow; (D) Schematic illustration of the outline of nodule ROI.
Image Segmentation and Feature Extraction
Two senior attending ultrasonographers used 3D-slicer software to independently outline the region of interest (ROI) of the selected tumors on conventional ultrasound images. When outlining the ROI, they aimed to cover the lesions as much as possible, maintaining a distance of approximately 2 mm from the tumor edges to avoid adjacent normal tissues. A segmentation diagram is shown in Figure 1. The segmentation results were reviewed by a deputy sonographer to ensure accuracy and consistency in lesion locations. The radiomics features were extracted from the ROI using the FAE (DOI=10.1371/journal.pone.0237587) software. To avoid data heterogeneity bias caused by the acquisition of images from different ultrasound machines, all cases were performed by ultrasound physicians with over 5 years of experience in thyroid ultrasound examinations. During the acquisition process, care was taken to minimize pressure on the tumors. The maximum transverse and longitudinal diameters of the tumors were recorded, and at least two clear images were saved. Before feature extraction, all segmented images were resampled to the same resolution(1 mm × 1 mm), and all image data underwent imaging normalization(the gray intensity of the images was scaled to 0–1001), Before dividing the dataset, the R package(DMwR) was used to implement the Synthetic Minority Oversampling Technique(SMOTE) to address the imbalanced dataset and improve model performance. All image feature datasets were divided into training and validation sets at a ratio of 7:3, and data normalization (−1 to 1) was applied to all datasets.
The extracted features included first-order features, shape features, gray-level run length matrix (GLRLM) features, gray-level size zone matrix (GLSZM) features, gray-level dependence matrix (GLDM) features, neighborhood gray-level-tone dependence matrix (NGTDM) features, gray-level co-occurrence matrix (GLCM) features, Laplacian of Gaussian (LOG) and wavelet features, totaling 1781 image features. To evaluate the reproducibility of the study, 30 patients were randomly selected, then a sonographer used the same overview method and procedure to outline and extract the radiomics features again 2 weeks later. Features with ICC > 0.75 were extracted for subsequent analysis using intergroup correlation coefficient (ICC) consistency analysis. The standards for the ICC are as follows: an ICC value of 0.81 to 1.00 indicates almost perfect agreement, 0.61 to 0.80 indicates substantial agreement, 0.41 to 0.60 indicates moderate agreement, 0.21 to 0.40 indicates fair agreement, and 0 to 0.20 indicates poor or no agreement, This study selects an ICC of ≥0.75 to determine that the reproducibility of the diagnostic test is good.
Radscore Construction and Nomogram Building
Firstly, ICC <0.75 were excluded using intergroup correlation coefficient consistency analysis, followed by Spearman correlation analysis in the training cohorts to eliminate features with a threshold ≥0.90. Next, the remaining features in the training cohorts were screened by LASSO regression analysis, and Radscore were created. Ultrasonic radiomics nomogram was developed based on univariate and multivariate logistic regression analysis, and the US-Clin models were generated using clinical factors and ultrasound features with p < .05. Radiomics nomograms were developed by combining Radscore with clinical and ultrasound characteristic risk factors.
Statistical Analysis
Statistical analyses were performed using R software (version 4.1.2). Categorical data are presented in terms of frequency and percentage (N and % respectively). The Pearson chi-square test was used for categorical factors between the CLNM positive and negative groups. The independent samples t-test or Mann–Whitney U test was used for continuous variables. A calibration curve was generated using the Hosmer–Lemeshow test. Then, the fit of the nomograph was verified by the calibration curve. The nomogram was drawn to visualize the predicted probability of CLNM occurring in each patient. Based on the receiver operating characteristic curve (ROC), the discriminatory performance of the models was assessed. A decision curve analysis (DCA) was generated to calculate the net benefit of different thresholds to evaluate the clinical utility of radiomic noctographs.
Results
Clinical and Ultrasonic Characteristics
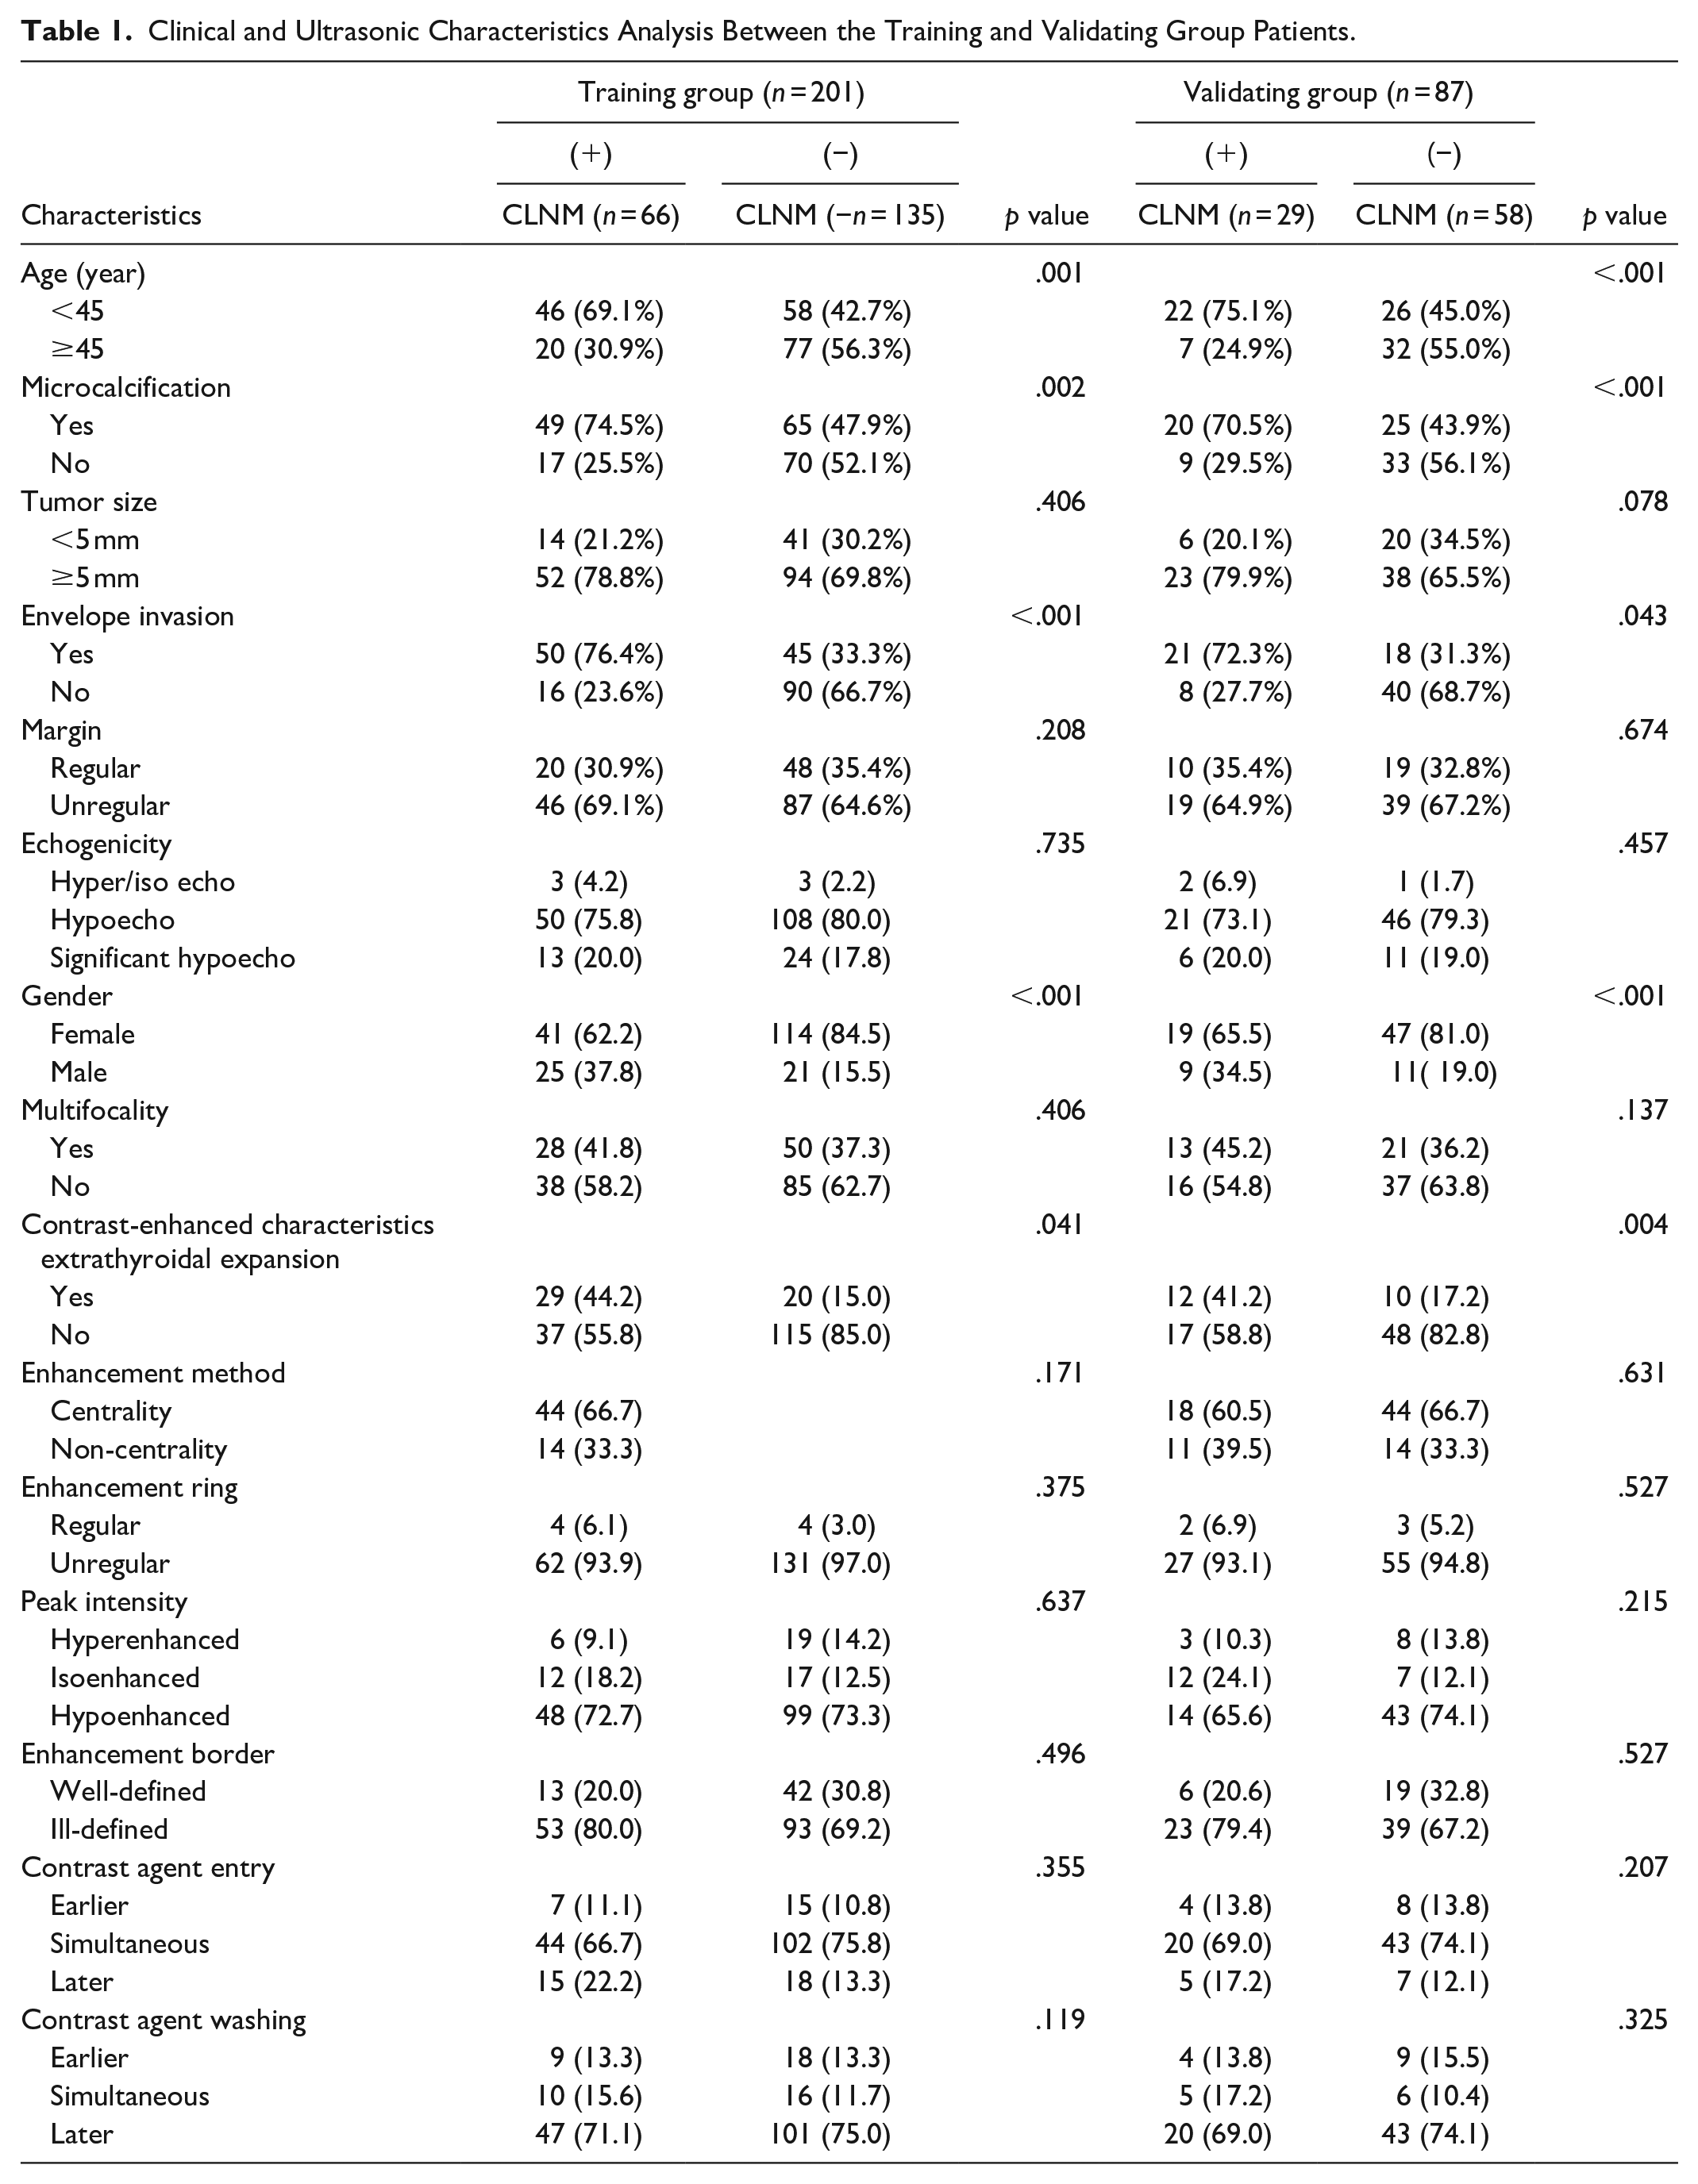
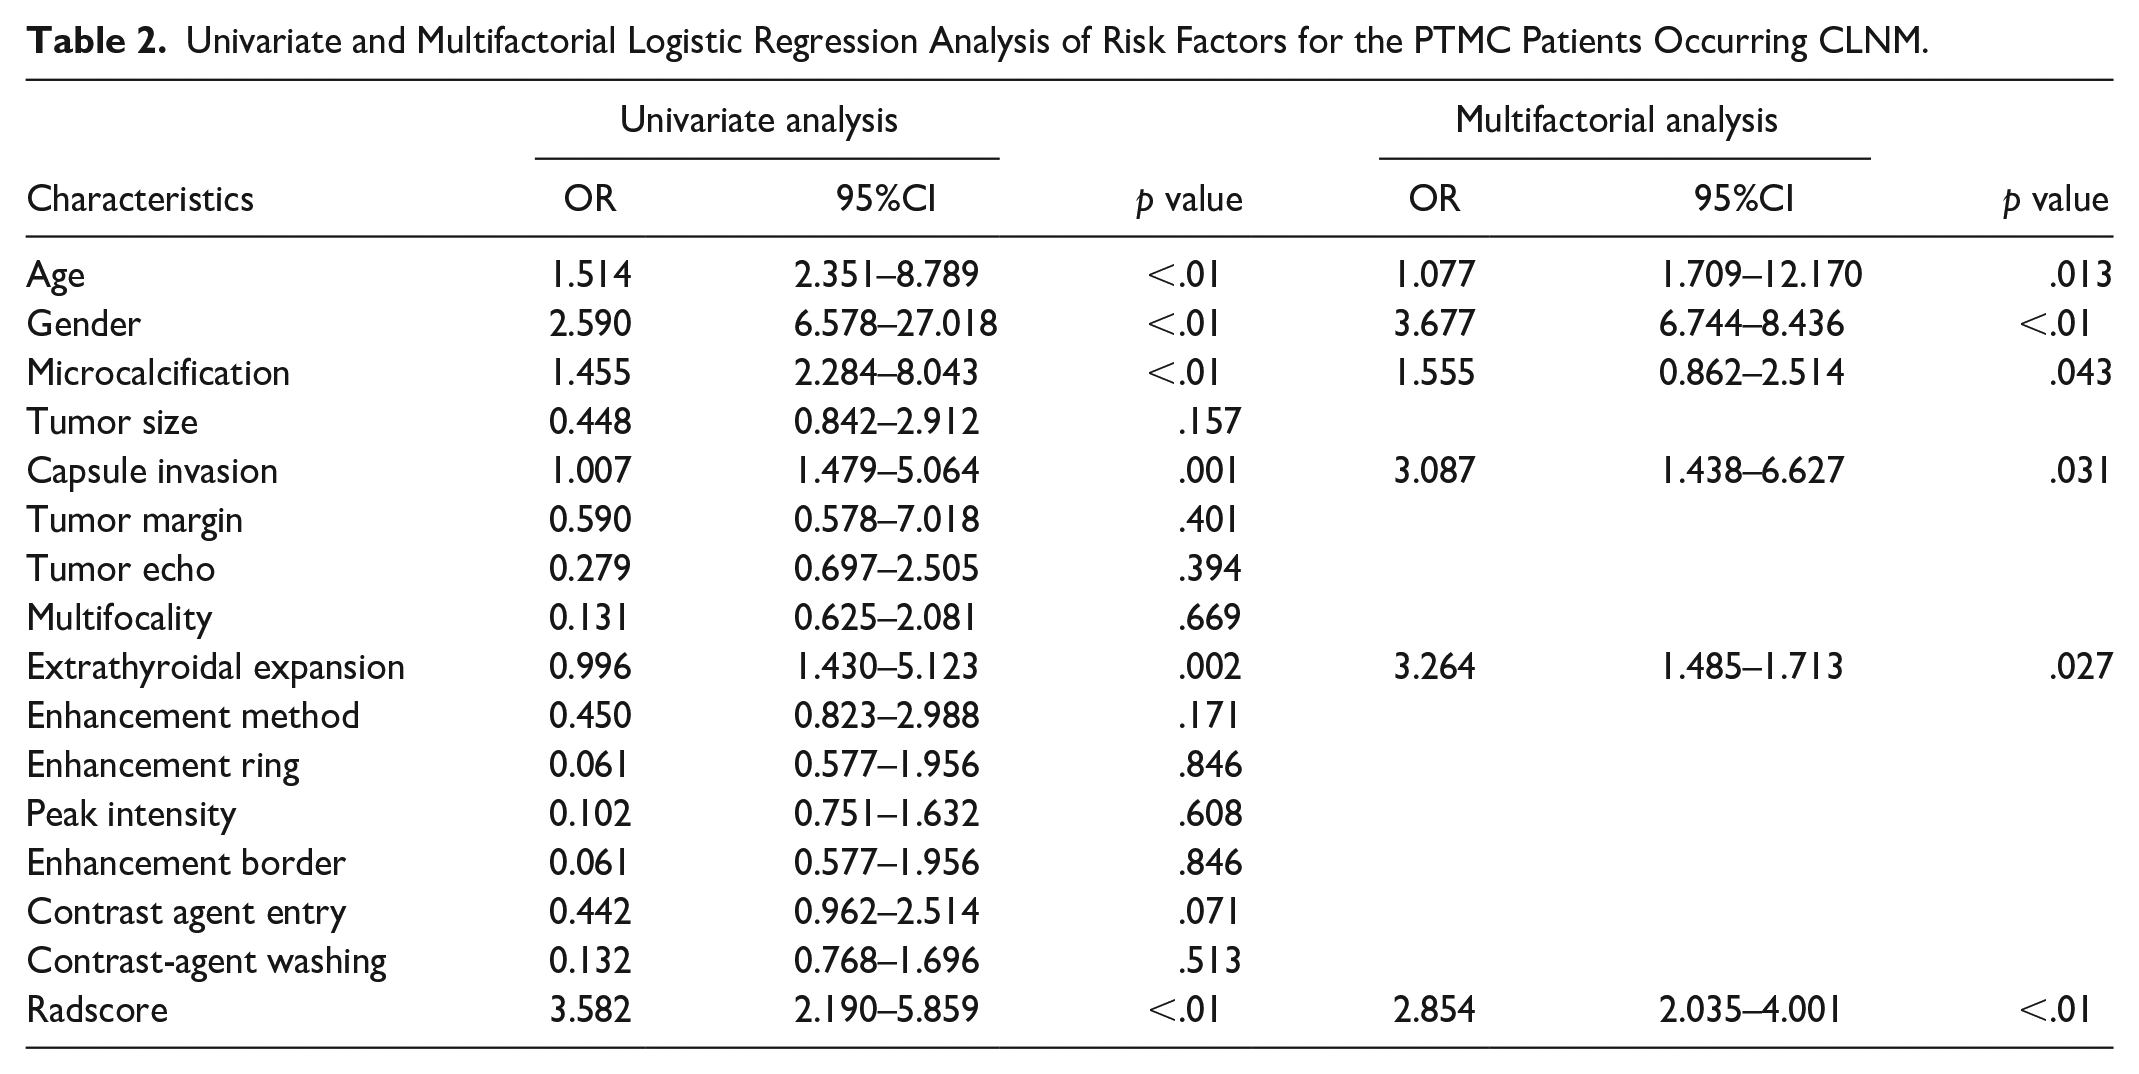
The clinical characteristics of the patients in the training and validating groups are shown in Table 1. Univariate analysis showed that the meaningful features between the CLNM positive and negative groups were age < 45 years, tumor envelope invasion, male gender, microcalcifications, and extrathyroidal expansion (p < .05) (Table 2).
Clinical and Ultrasonic Characteristics Analysis Between the Training and Validating Group Patients.
Univariate and Multifactorial Logistic Regression Analysis of Risk Factors for the PTMC Patients Occurring CLNM.
RadScore Construction and Nomogram Creation and Validation
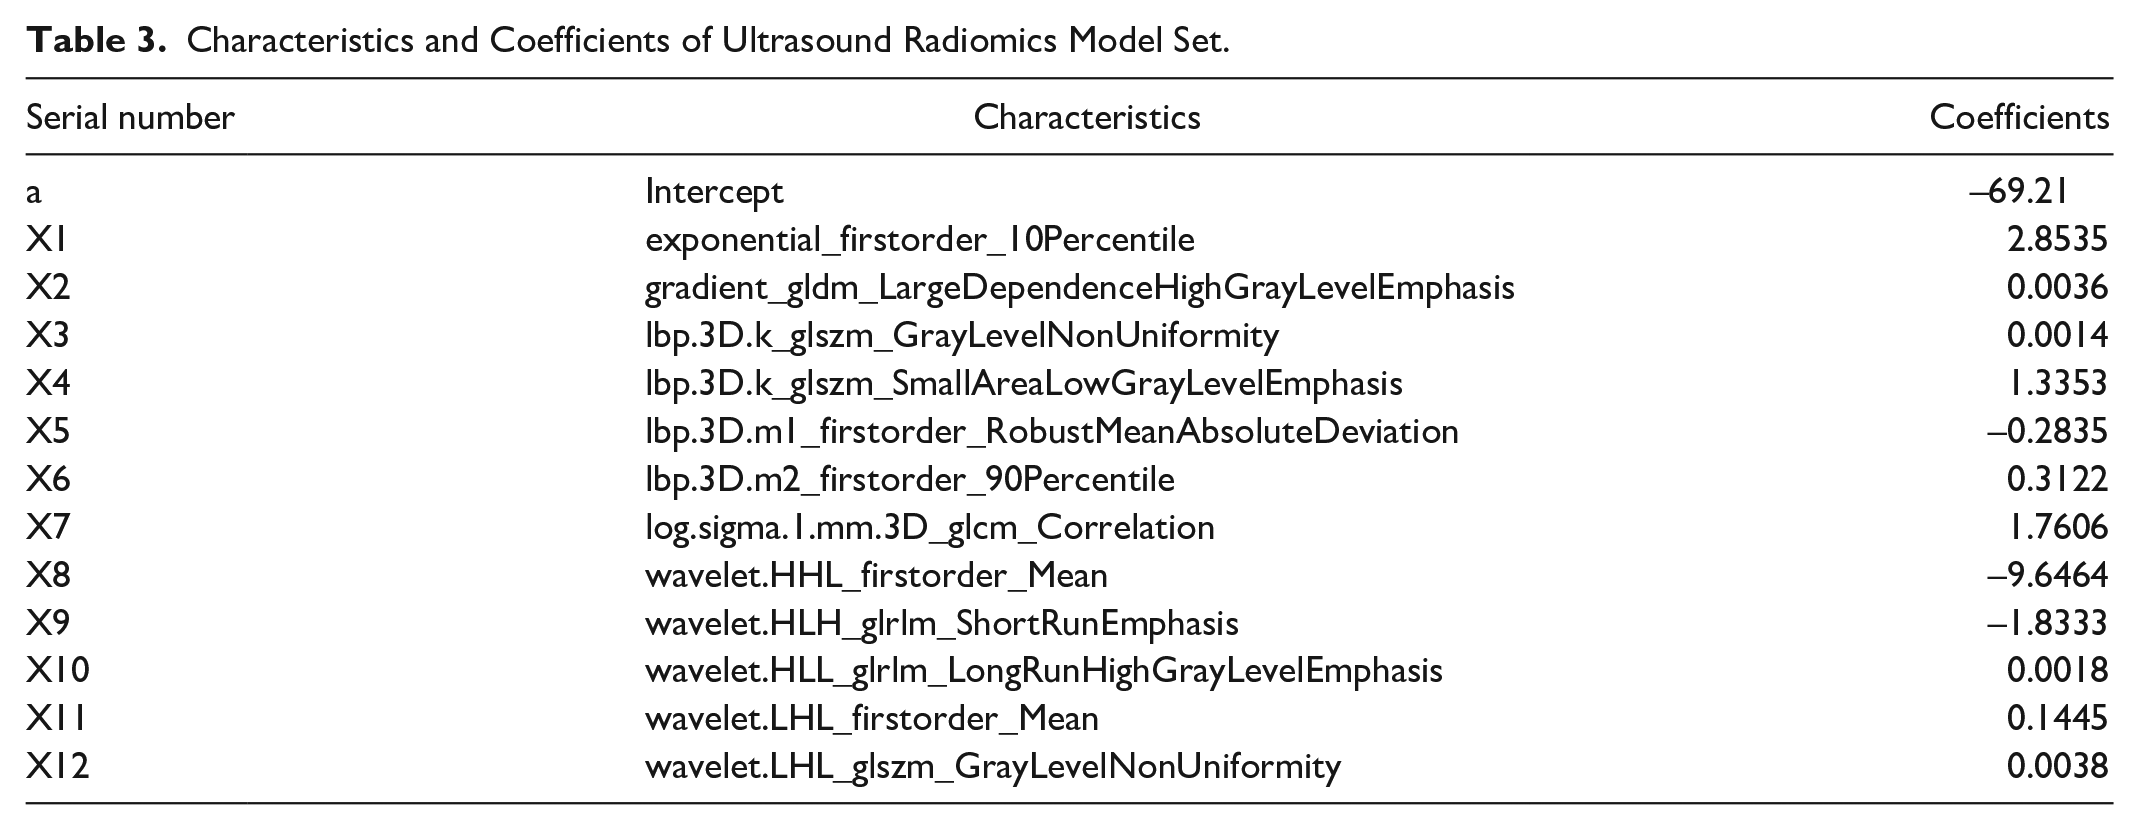
Out of the 1781 extracted image features, 471 features were removed due to an ICC <0.75, followed by the removal of 1035 features based on a Spearman correlation analysis threshold of ≥ 0.90, leaving a final total of 257 features. Then, 12 feature parameters were filtered out from the remaining features in the training cohorts by using LASSO regression analysis (Figure 2). The remaining feature parameters after selection were used to calculate the Radscore by the following formula: Radscore = a + bx1 + cx2 + dx3 +. . .. . .nxn, where a was a constant, b, c, d. . .. . .n were the corresponding coefficients. The details of the features and the corresponding weighting coefficients are shown in Table 3.
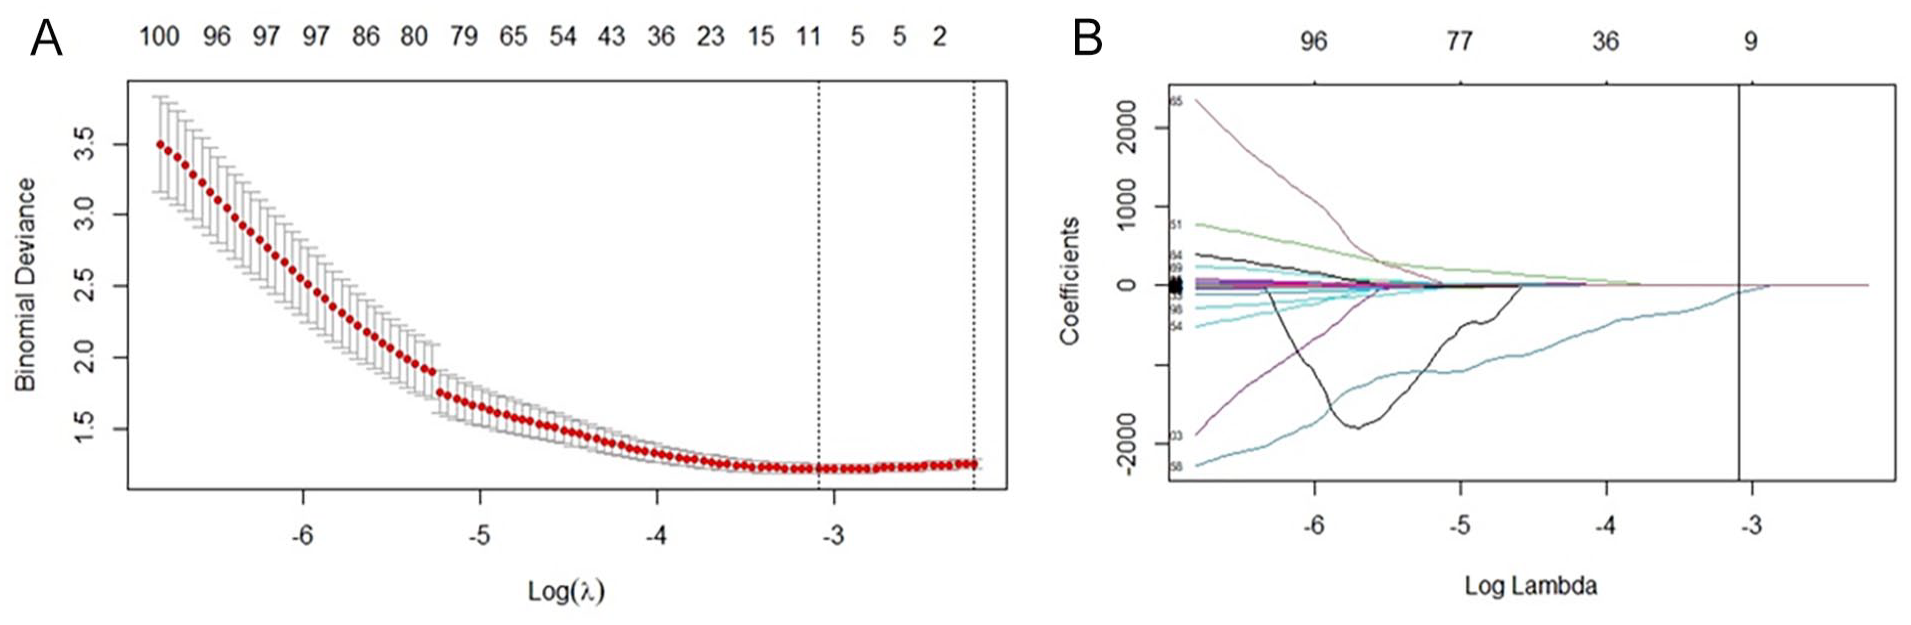
LASSO analysis filtered by ultrasound radiomics features.
Characteristics and Coefficients of Ultrasound Radiomics Model Set.
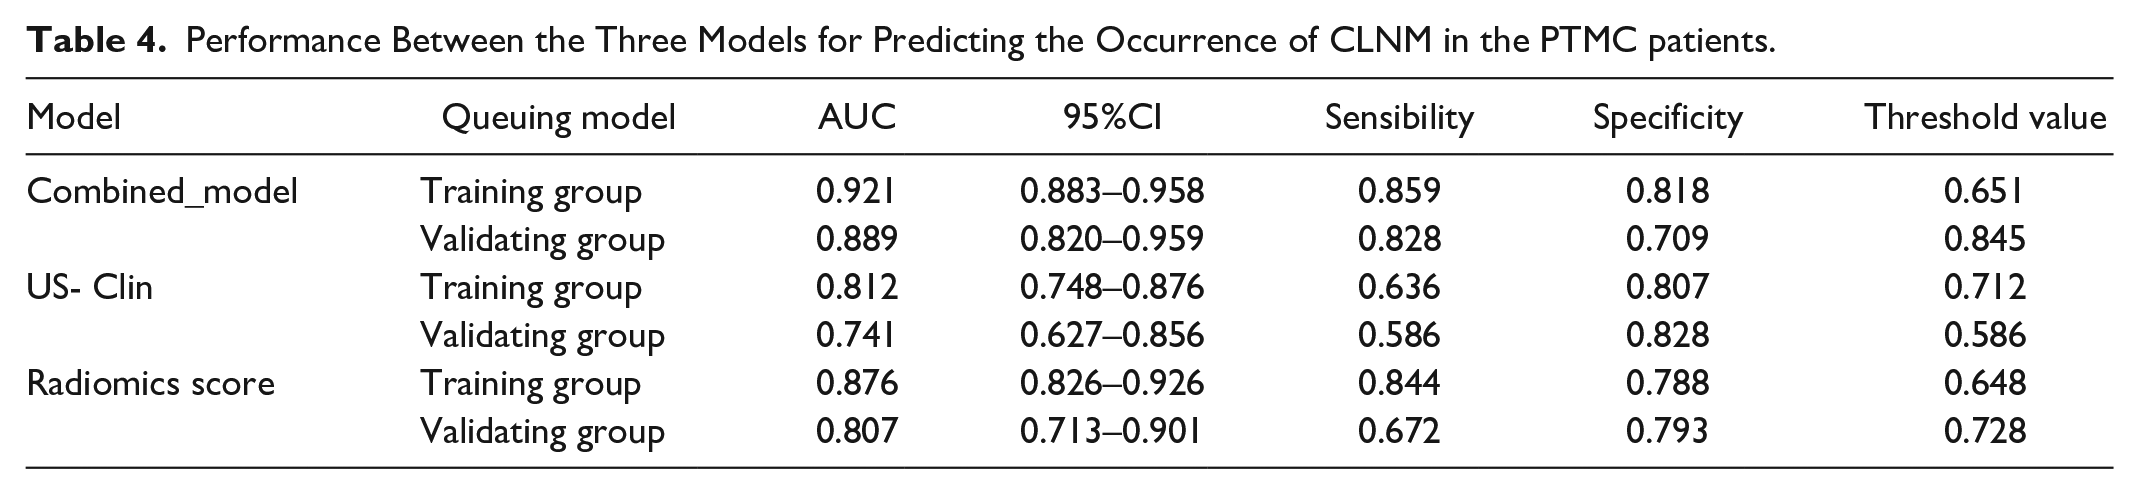
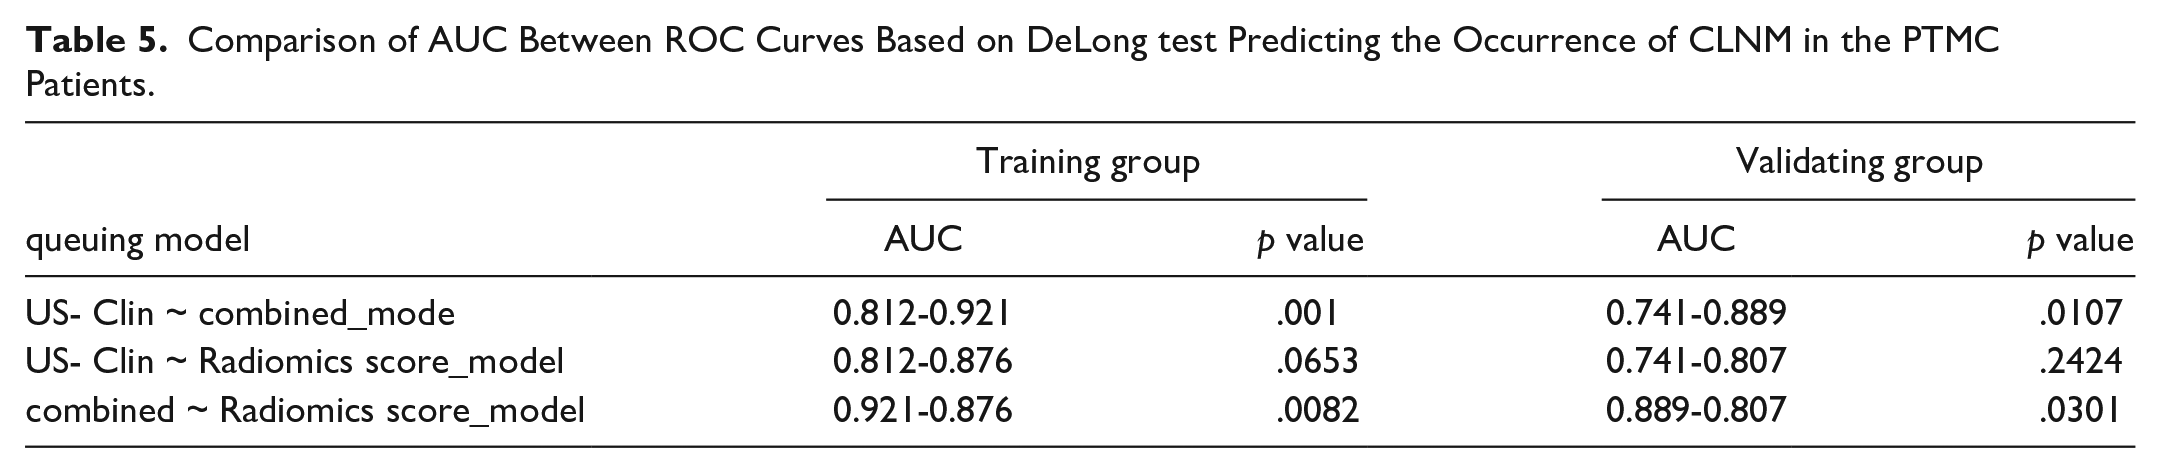
The univariate and multifactorial Logistic analyses showed statistically significant results for microcalcifications, age, tumor capsule invasion, extrathyroidal expansion (ETE), gender and Radscore (Table 3) in the training cohorts. Table 4 shows the results of the US-Clin nomogram established by clinical factors, conventional ultrasound features and enhanced ultrasound features, and the Combined-model nomogram established by Radiomics score, Clin-CUS and CEUS in differentiating CLNM of PTMC patients. The combined model showed the best discrimination in both the training and validating cohorts by ROC curves, and the area under the curve (AUC) was 0.921 and 0.889 (AUC = 0.921, 95%CI, 0.874–0.954; AUC = 0.889, 95%CI, 0.804–0.947), respectively (Figure 3). The US-Clin model and the combined model predicted the risk of CLNM in patients with PTMC, as shown by the nomogram (Figure 4). Delon test shown higher AUC values for Combined-model than for Clin-CUS model and Radiomics score model alone (p < .05), and there was no difference in performance between Clin-CUS model and Radiomics score model (Table 5; p > .05). In the calibration curve of the nomogram, there is no significant difference between the results of the training and validating cohorts. Still, it shows the consistency shown by good calibration and the Hosmer-Lemeshow test (Figure 5: the P value in the two cohorts was 0.311 and 0.763, respectively). Decision curve analysis (DCA) showed that ultrasound radiomics nomogram provided a high overall net benefit (Figure 6).
Performance Between the Three Models for Predicting the Occurrence of CLNM in the PTMC patients.
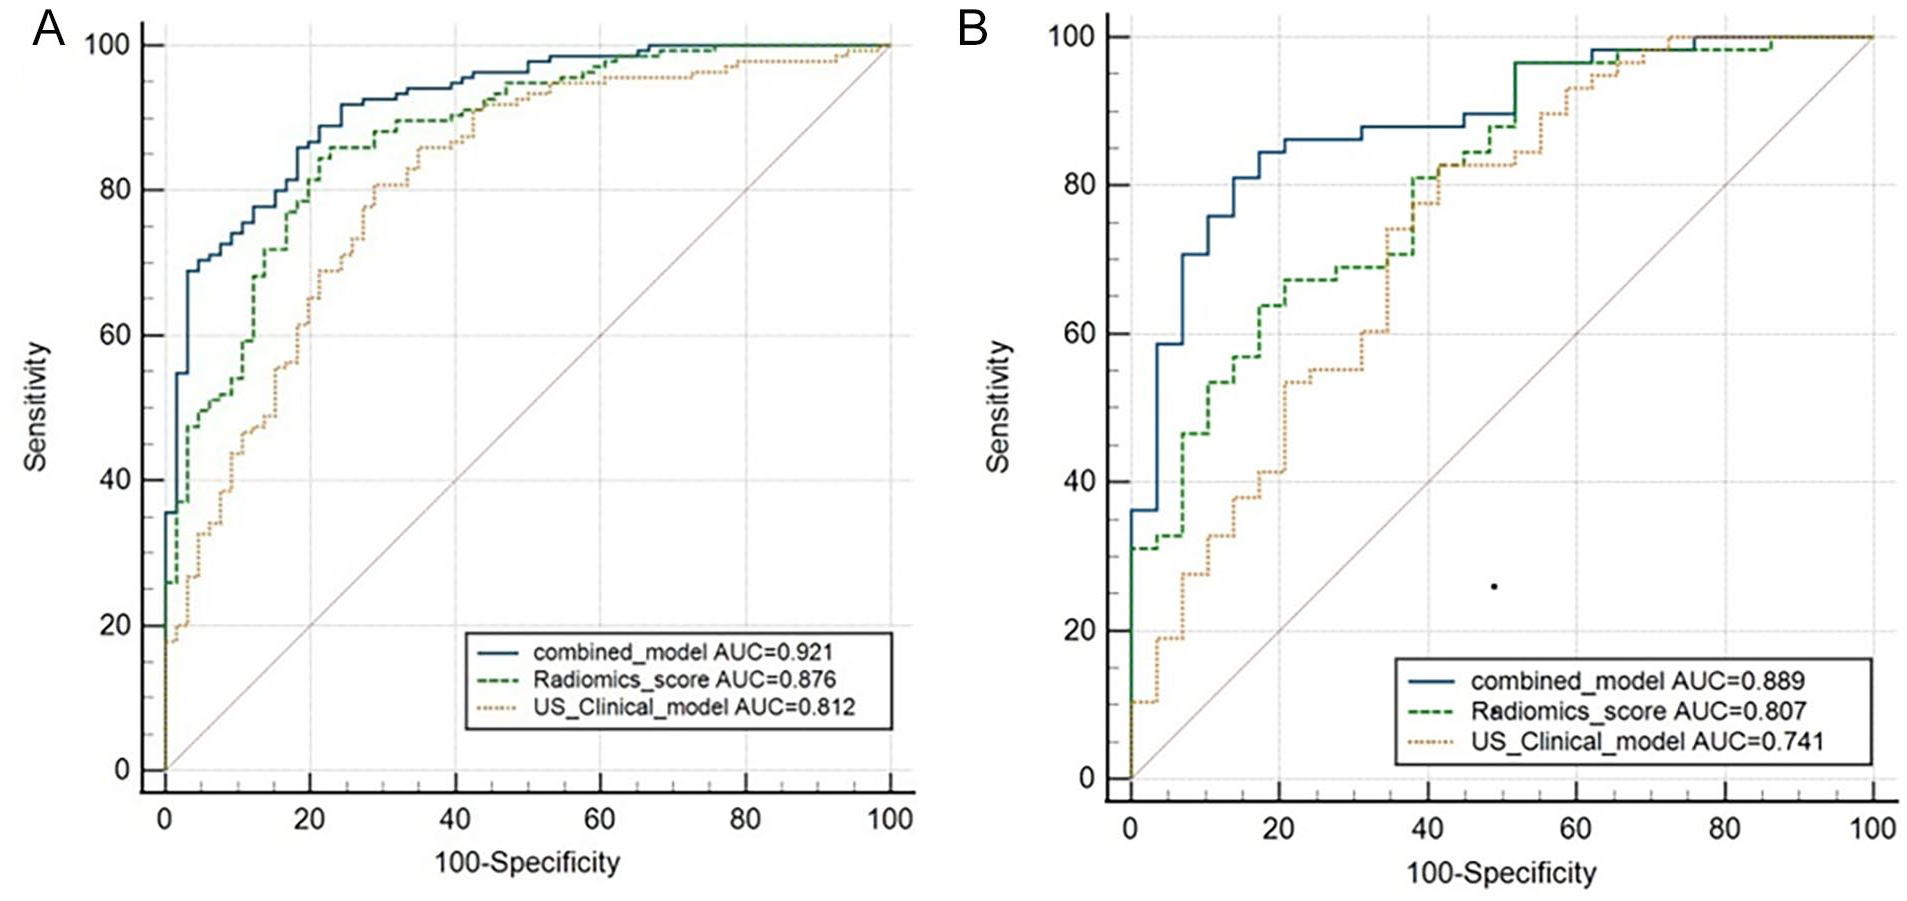
ROC curves of three models predicting the occurrence of CLNM in PTMC patients. (A) Training group and (B) Validating group.
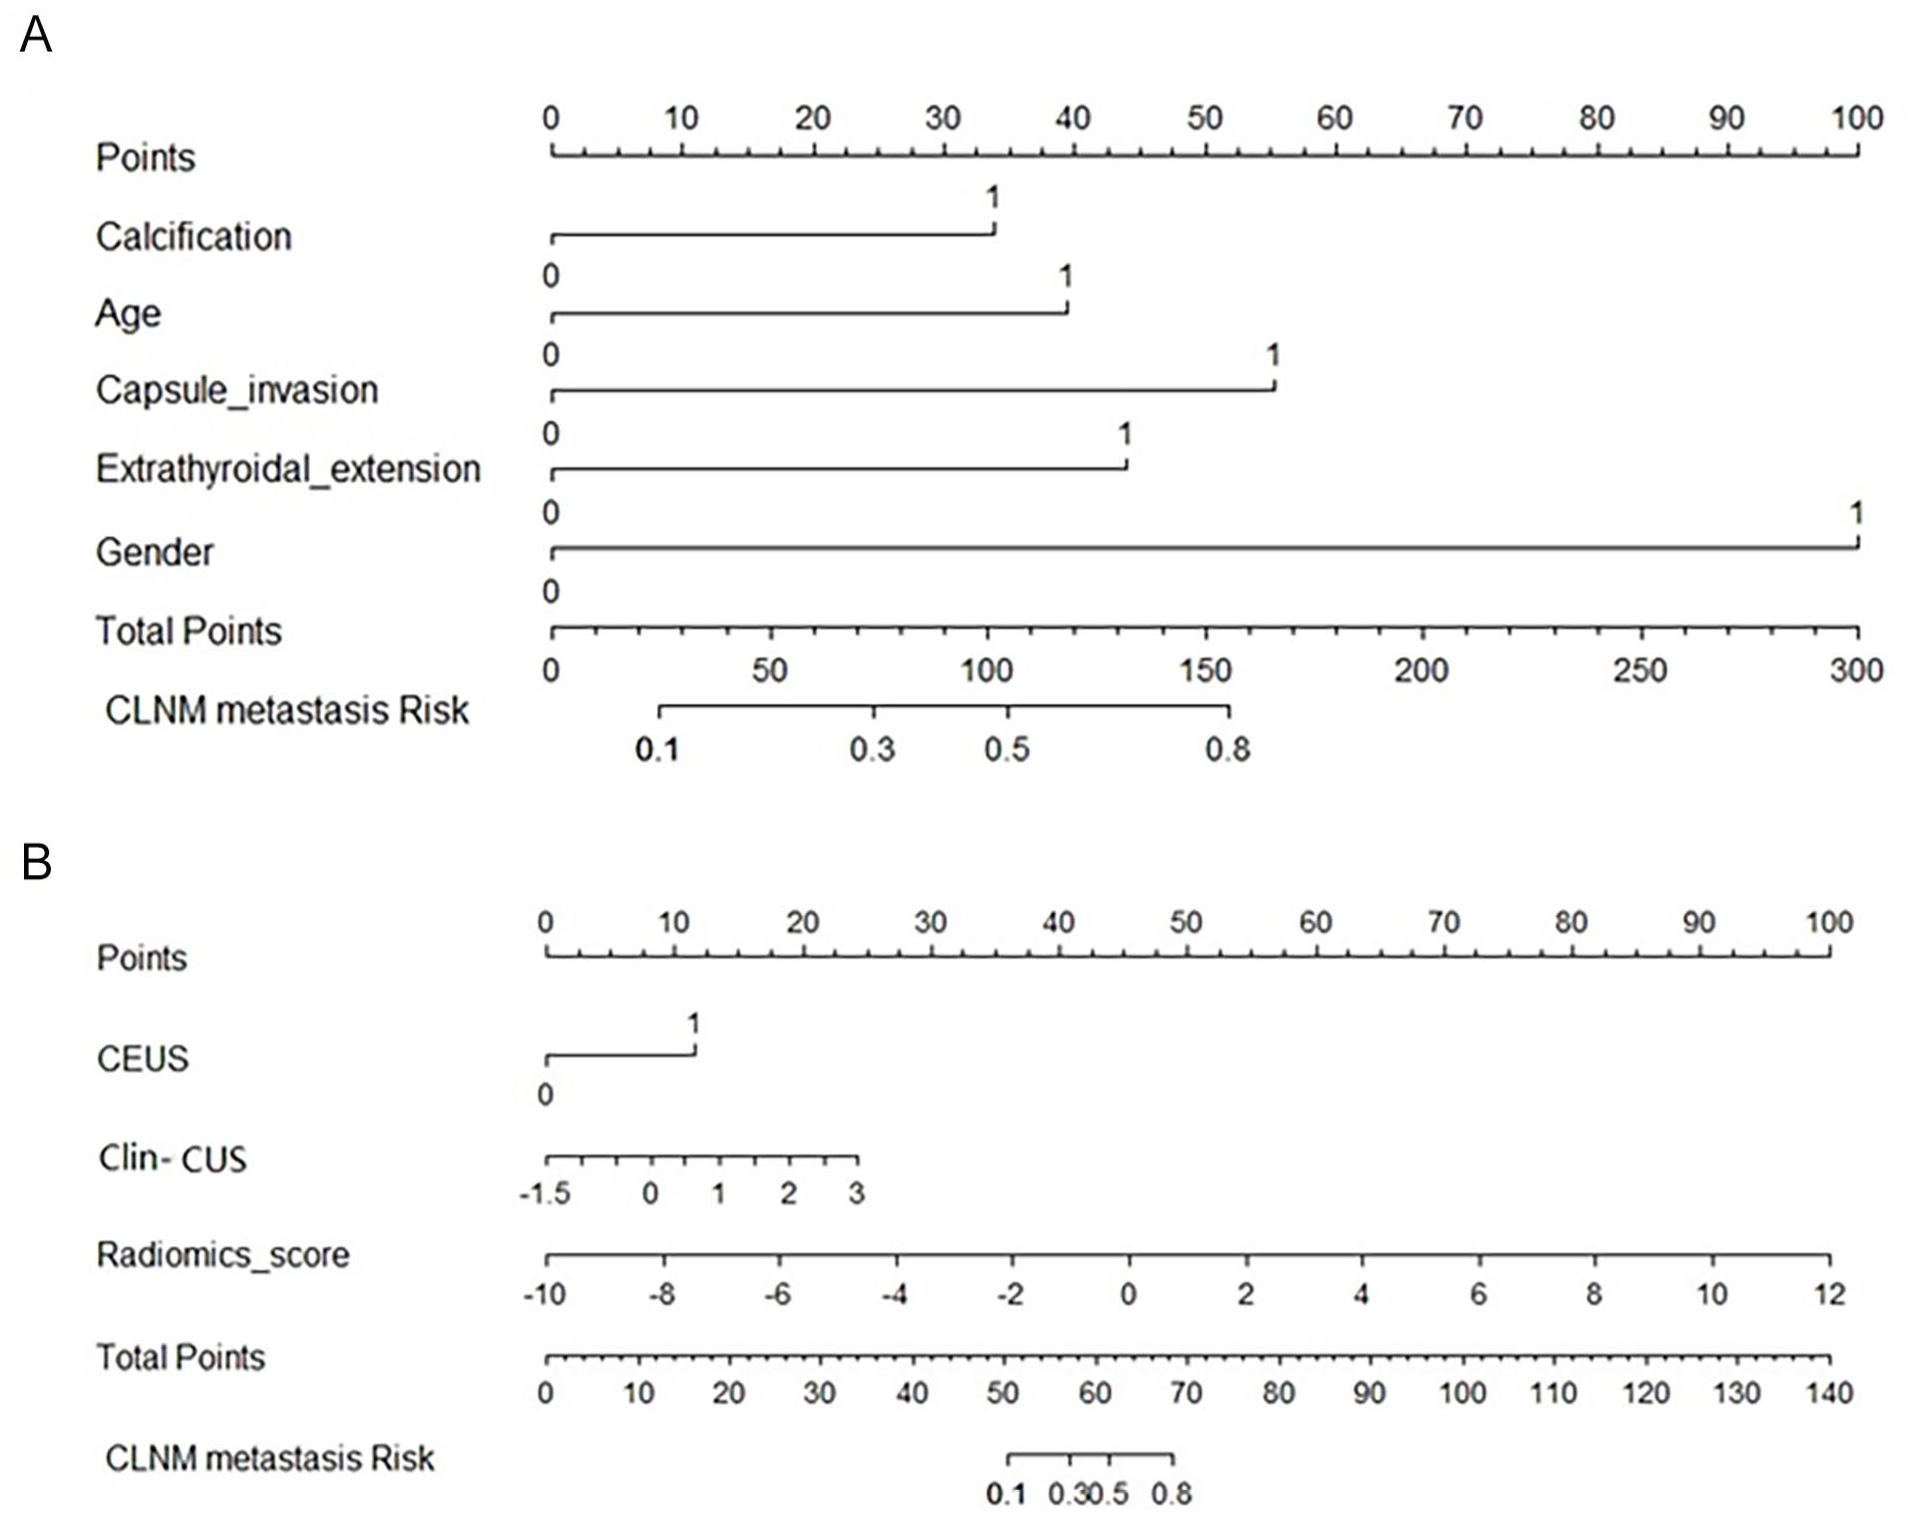
Nomogram predicting the occurrence of CLNM in PTMC patients. (A) Nomogram of US-Clin model; (B) Nomogram of the combined model.
Comparison of AUC Between ROC Curves Based on DeLong test Predicting the Occurrence of CLNM in the PTMC Patients.
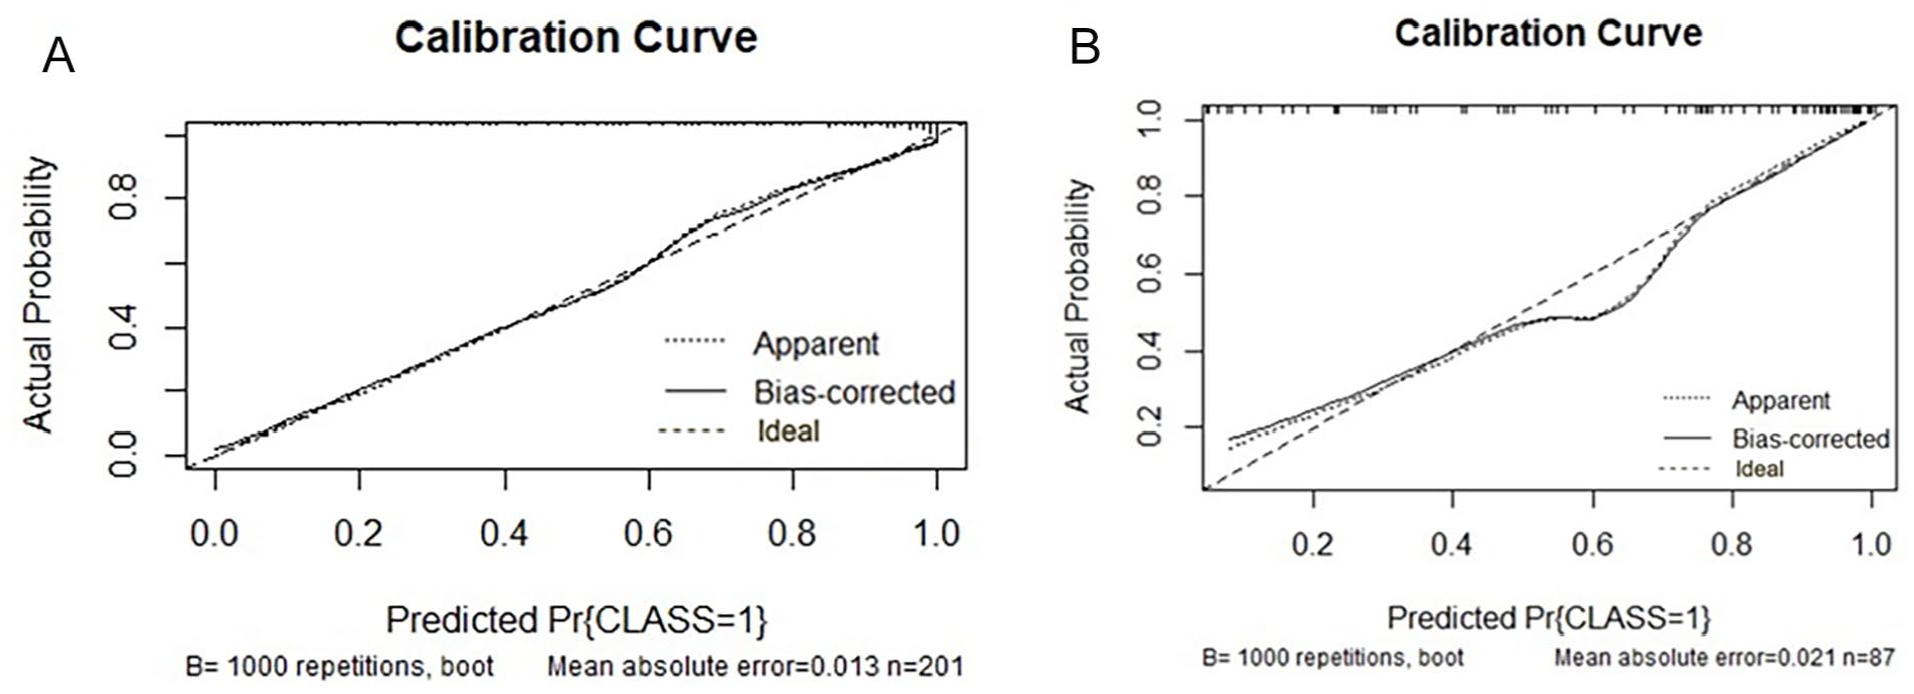
Calibration curve predicting CLNM by nomogram of the combined model. (A) Schematic illustration of the training set. (B) Schematic illustration of the test set. The vertical coordinate is the actual probability, and the horizontal coordinate is the predicted probability. The closer the solid line is to the diagonal dashed line, the better the model’s predicted results match the actual results.
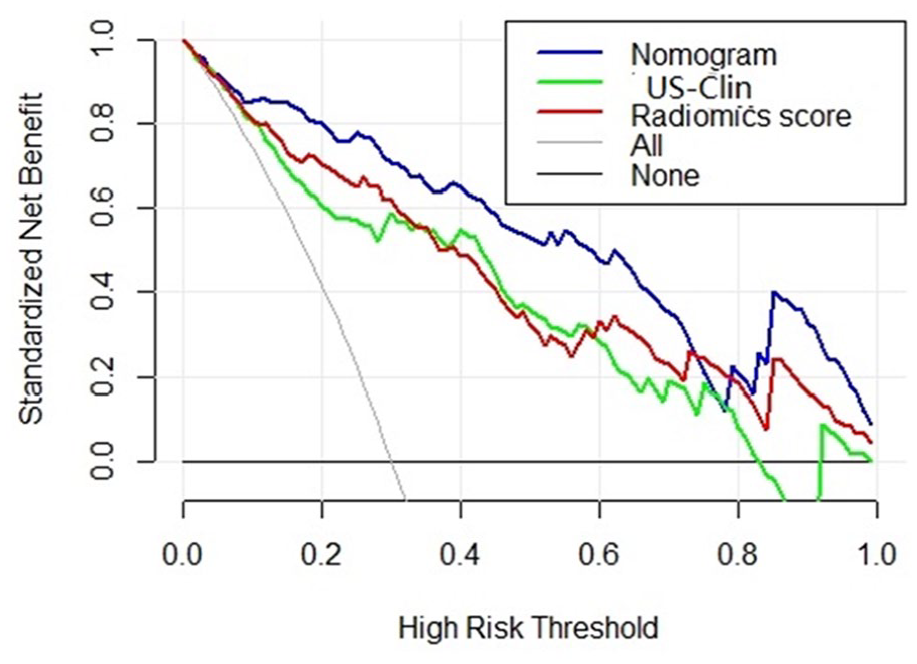
Decision curve analysis of the nomogram.
Discussion
The sensitivity of a single routine ultrasound examination for CLNM in PTMC is relatively poor. 8 Here, we analyzed the clinical features, conventional ultrasound features, CEUS features of PTMC and combined them with ultrasound radiomics features to establish a nomogram for preoperative prediction of CLNM in PTMC. Then, the performance of this nomogram in the preoperative prediction of CLNM was then validated. In the ultrasound radiomics of the study, the Radiomics score model achieved good discrimination ability with an AUC of 0.876 in the training group and an AUC of 0.807 in the validating group. In contrast, the US-Clin model based on clinical and ultrasound features had an AUC of 0.812 in the training group and an AUC of 0.741 in the validating group, indicating that the sensitivity of macroscopic analysis of ultrasound images is significantly lower than that of machine learning-based analysis. The AUC of the combined model’s ROC curve is 0.921 in the training group and 0.889 in the validating group, indicating that the combined model helps improve the diagnostic accuracy of preoperative CLNM for PTMC. This suggests that once sufficient clinical risk information from sample datasets is provided, machine learning-based radiomics can outperform experienced clinicians, consistent with previous artificial intelligence (AI) studies on thyroid tumors. 9 However, there are significant differences in AUC among models based on different clinical parameters. This means that although ultrasound radiomic features have a higher weight in this model, other risk factors remain important, which necessitates the inclusion and validation of more preoperative risk factors in future research by investigators. In this research, the composition of the radiomics score is primarily constructed from wavelet features and texture features (lbp.3D), which reflect the potential pathological information of tumors. For example, wavelet.HLH_glrlm_ShortRunEmphasis and wavelet.HHL_firstorder_Mean describe the significance of image intensity and the average gray level intensity in the tumor region, respectively. Meanwhile, lbp.3D.k_glszm_GrayLevelNonUniformity measures the uniformity of different gray levels in the image, with lower values indicating a more uniform distribution of gray levels. log.sigma.1.mm.3D_glcm_Correlation is based on the Gray Level Co-occurrence Matrix (GLCM) and measures the correlation between image gray levels, with higher values indicating greater consistency within the image. Similarly, research by Deng et al. 10 has demonstrated that wavelet features can reflect the biology and heterogeneity of tumors and perform well in tumor grading. Additionally, research by Li et al. 11 has confirmed the good performance of texture features based on lbp.3D in distinguishing tumor lymph node metastasis. Previous research findings have shown that the incidence of PTMC is higher in female patients (72.5%), which may be related to fluctuations in sex hormones during the menstrual cycle or pregnancy.
The higher incidence of CLNM in males compared to females may be related to the fact that male patients normally have a higher basal metabolic rate which may stimulate the hyperactive proliferation of tumor cells, leading to a greater susceptibility to metastasis. 12 The clinical risk factors (age and gender) included in this study were identified as independent risk factors for CLNM in tumors, which is consistent with previous findings. 13 Using univariate and multivariate analyses, we found that some of the predictors of ultrasound features were microcalcifications, envelope invasion, and extrathyroidal dilatation on enhancement. Studies have demonstrated that CEUS helps predict CLNM in PTMC and that angiogenesis plays an important role in tumorigenesis, growth and metastasis. 14 Tumors can metastasize to regional lymph nodes via neovascularization or pre-existing vessels. Therefore, CEUS can be used in clinical work to complement conventional ultrasound in clinical practice for visualizing the microvasculature and providing detailed tumor information. Wei et al. found that CEUS has a higher sensitivity for diagnosing extrathyroidal extension compared to conventional ultrasound (91.1% vs. 49.0%). 15 In this study, we found that extrathyroidal extension of PTMC was associated with CLNM by studying seven CEUS features, which was partially consistent with previous investigations.16,17 For further analysis, we defined tumor distance from the capsule ≤ 0 mm as capsule invasion, and 74.5% (71/95) of the 95 PTMC patients who developed CLNM had extrathyroidal capsule invasion. Additionally, extrathyroidal expansion occurred in 41.1% (39/95) of the 95 CLNM patients in PTMC with a distance from the capsule ≤ 0 mm on CEUS images. Therefore, CLNM is more likely to occur close to the thyroid envelope. This result is consistent with a recent study by Tallini et al. 18 This suggests that the closer the PTMC is to the capsule, the greater the risk of invasiveness, such as the development of lymph node metastases. The subcapsular PTMC can easily access the capsule and extrathyroidal tissues, including blood and lymphatic vessels, so it is crucial for tumor management and staging to consider tumor size. Although there is no unified cut-off standard to predict the threshold for CLMN occurrence in PTMC, most studies use 0.5 cm as the size threshold. 19 This study includes a size threshold of 0.5 cm in the statistical analysis, and the results indicate that there is no correlation between the size of PTMC and CLNM (p > .05). This may be related to insufficient sample size or the fact that the study is single-center, leading to selection bias. In our study, multifocality is not a risk factor for CLNM, which may be due to the high prevalence of benign thyroid nodules distorting the results for some patients. 20 Therefore, if all patients with multifocal tumors undergo preoperative ultrasound and ultrasound-guided FNAB, it may improve the accuracy of lesion assessment. In 2015, the American Thyroid Association (ATA) identified microcalcification as one of the highly specific characteristics of suspicious malignant nodules. Research 21 indicates that the presence of calcification within tumors is due to localized accumulation of calcium salts, which may be caused by rapid proliferation of tumor cells and the accompanying hyperplasia of cancerous tissue. 21 In our research, it was found that the presence of calcification within tumors is a risk factor suggesting involvement of cervical lymph nodes. Some studies have reported that cervical lymph node metastasis (CLNM) is significantly associated with hypoechoic tumors and irregular margins, but there is considerable disagreement among different studies, which may be related to the subjective factors of ultrasound practitioners that lead to inconsistent diagnostic standards. 12 In our study, no statistical significance was found for significantly hypoechoic tumors and irregular margins. We employed a machine learning-based radiomics model that achieved good predictive performance. In the validation cohort, an AUC of 0.889 was achieved, and a higher sensitivity translates to a more accurate negative predictive rate, which helps reduce unnecessary preventive central lymph node dissection (pCLND).
This research has some limitations. Firstly, the study suffers from a limited sample size as it only includes 288 PTMC patients. Secondly, our research does not encompass tumor gene mutations. In recent years, an increasing number of studies have explored gene radiomics and the results demonstrated that gene mutation is associated with lymph node metastasis in PTMC.22,23 Therefore, further investigation is required to determine the independent predictive role of gene mutations. Finally, this study is a single-center study and lacks external validation. Therefore, it is necessary to validate and apply the model in multi-center, large-sample studies, and to develop and improve the model by incorporating deep learning features. In future related research, researchers need to construct models and validate them under conditions of multi-center involvement, large sample sizes, and in conjunction with relevant tumor genes, for the preoperative prediction of CLNM in PTMC patients.
Footnotes
Acknowledgements
None.
Abbreviations Cross-Reference Table
Abbreviations: Full name
PTMC: Papillary thyroid microcarcinoma
Radscore: Radiomics score
CLNM: Central lymph node metastasis
CEUS: Contrast-enhanced ultrasound
pCLND: Prophylactic central lymph node dissection
ROI: Region of interest
DCA: Decision curve analysis
ROC: Receiver operating characteristic curves
AUC: Area under curve
US: Ultrasound
CT: Computed tomography
FNA: Fine needle aspiration
ATA: American thyroid association
ICC: Intergroup correlation coefficient
AI: Artificial intelligence
Author Contributions
Conceptualization, Yi Hao; Data curation, Hui Wang, Zhihong Liu and Yuming Wu; Formal analysis, Ziqing Lu, Beibei Wu and Hui Wang; Methodology, Lei Gao and Wei Jiang; Project administration, Yi Hao, Wei Jiang and Shijian Yi; Resources, Shijian Yi, Yi Hao and Dongmei Lin; Validation, Xiuli Wen, Guanghui Yue and Yi Hao; Writing – original draft, Lei Gao; Writing – review & editing, Xiuli Wen and Guanghui Yue.
Availability of Data and Material
All data generated or analysed during this study are included in this published article.
Declaration of Conflicting Interests
The author(s) declared no potential conflicts of interest with respect to the research, authorship, and/or publication of this article.
Funding
The author(s) disclosed receipt of the following financial support for the research, authorship, and/or publication of this article: This study was supported by the Medicine Plus Program of Shenzhen University under Grant (2024YG007; General Project of Science and Technology Innovation Committee of Shenzhen (grant nos. JCYJ20220530154600001); The funding parties had no influence on the study design, data collection, analysis or interpretation of the results.
Ethics Approval and Consent to Participate
The study was reviewed and approved by the Ethics Committee of the South China Hospital of Shenzhen University ang Shenzhen Hospital of Southern Medical University (HNLS20230301001-A and NYSZYYEC2024K028R001), This was a retrospective study, and the need for informed consent was waived.
Consent for Publication
All authors consent to publish the manuscript.