
Abstract
Time-resolved three-dimensional ultrasound (3D + t US) is a promising imaging modality for monitoring abdominal aortic aneurysms (AAAs), providing their 3D geometry and motion. The lateral contrast of US is poor, a well-documented drawback which multi-perspective (MP) imaging could resolve. This study aims to show the feasibility of in vivo multi-perspective 3D + t ultrasound imaging of AAAs for improving the image contrast and displacement accuracy. To achieve this, single-perspective (SP) aortic ultrasound images from three different angles were spatiotemporally registered and fused, and the displacements were compounded. The fused MP had a significantly higher wall-lumen contrast than the SP images, for both patients and volunteers (P < .001). MP radial displacements patterns are smoother than SP patterns in 67% of volunteers and 92% of patients. The MP images from three angles have a decreased tracking error (P < .001 for all participants), and an improved SNRe compared to two out of three SP images (P < .05). This study has shown the added value of MP 3D + t US, improving both image contrast and displacement accuracy in AAA imaging. This is a step toward using multiple or large transducers in the clinic to capture the 3D geometry and strain more accurately, for patient-specific characterization of AAAs.
Introduction
An abdominal aortic aneurysm (AAA) is a local dilatation of the aorta, which is prone to rupturing. To prevent rupture, AAAs are regularly monitored using two-dimensional (2D) ultrasound (US) in the outpatient clinic. When the maximum aneurysm diameter exceeds the threshold diameter of 5.5 cm for men/5.0 cm for women or the growth rate exceeds 1 cm/year, the risk of rupture is deemed higher than the surgical risk, and the patient is referred for surgery. 1 The diameter and growth of the AAA are however not sufficiently patient-specific rupture indicators, as some small aneurysms rupture, while other larger aneurysms remain stable. 2
Time-resolved 3D ultrasound (3D + t US) has been proposed as an alternative imaging modality to evaluate AAAs. It can provide additional parameters related to the AAA geometry such as its volume3-5 and its mechanical state6-8 in a non-invasive way. 3D + t US facilitates capture of the whole geometry and its distension in a single image acquisition, thereby making it less user dependent than 2D US. 9
Geometrical evaluation of AAAs with 3D(+t) US showed acceptable agreement with CT for the diameter perpendicular to the centerline, the total volume, and the wall surface curvature.5,8 Motion estimation of the aorta using 3D + t US has also shown promising results. A study on in vitro 3D + t US imaging of a AAA-shaped phantom provided accurate strains. 10
In vivo imaging is however more challenging, with image quality limited by shadowing artifacts from bowel gas and absorption of the ultrasound signal, especially in persons with a higher BMI. Despite these challenges, significant differences in aortic wall strains 11 and displacement-derived mechanical parameters12,13 were found between young healthy volunteers, older volunteers, and AAA patients. Patient-specific measurements of aortic strain or stiffness is however challenging, especially in calcified aortas. A study by Derwich et al. 14 showed a high intra-class correlation for aortic strain measurements on healthy aortas (.89) and a much lower value for calcified aortas (.29). This is explained by the authors by the shadowing in the images caused by aortic wall calcifications, 14 and can also be attributed to the small displacements resulting from stiffer aortic walls.
A factor that hinders both the US-based geometrical quantification and strain estimation of the AAA is the poor lateral contrast in US imaging.8,15 This low contrast, appearing in both (time-resolved) 2D and 3D US, is caused by the reflection of the ultrasound waves away from the transducer at the sides of a vessel, when imaging from above (Figure 1(A)). To overcome this poor contrast, multi-perspective ultrasound imaging of the aorta has been proposed.15-17 Here, acquisitions with multiple angles or transducers are used and the images and displacements are combined to improve the coverage of a larger part of the aortic wall (Figure 1(B)). In vitro studies on straight aortic vessels showed an increase in overall wall contrast and strain accuracy with 2D US15,16 and an increase in wall contrast with 3D US. 15 Furthermore, in vivo studies on healthy volunteers with bi-plane imaging have shown the improvements in wall contrast and displacement as well.17,18 Full three-dimensional multi-perspective imaging has been performed on other organs, especially the heart. This has resulted in an increase in motion accuracy19,20 and contrast of the cardiac wall when multiple images are fused.21,22
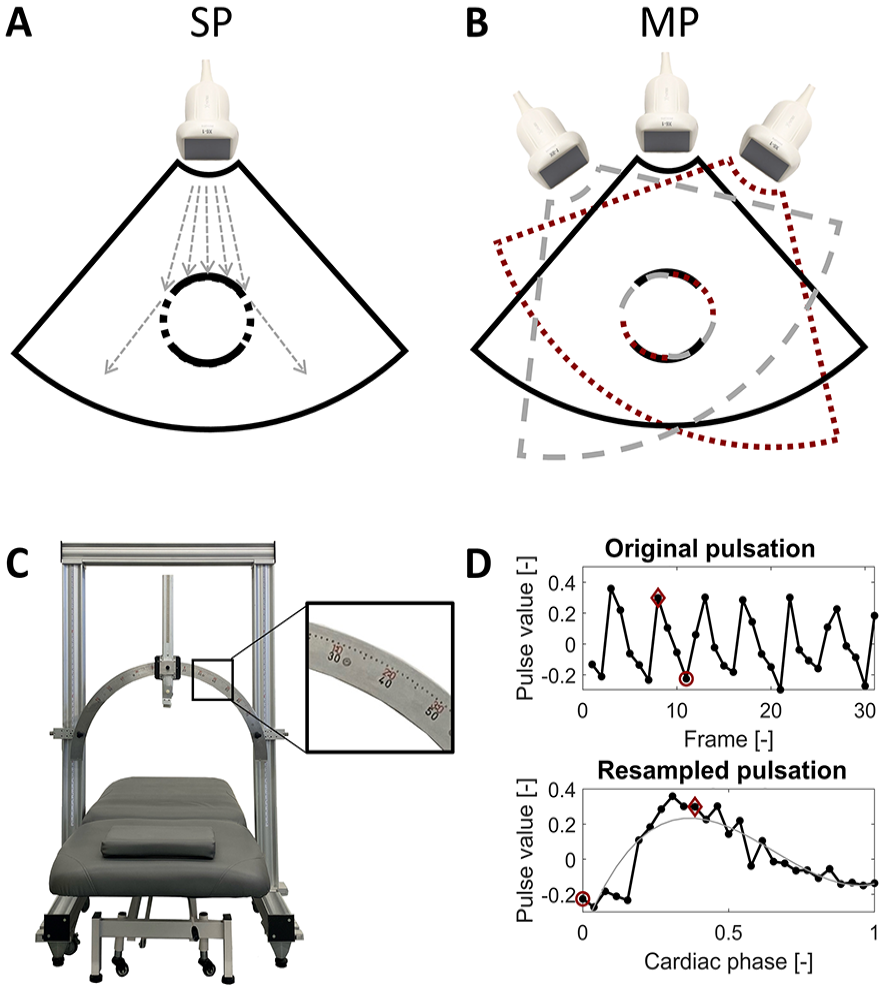
(A) Illustration of the poor visibility of the aortic wall in single-perspective (SP) ultrasound at the left and right side of the vessel, showing the ultrasound reflected away from the transducer in these regions. (B) Illustration of extra regions of the aortic wall becoming visible with multi-perspective (MP) ultrasound. (C) Setup used for the ultrasound acquisitions, consisting of a standard movable bed commonly used in the clinic, and an in-house developed construction with a metal arch over which the probe can rotate, with a scalebar for the acquisition angle. (D) Graphical explanation of the temporal registration as previously described by Sjoerdsma et al., 23 with the selected systolic and diastolic frame indicated with the red diamond and circle, respectively. The smooth gray curve in the bottom panel is a second order fit through the data.
The next step is to investigate whether the improvements in image quality and motion estimation accuracy, as previously found with MP imaging, persist when imaging AAAs, despite the complex geometries and poor image quality resulting from large imaging depths. The aim of this study is to show the feasibility of in vivo multi-perspective 3D + t US imaging for improving the image quality and aortic motion tracking accuracy for its challenging application, imaging of AAAs. The methods are validated in healthy volunteers and AAA patients.
Materials and Methods
In this study, 3D + t US images of the aorta were acquired from multiple angles on the abdomen and spatiotemporally registered and fused. The resulting wall-lumen contrast and motion tracking accuracy were quantified and compared to conventional single-perspective imaging.
Image Acquisition
A total of 14 healthy volunteers and 21 AAA patients were included for aortic US imaging. Ethical approval was obtained for this study, and all participants gave written informed consent. The group sizes were chosen to include a range of image qualities and geometries (for the AAAs).
DICOM ultrasound imaging was performed with a Philips IU22 scanner equipped with an X6-1 matrix probe with 3.5 MHz center frequency and a volume rate of 4 to 8 Hz, with the participant laying in supine position on a movable bed. The bed with the participant was placed underneath an in-house developed probe fixation setup consisting of a metal arch, over which the ultrasound probe could rotate and from which the angle could be read (Figure 1(C)). This setup also ensured that all images were acquired in the same transverse slice, simplifying the registration. The aorta was positioned in the center of the arch by moving the bed in all three directions until the (maximal diameter of the) aorta was in the middle of the US field of view. Once positioned, three 3D+t images were acquired during 7 seconds of breath hold: one from the middle of the abdomen (vertical probe positioning), and two toward the left and right-hand sides of the participant. This resulted in single-perspective images SPL, SPM, and SPR from the left, middle and right, respectively. These images were acquired at 45° relative to the middle, unless prohibited by the position of the ribs, in which case a smaller angle was chosen.
Pre-Processing and Segmentation
All DICOM ultrasound images were anonymized before processing in MATLAB 2021a. The images were interpolated to an isometric voxel grid of 0.5 mm × 0.5 mm × 0.5 mm. The aorta was segmented in all individual volumetric frames of the 3D + t data using a semi-automatic segmentation approach. 24 From these segmentation contours, 3D binary image masks were created.
Spatiotemporal Registration
The cardiac phase of the frames in the 3D + t data was determined in two ways, providing additional information in case of small or irregular pulsations. First, the aortic pulsation was determined from the AAA diameter in the frame-wise segmentations. Secondly, a gradient magnitude image was calculated from the 3D + t US data and tracked in the anterior-posterior direction over all frames. 23 The two pulsation curves were visually checked (Figure 1(D)), and the most regular pulsation was selected, with irregular parts discarded where needed. The resulting curve was temporally sequenced into a single artificial cardiac cycle, as previously described by Sjoerdsma et al. 23 From this artificial cardiac cycle, a systolic and diastolic frame were automatically chosen as the first frame (diastole) and the peak of a second order polynomial fit (Figure 1(D)). Manual adaptations were made when needed.
The diastolic frames of the three SP 3D + t datasets were spatially registered by first rotating the images in the transverse plane based on the acquisition angle indicated by the setup, and secondly translating the images in the transverse plane by automatically aligning the aortic centers in the segmentations. Fixation of the ultrasound probe to the metal arch obviated the need for registration in all other directions. The segmentation masks were registered accordingly. We refer to these coordinates as the “common axes.”
Image Fusion
Two different combinations of single-perspective images were created: a multi-perspective image combining SPL and SPR (MPLR), and an image combining all three angles (MPLMR). The SPL and SPR were fused in the overlapping regions using a fast 3D complex wave wavelet transform,23,25 which averages out the noise and maximizes the visibility of structures from the original images. Next, SPM is fused with the MPLR using the same fusion algorithm, obtaining MPLMR, containing information from all three SP images.
Wall-Lumen Contrast
A selection of the inner aortic wall was created by dilating the average segmentation of the co-registered masks by 1.5 mm, due to a known underestimation of the aortic geometry size with the applied segmentation tool. 8 The dilatation value of 1.5 mm was empirically determined as the optimum of the wall-lumen contrast-to-noise ratio for a range of dilatations. A mask of the aortic wall was created by dilating the inner wall selection with 2 mm. The region inside the inner wall was used as the lumen mask. For determining the contrast, the log-compressed envelope data, which are present in the DICOM images, were converted to intensities (IMint). This was done by scaling the image values from [0 255] to [−60 0] dB with a linear fit. The resulting decibel scale image IMdB was converted to an intensity image with a reverse log-compression:

As a measure of contrast, the generalized contrast-to-noise ratio (gCNR) was chosen due to its interpretability. 26 This contrast measure is based on the overlap of the IMint histograms of the wall and lumen regions, with 1 being no overlap and 0 complete overlap. To investigate the regional differences in contrast, the gCNR was evaluated in 16 regions, equally spaced circumferentially across the aortic wall.
Displacement Calculation and Compounding
The averaged segmentation was transformed back onto the individual 3D + t images. The displacements of the single-perspective images were determined using a 3D coarse-to-fine block matching approach. 27 The displacements were tracked from the diastolic to the systolic frame, and back to the same diastolic frame of the DICOM data for verification purposes (no expected displacement). Kernels of 2.5 mm × 2.5 mm × 2.5 mm and 1.5 mm × 1.5 mm × 1.5 mm were used for the first and second iteration, respectively. The search area was chosen based on the maximal expected displacement seen in the segmentations. A search area of 7.5 mm × 7.5 mm × 7.5 mm and 4.5 mm × 4.5 mm × 4.5 mm were chosen for the volunteers for the two iterations, respectively, while the search areas for the AAA patients were set to 5.5 mm × 5.5 mm × 5.5 mm, and 4.5 mm × 4.5 mm × 4.5 mm. Window skipping of 1 mm was used to speed up the computation (less overlap between kernels). The results of both iterations were filtered with a 5 mm × 5 mm × 5 mm median filter, after which the displacements were interpolated to the coordinates of the geometry segmentation.
The displacements of the AAA geometry from the individual images were registered toward the common axes and averaged after weighting the values with a sin 2 function, based on the angle between each node on the aortic wall and the transducer. From these Cartesian displacements, the radial displacements were determined by taking the dot product with the slice-wise nodal normal vectors. These radial displacements of SPM and MPLMR were visually compared, blinded for the used imaging technique.
Strain Estimation
The local aortic wall displacements were used to calculate the local wall strains with a 2D least squares estimator, which was performed for all SP and MP displacement images. The circumferential strain Ecc was calculated by rotating the cartesian strain tensor with the angle of a node with respect to the aortic centerline.
Quantification of Displacement Accuracy
The mean tracking error (ME) was calculated as

with ux, uy, and uz the cartesian displacements between the original diastolic geometry and the tracked geometry at the second diastolic frame, and n the number of points on the aortic wall.
The quality of the strains in systolic phase was quantified with the elastographic signal-to-noise ratio (SNRe), which was calculated as SNRe = μ/σ, with μ the mean and σ the standard deviation of Ecc over the aortic wall.
Statistical Evaluation
The gCNR scores, ME, and SNRe were statistically compared between all five images (three SP and two MP images) using a paired sign test. P-values below .05 were deemed significant.
Results
Participant Demographics and Exclusions
In total, 14 healthy volunteers and 21 AAA patients were included for aortic imaging. Characteristics of the participants can be found in Table 1, showing that a range of AAA diameters (32–55 mm) were present in this study. The AAA patients had a higher aortic center depth than the volunteers (median of 69 mm vs. 44 mm, respectively) and lower frame rate (median of 4.4 Hz vs. 7.5 Hz, respectively).
Participant and image characteristics, all reported in median (range).
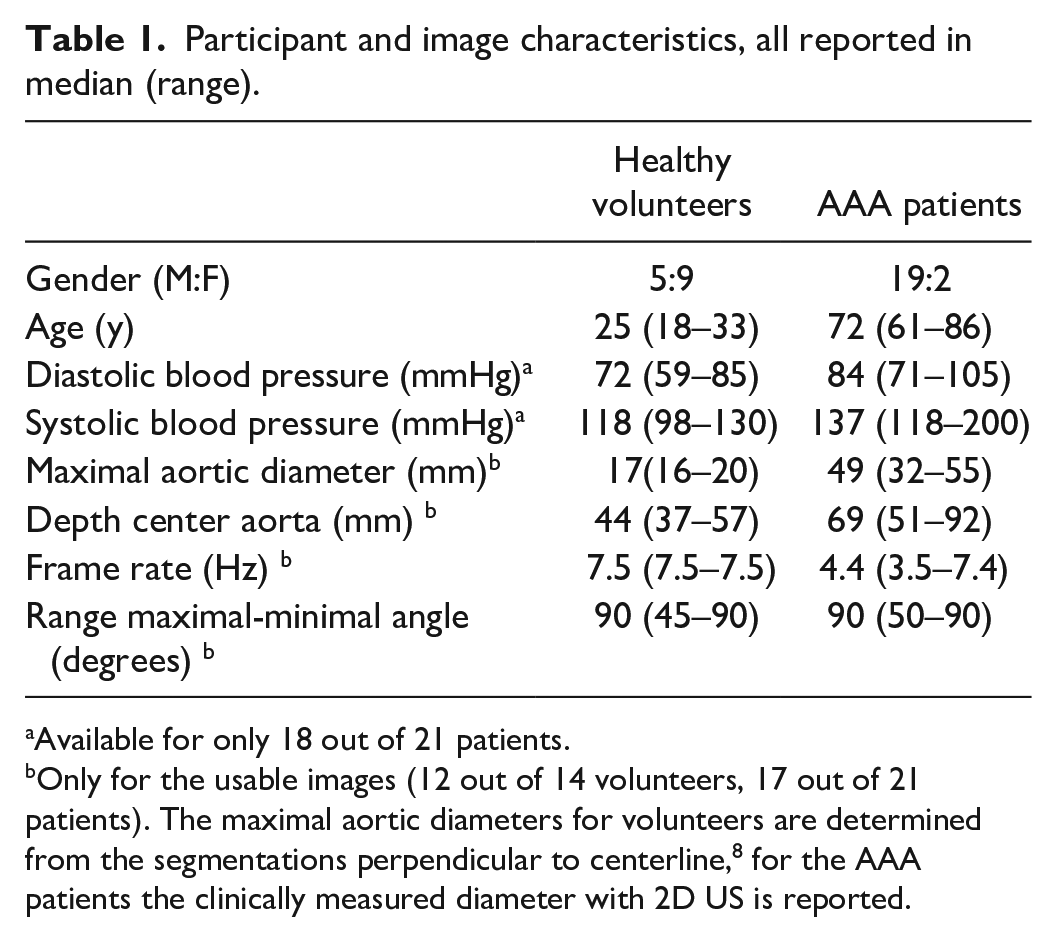
Available for only 18 out of 21 patients.
Only for the usable images (12 out of 14 volunteers, 17 out of 21 patients). The maximal aortic diameters for volunteers are determined from the segmentations perpendicular to centerline, 8 for the AAA patients the clinically measured diameter with 2D US is reported.
More datasets from patients had to be excluded than from volunteers, as shown in Figure 2, due to complex aortic geometries (2 and 1, respectively) and poorly visible pulsations (4 and 0, respectively).
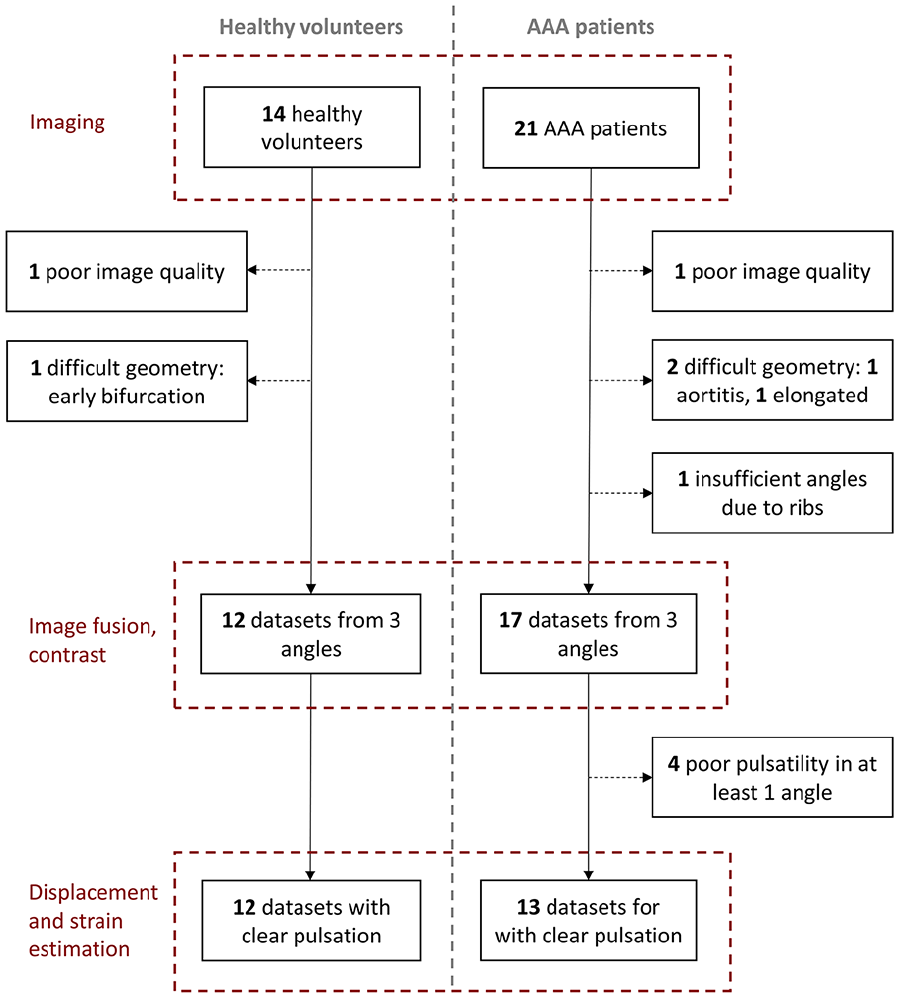
Number and reasons of exclusions in every step of the imaging and image processing, for both healthy volunteers (left) and abdominal aortic aneurysm (AAA) patients.
Visual Comparison of SP and MP Images
Visual examples of the SP and MP images are shown in Figure 3, displaying the variation in image quality between the different SP images, both within and between participants. In most participants, SPL and SPR have a smaller region of the wall with bright reflections compared to SPM, and a brighter appearance of the lumen, possibly due to a larger distance from the aorta. In the MPLR images, a larger region of the aortic wall has bright reflections, but the reflections at the top and bottom part of the aorta are missing, especially in volunteer 1 and patient 2. In MPLMR, these gaps are filled. This increase in aortic wall visibility for MP imaging even occurs when the images taken from the sides have a poor wall-lumen contrast (volunteer 2 and patient 2).
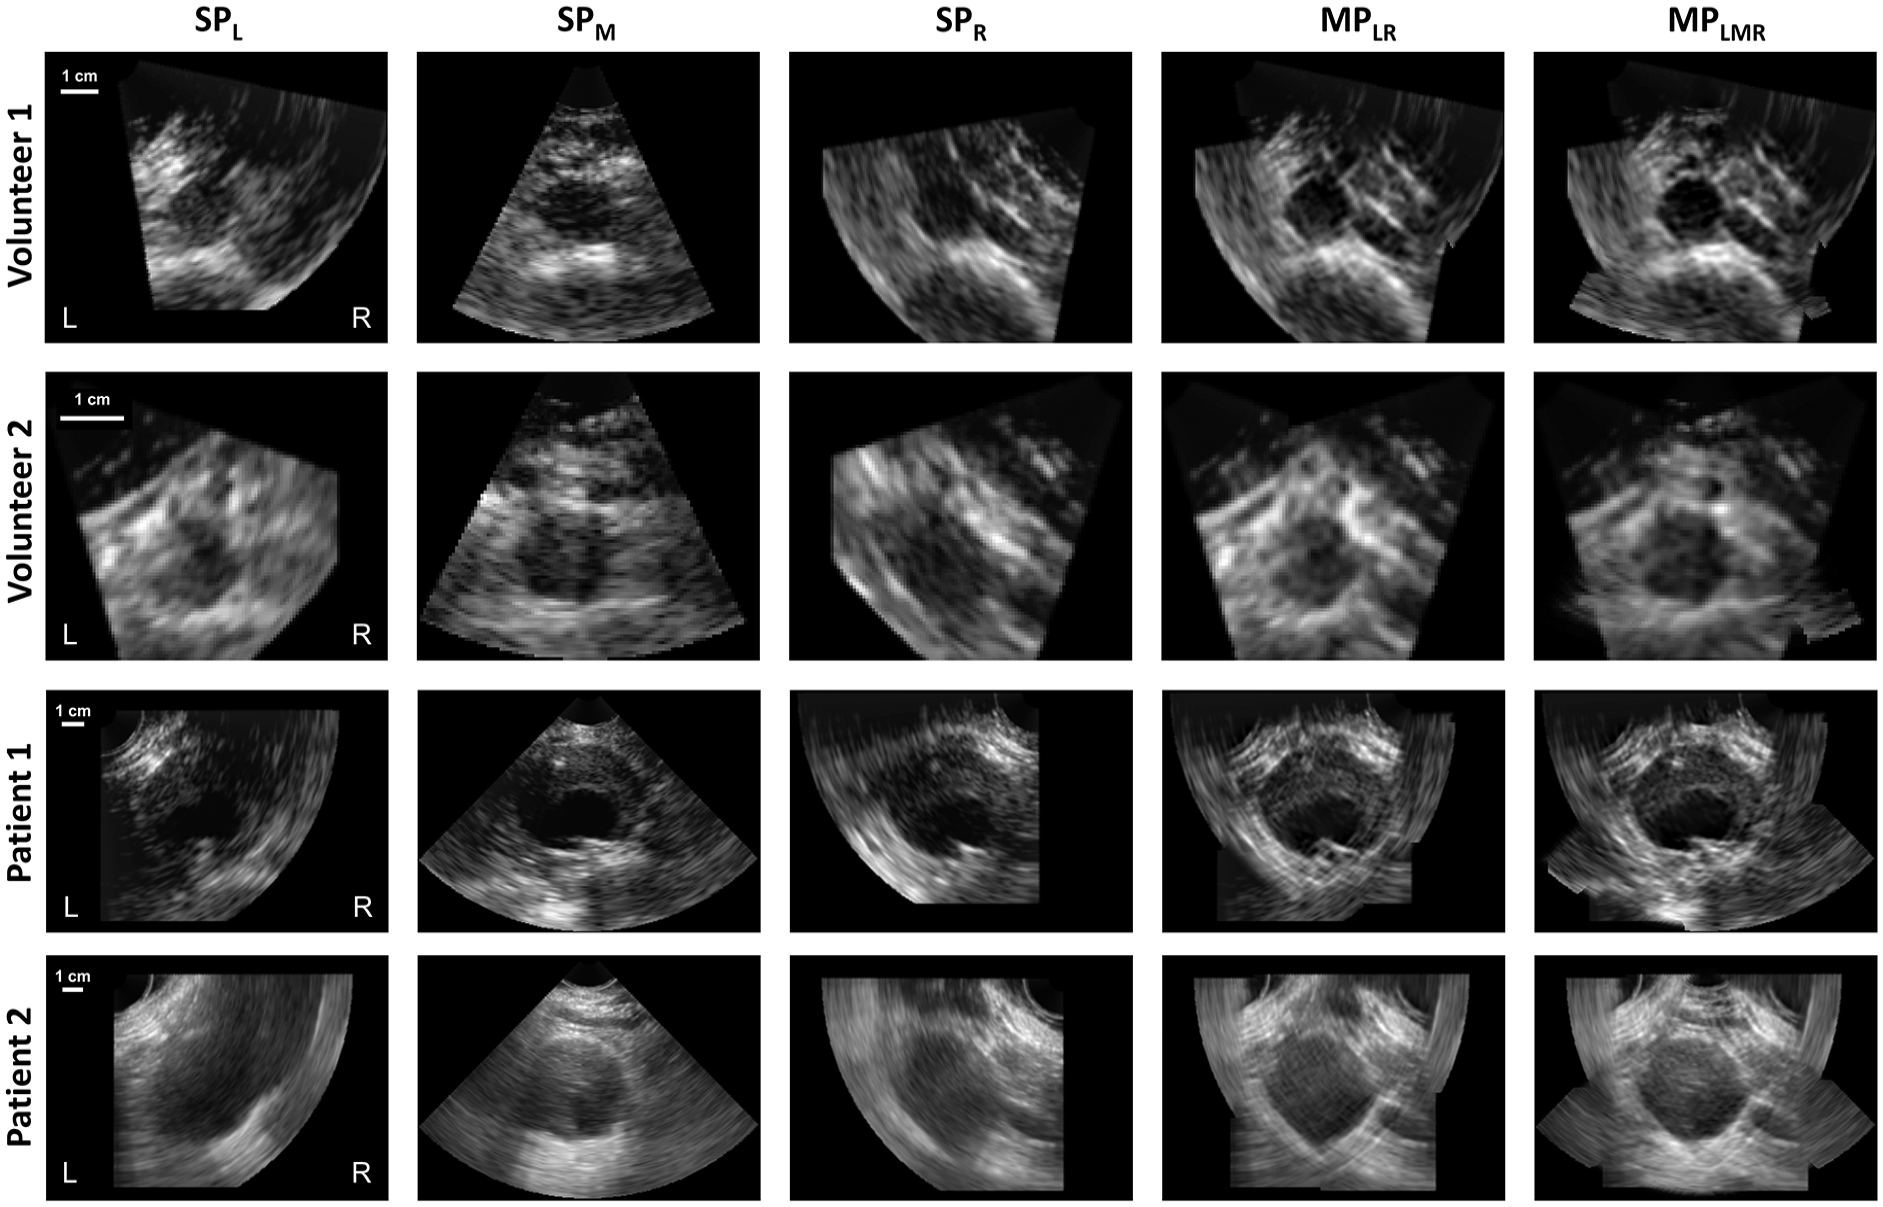
Visual examples of transverse slices of 3D + t single-perspective and multi-perspective ultrasound images of the aorta for healthy volunteers and AAA patients. SPL, SPM and SPR are single-perspective images acquired from the left, middle and right of the abdomen, respectively, and MPLR and MPLMR are multi-perspective images, combining the left and right angle, and left, middle, and right angle, respectively. The white labels “L” and “R” indicate the left and right sides of the participant. Examples of cases with better wall-lumen contrast (volunteer 1 and patient 1) and poorer wall-lumen contrast (volunteer 2 and patient 2) are shown. Note the differences in image scale between the different participants.
Wall-Lumen Contrast
The quantitative differences in wall-lumen contrast per region (Figure 4) show elliptical shapes in the gCNR polar plots for the SP images of the volunteers (row II). The major ellipse axes align with the transducers, indicating the highest contrast in these regions. For the AAA patients (row III), the pattern is shaped more like the number 8, indicating a poorer wall-lumen contrast at the lateral sides of the aorta than for the volunteers. This is probably because these aortic wall regions are further from the center of the ultrasound acquisition, due to the larger aortic diameter. The gCNR values for MPLR are higher and more constant along the circumference of the aorta than for SP imaging, with segment-wise medians for volunteers ranging 0.31 to 0.68 and 0.56 to 0.75 for SP and MP, respectively. For patients, the gCNR values for SP and MP are 0.22 to 0.69 and 0.45 to 0.70 (Figure 4(F)). This shows that especially the poor contrast regions have improved. For the volunteers, addition of the third angle leads to an increase in gCNR at the top and bottom of the aorta, without decreasing the gCNR value at the sides (Figure 4(E) and (F)). For the AAA patients, the gCNR values at the sides do decrease slightly in MPLMR, probably due to the very poor lateral contrast in the SPM images.
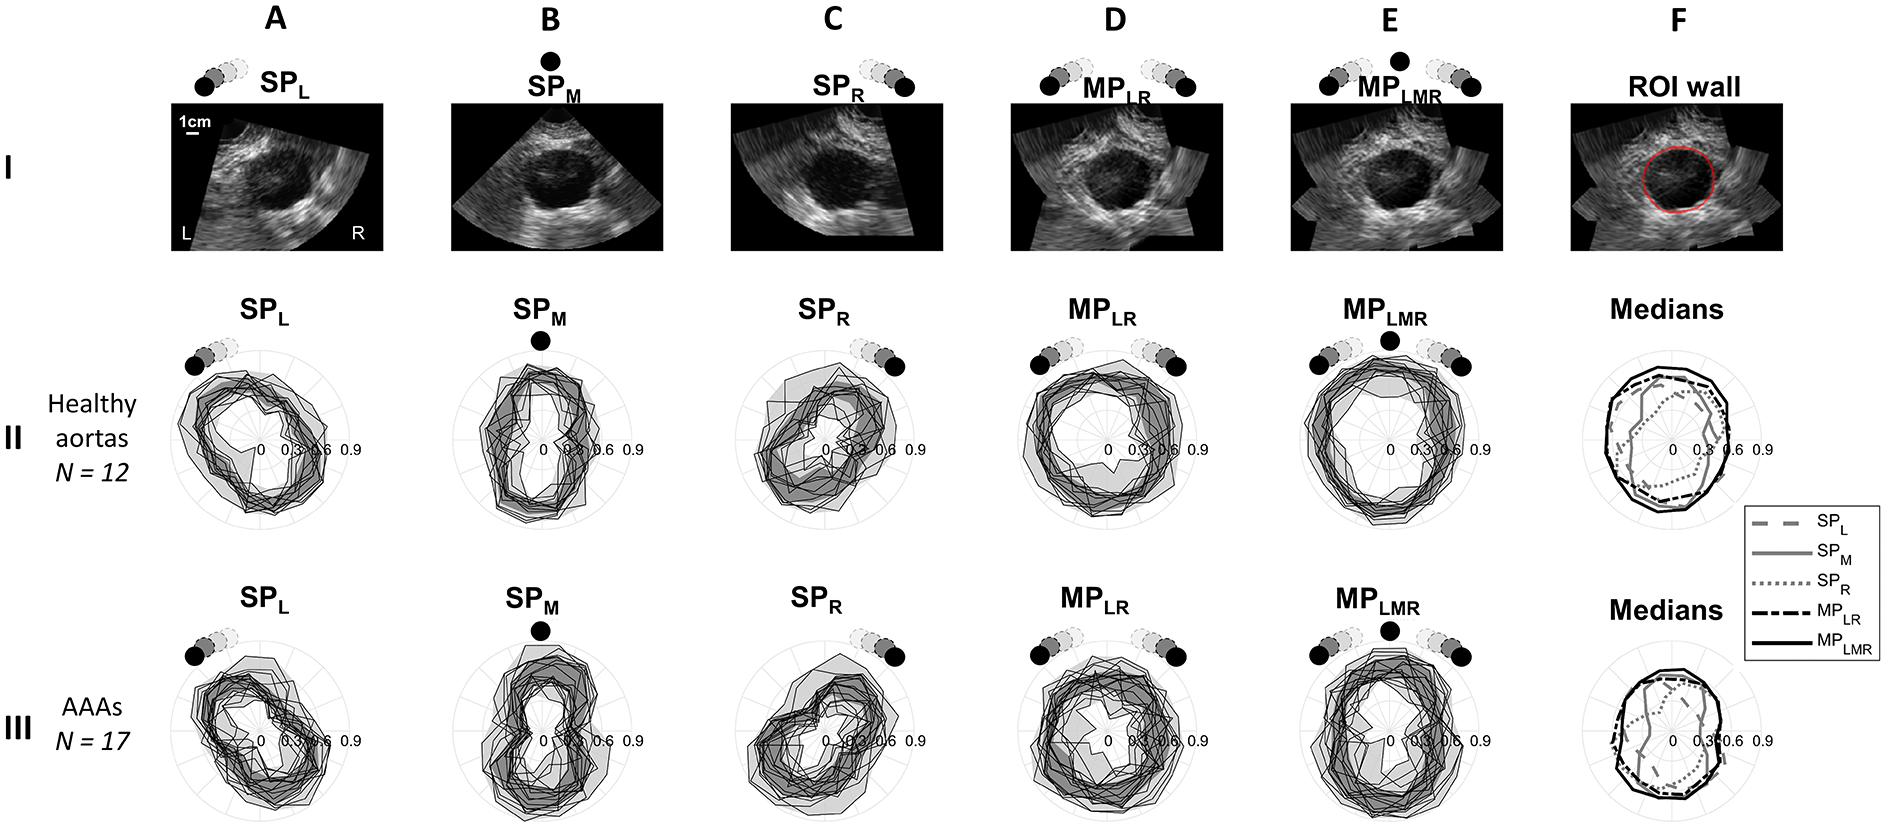
Polar plots of the generalized contrast-to-noise ratios (gCNR) of the image intensities of the aortic wall compared to the lumen, on 16 regions along the circumference of the aorta for (II) healthy volunteers and (III) abdominal aortic aneurysms (AAAs). Columns (A–C) show single-perspective images from the left, middle and right (SPL, SPm, and SPR, respectively) and (D and E) show multi-perspective images combining the images from the left and right (MPLR), and all three angles (MPLMR). Row I shows the ultrasound images from these angles for a patient, for illustrative purposes. The locations of the probes are indicated with the black dots, with the probe symbols at the left/right illustrating the range of angles at which the images are acquired. The dark gray areas in the gCNR plots show the IQR of the gCNR values per circumferential segment. Column F shows (I) an example of the ROI of the wall in red, and (II and III) the median gCNR values of column A-E.
The gCNR values over the whole aortic wall (Figure 5) show higher gCNR values for the healthy volunteers than for the AAA patients. Both MP images have a statistically significantly higher gCNR than the SP images, for both volunteers and AAA patients (all P < .001, except SPM vs. MPLR for volunteers with P = .04). For the volunteers, the MPLMR image has a significantly higher gCNR than the MPLR image (P < .001), while this is not the case for the AAAs, possibly due to the lower gCNR at the sides for the latter (Figure 4(E) and (F)).
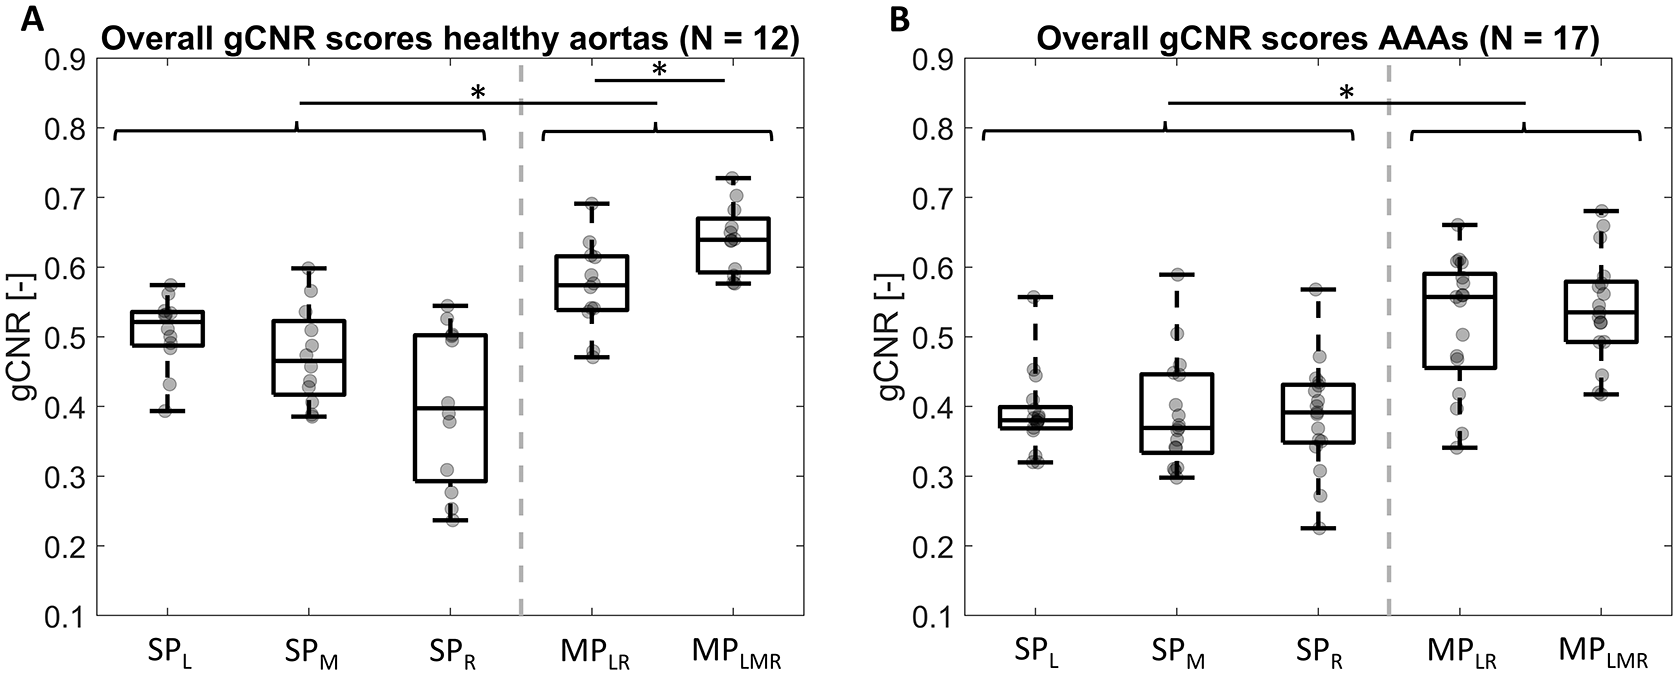
Box-and-whiskers plots of the generalized contrast-to-noise ratio (gCNR) of the aortic wall intensity compared to the lumen, for A healthy aortas and B abdominal aortic aneurysms (AAAs), with individual datapoints added in gray. SPL, SPM, and SPR are single-perspective images acquired from the left, middle, and right of the abdomen, respectively, and MPLR and MPLMR are multi-perspective images, combining the left and right angle, and left, middle, and right angle, respectively. Statistically significant differences (P < .05) are indicated. The gray dashed line separates the SP and MP results.
Displacement and Strain
Examples of the radial displacements in Figure 6 I and II show the highest displacement at the anterior side of the aorta for all images, with higher displacements for the volunteer than for the patient. The maximal displacement is shifted slightly toward the transducer (column A and C), showing improved measurements in those regions. The compounded displacements (column D and E) have more uniform patterns than the SP displacements, with a wider region of the aorta uniformly moving outwards, and less other regions with high displacements. Blinded inspection showed that the MPLMR displacement pattern was more regular than the SPM pattern for 67% of the volunteers and 92% of the patients, with the other patterns being similar in regularity between SPM and MPLMR.
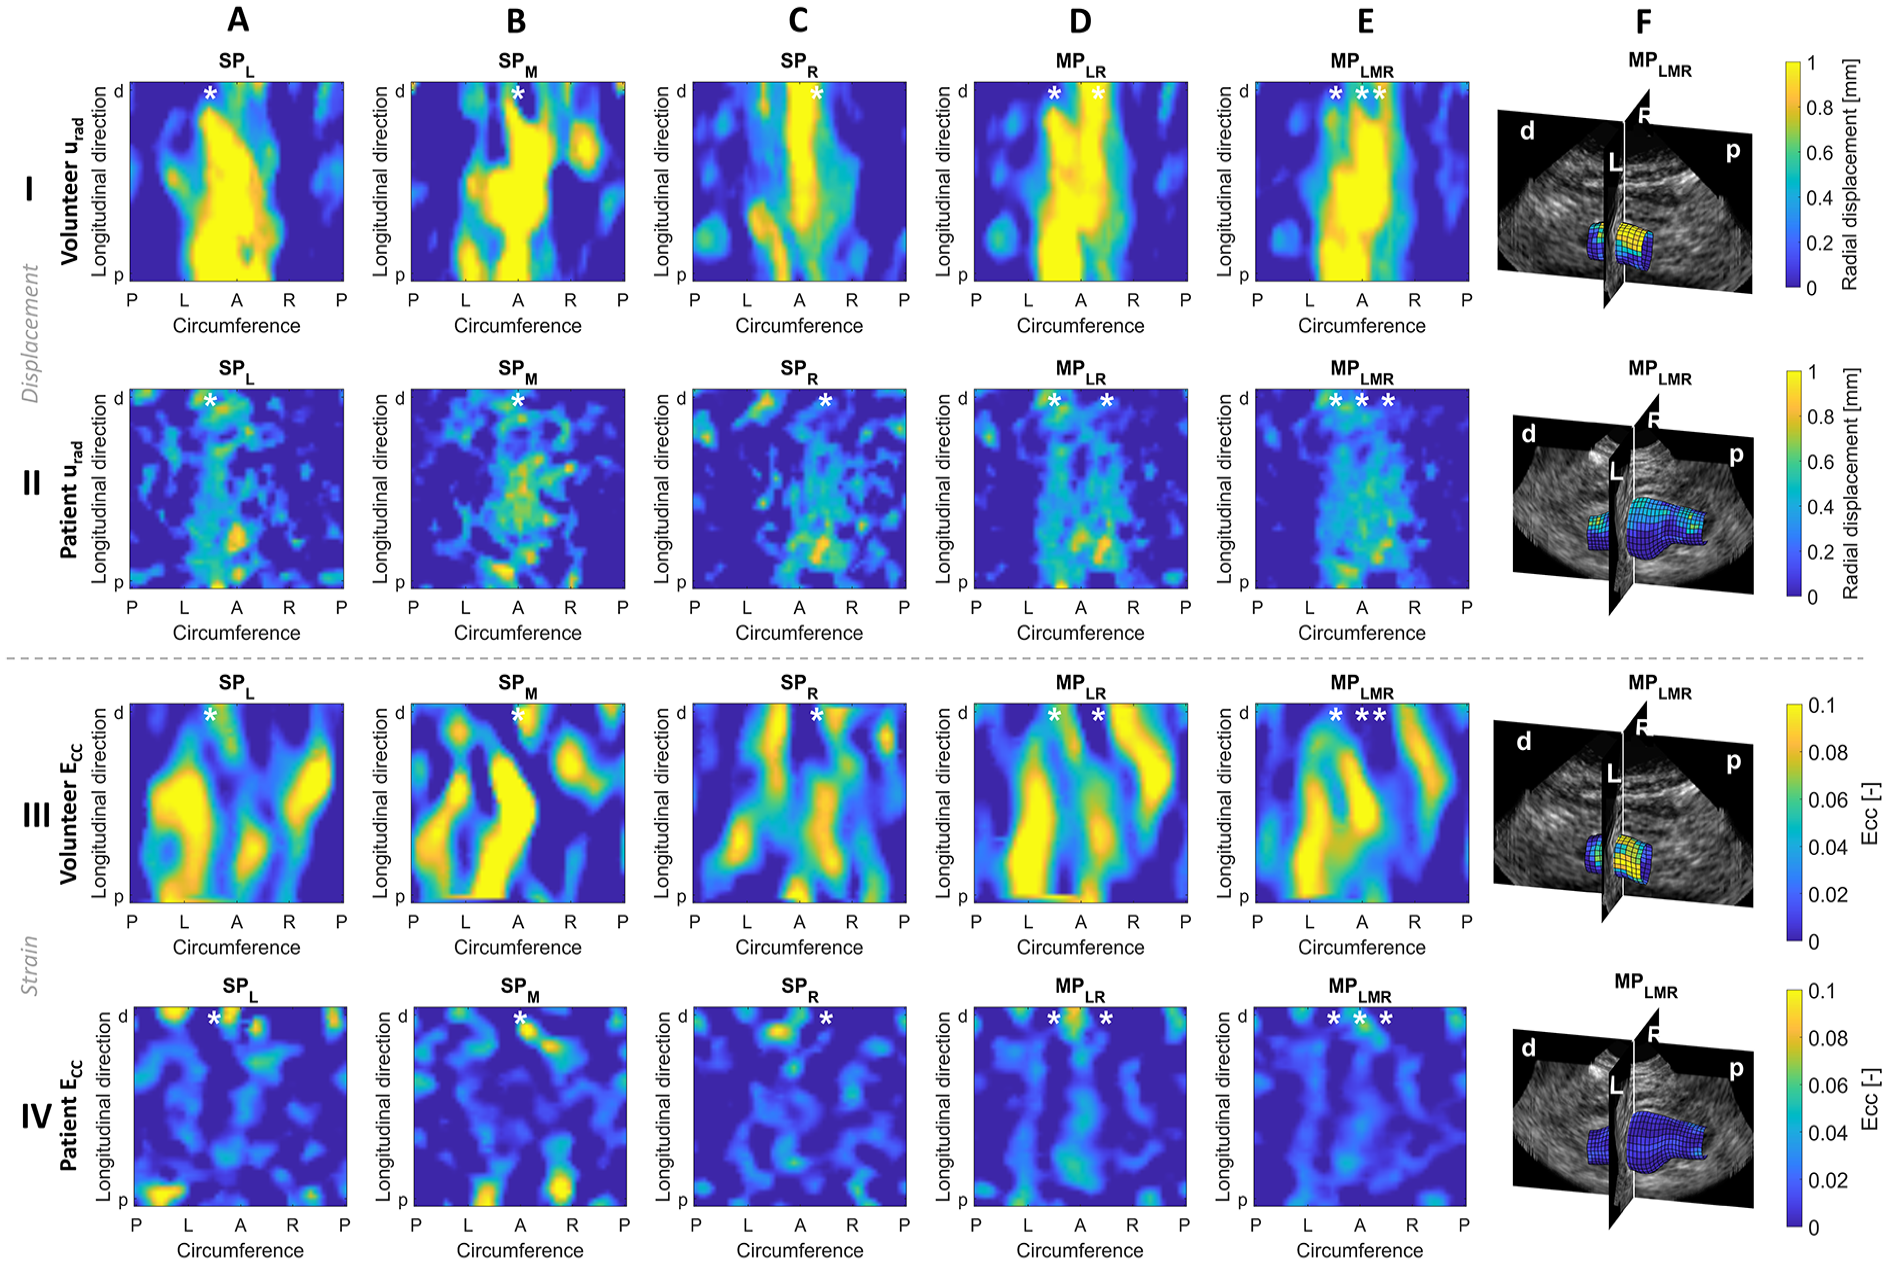
Examples of radial displacements (I and II) and circumferential strains (III and IV) for (A–C) single-perspective images from the left, middle and right (SPL, SPm, and SPR, respectively) and (D and E) multi-perspective images combining the displacement from images from the left and right (MPLR), and all three angles (MPLMR). (F) shows the radial displacement (I and II) and circumferential strain (III and IV) from the MPLMR image on the 3-dimensional aortic geometry. Results for a healthy volunteer (I and III) abdominal aortic aneurysm (AAA) patient (II and IV) are shown. Lower case labels “p” and “d” indicate the proximal and distal direction, capital labels in the circumferential direction indicate “P” for posterior, “L” for left, “A” for anterior, and “R” for right. The location of the probe(s) is indicated with a white asterisk.
The circumferential strain patterns have higher values for the volunteer than for the patient (Figure 6 III and IV). In all patterns, both from single images and from compounded displacements, bands of higher strain values can be seen in the longitudinal direction, possibly due to tracking drift. In the MP images of both examples, three bands are present: at the left, right, and anterior. These circumferential stripe patterns are visible in most participants. The overall appearance of the MP strain pattern in Figure 6 is a bit more uniform than for the SP strains.
The mean error of the displacements (Figure 7(A) and (B)) is relatively high (0.35–0.40 mm for SP and 0.27–0.34 mm for MP, respectively) compared to the displacements, as the 95th percentile radial displacements for healthy volunteers and AAA patients are 1.0 [0.82–1.17] mm and 0.59 [0.50–0.64] mm, respectively. A statistically significant decrease in ME is found when displacements from all three angles are compounded (all P < .001), while the ME for MPLR is only statistically significantly lower than SPL and SPR (P < .01) but is not different from SPM. This holds for both healthy volunteers and AAA patients.
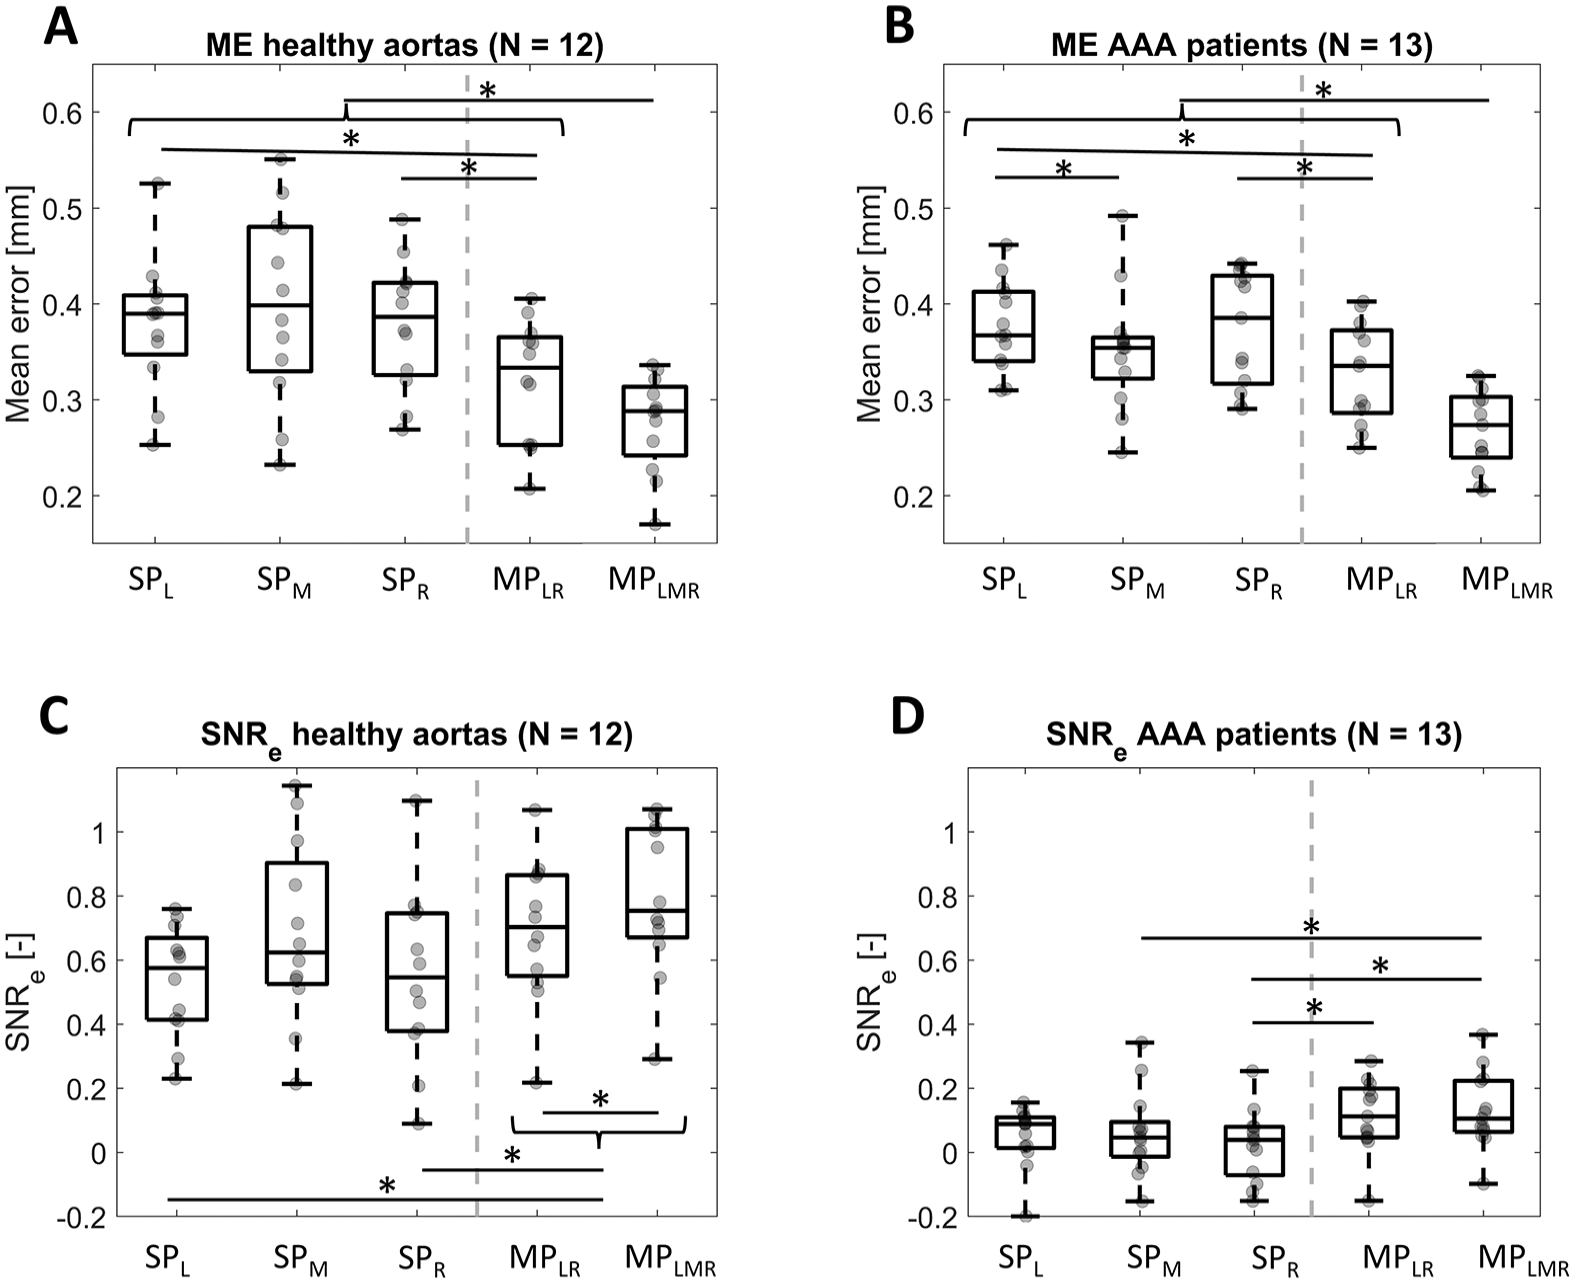
Box-and-whiskers plots of (A and B) the mean tracking error (ME) and (C and D) the elastographic signal-to-noise ratio SNRe for healthy volunteers and abdominal aortic aneurysm (AAA) patients. Individual datapoints are added in gray. SPL, SPM, and SPR are single-perspective images acquired from the left, middle and right of the abdomen, respectively, and MPLR and MPLMR are multi-perspective images, combining the left and right angle, and left, middle, and right angle, respectively. Statistically significant differences (P < .05) are indicated. The gray dashed line separates the SP and MP results.
The elastographic signal-to-noise ratios (Figure 7(C) and (D)) are low for both SP and MP images, with medians of 0.55 to 0.75 for healthy aortas and 0.04 to 0.11 for patients, showing that the noise is larger than the signal (SNR < 1). For the healthy volunteers, the SNRe increases significantly when using compounded displacements compared to displacements from the sides, but no statistically significant difference was found with SPM (P = .38). For the AAA patients, the SNRe from MPLMR is significantly higher than for SPR and SPM, but it is not significantly higher than for SPL (P = .09). The presence of negative SNRe values for the AAA patients indicate an unexpected negative mean circumferential strain, possibly resulting from the complex displacement patterns seen in those US images.
Discussion
In this study, in vivo 3D + t ultrasound images of the (aneurysmatic) abdominal aorta were acquired from multiple angles on the abdomen. These images were registered and fused, resulting in a better wall-lumen contrast. Displacements from the individual images were compounded, which lead to a decrease in tracking error. With this, the feasibility of in vivo multi-perspective 3D + t US imaging for improving image quality and displacement accuracy was shown.
The improvement in contrast in MP imaging over the whole aortic wall is expected to make segmentation of the AAA more straightforward, as this suffers from the poor lateral contrast in conventional US imaging. 8 With this, US-based patient specific models are also expected to provide more accurate wall stress values, as these rely heavily on the segmentation. 28
The radial displacements found in this study are as expected for most participants, with higher displacements for volunteers than for patients, and the largest displacements on the anterior side of the aorta. The strain patterns are more difficult to interpret: it is unclear whether regional strain differences are a result of local differences in the aortic wall material or are due to tracking errors. Local differences in aortic wall stiffness29-31 and wall thickness 32 have previously been shown in AAAs. The presence of longitudinal patterns on the Ecc maps of almost all participants, however, suggest room for improvement in the speckle tracking algorithm. Validation of strain estimates with a AAA phantom, 33 preferably with realistic surrounding materials such as the spine and fat layers which affect the aortic motion and image quality, could help to further differentiate the actual aortic wall differences from measurement noise.
An important limitation of this study is the manual checks required for temporal registration of the images, especially for the AAA patients, due to poorer regularity in the displacement patterns. This makes this method less feasible for clinical follow-up and prone to errors. Visual inspection of the motion of the aorta in these US images showed complex distension patterns in some patients, possibly caused by reflections of the pressure wave on the aortic bifurcation or the aorta pushing against surrounding tissues. Errors in temporal registration are expected to affect the accuracy of the compounded displacements, but to have minimal effect on the contrast in the fused images, as the displacements are small. ECG-gated ultrasound imaging could have helped the temporal registration.
The current setup was created for research purposes and not for clinical application, for which the current setup is too bulky and time-consuming to set up. An ideal option would be free hand ultrasound imaging which can be used to image multiple angles and also larger regions, which requires image registration techniques.23,34 New developments in ultrasound transducers shaped like patches could be a solution. 35 Combination of images from more than three angles is expected to further improve the image contrast, as performed on X-plane ultrasound images by Petterson et al., 18 but this also increases the image acquisition time when using consecutive measurements.
Further future developments for MP 3D US imaging of the aorta could focus on reducing tracking errors for improving the displacements and strains. With other (non-clinical) ultrasound techniques, speed-of-sound artifacts could be taken into account when images are registered, 36 and raw frequency data could be used instead of DICOM images, which has been shown to increase the tracking accuracy. 37 Future improvements using clinical DICOM images could include using multiple cardiac cycles for averaging out errors, 38 strain regularization techniques, 39 or discarding all displacements except for the radial direction, thereby reducing the drift error to only the radial direction.15,40 Another option could be the employment of deep learning techniques to determine tissue motion.41,42
Conclusion
This study has shown the feasibility of in vivo multi-perspective 3D + t US imaging of abdominal aortic aneurysms to improve the image contrast, decrease the tracking error, and increase the homogeneity of displacement pattern obtained with speckle tracking. For validation and further improvement of the strain patterns, future research is needed. This is a step toward clinical monitoring of the full 3D geometry and motion of AAAs, ultimately for more patient-specific mechanical characterization of AAA wall and monitoring of growth and remodeling.
Footnotes
Acknowledgements
We would like to thank Ivo Jutte and Judith Fonken for their help with the ultrasound acquisitions.
Data Availability Statement
The data used in this study will not be shared due to privacy reasons of the participants.
Declaration of Conflicting Interests
The author(s) declared no potential conflicts of interest with respect to the research, authorship, and/or publication of this article.
Funding
The author(s) disclosed receipt of the following financial support for the research, authorship, and/or publication of this article: Financial support for this work comes from the European Research Council (ERC-2017-STG - MUSE – 757958).
Ethical Approval Statement
This study was approved by the ethical committee of the Catharina hospital in Eindhoven, which was regarded as no clinical trial. All participants gave written informed consent.