
Abstract
Efficient Neural Architecture Search (ENAS) is a recent development in searching for optimal cell structures for Convolutional Neural Network (CNN) design. It has been successfully used in various applications including ultrasound image classification for breast lesions. However, the existing ENAS approach only optimizes cell structures rather than the whole CNN architecture nor its trainable hyperparameters. This paper presents a novel framework for automatic design of CNN architectures by combining strengths of ENAS and Bayesian Optimization in two-folds. Firstly, we use ENAS to search for optimal normal and reduction cells. Secondly, with the optimal cells and a suitable hyperparameter search space, we adopt Bayesian Optimization to find the optimal depth of the network and optimal configuration of the trainable hyperparameters. To test the validity of the proposed framework, a dataset of 1522 breast lesion ultrasound images is used for the searching and modeling. We then evaluate the robustness of the proposed approach by testing the optimized CNN model on three external datasets consisting of 727 benign and 506 malignant lesion images. We further compare the CNN model with the default ENAS-based CNN model, and then with CNN models based on the state-of-the-art architectures. The results (error rate of no more than 20.6% on internal tests and 17.3% on average of external tests) show that the proposed framework generates robust and light CNN models.
Keywords
Introduction
Breast cancer is one of the most common cancer types. 1 It is the second deadliest cancer for woman. 2 Previous studies show that early detection of breast cancers followed by appropriate treatment is responsible for 38% reduction in mortality rate from 1989 to 2018. 1 Ultrasound (US) imaging has the benefits of being safe and less costly than other imaging modalities such as Magnetic Resonance Imaging (MRI), and hence widely used in breast cancer diagnosis. The clinical needs as well as technological advances in deep learning have motivated us to develop a new automated recognition approach for classifying breast lesions into benign or malignant types.
In recent years, Computer-Aided Diagnosis (CAD) systems have been applied to medical image analysis including classifying ultrasound images of breast lesions. 3 At the same time, deep learning Convolutional Neural Network (CNN) has shown great success in natural image classification. Many existing CNN architectures such as VGGNet 4 and GoogLeNet 5 were designed. Because of model complexity and shortage of annotated medical images, most existing research focuses on customizing the existing CNN architectures to the medical images via transfer learning. 3 However, such customized CNN models are still inherently large and complex with an increased risk of model overfitting. Attempts have also been made to design CNN architectures specifically for breast lesion classification from US images. An architecture (CNN3) of three convolutional layers followed by Batch normalization, Relu and MaxPooling was proposed. 6 Another architecture (CNN4) of four convolutional layers with filters of different sizes and numbers was also reported. 7 More recently, the Fus2Net 8 architecture consists of three convolutional layers followed by two consecutive modules each of which consists of several convolutional layers using filters of different sizes. Despite all the efforts already made in building and customizing CNN architectures for breast lesion image classification via manual designs of the layers and hyperparameters, the need for accurate, robust, and light CNN models remains constant.
CNN architecture design involves setting many hyperparameters. Manually obtaining the optimal settings for them is challenging and time-consuming. 9 Therefore, the interest in automatic search for optimal CNN architectures is increasing. Several approaches, such as Generic Algorithms (GA), Reinforcement Learning (RL) and Bayesian Optimization (BO), have been developed. 10 Neural architecture search (NAS) is a RL-based framework, 9 but it is computationally expensive because the number of architectural options to explore grows exponentially. Efficient Neural Architecture Search (ENAS) overcomes this limitation through weight sharing during the search phase. 11 In ENAS, a single CNN network known as Supernet with all operations within a search space is trained, and the generated CNNs share trained weights of the Supernet. Two types of search space can be used by the RNN controller within the ENAS framework: the macro space where the controller searches for an entire network or the micro space where the controller generates cells containing operations and connections between them. Evidence shows that the micro search space is more efficient. 11
Automatic search of CNN architectures has been attempted for medical images recently. A hybrid NAS framework for classifying and segmenting thyroid cancer from ultrasound images was proposed in Qian et al. 12 ENAS with micro search space was adopted for breast lesion classification from US images. 13 The generalization gap of ENAS models was further investigated. 14 Nevertheless, the ENAS approach has its own limitations. First, the number of blocks of cells is still determined manually through trials. Secondly, trainable hyperparameters critical for designing effective and efficient CNN architectures are manually set by trials.
This paper addresses these limitations by adopting Bayesian Optimization for optimizing the number of blocks of ENAS cells and trainable hyperparameters. Bayesian Optimization, as an efficient method for optimizing noisy and expensive functions, provides a better approach than other optimizers to model uncertainty and allow exploration and exploitation to be automatically balanced during the search. 10 The paper therefore proposes a novel automatic “end-to-end” CNN design framework by combining ENAS cells with Bayesian Optimization search. To evaluate this framework, the optimized classification model is tested on images captured by US machines of different makes and from different medical centers in different countries. A further comparison is made between our model and state-of-the-art models based on hand-crafted architectures.
Materials and Methods
Data Collection and Preparation
In this study, five datasets of US images of breast lesions were used. Four were collected by our sponsor from three hospitals in Shanghai China including Pudong New Area People’s Hospital, No.6 Hospital and No.10 Hospital after ethical approvals by the hospitals. The ground-truth for each image (benignity or malignancy) is based on pathology reports. Experienced radiologists from the hospitals manually cropped the region of interest (RoI) for each US image in every dataset. A RoI bounding box image was generated and used as the input image. The fifth is a public domain dataset (BUSI) collected from a hospital in Egypt with associated class labels and cropped lesion areas. 15 All images were captured using US machines of different makes (Siemens, Toshiba, GE, Philips and LOGIQ E9). This research was granted ethics approval by the Research and Ethics Committees of University of Buckingham. The datasets are split into two collections:
(1) Modeling Dataset: Two of the four datasets from two of the three hospitals in China respectively containing 1102 images (726 benign and 376 malignant) and 420 images (278 benign and 142 malignant) were merged into a dataset of 1522 images. This set is used for developing ENAS-B.
(2) External Test Sets: The BUSI dataset (External A) consists of 565 images (355 benign and 210 malignant). The other two datasets (External B and External C) from two of the three hospitals in China respectively consist of 500 images (300 benign and 200 malignant) and 168 images (72 benign and 96 malignant). The three datasets were separately used for testing purposes. Figure 1 shows some examples of US images from the datasets.
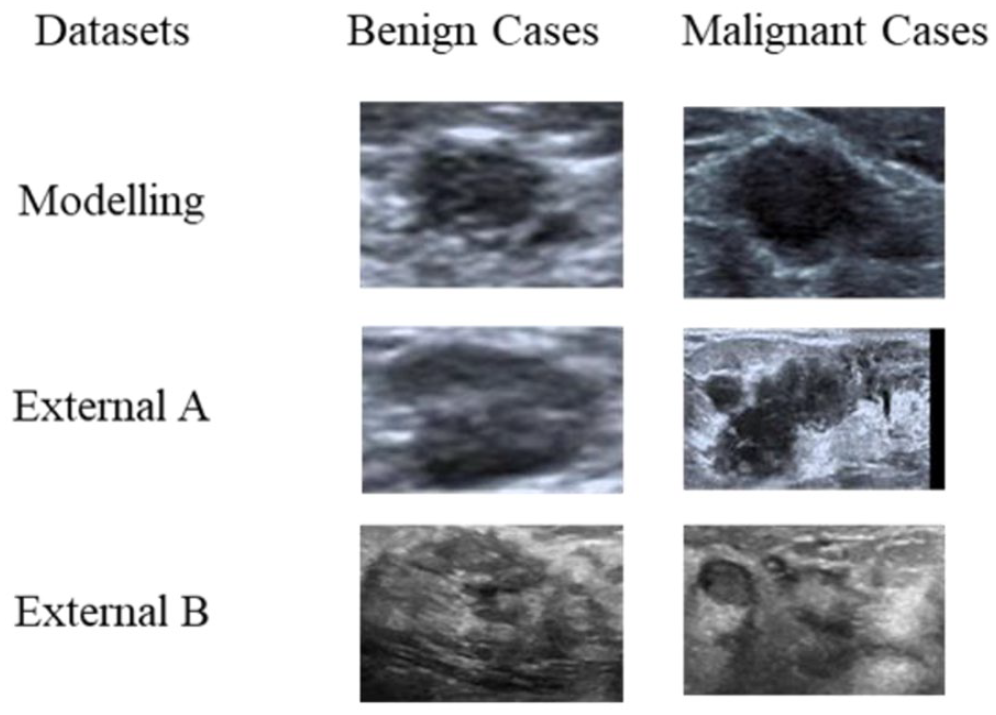
Samples of RoI images for modeling and external test sets.
A new dataset of ultrasound images of breast lesions just became available. 16 It consists of 109 images of benign and 123 images of malignant lesions all of which have been confirmed by histopathologic results including fine needle aspiration, core needle, or open biopsies. After removing the images with artifacts, 207 images (95 benign and 112 malignant) were used as another external test set (External D).
Bayesian Optimization for ENAS-Based Architecture Design
The proposed framework is shown in Figure 2. It consists of three main phases. Phase I is a general preparation of US images including RoI (i.e., the lesion region) cropping, image resizing, and increasing the number of training examples. Phase II is intended to obtain an optimized backbone deep CNN (DCNN) architecture and a set of optimized trainable hyperparameters. Phase III finally uses the optimized architecture and hyperparameters to train a classification model.
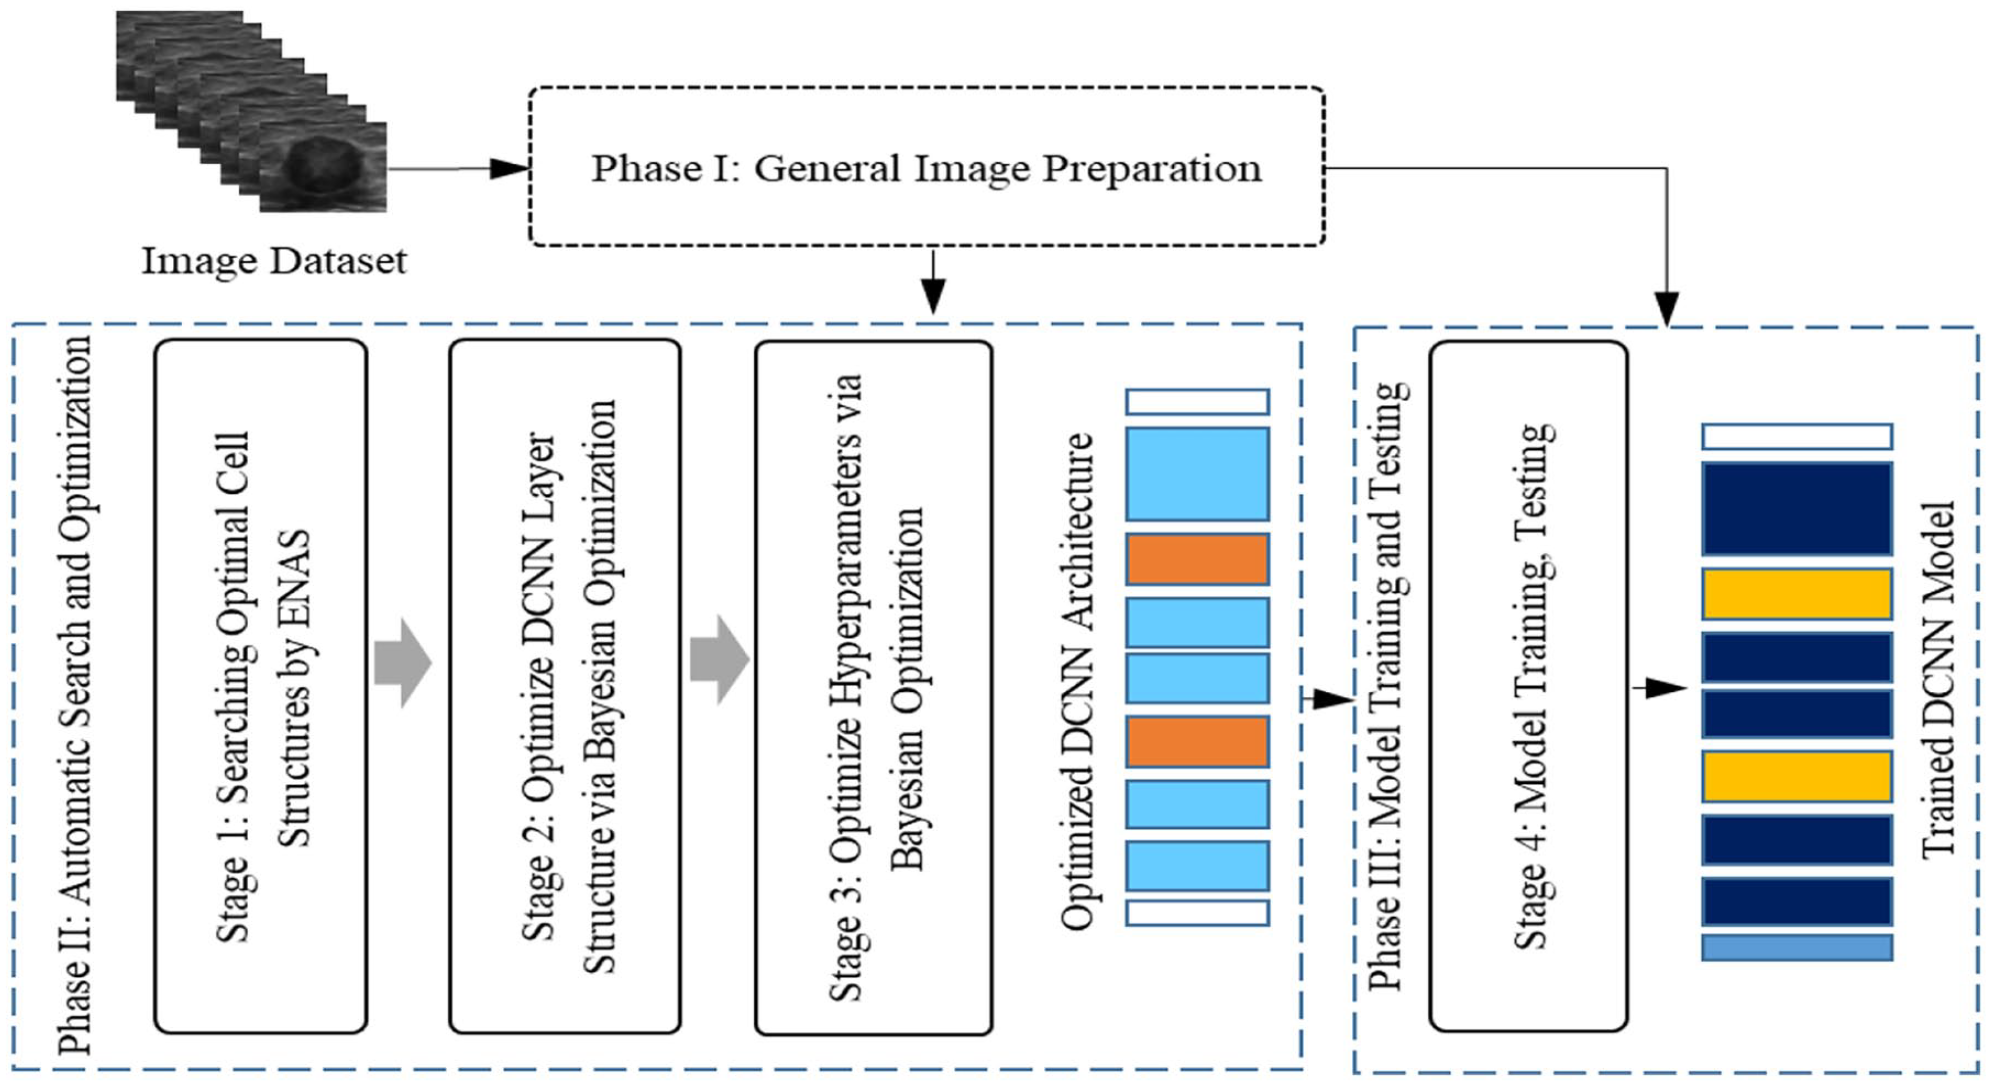
The proposed framework for automatic CNN model designs for breast lesion classification from US images.
Image preparation
The RoI image of lesion was cropped from the whole US image for accurate recognition. A free-hand cropping tool reported in Zhu et al. 17 was used by the radiologists to identify, collect and store the coordinates of the pixel points on the border of a lesion. A rectangular bounding box was then generated for each lesion by fitting the border points into a minimum area rectangle. The tumor microenvironment (TME) is the cellular environment in which a tumor exists, and it includes various components such as immune cells, blood vessels, fibroblasts, and extracellular matrix. 18 The TME plays a crucial role in cancer progression and can have a significant impact on disease management and diagnosis. 19 Therefore, the accurate assessment of the tumor microenvironment TME within breast cancer plays a pivotal role in disease management when utilizing ultrasound images. Selecting RoI is a crucial factor in the development of machine learning models for breast cancer classification from ultrasound images. 20 Furthermore, integrating information about the TME into these models by RoI margin enhances model performance. 21
Based on the work in Zhu et al., 17 and Hassan et al., 22 margin of 8% of the lesion width and height was then added for the final cropped RoI image. To satisfy the training requirements of our proposed framework, the cropped RoI images were resized to 100 × 100 pixels.
Searching and training a complex DCNN also requires large datasets. One way to meet the requirement is to enlarge the training set through data augmentation. Two augmentation methods reported in Zhu et al. 17 were adopted. The geometric methods use both image mirroring and rotation (90, 180 and 270 degrees), and the singular value decomposition (SVD) method respectively takes 45%, 35%, and 25% ratios of the selected top singular values. The methods generated seven additional images from one RoI image.
Automatic search and optimization
Phase II of our framework consists of three stages as shown in Figure 2. At Stage 1, the ENAS method is used to search for the optimal internal structures of normal and reduction cells. At Stage 2, the optimized cells are stacked in a process controlled by the Bayesian Optimization algorithm, creating a sequential layer structure of the cells for the whole network. At Stage 3, Bayesian Optimization is again employed to optimize trainable hyperparameters within the optimized network structure, creating the final optimized DCNN architecture for modeling.
A. Optimal cells search using ENAS
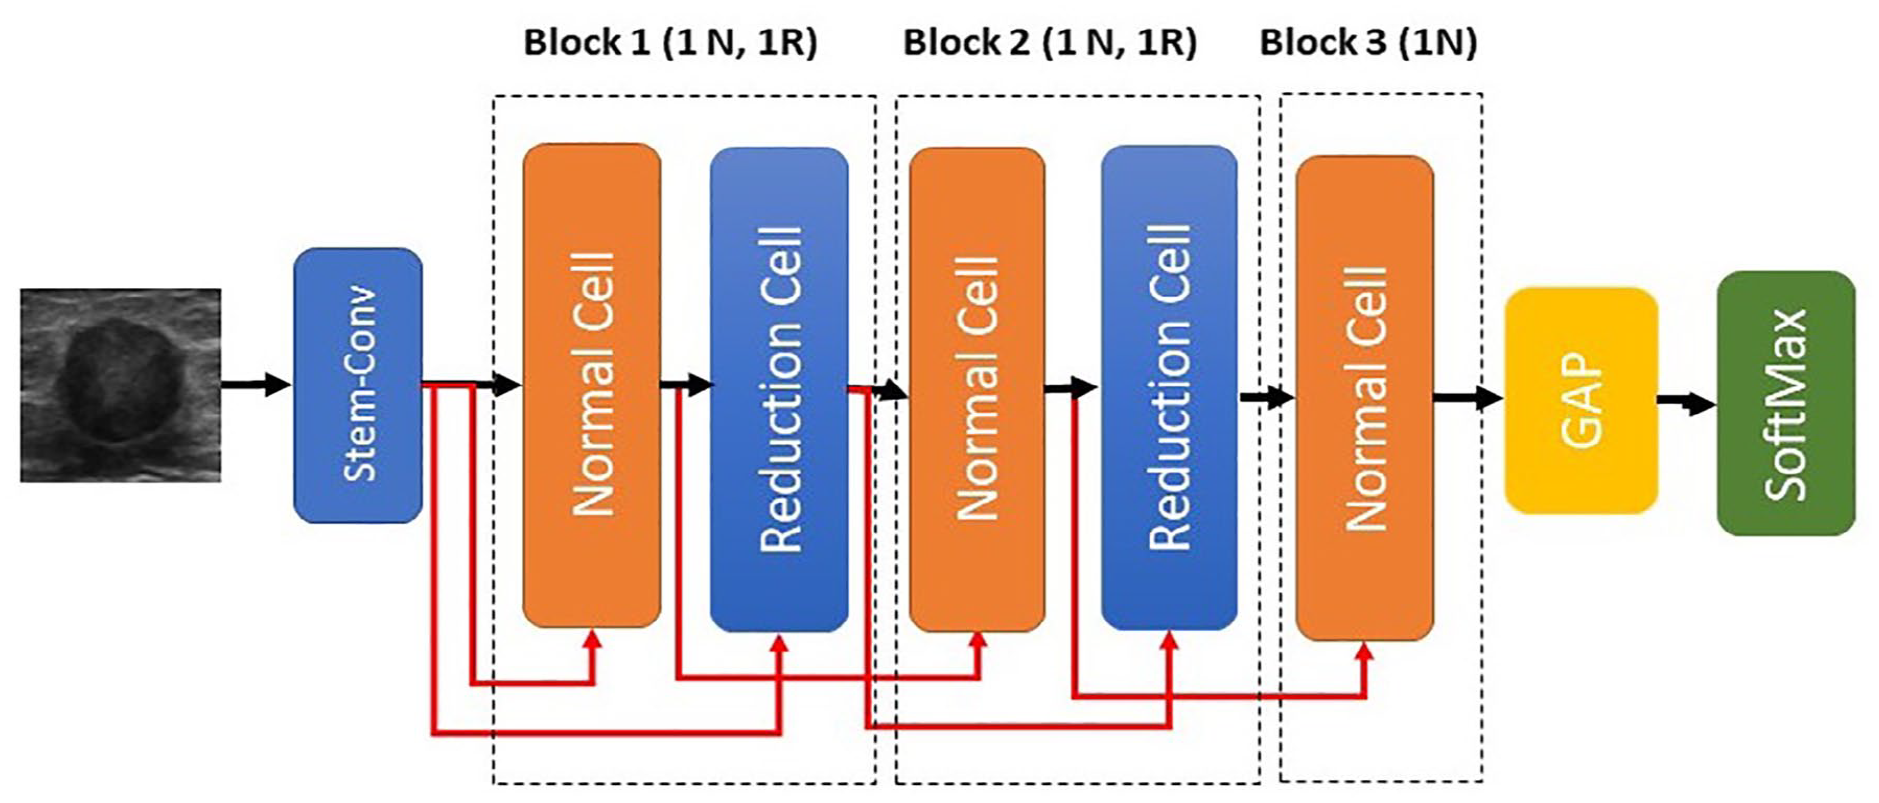
The ENAS micro approach consists of two stages. 11 The first stage searches for an optimal pair of Normal (N) and Reduction (R) cells in a pre-defined architecture (i.e., Supernet) based on validation accuracy. The Supernet consists of a 3 × 3 standard convolution layer named stem conv and seven cells (1N, 1R, 1N, 1R, 3N). The default search operations of ENAS 11 were provided to the ENAS controller. We set the mini batch size to 8 and all other hyperparameters as ENAS default. 10 The RNN controller is trained for 150 epochs and each epoch generated 10 pairs of N and R cells. In the searching stage, the Modeling Dataset (see Section on Data Collection and Preparation) was used under a single split policy (see Section on Results). Figure 3 shows the searched optimal cell structures from ENAS based on the modeling dataset.
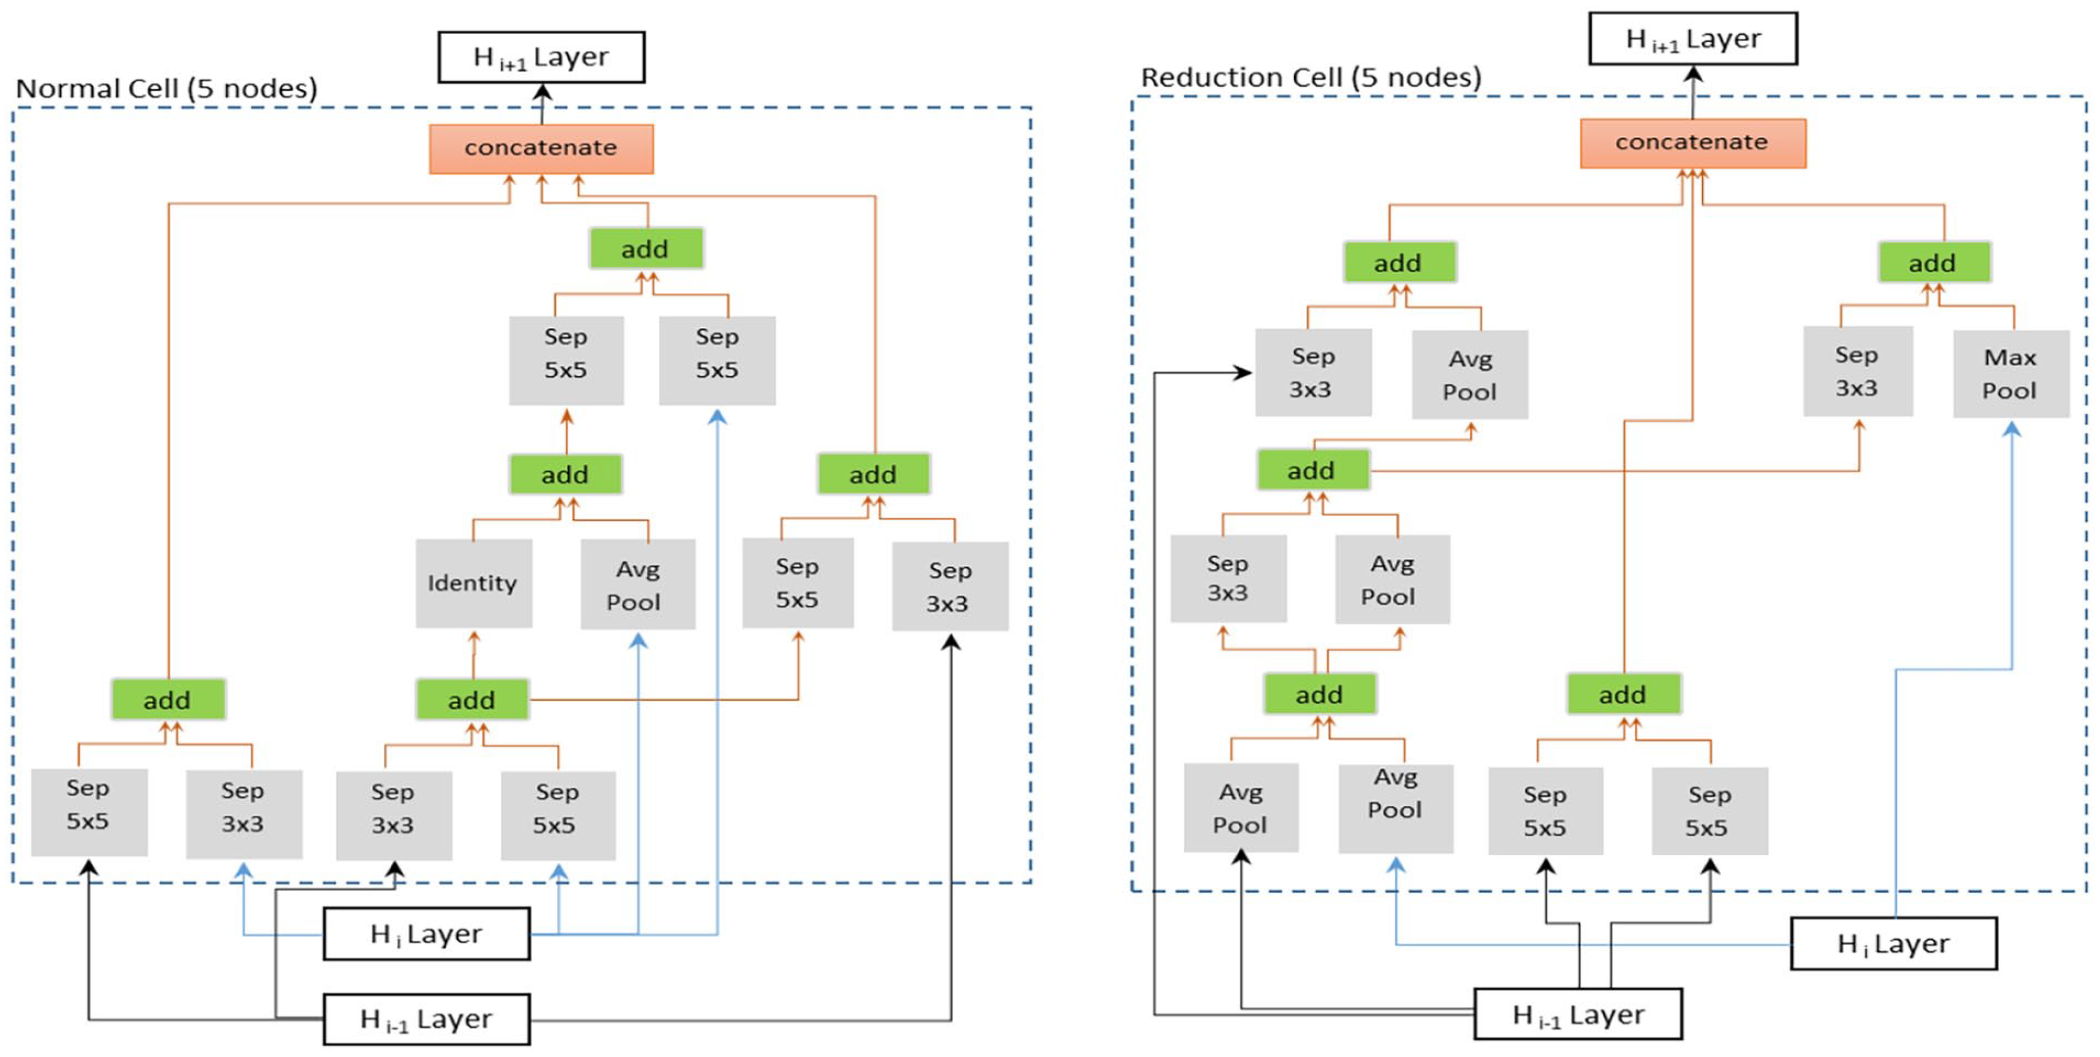
Example of optimal cell structure (Normal and Reduction cells) generated from our data set.
B. ENAS-B
The proposed ENAS-B search involves three key elements: a backbone architecture, a search space and a search strategy. First, we define a CNN backbone architecture with optimisable structural hyperparameters and their search spaces. Second, we perform automatic architecture search (the first optimization stage) using Bayesian optimization to identify the optimal number of normal cells (or the depth of the architecture) that results in a new architecture called ENAS-B-1. Finally, we use ENAS-B-1 as a backbone architecture, define optimisable training hyperparameters and their search space, and perform automatic architecture search using Bayesian optimization to optimize training hyperparameters. This second optimization stage results in ENAS-B. It is worth noting that the first and the second stages use the same Bayesian optimization algorithm but with different inputs.
Backbone Architecture. We define the backbone architecture (
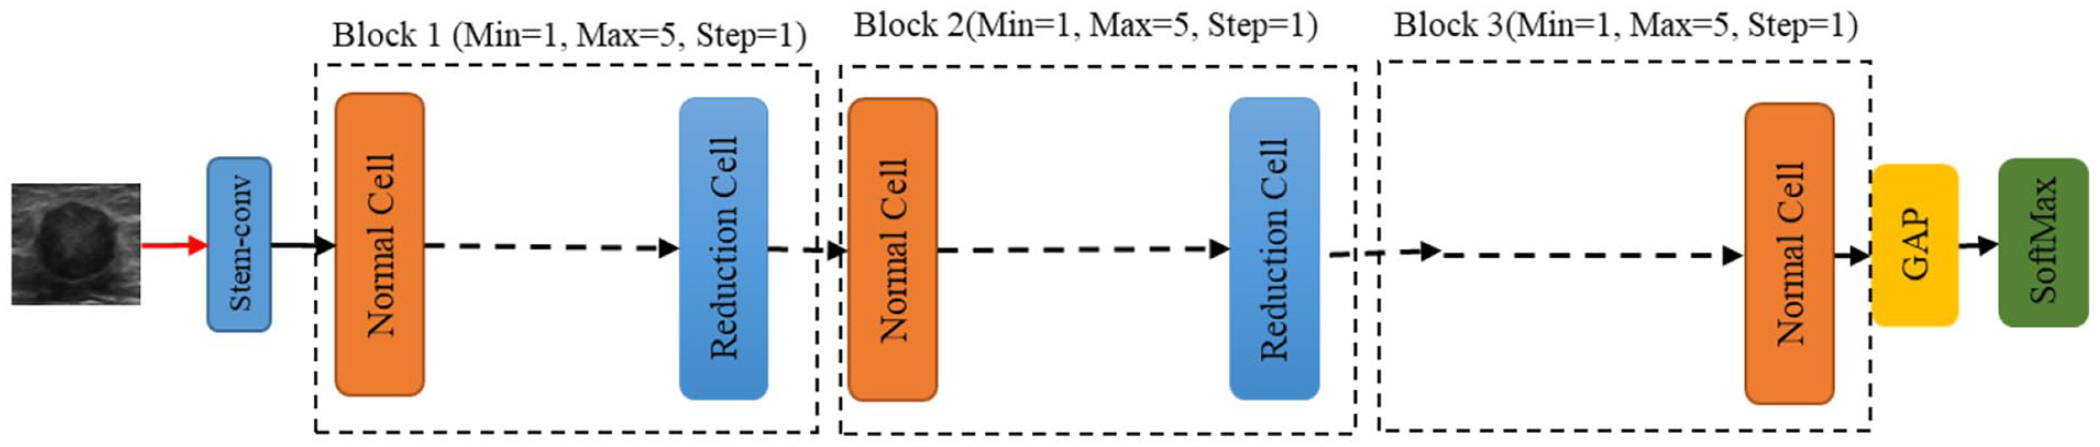
Backbone architecture (BA) for Bayesian optimization search.
Structural Hyperparameter Search Space. The structural search by Bayesian Optimization aims at utilizing the optimized normal and reduction cells within the backbone architecture (
Trainable Hyperparameters Search Space. A suitable search space of trainable hyperparameters is needed as the input for Bayesian optimizer to build the optimal CNN architecture. In this paper, the search space
Search Strategy: The Bayesian Optimization is conducted in two sequential stages. Given
where
Fixed backbone architecture (ENAS-B-1) for trainable hyperparameters search stage.
In the second stage of the optimization, given the architecture of ENAS-B-1 as the backbone and our definition of the trainable search space, the Bayesian Optimizer algorithm searches for the optimal trainable hyperparameter setting. In particular, the same steps 1 to 6 are used, but
An interesting alternative of the two-stage search as described earlier is a combined search strategy where optimal combinations of the number of normal cells and the trainable hyperparameters are searched using the Bayesian Optimizer. We further explore this alternative search strategy and compare the searched architecture with ENAS-B. Further details of the architecture obtained will be shown in The Results section.
Experiment Setups
Experiments have been conducted to find the optimal CNN architectures and evaluate the classification performance of ENAS-B models. All experiments were run on a workstation with Intel Xeon(R) W-2102 CPU@2.90GHz with 16.0 GB RAM. The Modeling Dataset (See Data Collection and Preparation) was used for searching for the optimal cells in ENAS, searching for the optimal number of normal cells and trainable hyperparameters using Bayesian Optimization, and finally training the ENAS-B model from scratch. A 5-fold stratified cross validation protocol was followed. At each iteration, the modeling data was split into 20% for testing (Internal test) and 80% for training. The training part was further split into 10% for validation and 90% for training. One split out of the five was used for the optimization (See Automatic Search and Optimization section). To determine the classification error rates, all 5-fold were used. The imbalance ratio between benignity and malignancy (1.92:1) was upheld in the modeling and searching stages based on the findings in Ahmed et al. 14 All images were pre-processed, and the training set enlarged using the pre-processing and data augmentation methods as described in the Section on Data Collection and Preparation.
For the optimized architecture using the combined search strategy (ENAS-B Combined), the number of trial network models is set to 40. Each model is trained on the imbalanced dataset for 50 epochs with batch size 8. The final optimal architecture has the block configuration of (5N, 1R, 1N, 1R, 4N) with Learning Rate = 0.0001; Optimization function = Adam; Loss function = BCE; Weight initialization = He Normal; Dropout rate = 0; Normalization Layer = Batch Normalization; and L2 Regularization = 0.00042.
Model performance is measured by Sensitivity, Specificity, Accuracy and F1-score. Sensitivity refers to the proportion of known malignant test examples being classified as malignant, whereas Specificity refers to the proportion of known benign test examples being classified as benign. Accuracy refers to the proportion of correctly predicted test examples out of the total, and F1-score is the harmonic mean of Accuracy and Sensitivity.
Results
Breast Lesion Classification
The optimized ENAS-B is then trained from scratch on the unbalance dataset. All the data augmentation methods as mentioned are used to expand the training set. The number of epochs for training the EBAS-B models is set to 50. Figure 6 shows losses of ENAS-B training and validation.
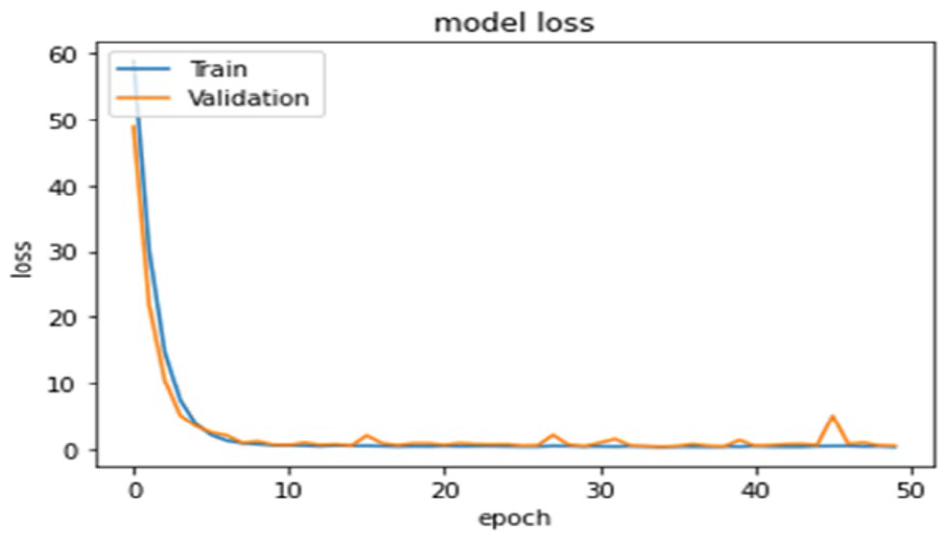
Training and Validation losses of ENAS-B model.
Comparison With State-of-Art Purposely Built CNNs
We first compared ENAS-B with three existing state-of-art networks manually designed specifically for classifying breast lesions in US images, that is, CNN3, 6 CNN4, 7 and Fus2Net. 8 Each CNN was trained and tested on the Modeling Dataset under the same cross validation protocol with the same folds as used for ENAS-B. As shown in Table 1, ENAS-B model outperforms all three network models by a large margin with higher overall accuracy of 4.5%, 18.8% and 13.3% respectively. ENAS-B also outperforms CNN3, CNN4 and Fus2Net by at least 6.6% when tested on the external sets A, B and C. With the new dataset (External D), 16 the results show that ENAS-B still achieved the highest overall accuracy of 67.4% (specificity 45.3% and sensitivity 89.5%) while CNN3, CNN4 and Fus2Net achieved overall accuracies of 61.5% (specificity 87.4% and sensitivity 35.7%), 53.7.5% (specificity 56.4% and sensitivity 50.9%), and 60.5% (specificity: 40% and sensitivity: 81.1%) respectively.
ENAS-B Performance and Comparison Against Other State-of-the-Art Breast Lesion CNNs.
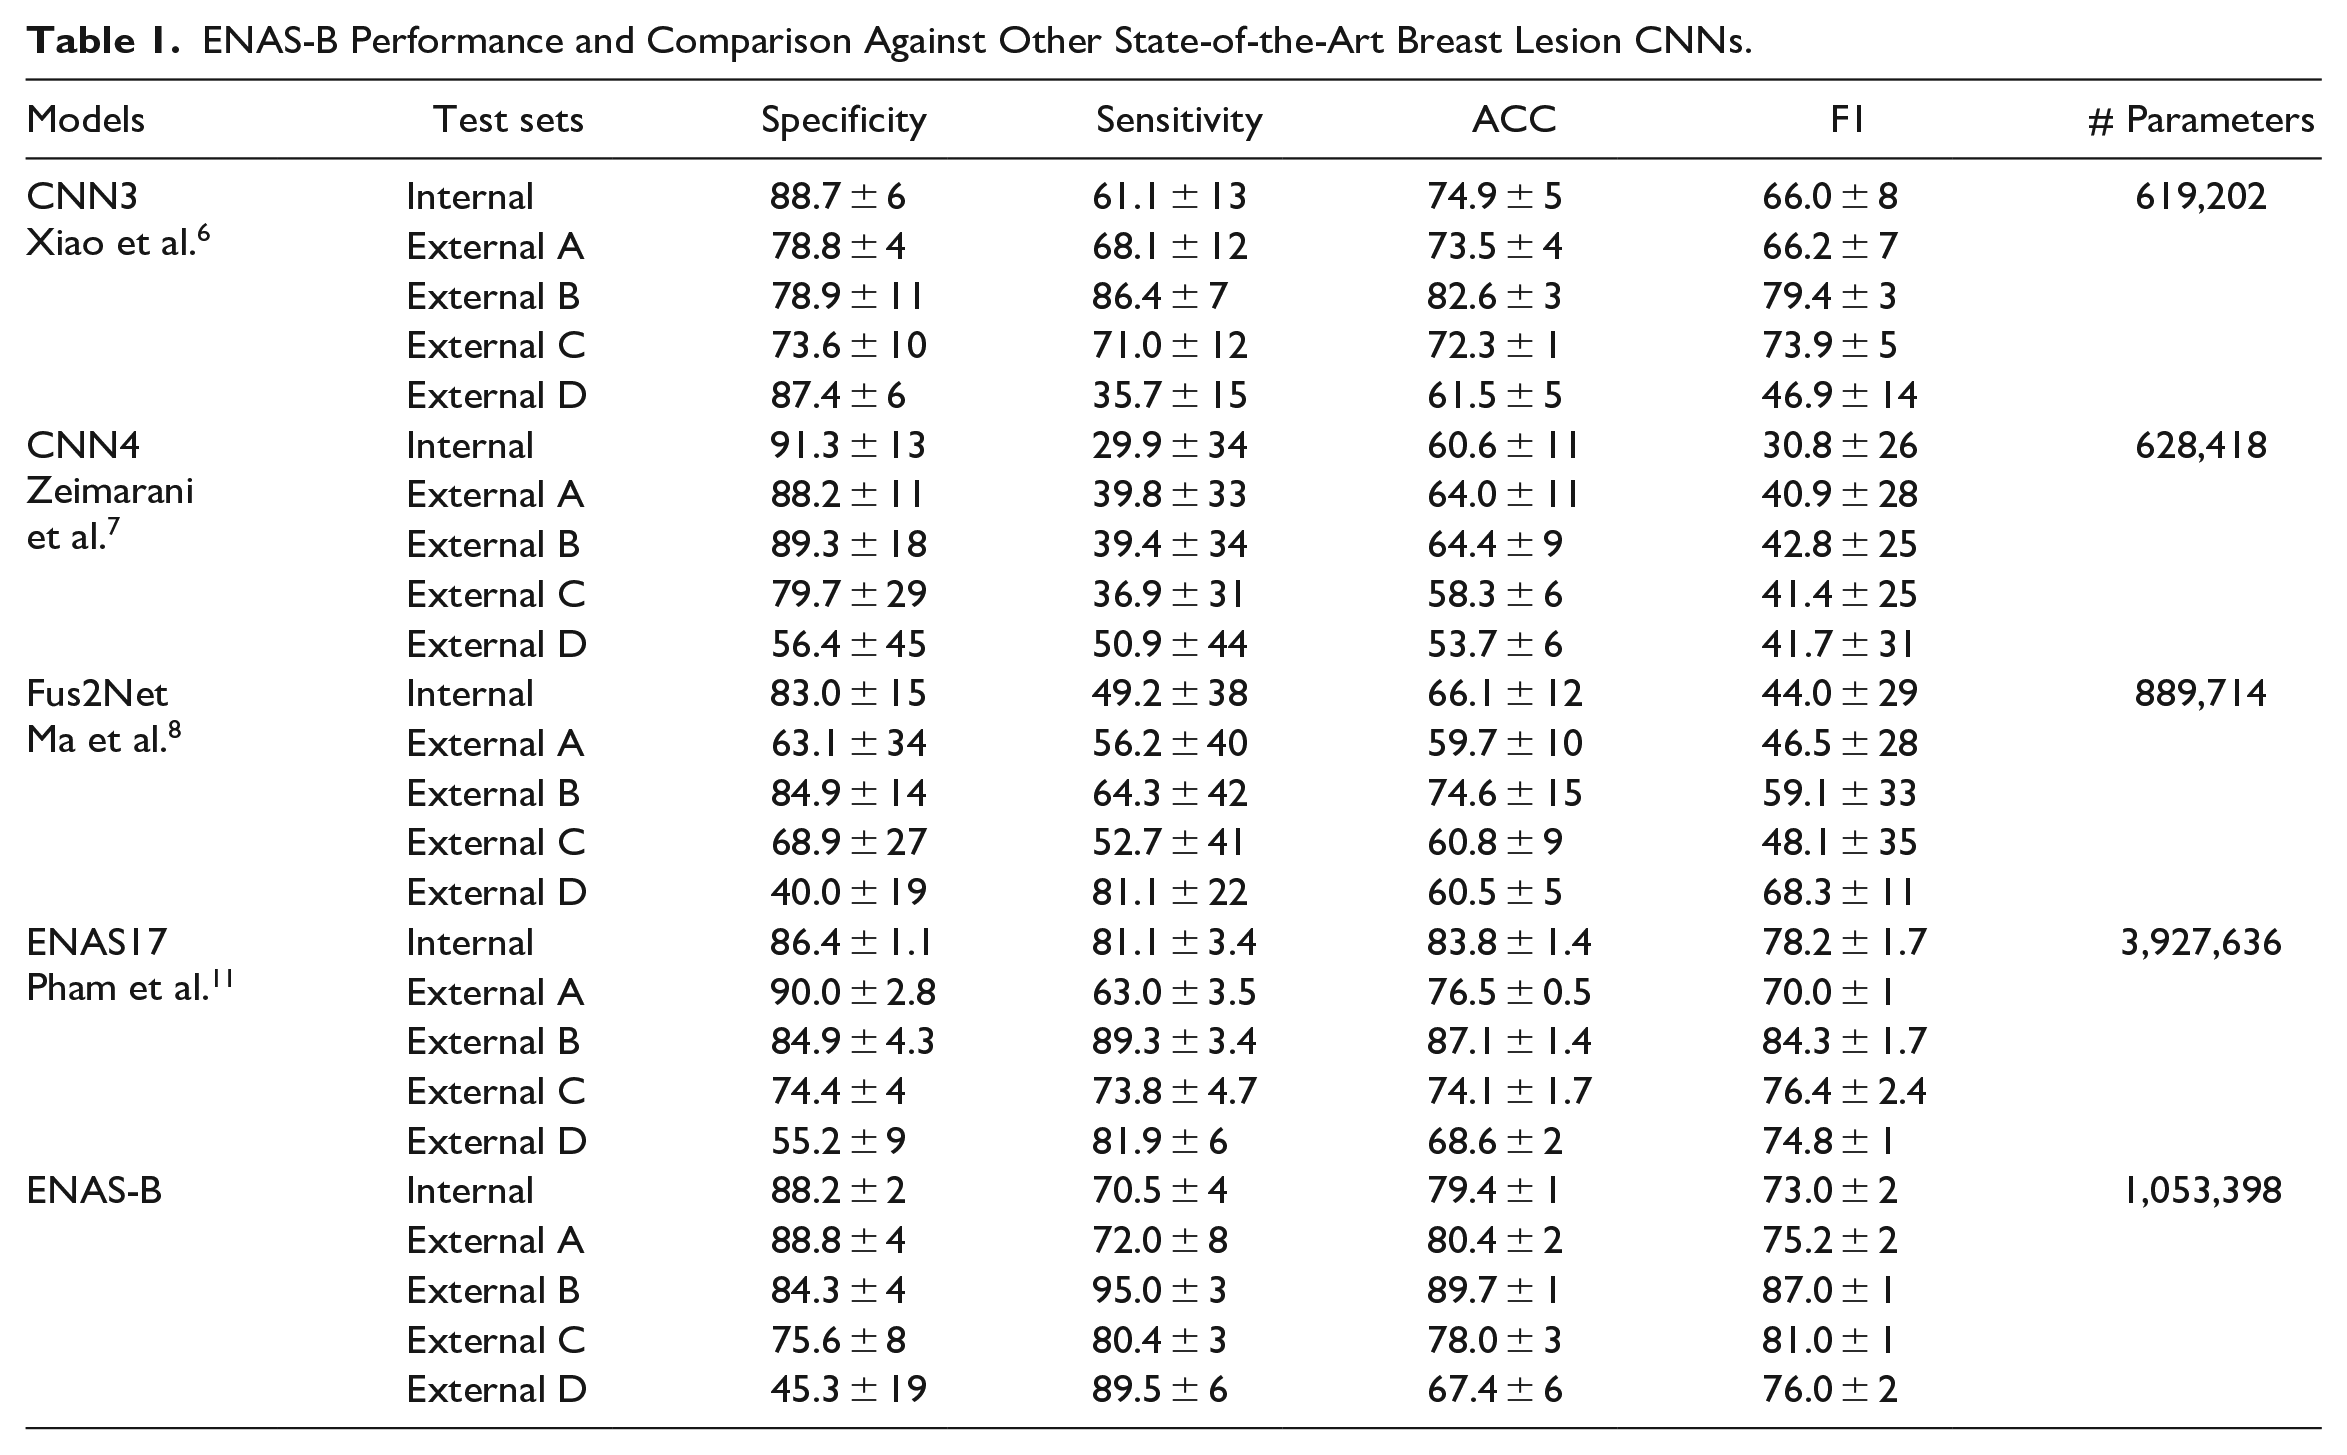
The classification performance of the ENAS-B models is presented in Table 1. With a 5-fold cross validation, ENAS-B achieved an average overall accuracy of 79.4% (88.2% specificity and 70.5% sensitivity). Further, we tested all five ENAS-B models on the four external datasets (External A, B, C, and D). ENAS-B generalizes well on the unseen data and achieved average accuracies (average of five models) of 80.4%, 89.7%, 78.0%, 67.4% on External A, B, C, and D respectively.
We then compared ENAS-B with the original ENAS. 11 Based on our earlier findings as reported in Ahmed et al., 13 we chose ENAS17 for the comparison. Using the optimal cells as shown in Figure 3, ENAS17 architecture consists of 15 Normal cells (N) and two Reduction cells (R) in a configuration of (5N, R, 5N, R, 5N) and trained on the Modeling dataset under the same 5-fold cross validation protocol. Although the ENAS17 models achieved higher accuracy in internal test, ENAS-B generalized better and achieved higher overall accuracy than ENAS17 on the external datasets except External D where ENAS17 has a marginally better overall accuracy. On the other hand, the number of weight parameters of ENAS-B is about 3.73 times fewer than that of ENAS17.
The performance of ENAS-B demonstrates the effectiveness of our approach in optimizing the number of layers and trainable hyperparameters for accurate and robust networks. To confirm whether the differences in the model accuracies on external datasets are statistically significant, a paired sample t-test upon the ENAS-B model and each of CNN3, CNN4 and Fus2net were separately conducted, and the t-statistics and p-values were calculated. The p-values for ENAS-B versus CNN3, ENAS-B versus CNN4 and ENAS-B versus Fus2Net are respectively 0.000487, 0.001484 and 0.016456, all well below the general threshold of p = .05. Therefore, the ENAS-B model significantly outperforms the other manually designed CNN models.
To further explore the predictive power of ENAS-B on external datasets, the Receiver Operating Characteristic (ROC) curves and Area Under the Curve (AUC) were calculated on the External datasets A and B because both datasets have more than 500 images collected from two different sources (see Section on Data Collection and Preparation). For calculating the ROC curve different thresholds were used between 0 and 10. Figure 7 shows the ROC curves and AUC scores of ENAS-B (0.89 on External A and 0.96 on External B). AUC score in general demonstrates how well a classifier can discriminate between classes. The AUC scores have demonstrated that the capability of ENAS-B in distinguishing malignant lesions is better than CNN3, CNN4 and Fus2Net on both External A and B respectively. Moreover, we calculated the Delong test for ENAS-B against CNN3, CNN4 and Fus2Net on both External A and B. The DeLong value of ENAS-B versus CNN3, ENAS-B versus CNN4 and ENAS-B versus Fus2Net are respectively 0.3, 2.4 and 1.2 on External A, and 2.9, 4.9, and 3.4 on External-B. The DeLong test values all greater than zero indicate that ENAS-B different from those purposely designed CNN models 23 The larger the DeLong test statistic is, the stronger the evidence supporting the difference in AUC values between the two models. Since the DeLong test statistics of ENAS-B against the other models are mostly greater than 1, it implies that the ENAS-B model has a significantly higher AUC compared to the other models. Although, the DeLong value of 0.3 for ENAS-B versus CNN3 on External-A is less than 1, the p-value for ENAS-B versus CNN3 is 0.000487. All the results indicate that ENAS-B has a significantly better performance than the other purposely designed CNN models.
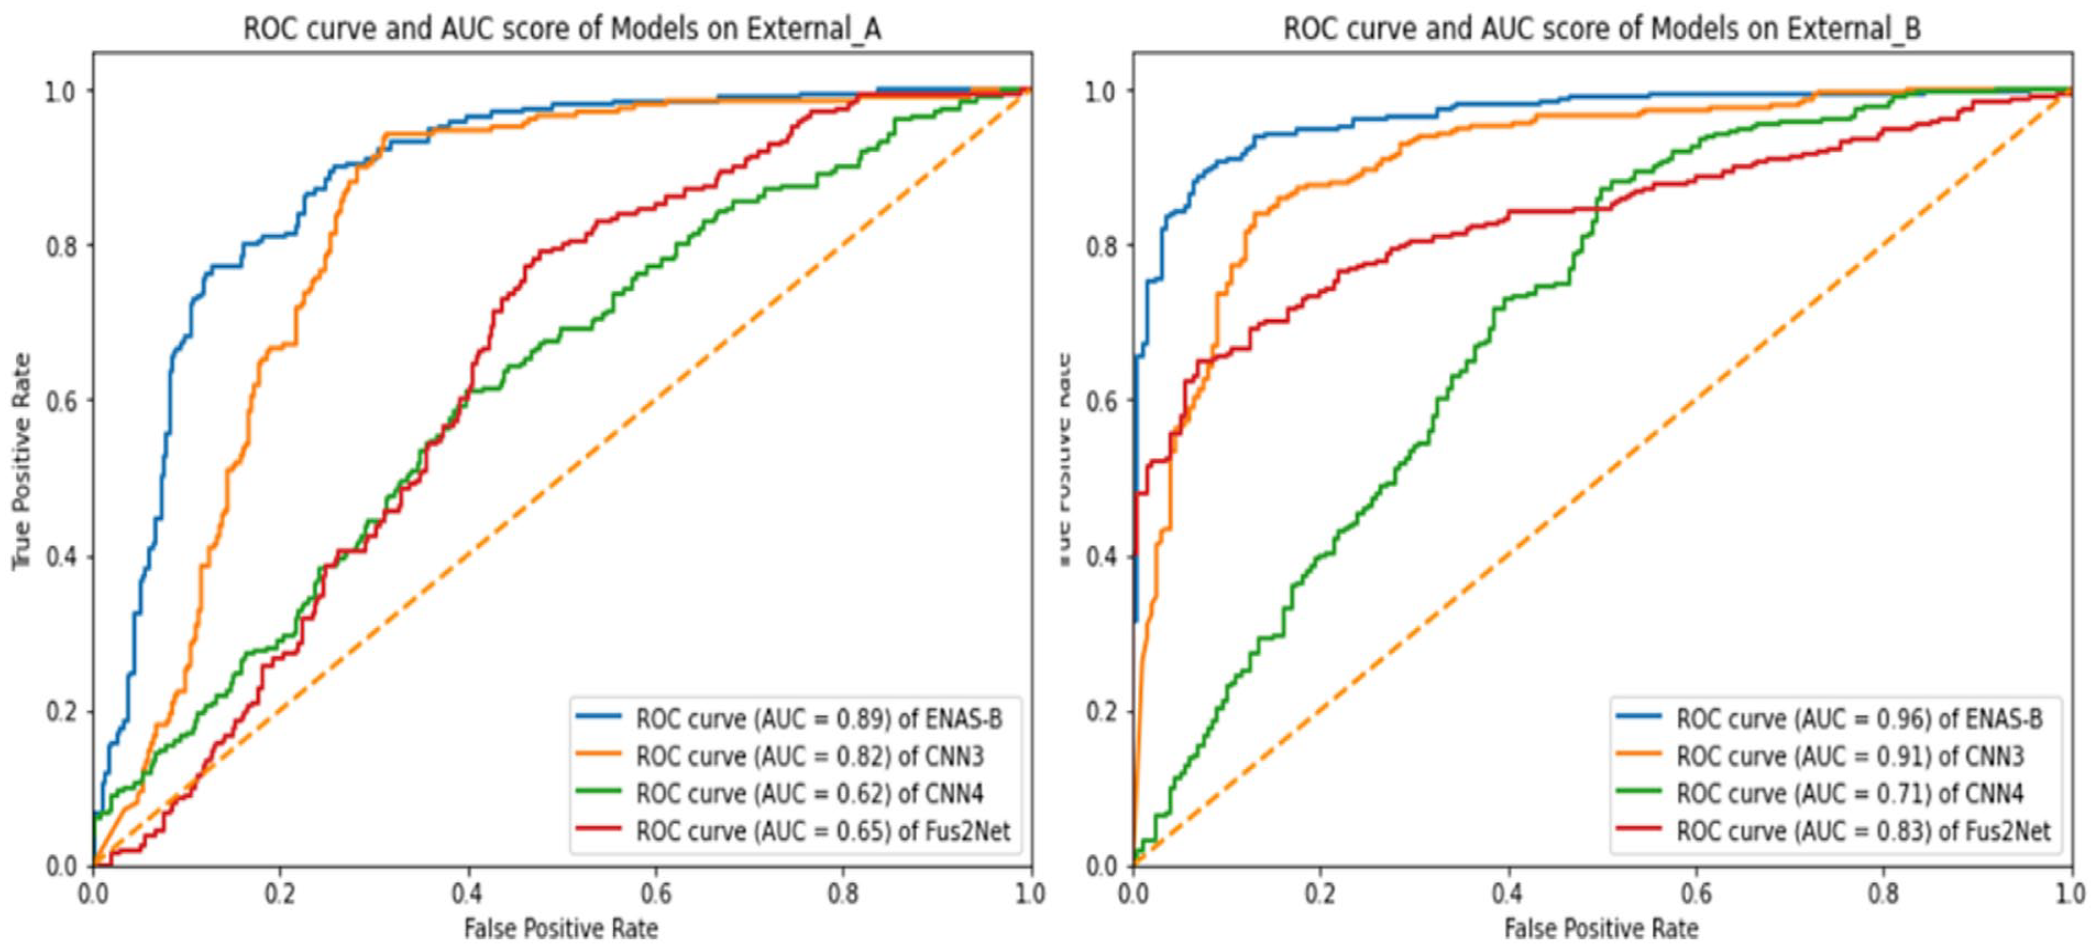
Presents ROC curve and AUC score of ENAS-B, CNN3, CNN4 and Fus2Net on External_A and External_B.
Comparison With State-of-the-Art Generic CNNs
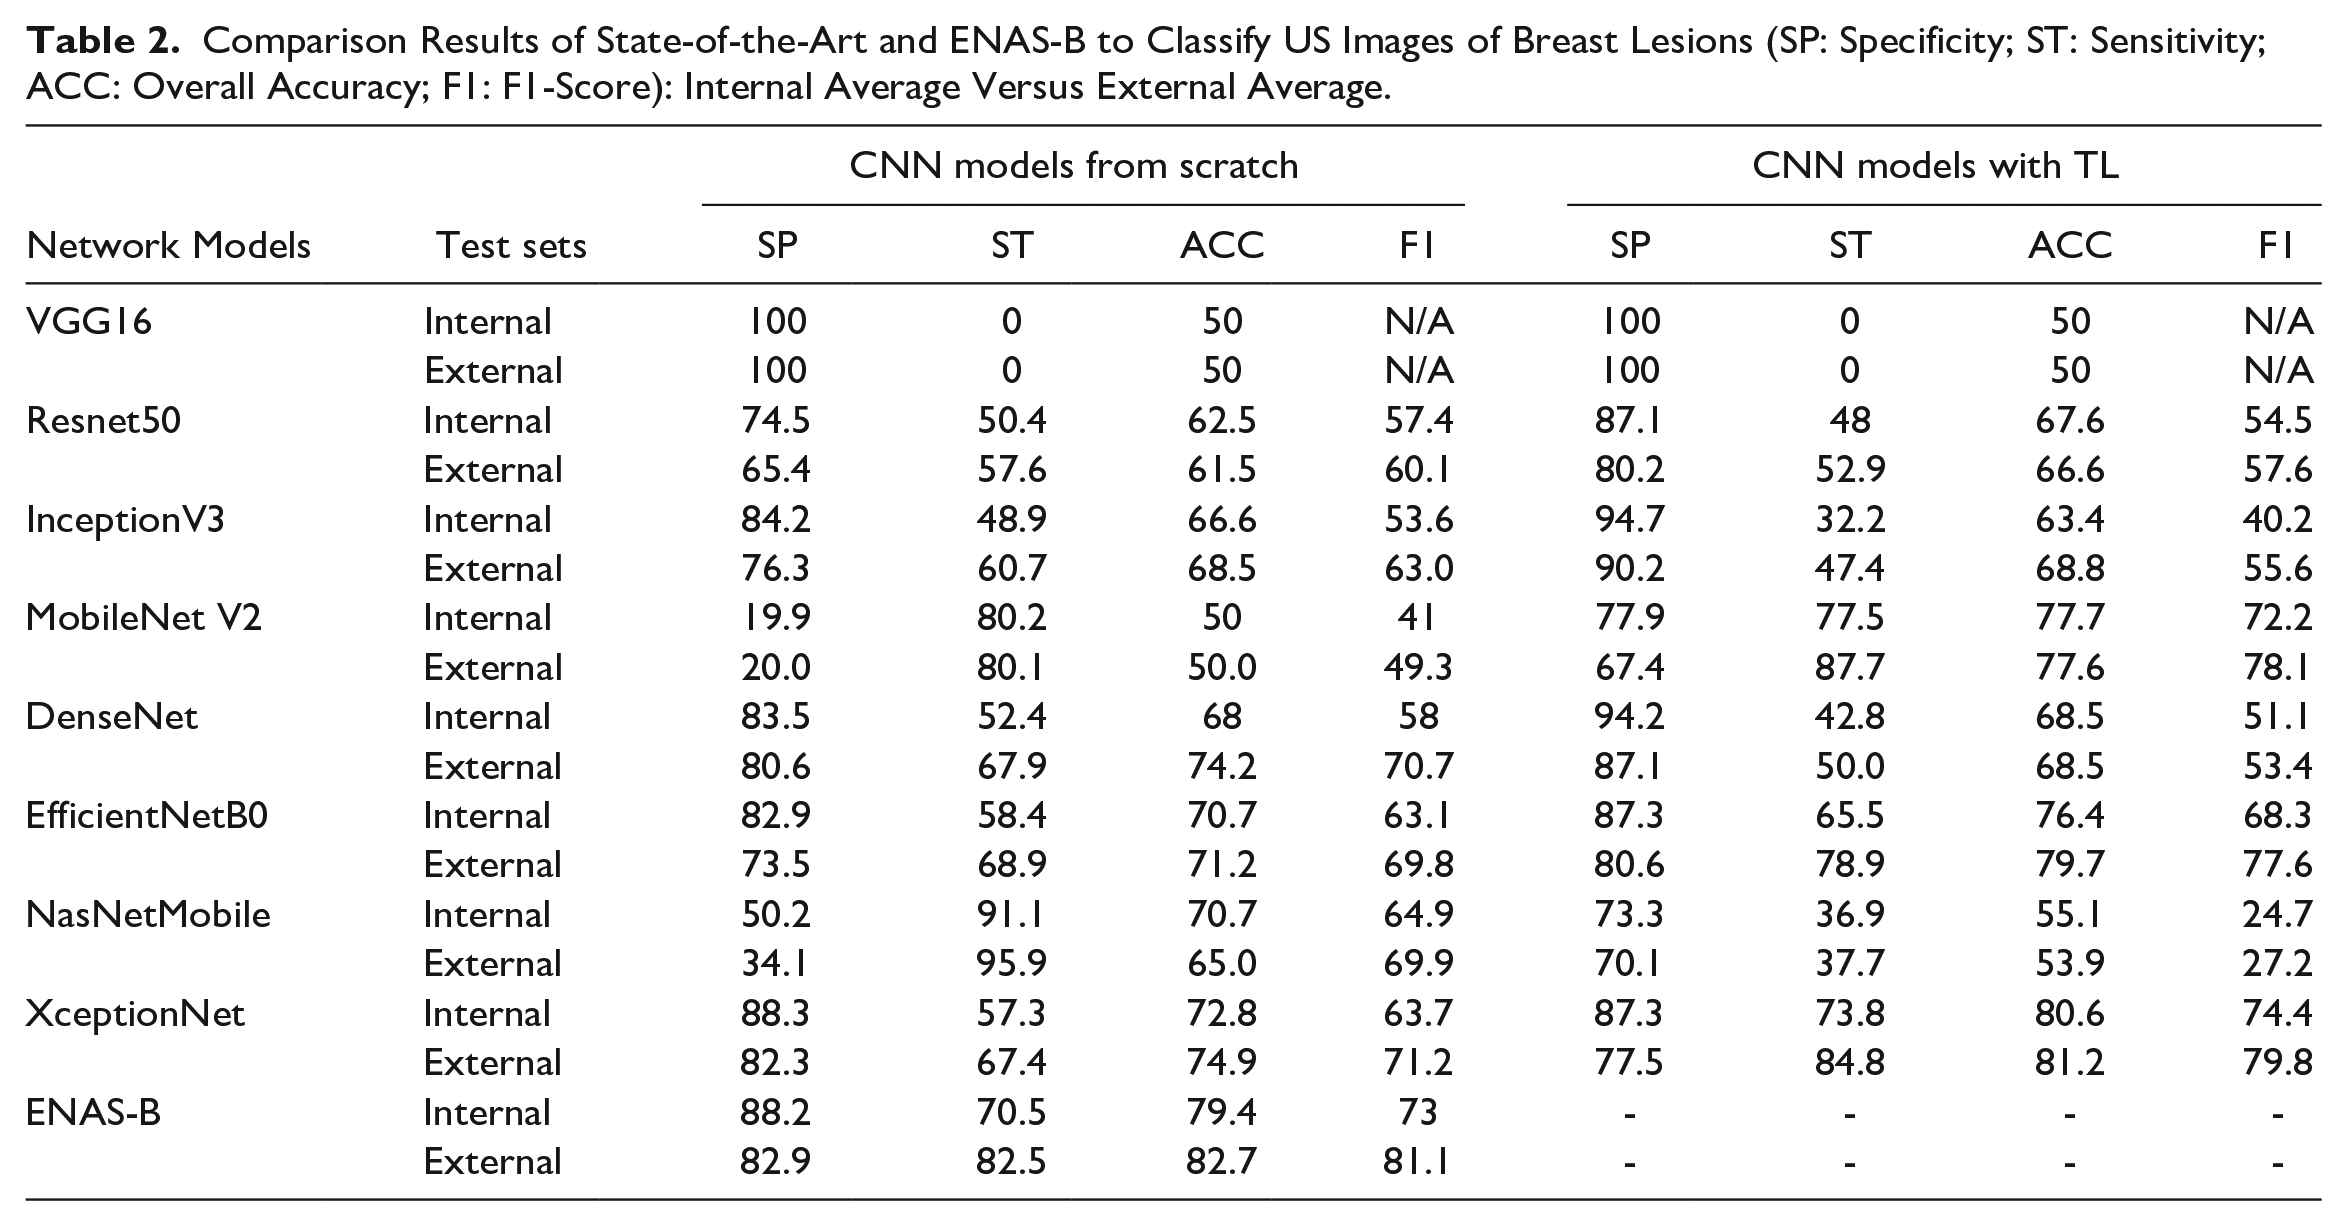
It is also interesting to know how ENAS-B models compare with known CNN architectures originally designed for ImageNet. We selected some well-known architectures (VGG16, 4 ResNet50, 24 InceptionV3, 25 MobileNet V2, 26 DenseNet, 27 EfficientNetB0, 28 NasNet Mobile 29 and XceptionNet 30 ) and then customized them for breast lesion recognition from US images. Both training the architectures from scratch and training them with transfer learning (TL) have been attempted. The number of epochs was set to 50 for the former, and 25 for the latter. The batch size was set as 16 for all the models in both situations. For fairness of the comparison, all the network models were trained on the Modeling Dataset under the same setting as for the ENAS-B models. Table 2 shows that ENAS-B achieved the highest overall accuracy on the internal tests except XceptionNet TL (with a small margin), and the highest average overall accuracy on the external tests.
Comparison Results of State-of-the-Art and ENAS-B to Classify US Images of Breast Lesions (SP: Specificity; ST: Sensitivity; ACC: Overall Accuracy; F1: F1-Score): Internal Average Versus External Average.
Comparison With ENAS-B Combined
We further compare ENAS-B with ENAS-B Combined. Figure 8 summarizes the performance of the 12-layer ENAS-B Combined models on the internal test data and three external test datasets (without External D). Although the ENAS-B Combined models still perform better than all other purposely built CNNs, the performance is worse than that of ENAS-B for both internal and external tests.
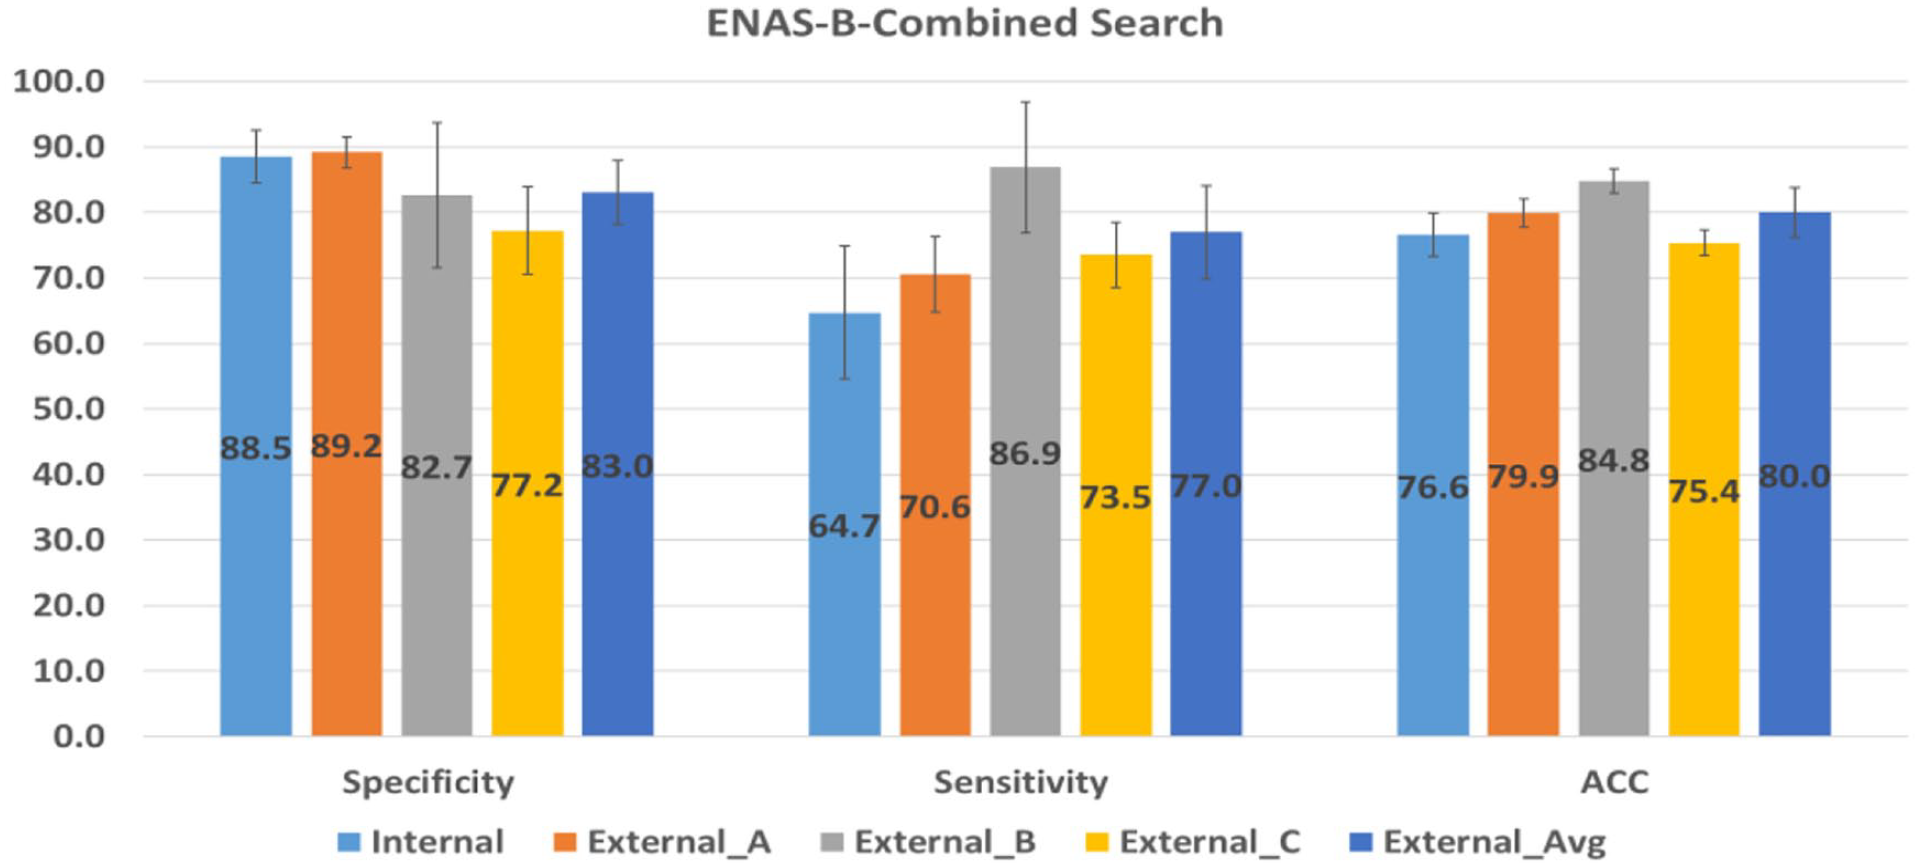
Performance of ENAS-B-Combined search on internal and external test sets.
ENAS-B for Thyroid Cancer Classification
A pilot study was conducted by searching for an optimal ENAS-B architecture using breast lesion US images, and then train an ENAS-B model for thyroid nodule classification in two different scenarios using the same data augmentation methods to enlarge the training sets under a 5-fold cross validation evaluation framework. In the first scenario, a balance dataset of 500 ultrasound images (250 Benign and 250 Malignant) was used with the result showing that the ENAS-B architecture achieved the average overall accuracy of 73.6% (specificity: 54% and sensitivity: 93.2%) in classifying thyroid nodules. In the second scenario, following our approach of using unbalance classes, the ENAS-B models were trained on an unbalanced thyroid dataset (480 Benign and 250 Malignant) with ratio (1.92:1) with the results showing that the ENAS-B models achieved the average overall accuracy of 67.9% (specificity: 67.8% and sensitivity: 68%). In both scenarios, the specificity is close to random guess whereas sensitivity has substantial lifts. However, the potentials of transfer learning aspects of ENAS-B still require further research.
Discussions
The comparisons have revealed several advantages of ENAS-B over the existing approaches. First, the ENAS-B models outperform all exiting handcrafted networks purposely built for breast lesion classification from US images (Table 1). Second, the ENAS-B models in general maintain a smaller difference between sensitivity and specificity with more balanced performance on both classes (Tables 1 and 2). Furthermore, the ENAS-B models have much smaller number of weight parameters in comparison with ENAS17 (Table 1) and other known generic architectures as reported in the literature. Although the purposely build networks tend to be slimer, they underperform on bother internal and external tests (Table 1). ENAS-B also has its own limitations. Like all automatic search methods, ENAS-B requires resources to conduct searching and then training. It is worth noting that our two-stage approach for optimization has already reduced the demand on resources comparing to the combined search. Due to resource constraint, ENAS-B purposely controls the sizes of the search space by defining a backbone architecture framework, which might influence the best optimal outcomes.
The results of the comparison between the two search strategies (two-stage vs. combined) show that the two-stage ENAS-B outperforms ENAS-B Combined by a margin of 3% on overall accuracy in the internal tests and nearly 5.5% better average sensitivity in the external tests while the average specificity remains marginally the same (Table 1 and Figure 8). Although the ENAS-B search principle is consistent with the ENAS’s two-step principle, 11 such finding is still surprising because a combined search space offers more hyperparameter combinations and hence should increase the possibility for finding the global optimum. It is possible that reaching an optimal CNN may require more iterations and hence prolong the overall time for searching.
Radiomics refers to the high-throughput analysis of quantitative image features for improving diagnostic accuracy in a clinical decision support system. 31 For the rigor of studies and clinical relevance, a radiomics quality score (RQS) system was recently introduced in this landmark article. Although our paper is not a direct clinic-based study, it is desirable to evaluate the quality aspect of our study using the RQS score. After discarding six key components irrelevant to our study (key elements 4, 6, 7 11, 14 and 15), our study scored 16 out of 23 points on the remaining 10 key components. Although we have no direct control over the image acquisition and collection due to the data collection protocol agreed with the sponsor, US images from scanners of different makes and models were purposely collected and all lesions were cropped by experienced radiologists from their medical centers (see Section on Data Collection and Preparation). Our deep learning approach follows an end-to-end workflow instead of examining each stage of image processing separately. The embedded convolutional operators optimally placed in a CNN architecture extract features at different levels of data abstraction. The ENAS reduction cells and the GAP layer are used for feature reduction. The performance of ENAS-B has been evaluated through internal and external tests, and various discrimination and calibration statistics have been used (See the Results Section). Although not all of our datasets are publicly accessible, one external test dataset (BUSI) is available from open sources. The ENAS methods for cell search are based on python codes in Pham et al. 32 and the Bayesian Optimization adapts the program codes in KerasTuner. 33 The radiomics analysis has also revealed the need for bringing our study closer to clinical practice. We therefore plan to conduct prospective tests in a clinical setting at the next phase of our investigation.
Conclusion and Future Work
This paper presented a novel framework for automatically searching CNN architectures for breast lesion classification from US images. We combined ENAS cell search with Bayesian Optimization of network layers and trainable hyperparameters. The proposed framework yields efficient, shallow and robust CNN models that outperformed the state-of-the-art CNN models developed for the same purpose. The results show that cell structures, network depth and trainable hyperparameters are all important parameters to be optimized. Another finding is the importance of the search strategy. Evidence has shown that the two-stage approach (ENAS-B) allows the Bayesian optimizer to narrow the search and provide a robust CNN model. In the future, we plan to expand the search space by including other hyperparameters such as the number of filters, RoI margin size and the connectivity between cells. In addition, we plan to automatically optimize the depth and trainable hyper-parameters of existing CNNs such as ResNets, GoogleNet and MobileNet by using their blocks as the search spaces. We will further compare the classification accuracies of the ENAS-B model with expert radiologists on datasets from different sources. Finally, we plan to evaluate the performance of ENAS-B with pre-processed images to ensure that they have consistent characteristics.
Footnotes
Declaration of Conflicting Interests
The author(s) declared no potential conflicts of interest with respect to the research, authorship, and/or publication of this article.
Funding
The author(s) disclosed receipt of the following financial support for the research, authorship, and/or publication of this article: This research work is sponsored by TenD AI Medical Technology.