
Abstract
Voting behavior in union representation elections is influenced by rational and non-rational choices alike. This study shows a correlation between one nonrational choice, political partisanship, and such voting behavior. Comparing general election support for Democratic U.S. Presidential nominees where union representation elections occurred—a proxy for political partisanship—with support for a union in those representation elections shows positive, highly statistically significant correlations between Democratic support and union support in every consecutive twelve-month period between the 2008 and 2020 general elections. Furthermore, between 2008 and 2020, the magnitude of this correlation increased to a statistically significant degree.
Introduction
Section 9 of the National Labor Relations Act of 1935 (NLRA) empowers any eligible employee or group of employees, any agent acting on their behalf (e.g., a labor union), or any eligible employer to petition the National Labor Relations Board (NLRB) to certify or decertify a labor union to represent one or more bargaining units of employees. The NLRB must investigate to confirm that the petition satisfies legal standards, provide an appropriate hearing, and direct a union representation election by secret ballot if a question of representation exists. At elections, eligible employees—called a voting unit—can vote for any union (sometimes many unions vie to represent employees), vote against any union, or decline to vote.
Traditionally, scholars believed that voting behaviors in union representation elections predominantly were determined by rational choices, meaning employees would vote for a union if they perceived that union to bring utility and against a union if they perceived that union not to bring utility (Fiorito, Gallagher and Greer 1986). This traditional paradigm has been amply disrupted over the past several decades. To that end, much literature has explored employees’ voting behaviors in union representation elections and found that behavior to be a mix of rational and nonrational determinants. Recently, for instance, Professors Adrienne E. Eaton, Sean E. Rogers, Tracy F. H. Chang, and Paula B. Voos summarized this literature and cataloged these voting determinants as falling into one of five discrete categories: (1) Unfavorable macroeconomic conditions, poor or worsening work terms and conditions, and occupational and industrial characteristics; (2) familiarity with unions (e.g., within the employee's household, circle of friends, or workplace); (3) social psychological factors like dissatisfaction with work, general feelings about unions, and perceptions of specific union instrumentality; (4) emotional factors like fear of reprisal, fear of conflict, distrust of management, and satisfaction with the union; and (5) demographics like race, gender, and age (Eaton et al. 2014).
This study introduces political partisanship as a determinant of voting behavior in union representation elections. In doing so, it most likely supplements the list of social psychological voting behavior determinants. To that end, at least some scholars describe political partisanship as a social identity (Greene 2002; Huddy and Bankert 2017; Iyengar, Sood and Lelkes 2012; Lupu 2013) much like the social identity of being prounion or antiunion that scholars have identified as a determinant of voting behavior (Fiorito and Young 1998; Getman, Goldberg and Herman 1976; Godard 2008; Hemmasi and Graf 1993; Schriesheim 1978). However, scholars dispute the extent to which political partisanship is best characterized as a social identity rather than “a product of voters maximizing their expected utilities” (Lupu 2013; see also Achen 1992; Franklin and Jackson 1983). Accordingly, political partisanship might be best described not as a social psychological voting determinant, but rather as the first of what is likely to be many additions to a novel, sixth category of voting determinants comprised of past choices or actions made by voting employees.
Importantly, this study does not further the already-sufficient evidence demonstrating a connection between political partisanship and general beliefs about unions (e.g., Democratic lean and pro-union beliefs) (Hemmasi and Graf 1993; Himmelweit et al. 1981; Martinez and Fiorito 2009). Rather, it examines the correlation between political partisanship and support for one specific union. Using the rational choice model, employees would be expected to support or oppose the specific union (or unions) vying to represent them based on rational considerations like the union's (or unions’) perceived instrumentality, not employees’ political partisanship which, regardless of whether it is described as a social identity or the product of prior utility-maximizing choices outside the workplace, is not an obviously rational consideration when an employee is considering whether to support or oppose a specific union. Put another way, one would expect employees, notwithstanding their political partisanship and all else being equal, to oppose a union if they perceive it as bringing negative utility and support a union if they perceive it as bringing positive utility (Deshpande and Fiorito 1989; Hemmasi and Graf 1993; Mellor, Golay and Tuller 2010; Premack and Hunter 1988). The correlation between political partisanship and voting behavior in union representation elections would undercut this expectation in the zero-sum game of voting behavior determinants.
Methodology
The first goal of this study was to compare general election support for the Democratic nominee for U.S. President in the county or county equivalent where the NLRB conducted a union representation election—a proxy for the political partisanship of that county or county equivalent—with support for a union in that union representation election. My hypothesis was that simple linear regressions would show statistically significant correlations between support for Democratic U.S. Presidential nominees in a county or county equivalent and union support in representation elections in that county or county equivalent. The second goal of this study was to compare the magnitude of that correlation longitudinally. My hypothesis was that, as political partisanship in the United States intensified between 2008 and 2020 (Boxell, Gentzkow and Shapiro 2020), the magnitude of that correlation would increase, as well.
To assess the first goal, I began by collecting a data set of employee voting behaviors in NLRB union representation elections over a twelve-year period. My initial data set consisted of all closed union representation elections administered by the NLRB, the tally date of which was on or after the 2008 general election (i.e., November 4, 2008) and on or before the 2020 general election (i.e., November 3, 2020) (20,314 union representation elections), which includes all union representation elections, be they initial or reruns, resulting from petitions for certification (i.e., RC and RM petitions) and petitions for decertification (i.e., RD petitions) (NLRB 2023). I then excluded from the data set any union representation elections resulting from petitions for clarification (i.e., UD petitions) (294 elections) as such elections concern employees’ obligation to pay dues, not union representation. Next, I excluded remaining union representation elections with fewer than 30 ballots cast in the aggregate either for a union or against a union (11,939 union representation elections) to ensure a sufficient number of observations for statistical significance in each such election, as well as all union representation elections in Puerto Rico (108 union representation elections), the U.S. Virgin Islands (9 union representation elections), and Guam (1 union representation election) because voters in these jurisdictions do not vote for U.S. President in general elections. My final data set consisted of 7,963 union representation elections spread across 12 years. For each such election, I collected the number of votes cast for any union and divided that by the number of votes cast for any union or against a union (Union Support). I then grouped each union representation election into one of twelve consecutive, twelve-month periods (“Tally Years” or “N”) beginning with November 4, 2008 to November 3, 2009 (N = 1) and ending with November 4, 2019 to November 3, 2020 (N = 12).
Next, using 2020 U.S. Census Bureau Data compiled by the Missouri Census Data Center (MCDC 2022), I matched the city 1 of the voting unit listed in the petitions of each of the 7,963 union representation elections above to the county or county equivalent in which that city is located. When MCDC data could not match a city to a county or county equivalent—like when the city listed by the party petitioning for the union representation election was a military base, airport, unincorporated place, abbreviation, or typo—I manually identified the corresponding county or county equivalent. If a city straddled multiple counties, I identified all corresponding counties (e.g., Fort Moore, GA (f/k/a Fort Benning), which straddles Chattahoochee County, GA and Muscogee County, GA) and treated them as a single county or county equivalent. I matched cities in Alaska with the corresponding Alaska House of Representatives District instead of the corresponding county equivalent (i.e., borough) because U.S. Presidential general election results in Alaska are reported by State House District, not by borough. I declined to match independent cities (e.g., Richmond, VA and Carson City, NV) to their nearest counties or county equivalents, instead preserving the independent city in the data because U.S. Presidential general election results are reported for each independent city.
Thereafter, using data from the MIT Election Data & Science Lab, I collected the number of votes for the Democratic and Republican nominees for U.S. President in the county or county equivalents, Alaska House Districts, or independent cities identified above in 2008, 2012, 2016, and 2020 general elections. (MIT Election Data & Science Lab 2021). Next, for each union representation election, I identified the general election preceding the tally date and the general election subsequent to the tally date. For the preceding general election, I divided the number of votes cast for the Democratic nominee for U.S. President in the county or county equivalent, Alaska House District, or independent city of the union representation election's voting unit by the number of votes cast for the Democratic or Republican nominee in the same jurisdiction (Preceding Election Democratic Support). I calculated the same percentage for the subsequent general election (Subsequent Election Democratic Support). I then weighted the Preceding Election Democratic Support and Subsequent Election Democratic Support according to the temporal proximity of each general election to the union representation election's tally date to estimate the political partisanship of each of the 7,963 union representation elections’ voting units at the time of each voting unit's tally date (Democratic Support). The number of votes for each Democratic and Republican nominee for U.S. President in all relevant general elections in every county or county equivalent, Alaska House District, and independent city surveyed exceeded 30, thereby ensuring sufficient statistical significance of all observations.
For example, the union representation election for Case No. 01-RC-022092 occurred in Norfolk County, MA on tally date July 31, 2009, which was 269 days after the 2008 general election and 1,194 days before the 2012 general election, implying that the 2008 general election would be far more indicative of the voting unit's political partisanship than the relatively far-off 2012 general election. Accordingly, I weighted Norfolk County's Preceding Election Democratic Support of 59.47 percent by 81.61 percent (i.e., 1,194 days until the 2012 general election divided by 1,463 days between the 2008 and 2012 general elections) and Subsequent Election Democratic Support of 57.74 percent by 18.39 percent (i.e., 269 days since the 2008 general election divided by the 1,463 days between the 2008 and 2012 general elections) to arrive at a Democratic Support of 59.15 percent.
Finally, I performed twelve simple linear regressions—one for each Tally Year—using Democratic Support as the dependent variable and Union Support as the independent variable. I also performed a single linear regression using pooled data from all Tally Years with Democratic Support as the dependent variable and Union Support as the independent variable. I compared the regression coefficient at N = 1 to the regression coefficients at N = n where n = [2, 12]. I did so graphically and by performing eleven t-tests where I tested the null hypothesis H0: βN = 1 = βN = n for n = [2, 12]. To do so, I assigned a dummy variable coded 1 for N = 1 and 0 for N = n where n = [2, 12], and an interaction variable equal to the product of the dummy variable and Democratic Support. I then used the dummy variable, Democratic Support, and their product as predictors of Union Support in multiple regression analyses—one each for n = 2 to n = 12.
Given the results below indicating a statistically significant t-test result when comparing the regression coefficient at n = 1 to the regression coefficients at n = 11 and n = 12, I performed a thirteenth simple linear regression for the period November 4, 2018 to November 3, 2020 (i.e., N = 11 combined with N = 12) using Democratic Support as the dependent variable and Union Support as the independent variable, after which I performed one final t-test using the same null hypothesis and methodology described above to compare the regression coefficient at n = 1 with the regression coefficient from this final simple linear regression.
Results
Simple linear regressions showed highly statistically significant correlations between Democratic Support and Union Support in every Tally Year (see Table 1).
A simple linear regression on the pooled data showed a highly statistically significant correlation between Democratic Support and Union Support, R2 = 0.03, F(1,7961) = 209.46, β = 0.23, p = .95 CI [0.2, 0.27].
Graphing the regression coefficients from N = 1 to N = 12 with error bars representing a 95 percent confidence interval suggests that the regression coefficients are increasing over time with the most significant differences from N = 1 appearing at N = 11 and N = 12 (see Figure 1).
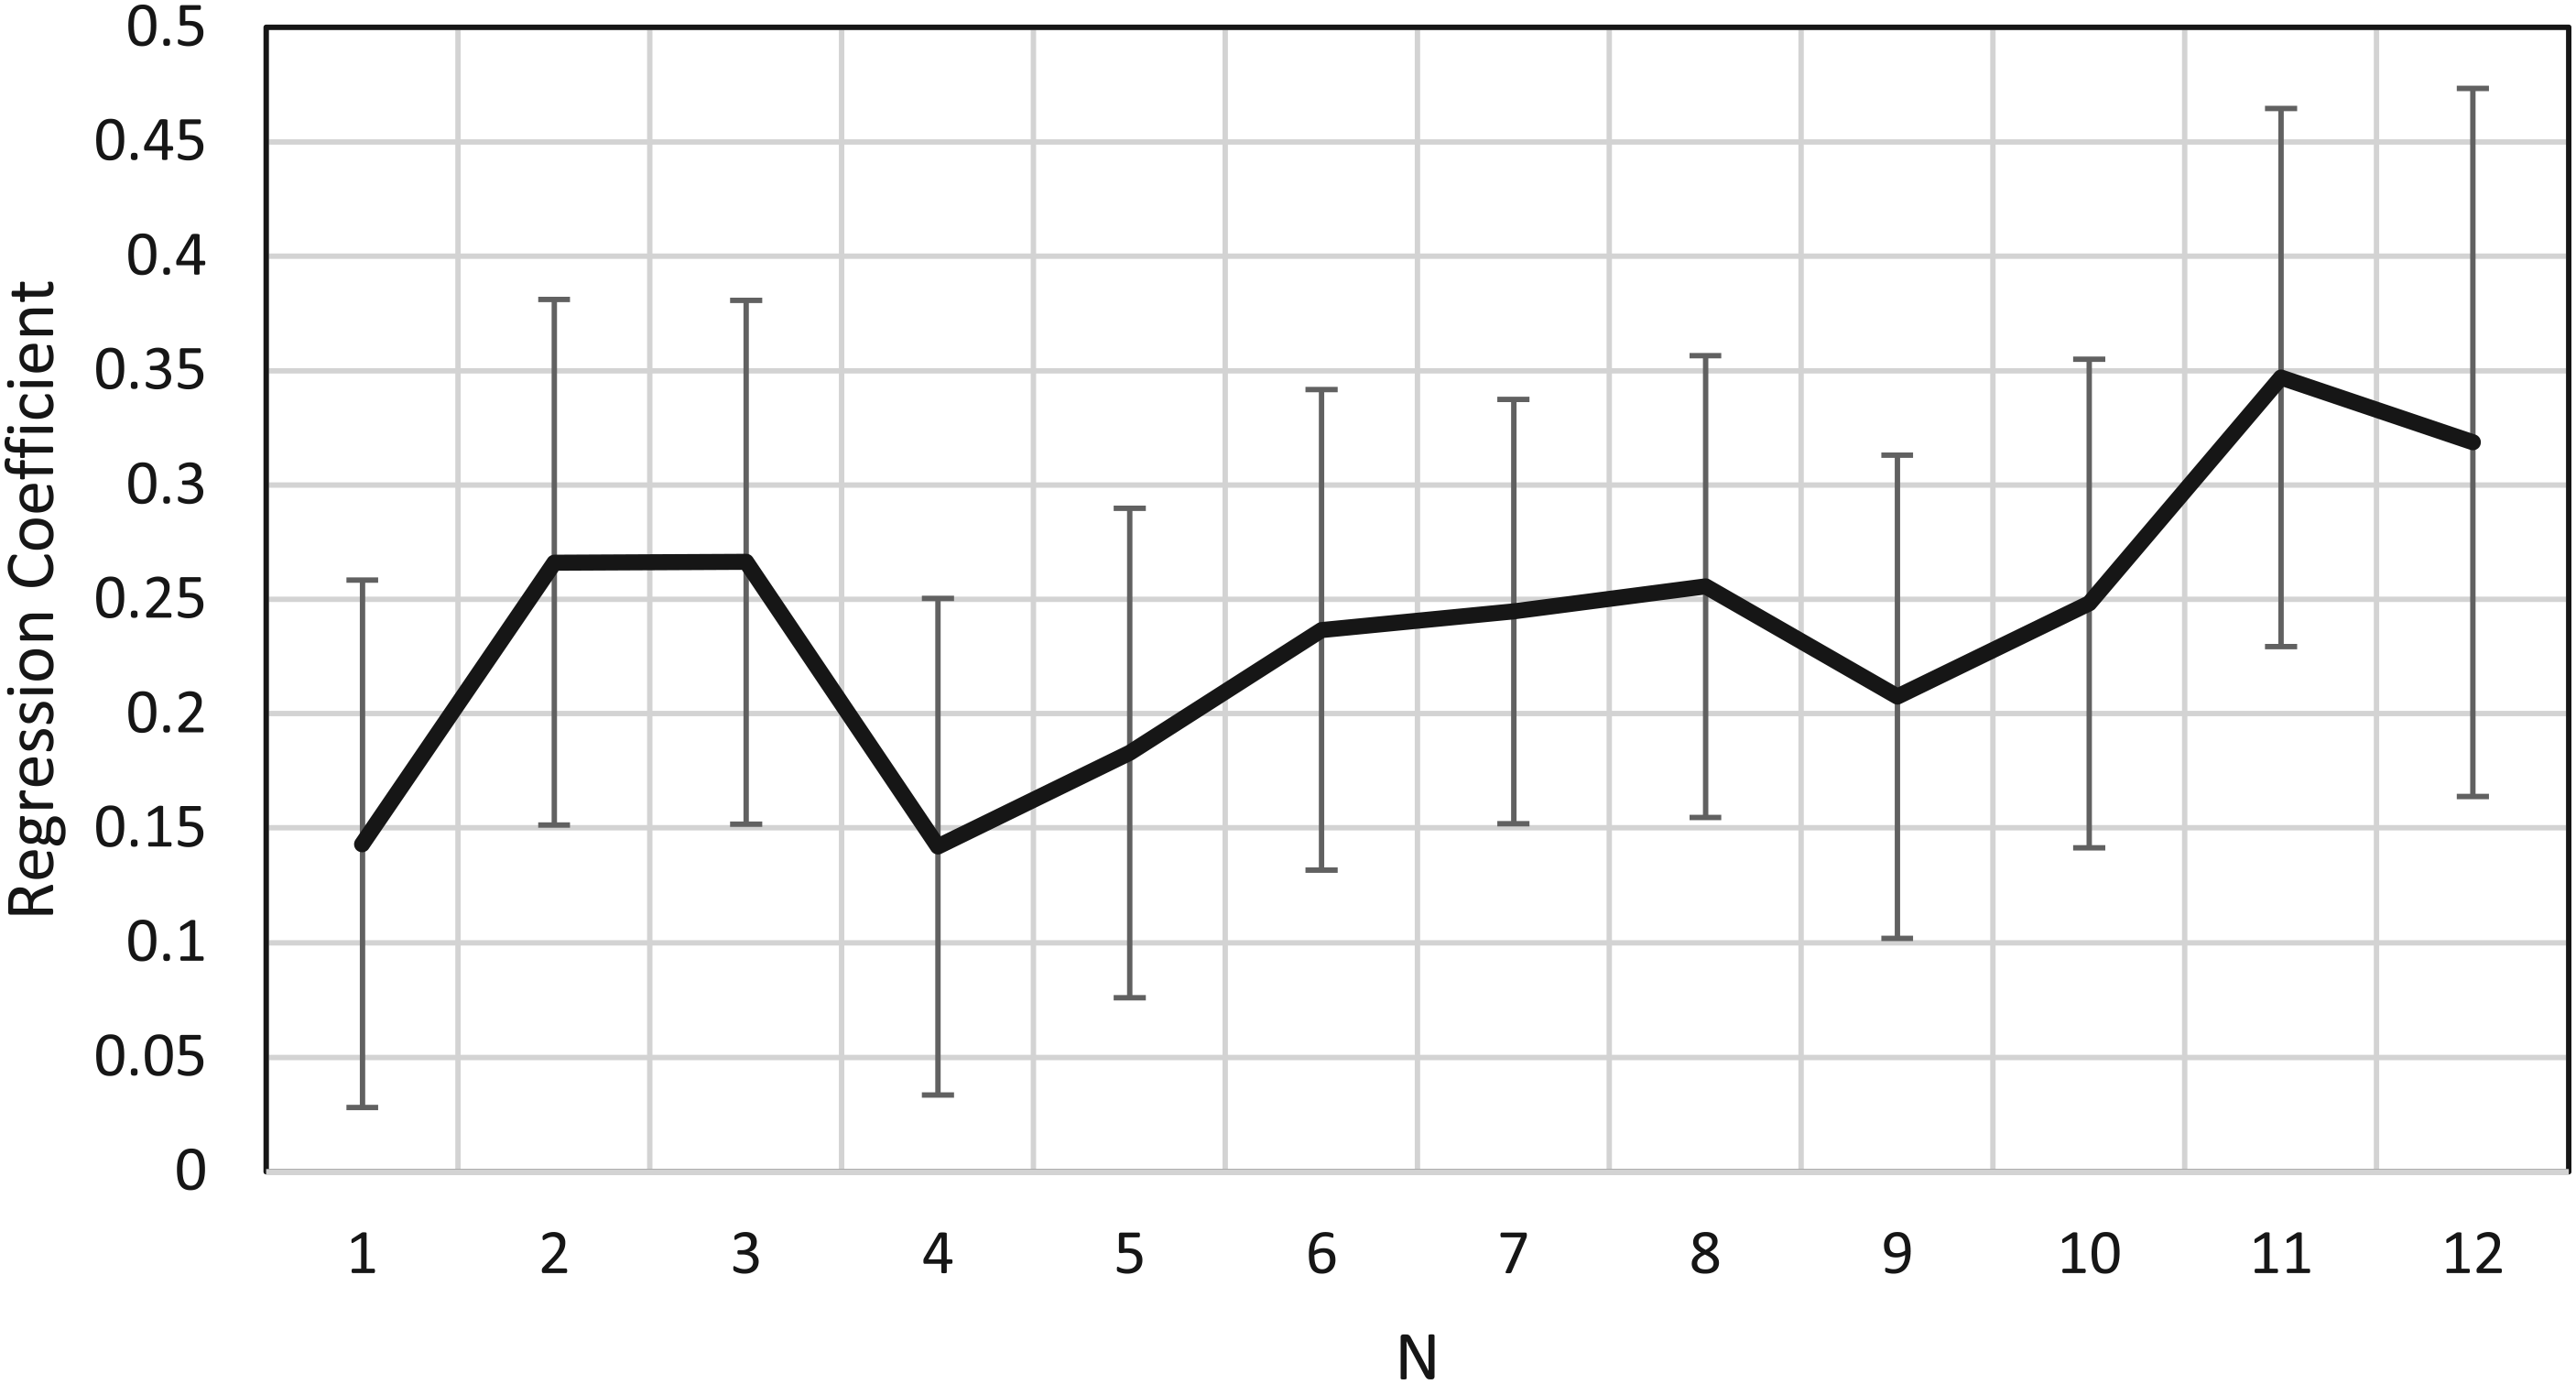
Regression coefficcients over time.
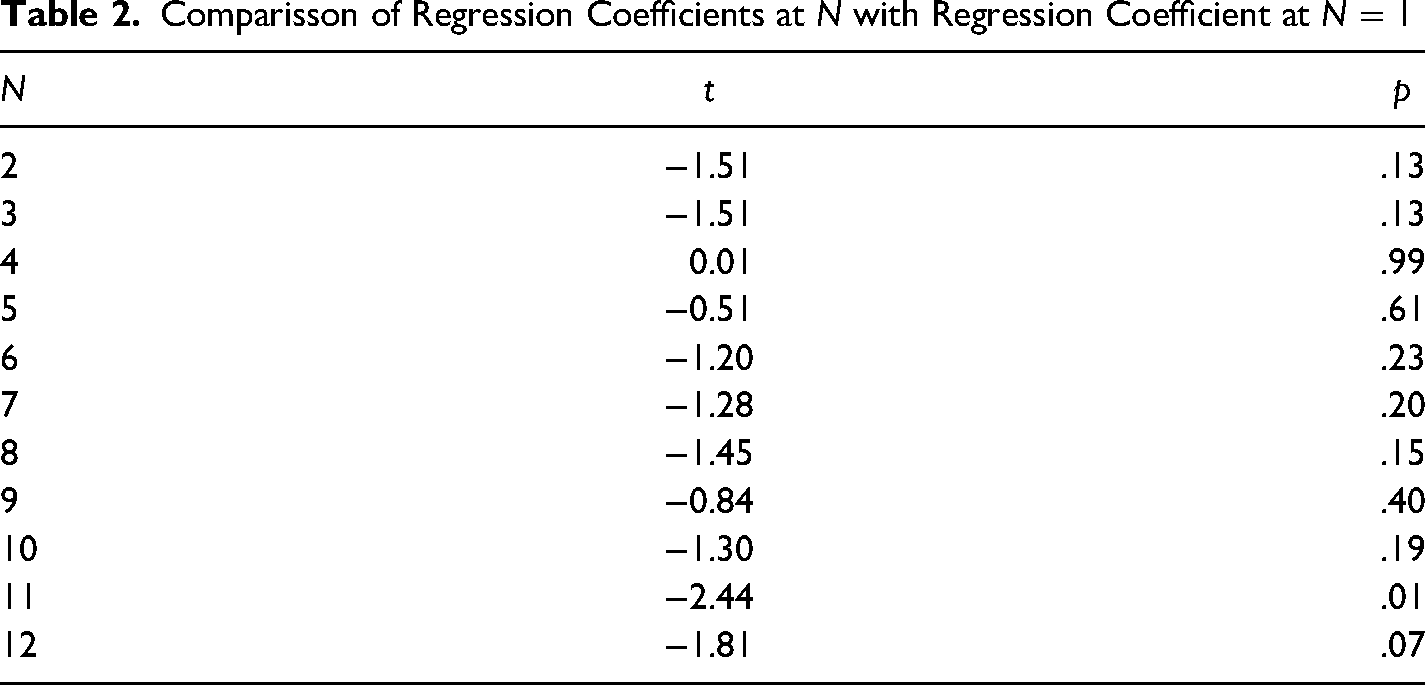
Using t-tests to compare the regression coefficient at N = 1 to the regression coefficients at N = 2 to N = 12 shows a difference that is positive at all Ns except for N = 4 and is statistically significant only at N = 11 with a nearly significant positive difference at N = 12 (see Table 2).
A thirteenth simple linear regression combining data from N = 11 and N = 12 showed a highly statistically significant correlation between Democratic Support and Union Support, R2 = 0.03, F(1,1580) = 48.23, β = 0.26, p = 0, 95 percent CI [0.19, 0.33]. Using a final t-test to compare the regression coefficient at N = 1 to this final regression coefficient, β = 0.26, shows a statistically significant difference, t = −2.57, p = .01.
Discussion
The results indicate a high degree of confidence that a positive correlation exists between political partisanship, as indicated by voting behavior in U.S. Presidential general elections, and voting behavior in union representation elections. Specifically, these results strongly imply that Democratic Support and Union Support are positively correlated in all consecutive twelve-month periods between the 2008 and 2020 general elections. However, the relatively small R2 values in each Tally Year, all of which fall below 0.1, indicate that this correlation is rather weak, as to be expected in light of the myriad and growing catalog of statistically significant voting behavior determinants already identified by the literature.
The results also show a high degree of confidence that the magnitude of this correlation increased between N = 1 (November 4, 2008 to November 3, 2009) and N = 11 (November 4, 2018 to November 3, 2019), a modest degree of confidence that the magnitude of this correlation increased between N = 1 and N = 12 (November 4, 2019 to November 3, 2020), and a high degree of confidence that the magnitude of this correlation increased between N = 1 and the period combining N = 11 and N = 12. In other words, the magnitude of the correlation between Democratic Support and Union Support increased between the twelve months subsequent to the 2008 general election (β = 0.14, 95 percent CI [0.03,0.26]) and the twenty-four months leading up to the 2020 general election (β = 0.26, p = 0, 95 percent CI [0.19, 0.33]), the 95 percent confidence intervals of which overlap less than 0.001, lending further support to the claim that political partisanship has increased between the 2008 and 2020 general elections.
These analyses are limited in some respects. Foremost, using recent support for nominees for U.S. President in general elections is a fair, albeit imperfect, proxy for political partisanship; certainly, partisan voters sometimes cross party lines and vote for the candidate from the other major political party. Furthermore, these analyses ignore U.S. Presidential votes for candidates other than those from the Democratic or Republican parties. This is because of the relatively modern stereotype that the Democratic Party is prounion whereas the Republican Party is antiunion, thereby allowing for this study's simple analyses: assess correlation between Democratic Support and Union Support. Certainly, this stereotype has its flaws, not to mention myopia (e.g., prounion or antiunion inclinations of any third party or independent candidates).
Furthermore, these analyses assume that the political partisanship of a voting unit can be discerned by referencing the political partisanship of the county or county equivalent, Alaska House District, or independent city in which the voting unit is located. This would be true if the voting unit's employees are representative of local voters, but that may not always be the case. Consider, for example, a voting unit comprised of employees located in a far corner of a county, the political partisanship of which is not reflective of the county as a whole (e.g., a voting unit of mostly Republican-leaning employees residing in one of the more-conservative suburbs of Cook County, IL, which leans Democratic in recent U.S. Presidential general elections). Alternatively, consider a voting unit comprised of a variety of employees drawn from multiple nearby counties in a highly urban environment (e.g., a voting unit comprised of residents of Republican-leaning Richmond County, NY and Democratic-leaning Kings County, NY); it would be impossible to accurately reflect the political partisanship of the voting unit without detailed, employee-level data, the likes of which the NLRB does not collect. Nevertheless, it is reasonable to assume that the vast majority of voting units’ employees will be broadly representative of the community in which they live, which is often encompassed by the county or country equivalent, Alaska House District, or independent city in which the voting unit is located.
Additionally, these results should not be viewed as indicative of all union support as they obscure unionizing outside of the NLRB union representation election process. For example, evidence from 2015 shows that “the vast majority of new union members in the private sector since the 1990s have come from non-NLRB processes” (Warren 2015). Rather, these results reveal only a correlation between Democratic Support and union support in NLRB-administered union representation elections.
Finally, the relationship between political partisanship and employees’ voting behaviors in union representation elections presented herein is endogenous. Increased Democratic Support could cause an increase in Union Support, as would be the situation if an employee believes that political allegiance should be exhibited by supporting or opposing the union(s) vying to represent that employee in a union representation election. Yet, increased Union Support could also cause an increase in Democratic Support, as would be the case if an employee believes that support for or opposition to the union(s) vying to represent that employee in a union representation election can be augmented by support for or opposition to a political party's candidate (e.g., “I support unions, so I will vote for a Democrat whose policies I believe will improve unions’ efficacy.”).
Although future work might explore the causal relationship between political partisanship and employees’ voting behaviors in union representation elections, the utility of such research is unclear. Evidence of correlation between these variables enables predictions that an increase in one variable likely will yield an increase in the other variable and, as I discuss below, predictions of this ilk are useful. Evidence of causation, however, would be useful if a party intends of trying to affect one variable with the goal of impacting the other. Yet, it remains unclear that one could impact either of these variables writ large, limiting the utility of causality evidence. Rather, ideal future research would examine the impact of the varied voting behavior determinants relative to each other.
Conclusion
Of late, prounion voices have been working to pass the Protecting the Right to Organize (PRO) Act through Congress, a key provision that would eliminate the right of employers to force employees to listen to arguments against unionizing (i.e., captive audience meetings). One of the justifications for legislation like the PRO Act is that employees are likely to act rationally, or at least predominantly rationally, when deciding whether to support or oppose a union, and captive audience meetings influence those rational choices. This study challenges the extent to which rational choices influence voting decisions in union representation elections. Put another way, eliminating captive audience meetings would have no impact on the correlation between political partisanship and employees’ voting behaviors in union representation elections, and this study shows that correlation to be increasing over time. That is not to suggest that support for the PRO Act is misplaced, but rather that, in the zero-sum game of voting behavior determinants—increased reliance on nonrational choices implies decreased reliance on rational choices—the PRO Act's potential impact vis-à-vis influencing the information available to employees when making rational choices appears to be waning with time. Indeed, this study finds that at least one nonrational choice (i.e., political partisanship) is explaining more and more voting behavior in union representation elections over a relatively brief period of time (i.e., ten to twelve years).
This study should be useful for union organizers in prioritizing their scarce resources and selecting prime targets for union representation elections. It shows that increased support for the Democratic nominee for U.S. President in a general election in a particular jurisdiction predicts increased support for unions in a union representation election in that jurisdiction. Hence, to the extent union organizers have the luxury of time and a choice between which putative bargaining units to prioritize, they might consider selecting putative bargaining units in jurisdictions with stronger support for the Democratic Presidential nominee in a recent general election. Similarly, if Democratic support is expected to grow in the near future, union organizers should consider waiting before filing a petition that they expect to result in a tight union representation election with the NLRB. On the flip side of the same coin, if Democratic support is expected to fall in the near future, union organizers should consider filing a petition sooner rather than later.
Further research into the determinants that influence employees’ voting behaviors in union representation elections continues to be warranted, especially the relative weights of those determinants and the degree to which those determinants are changing over time. Such research may help labor organizers efficiently steer resources, improve outcomes in union representation elections, and ultimately improve the terms and conditions of employment for a larger share of American workers.
Correlation Between Democratic Support and Union Support.
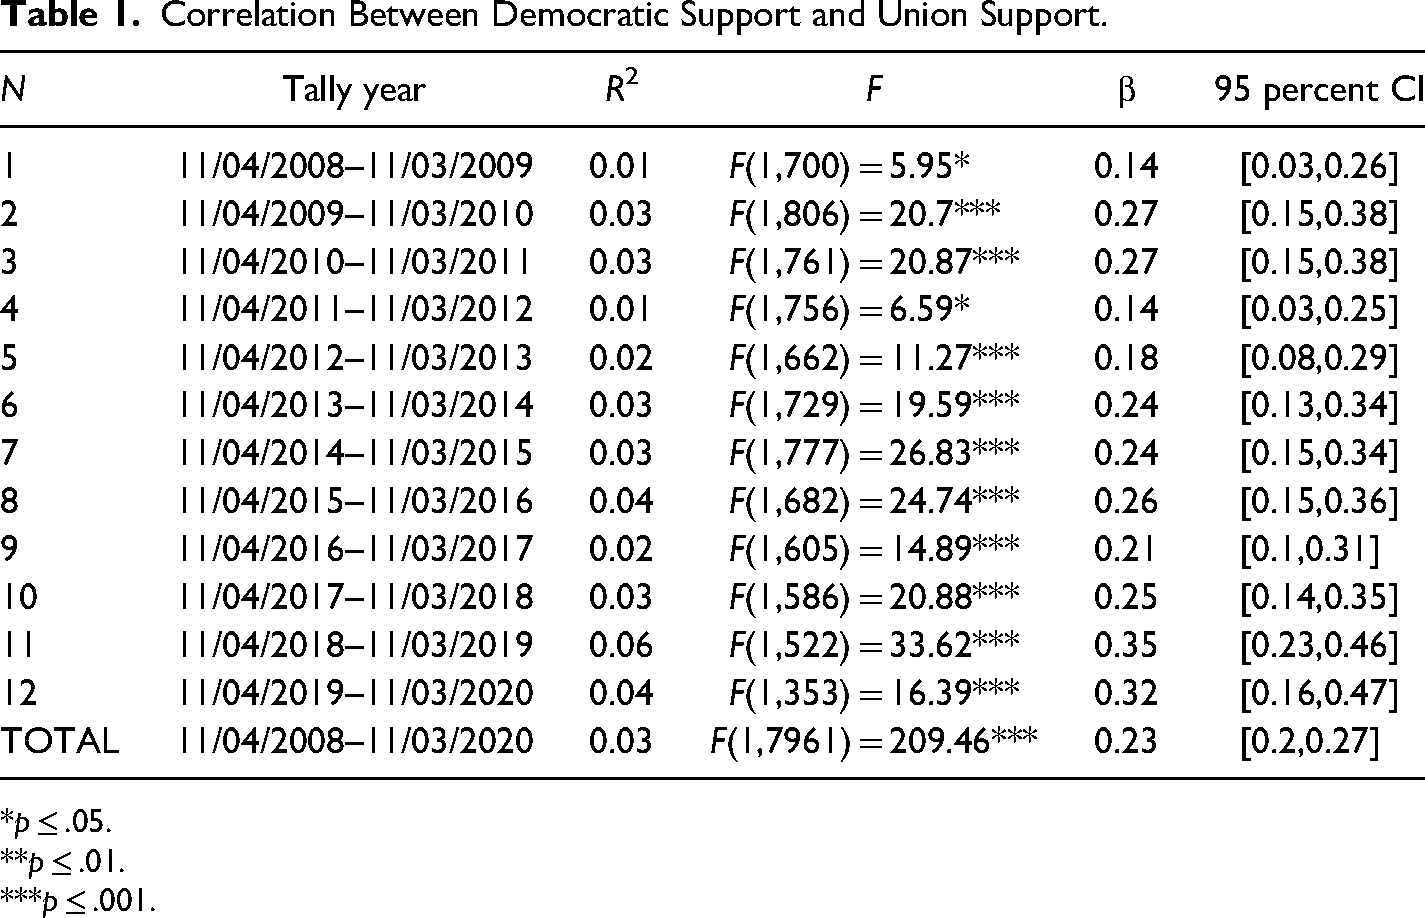
*p ≤ .05.
**p ≤ .01.
***p ≤ .001.
Comparisson of Regression Coefficients at N with Regression Coefficient at N = 1
Footnotes
Declaration of Conflicting Interests
The author declared no potential conflicts of interest with respect to the research, authorship, and/or publication of this article.
Funding
The author received no financial support for the research, authorship, and/or publication of this article.