
Abstract
It is often assumed – especially in the grey-literature – that local governments with declining populations are likely to also suffer declining financial sustainability. In this paper we test this widely held assumption with reference to both theory and audited financial statement data for the largest state of Australia – New South Wales. In the first stage of analysis, we briefly investigate the importance of context for predicting the likely outcomes of declining populations on financial sustainability for local governments. In the second stage of analysis, we test the predictive capacity of our aforementioned exploration of context with recourse to a rich six-year panel of demographic and finance data. Both results stand in stark contrast to what some might expect. We conclude by enumerating the various important public policy implications arising from our findings as well as highlighting lessons for jurisdictions elsewhere.
Introduction
Local government financial sustainability 1 is increasingly becoming a matter of great concern for regulators and scholars alike (Drew 2022). A widely accepted definition of financial sustainability argues that it is the ability to meet current needs of citizens, without imperilling the capacity of future citizens to meet their own needs (Chapman 2008; Drew and Dollery 2020). Implicit in this definition is the expectation of extracting sufficient revenues, now and in the future, to meet current and future operational expenditures, debt obligations and capital renewals.
There have been a number of reasons put forward for why local governments may struggle to maintain financial sustainability – for instance, taxation limitations, insufficient grant flows, excessive discretionary expenditure and the like (Drew 2022). However, the potential trigger that arguably occupies the greatest prominence in public policymaking, as evident in the grey literature, is the threat of declining populations (Drew 2022; Independent Local Government Review Panel [ILGRP] 2013; OECD 2025; Tasmanian Government 2022). Here, the thinking seems to focus mainly on the potential for declining populations to presage declining revenues.
It is said that these ‘demographic pressures are especially acute ..[in] rural and remote councils [that] are set to experience population decline or stagnation’ (Tasmanian Government 2022). Indeed, this is sometimes touted as the foremost reason justifying the unpopular public policy intervention of amalgamation – the idea being that lower population will ineluctably lead to lower revenues and hence reduced sustainability (Drew 2022; ILGRP 2013). For the most part, this expectation of public policymakers is echoed in practice by managers and local political representatives (Drew 2022). However, as we will soon see, the empirical scholarly evidence is nascent and somewhat inconclusive – certainly in an Antipodean context.
This paper seeks to redress apparent gaps in the empirical scholarly literature which stand in some contrast to the strong focus of regulators with respect to population decline and local government sustainability. To be even more precise, we aim to test whether the pervasive assumption of public policymakers and many managers in Australia – that declining population ineluctably leads to declining financial sustainability – is indeed borne out by empirical evidence. If the problem is, in fact, as pressing as regulators and most practitioners seem to believe, then it is clearly important that we thoroughly understand the potential method of causation and the materiality of its effect. This is especially the case given that emerging scholarly work is starting to demonstrate that the logic of ad populum can often be exposed as completely fallacious when rigorously tested against both theory and empirical evidence (see e.g., Drew, Miyazaki, and McQuestin 2024). It thus behoves us to test pervasive assumptions (which are often sans context specific empirical evidence) regarding the putative grave circumstances of local governments with population decline against the revealing flame of scholarship.
To fully understand the implications of population decline for local government financial sustainability we will next turn our attention to briefly consider the literature from abroad as well as the importance of context. Following this, we will paint a more detailed portrait of the kind of local governments that experience population decline – not just the obvious demographic indicators, but also the unique infrastructure burdens, community capacity to pay, and liability profiles. This task, in and of itself, is a valuable contribution to the literature which has thus far largely neglected to describe population decline local governments beyond crude assessments of their urbanity. Thereafter, we provide a robust empirical test of our earlier contextual exploration. Our work concludes with a sober consideration of the public policy implications and risks arising from our findings.
Extant Work, Context, Revenue, and Expenditure
In this section we first briefly look at extant work on population decline before describing the context for our study. Following this we examine both revenue and expenditure characteristics in NSW Australia with a view to understanding how they are likely to play out as populations decline. We then set forth our explicit predictions for financial sustainability at Australian local governments with declining populations.
Notable Extant Work on Population Decline
As we have already observed the grey literature is almost universal in its conclusion that population decline must ineluctably lead to a decline in financial sustainability (Tasmanian Government 2022; ILRP 2013; OECD 2025). What hasn’t been commented on is the almost universal lack of robust evidence to support this conclusion (see, Tasmanian Government 2022 for a salient example). On the rare occasions that evidence is offered up it tends to be crude and rudimentary – for instance, the OECD (2025) report relies mostly on a scatterplot with a line of best fit for just a portion of nett operating expenditure (municipal health care per capita) in just one country (Finland). Despite an apparent lack of robust evidence, large reports are nevertheless written with an air of absolute certainty– often accompanied by detailed and significant policy prescriptions.
The usual thinking seems to be that taxation revenues will inevitably decline as population reduces, along with some user charges, and potentially intergovernmental grants (ILGRP 2013; OECD 2025). It is sometimes acknowledged that some variable costs might also reduce but this is usually contrasted with conjectures that capital expenditure (presumably related to health and aged care) will increase (see OECD 2025). Little specific consideration is given in the grey literatures to the intricacies of context and how this might be critical to revenue and expenditure response.
In addition to grey literature, there is also a large generalised scholarly literature on aspects of population decline and financial sustainability. This work tends to look at specific elements of population shifts and suggests public policy responses to redress same (see, e.g., Jeong and Kim 2021; Kiewiet and McCubbins 2014; Miyazaki and Drew 2021; Yang and Dunford 2018). This is certainly important work – but generally fails to either confirm or refute the putative association between population decline and financial sustainability that lies at much of the public policymaking.
Indeed, several scholars have noted that there are very few extant empirical studies specifically addressing the determinants of financial sustainability (see explicit statements of this kind in Andrews and Dollery 2021; Ferreira et al. 2021; Rodriguez-Bolivar et al. 2016). There are even fewer robust empirical studies that have attempted to examine the more specific questions around population decline and financial sustainability.
Related work includes Rodriguez-Bolivar et al. (2016) who examined financial sustainability according to a proxy (adjusted income) and found no association with age. Also in this category is de Widt (2021) who found that local governments with ageing populations tended to be more careful with cash reserves; and Valkama and Oulasvirta (2021) who demonstrated an association between ageing and grant transfers. Another notable work is Ferreira et al. (2021) who used benefit of the doubt data envelopment analysis to examine various aspects of local government performance (including, but not restricted to, financial sustainability) and found that age only had a marginal negative effect on matters. Notably there is no specific empirical scholarly evidence on the association between population decline and financial sustainability at all, in an Australian context.
Thus, we see that whilst the grey literature carries a pervasive assumption that population decline must ineluctably lead to a decline in financial sustainability this is not borne out by the robust scholarly work. What work we have is on related topics (such as ageing), countries outside of the Antipodes, and also rather mixed and inconclusive. Furthermore, what extant work we have emphasises the importance of both context and grant transfers (see, e.g., Andrews and Dollery 2021). It is therefore very important that a specific study of the effect of population decline on financial sustainability is conducted with reference to context, including grant transfer systems.
Context and Exit
Context is always important to the understanding of any likely statistical association (Friedman 1966). Our study is set in the context of New South Wales (NSW), the largest state of Australia encompassing around a third of the nation’s population over 128 LGAs. NSW is an ideal case to study population decline because of the existence of a relatively large cohort of thirty-five councils which have experienced chronic population decline over the last six years (see below for details regarding the identification of these local governments). Furthermore, NSW employs a consistent suite of financial sustainability metrics which are reported annually in the audited financial statements and relied upon for various important public policy interventions (see, e.g., ILGRP 2013). In addition, rich demographic data, along with detailed disaggregated road data, is also reported on an annual basis in NSW which allows for robust empirical testing (see the next section).
It should be noted that local government in Australia has a relatively small remit in comparison to its overseas peers: focussed mainly on provision of roads, solid waste removal, as well as recreation (Dollery et al. 2006). Indeed, the single largest item of expenditure for Australian local governments is road construction and maintenance despite recent limited forays into functions such as home and community care (Drew 2022). It is particularly noteworthy that local government in Australia has almost no core welfare and health functions – the precise elements of expenditure that have been focussed on in much of the extant literature (see, e.g., Kiewiet and McCubbins 2014). In Australia, health and welfare are largely the purview of state and federal government respectively.
We remind readers that our principal focus resides in testing the pervasive assumption in the grey literature and some practice, that local governments with declining populations ineluctably are local governments with declining financial sustainability. We focus on this specific question because the assumptions – which seem to be sans rigorous empirical evidence in an Australian context – are having a significant effect on public policymaking. We are aware that there also exist questions about the differing effect of rapid compared to gradual declines, the location of potential catastrophic tipping points, and also the interaction effects of rural versus urban service provision. However, these are not the questions immediately driving policy in Australia at present (ILGRP 2013; New South Wales Government 2014; Tasmanian Government 2022) – and perhaps should therefore be left for future research.
The first step in the process to ascertain the veracity of the claims from the grey literature in Australia was to obtain accurate re-based population data from the Australian Bureau of Statistics (ABS). Many people are unaware that population estimates in intercensal periods in Australia are subject to quite large errors of up to 8.9% at the SA2 level (smaller statistical units that are used to compile the statistics for LGAs; Australian Bureau of Statistics [ABS] 2022). Following each census the estimates are re-based with more accurate data and our first step was thus to compile a database to reflect this process. We then calculated population growth for each local government, for each of the last six years and identified councils with negative growth (decline). When all years were negative, we categorised the LGA as an unambiguous case of chronic population decline. However, a few LGAs fluctuated from growth to decline during the six years – these councils were categorised as population decline only where the majority of years were decline and the difference in census years also represented an overall decline.
In total we identified thirty-five cases of local governments with population decline.
The next step was to compare various metrics for these population decline LGAs, to the remainder of the peer group in NSW to determine whether they were indeed different and also point the way to important variables that would need to be controlled for in later regression work. Figure 1 demonstrates stark differences between local governments with population decline relative to their peers.
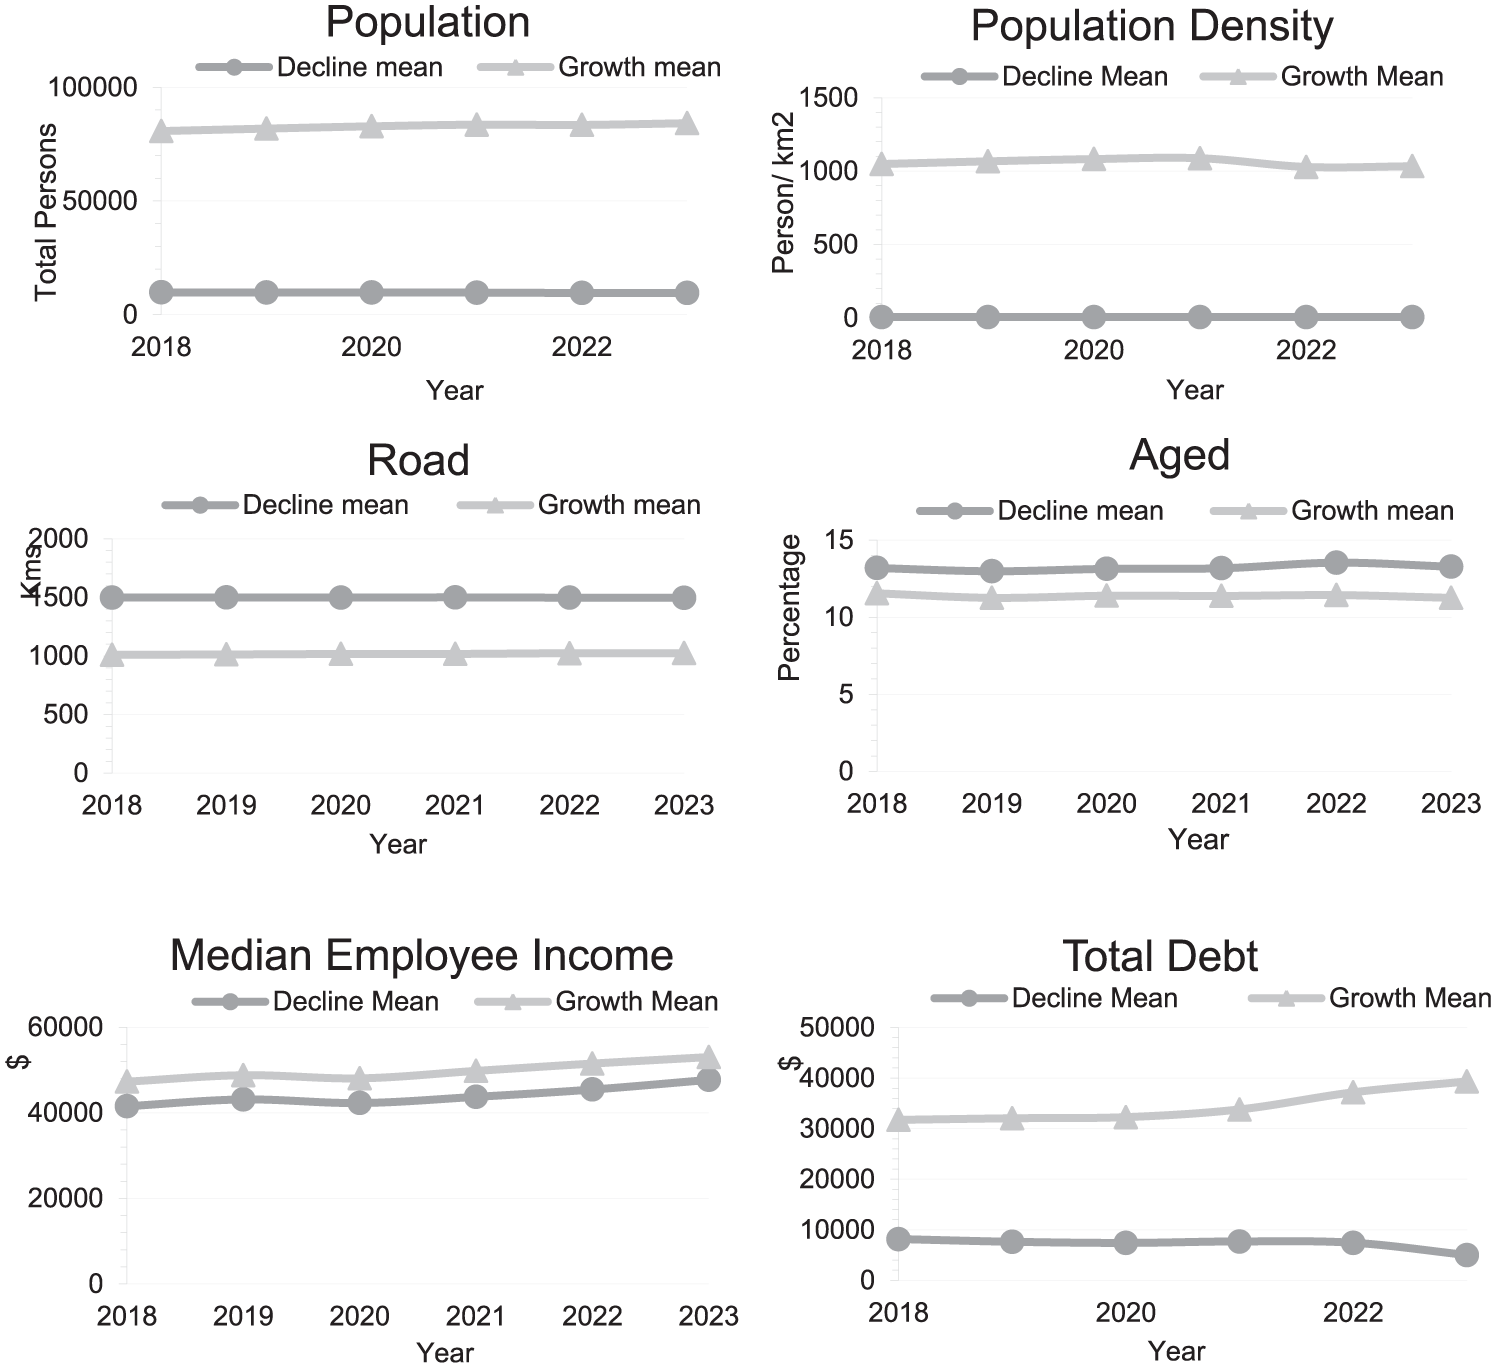
Key differences between population decline and growth local government areas, 2018–2023.
In sum, the charts reveal that local governments with declining populations tend to be quite small, often but not always located in rural and remote (low density) areas, burdened with large road networks, where the residents tend to have a lower capacity to pay (which hints at relatively greater reliance on grants as outlined in the last section). Readers will note that the difference in scale for decline and growth in Figure 1 makes the population decline over time a little difficult to discern. Therefore, we graph this specifically in Figure 2, whilst noting that the research question focuses purely on the association between decline and financial sustainability – not, other questions around the rate of decline or the like.
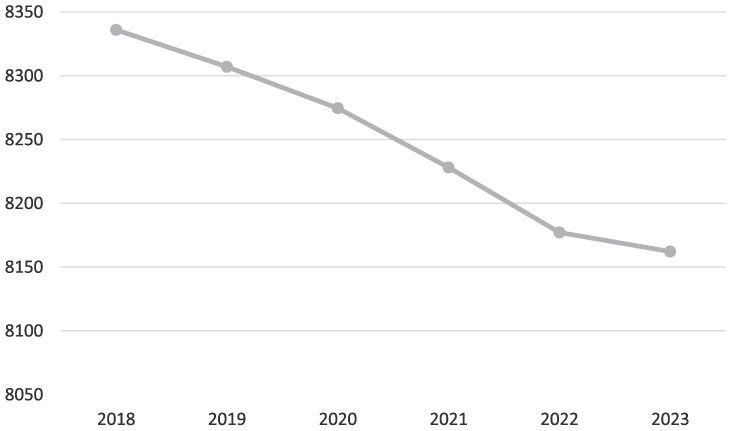
Average population in local governments with declines, 2018–2023.
Given the related literature on ageing and financial sustainability it also seems useful to consider in a little more detail the relative effect of age and exit (through death) in local governments with declining populations compared to their peers. As illustrated in Figure 3, local governments with declining populations have more aged residents, and also typically a higher death rate (ABS 2024).
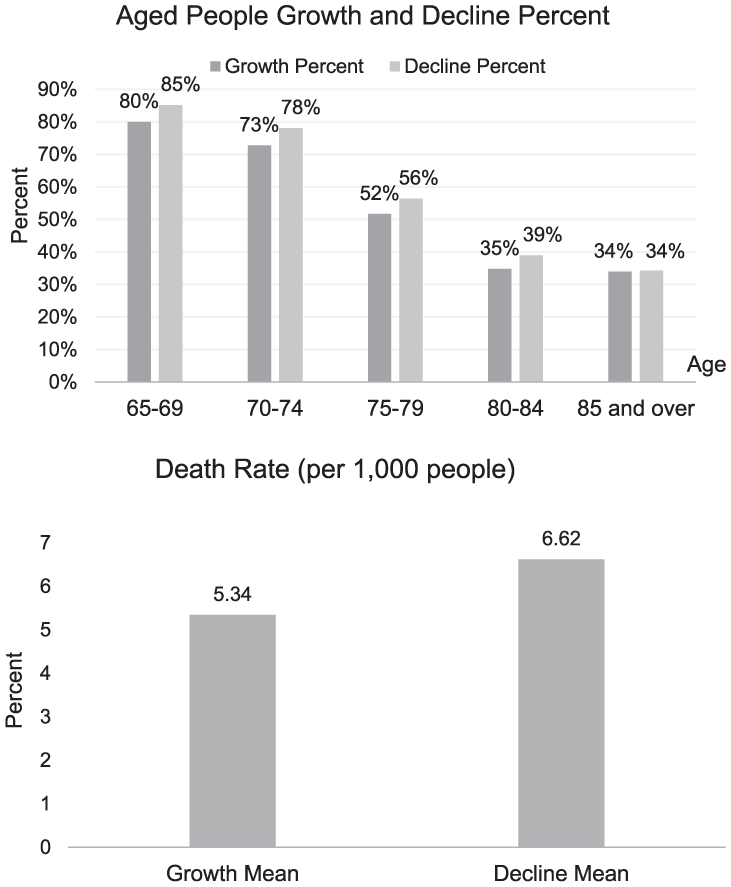
Proportion of aged persons and death rates, growth and population decline local governments, New South Wales, 2021.
This, and other data, seems to support the extant judgement that most of the population decline in NSW is driven by ageing and death, rather than outward migration (see also Drew 2022).
Now that we understand the nature of population decline local governments a little better, we can turn to the task deemed essential by scholars – an exploration of revenue and expenditure characteristics.
Revenue
There are three main sources of revenue for Australian local government: (i) taxation (called ‘rates’), (ii) intergovernmental grants, and (iii) fees and charges (Dollery et al. 2006).
Rates are levied on unimproved land value in NSW, not capital value. What this means is that even vacant or dilapidated property will still attract taxation. Indeed, there is no link between the number of people occupying a property and the tax liability. Provided someone owns the land – a legatee or surviving spouse for instance – then a tax will be levied (Drew 2022). Furthermore, the total tax take that a local government levies is increased each year by a regulatory percentage referred to as a rate cap. Fluctuations in individual property values therefore do not influence the total tax take for a local government, but only (potentially) the relative tax obligation of individual ratepayers. As a result, it is not reasonable to expect a reduction in tax revenues as population declines, for the case of NSW Australia.
The second largest source of revenue for NSW local governments are intergovernmental financial assistance grants. Audited financial statements suggest that grants only account for 5 percent of total revenues for the jurisdiction as a whole, but this rises to 14 percent for local governments with population decline. Grants are distributed in two tranches: a general grant that legislation specifies should be calculated according to horizontal fiscal equalisation (HFE), 2 as well as a road grant (Parliament of the Commonwealth of Australia 1995). HFE grants are responsive to the proportion of people who are aged who typically exhibit both greater need and less capacity to pay. The road grant is reflective of road length and surface type. It is thus reasonable to expect that total grant revenue might also be resistant to population decline – and could even rise marginally.
The third class of revenue are fees and charges, such as the domestic waste charge. In Australia fees and charges are highly regulated, focus more on access rather than consumption, and are levied irrespective of whether land is occupied or not (Drew 2022). A salient example is solid waste collection – a charge is levied independent of how much volume is in the bin and even applies to vacant land. The access component of this revenue source will thus also be resistant to change in the face of population decline.
Expenditure
Less people typically result in less traffic on the single largest asset class for local government – roads. This is likely to reduce costs associated with usage (costs associated with environmental drivers – floods, extremes of temperature and the like – will remain). Furthermore, many of the costs associated with services that attract an access charge will also reduce – for instance, there will be less rubbish bins to pick up, and less volume of waste to dispose of at local government rubbish tips. In addition, less residents mean that there are likely to be lower demand on customer services for inquiries and the like. Readers should remember that health and welfare are not legislated responsibilities of NSW local governments. As a result, there is no good reason to expect a meaningful uplift to capital costs relating to health related infrastructure. Thus, on the whole, it would be reasonable to expect a slight reduction in costs in most instances of population decline for NSW local governments.
Some Predictions
It seems clear that the particular characteristics of NSW local government means that there is no good reason to expect a decline in financial sustainability attendant on population as might happen in some jurisdictions abroad. Furthermore, the absence of a legislated local government remit in health and welfare means the main drivers of fiscal decline from abroad are not relevant. Indeed, some expenses will clearly reduce in line with population. We understand that this conclusion might well surprise some from abroad, and that it is also contrary to the prevailing assumption in the grey literature. However, context and grants have indeed proven decisive as suggested by Andrews and Dollery (2021): we are thus confident in predicting that there will be no overall significant deterioration to financial sustainability measures as populations decline.
Context and Empirical Strategy
In this section we outline the two-part empirical methodology that we use to test whether population decline does ineluctably lead to a decline in financial sustainability as some believe. In so doing we will also test the predictions arising from our careful study of context, revenue and expenditure.
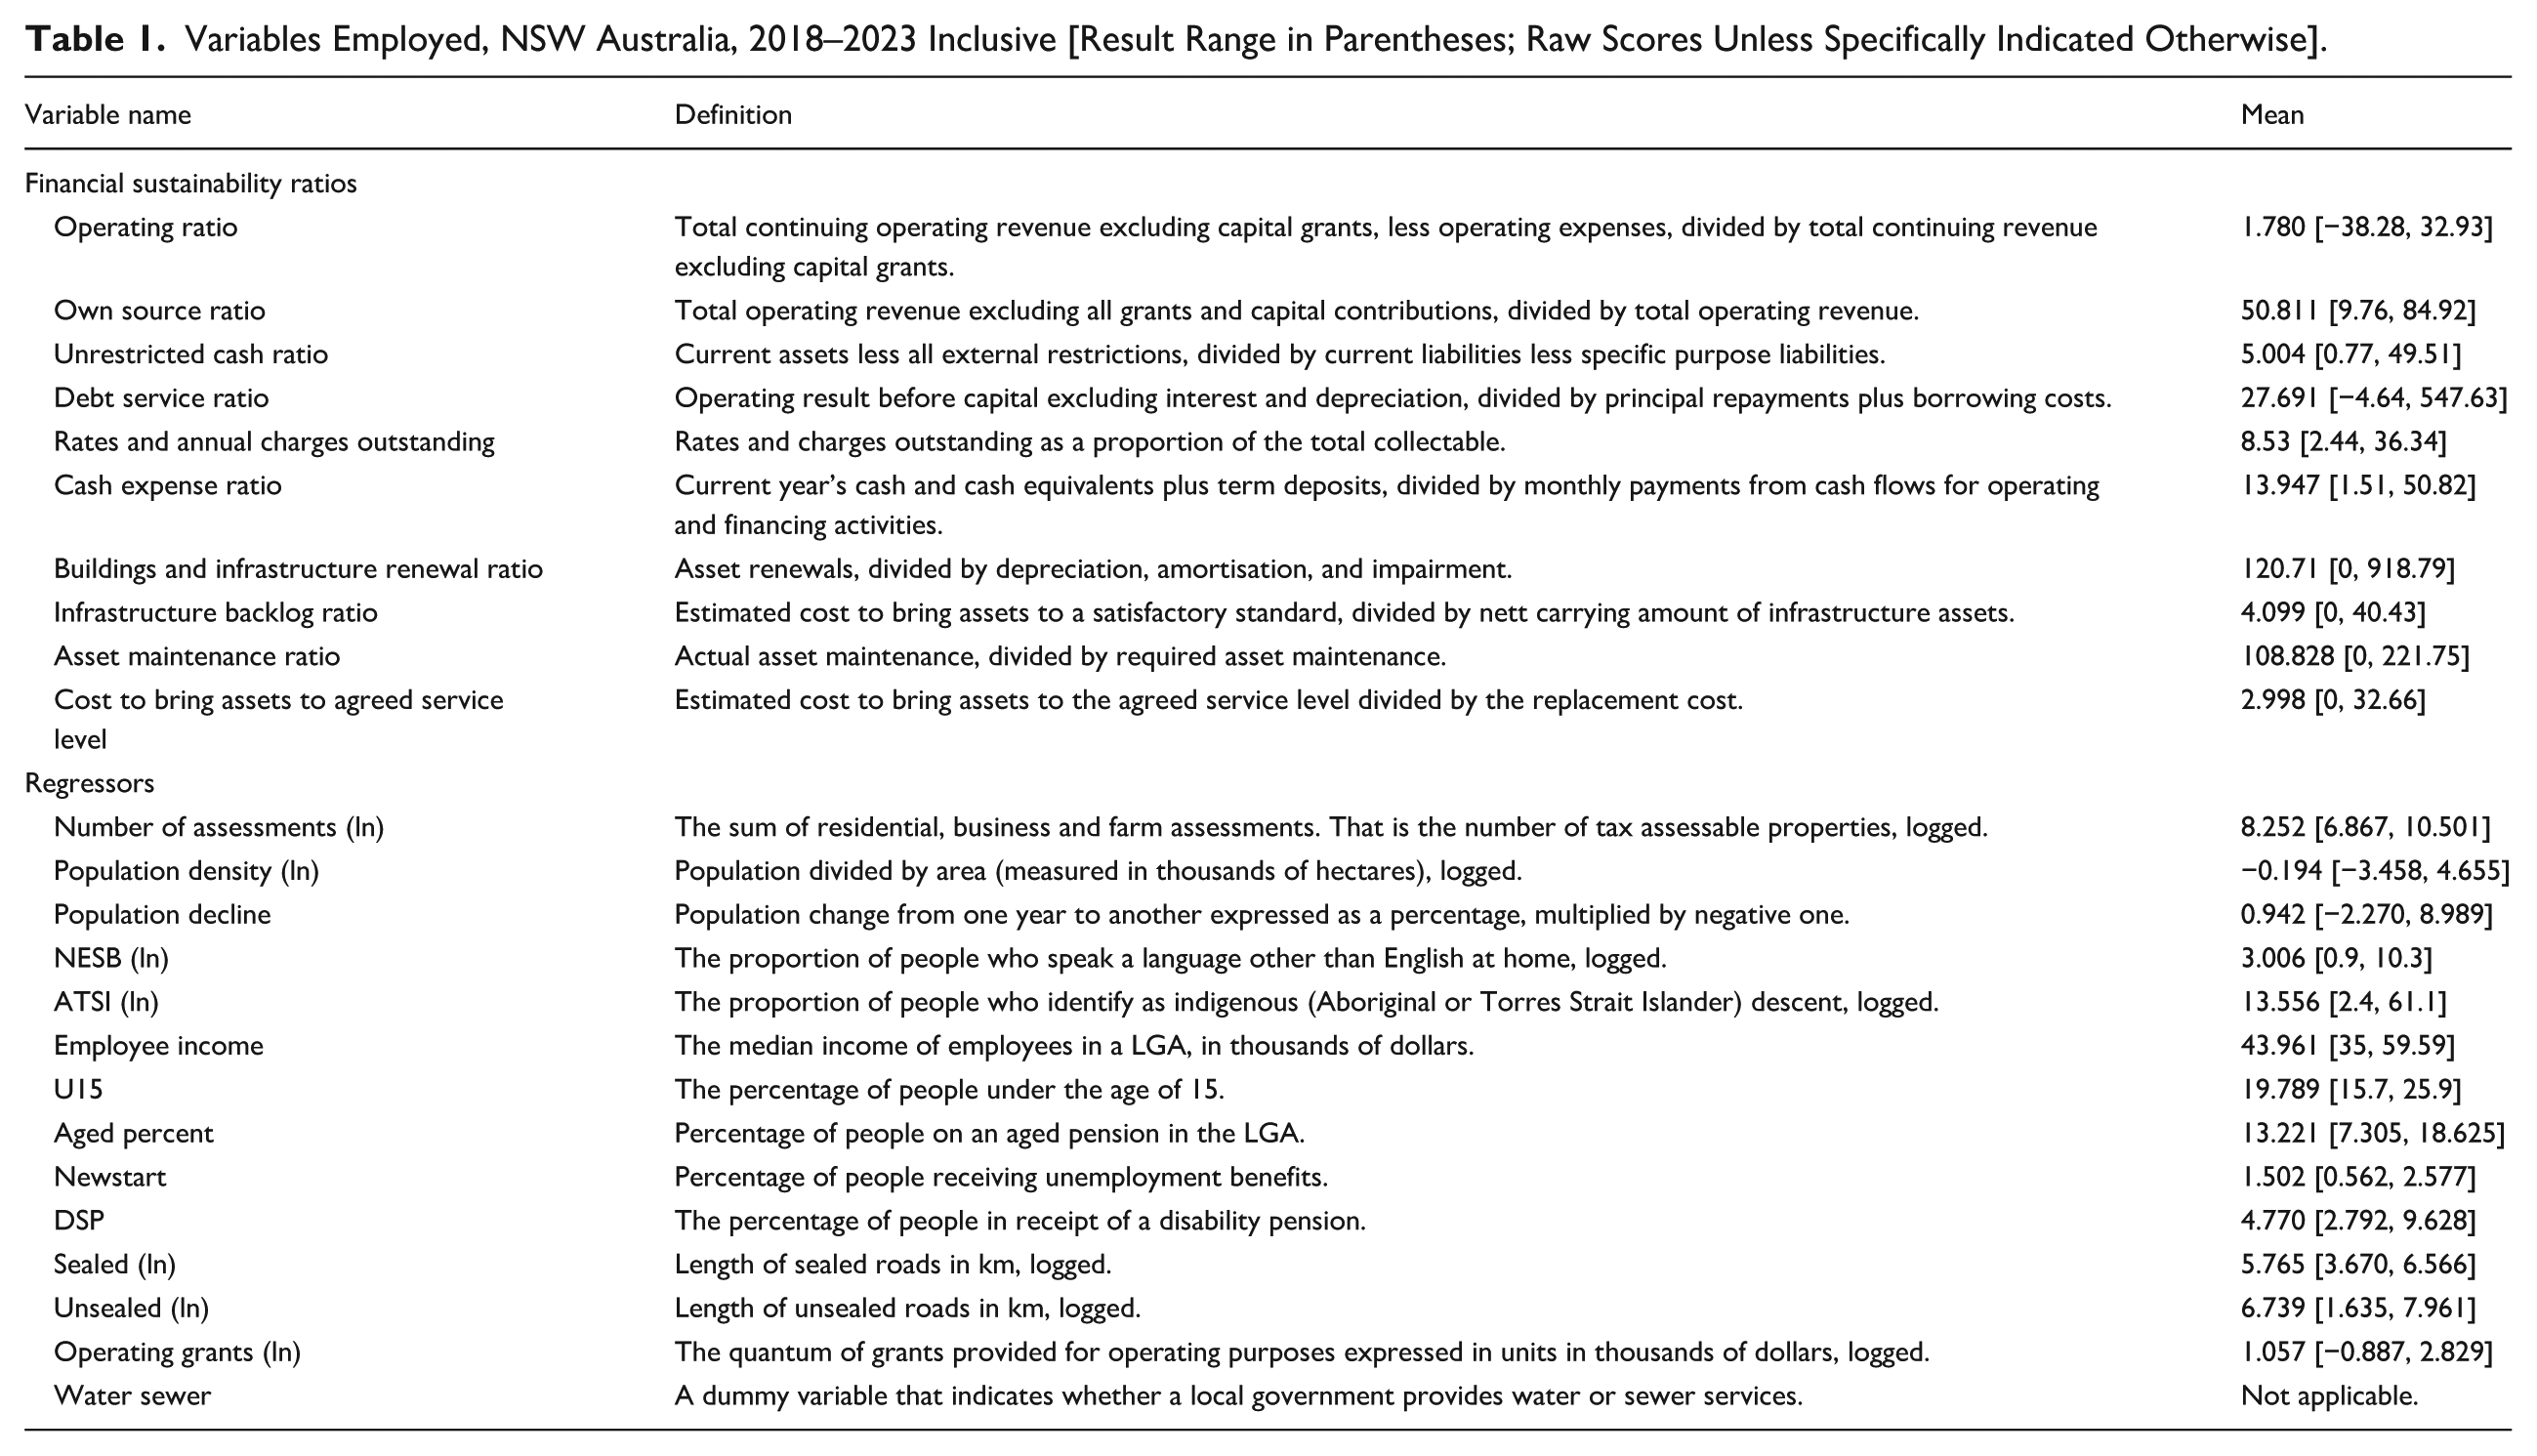
To achieve these objectives, we compiled data on all available financial sustainability metrics, as extracted from the individual audited financial statements of the local governments over a six-year period. This amounted to ten ratios, as detailed in Table 1, which represented an expansion of the metrics employed in previous work (see, e.g., Drew, Miyazaki, and McQuestin 2024; Rodriguez-Bolivar et al. 2016).
Variables Employed, NSW Australia, 2018–2023 Inclusive [Result Range in Parentheses; Raw Scores Unless Specifically Indicated Otherwise].
In the next section we present graphs for each metric to get a detailed picture of financial sustainability over the timeframe under analysis. The focus of our initial work was on discerning trends for the concept of financial sustainability as a whole. It was expected that individual ratios might fluctuate over time and even potentially show differing responses, but as we have seen, financial sustainability is a broad concept whereby the sum is certainly greater than any single part (Levine et al. 2013). This exercise of plotting individual financial ratios was crucial because: (i) it allowed us to form early opinions, regarding the consistency or otherwise, of financial ratio data to the predictions of context, revenue and expenditure, and (ii) it also provided insights into model construction as well as additional assurance for the regression work that followed.
For the second part of our empirical work, it was necessary to derive a wholistic measure of financial sustainability for regression analysis. For this purpose, we followed the example of Drew, McQuestin, and Dollery (2024) and employed the well-established rigorous technique of principal components analysis (PCA). 3 PCA is a mathematical method that allows us to reduce multiple data to a single number in a way that preserves maximum information value (Dunteman 1979). To be more precise, PCA positions a set of axes in such a way that linear projections of data points have their variance maximised.
PCA is an improvement on some of the extant work because it allows scholars to regress a single measure of financial sustainability, rather than trying to conduct multiple econometric exercises on different elements of sustainability that might be difficult for end-users to comprehend as a whole. Moreover, the mathematics behind the process means that the results should be robust to slightly different ratio specifications, or minor changes to the suite of ratios employed to explain financial sustainability. This occurs because, in PCA, no single ratio is allowed to exert high leverage – thus altering or subtracting from the suite is unlikely to result in vastly different statistical conclusions.
Indeed, to prove this point, and also provide additional assurance, we did in fact create three different PCA scores that we employed in separate regressions. The first score employed the seven financial ratios used in most previous work and public policymaking in Australia (the first eight ratios listed in Table 1 excluding the rates and charges outstanding figure; Drew, Miyazaki, and McQuestin 2024). The second PCA score was produced from the expanded suite of ten ratios per Table 1. The final PCA score – our preferred measure – first transformed the contrariwise ratios (infrastructure backlog and rates outstanding by taking their inverses) to correct for the difference in direction before applying the procedure to the aforementioned ten ratios. We conducted three separate regression exercises on PCA1, PCA2, and PCA3 accordingly, to refine our results and also demonstrate the robustness of the method.
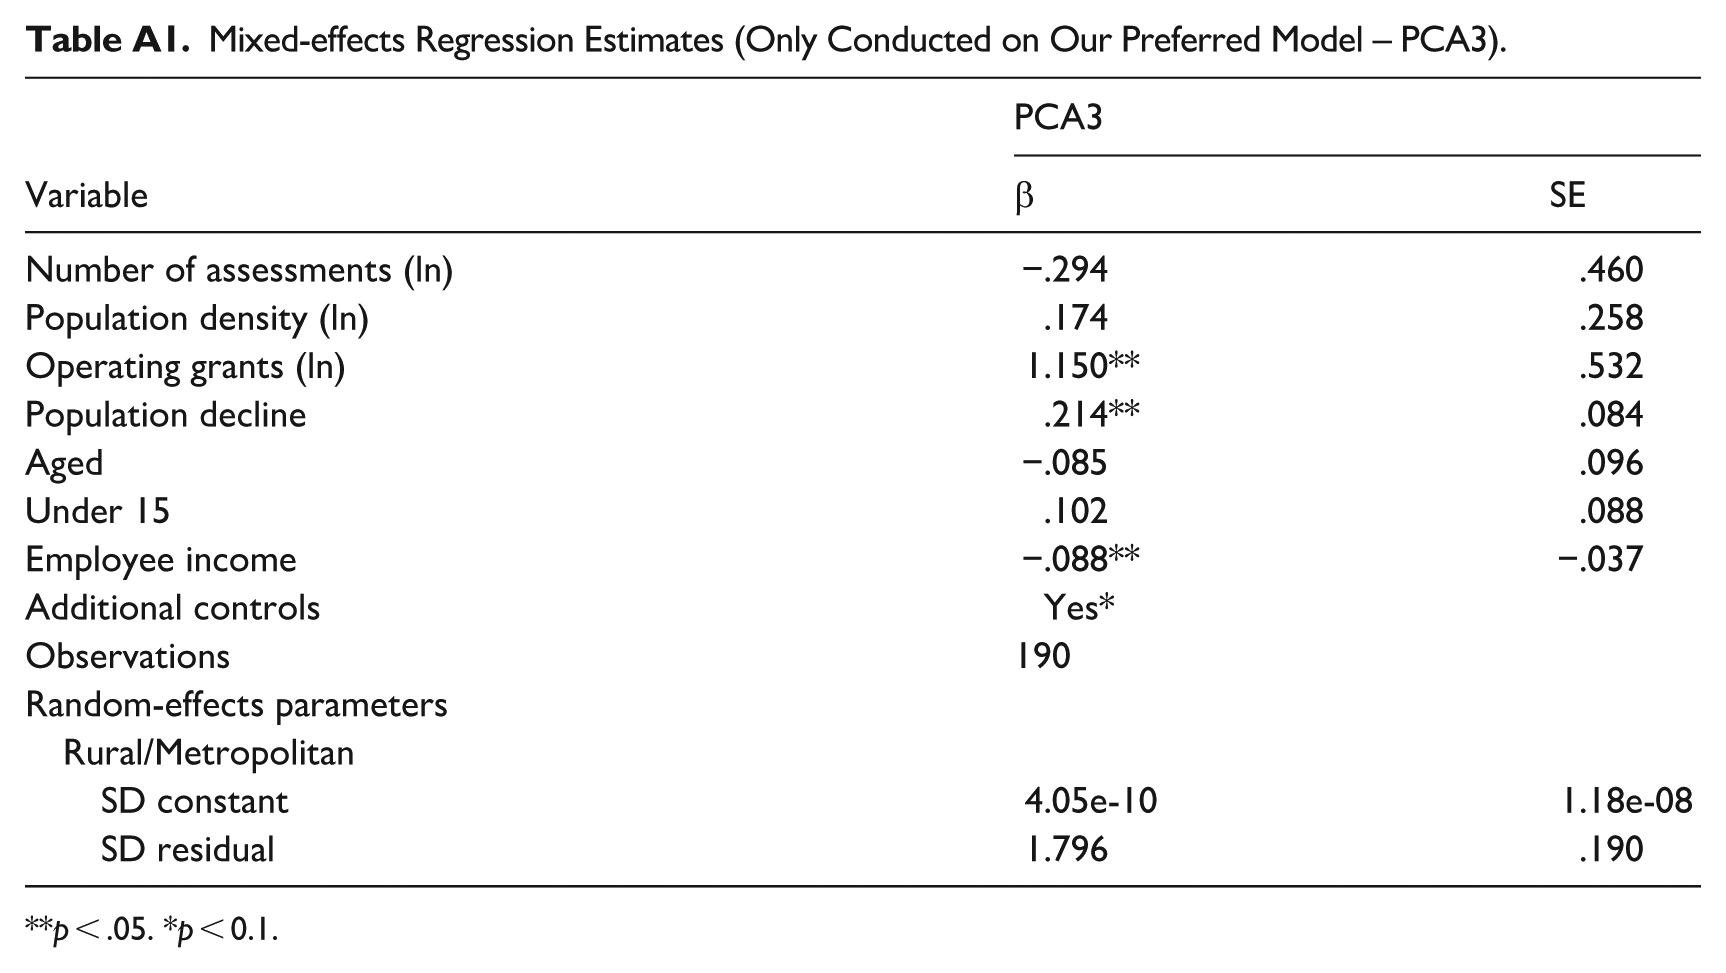
The main regressor of interest was the annual rate of population decline and its statistical association with the various PCA scores. OLS Regression with year dummies and robust standard errors was employed in response to the well-known limitations of fixed and random effects models (the former is biased when the regressor of interest is almost time invariant, and the latter biased when the composite error is correlated with the explanatory variables; Hill et al. 2020). However, we did also run a mixed-effects regression by way of a robustness check which we report in the Table A1 in Appendix.
The specification of our reported model was:
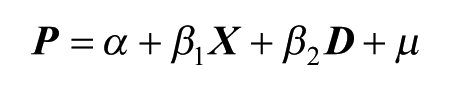
Where
Number of assessments were used as the control for local government size in response to our earlier observation of the preponderance of services being directed to properties (Drew, McQuestin, and Dollery 2024). 4 Population density was included as a control due both to the large influence that this has on population decline councils (Figure 1) and also the possibility of economies of density (Rodriguez-Bolivar et al. 2016). Income variables were also indicated, suggested by the potential for local government goods to be normal in an economic sense (Drew, Miyazaki, and McQuestin 2024). Various dependency and disadvantage data were used in response to the literature as well as standard Australian cost functions – notably this included the proportion of people on various pensions (Drew, Miyazaki, and McQuestin 2024; Rodriguez-Bolivar et al. 2016). Length of sealed and unsealed roads were also suggested by Figure 1, the fact that these are the single largest item of expenditure, as well as the literature (Drew, McQuestin, and Dollery 2024). Operating grants were controlled for in response to our application of theory in the previous section.
In sum, our comprehensive approach to the investigation of financial sustainability for local governments with population decline included: (i) our earlier exploration of context, revenue and expenditure, (ii) the construction of sixteen additional graphs, as well as (iii) three different composite measures of financial sustainability and four separate regressions. This was all necessary to thoroughly test the contention from the grey literature with maximum assurance.
Results and Discussion
Exploration of context as well as revenue and expenditure structures are important because they give us a good guide as to what is likely to happen to financial sustainability as population declines in NSW Australia. However, for one to have maximum assurance regarding the predictions that followed it is helpful to also assemble some empirical data. This is the task with which we are now engaged.
Part of the problem with testing theories about financial sustainability response to population decline is the number of metrics consistently available. Fortunately, NSW has a relatively diverse set of ratios that appear annually in audited financial statements. In Figure 4 we plot measures for central tendency for the ten ratios over the last six financial years for the thirty-five LGAs experiencing population decline.
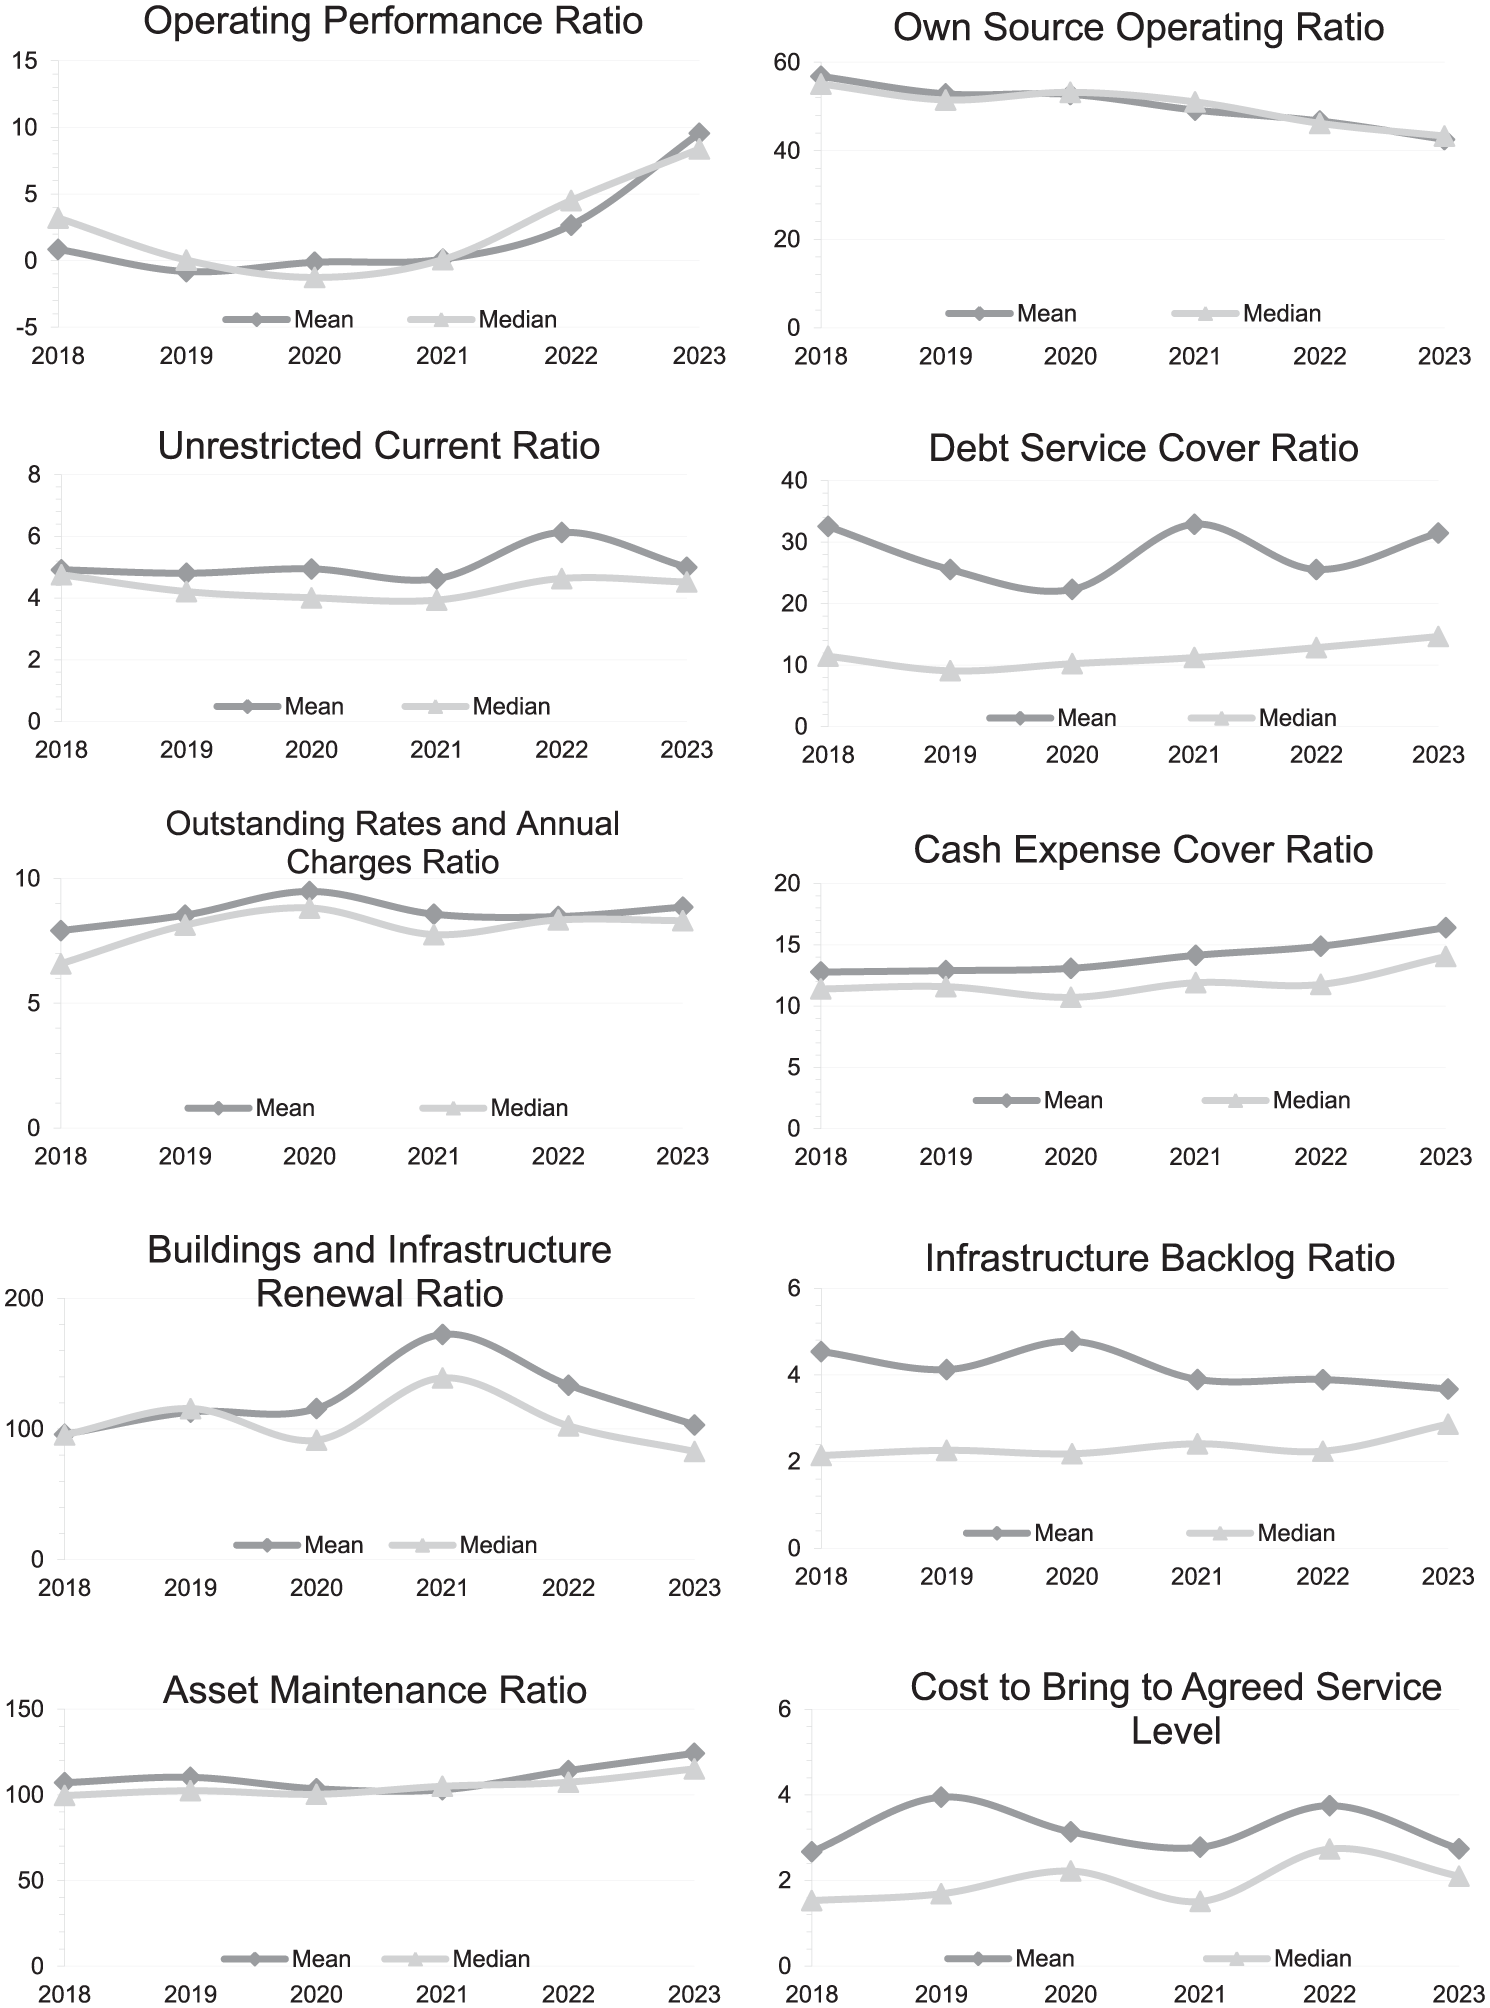
Financial sustainability ratios for population decline local governments, 2018–2023.
Broadly speaking, five out of the ten ratios exhibited improvements over the course of the six years (operating performance, unrestricted current, debt service, cash expense, and asset maintenance). A further three asset ratios were either flat or ambiguous in direction, which is to be expected given that infrastructure spending tends to be quite lumpy. In addition, the rates and charges outstanding ratio was also ambiguous, with a slight uptick since COVID-19, (which is exactly what has been seen throughout the state – for NSW the mean result in 2019 was 6.08%, and this hasn’t dropped below 6.56% since the economic shock [statewide in 2023 the average was 6.69%]). Just one ratio had a clear decline over the period – the own-source ratio. This metric is still considered by many to be an important element of financial sustainability despite the fact that income of this kind is no more reliable than legislated formulaic grants in Australia (Drew 2022). We also note that a small decline to the own-source ratio was predicted by our earlier examination of theory and thus warrants further investigation.
In Figure 5 we present some supplementary data that will help us to understand what is driving the apparent overall positive trends in financial sustainability. There have been recent attempts to change the allocation formulas used in NSW for the general grant (meant to be allocated according to the principle of horizontal fiscal equalisation) so that it better accords with the legislation. It appears that these efforts have indeed resulted in important additional flows of revenue to LGAs with population decline, as illustrated. We note also, from Figure 5, that road grants continue to increase in line with inflation, which is consistent with the indexation (to the Consumer Price Index (CPI)) of the intergovernmental grant scheme. It is thus not altogether surprising to see that our graph of revenue demonstrates a rapid acceleration of allocations for LGAs with population decline over recent years. This is entirely contrary to the extant fallacious ad populum assumptions, but perfectly predictable given our earlier application of theory. Notably, Figure 5 also illustrates that expenditure has increased at a far more moderate pace which explains the results we observed earlier for the operating and current ratios. Indeed, the apparent disparity in growth between revenue and expenditure respectively also explains the overall increase to cash reserves, as well as decrease to total borrowings, observed in the remaining two supplementary pieces of data (although this may also be a reflection of managerial prudence).
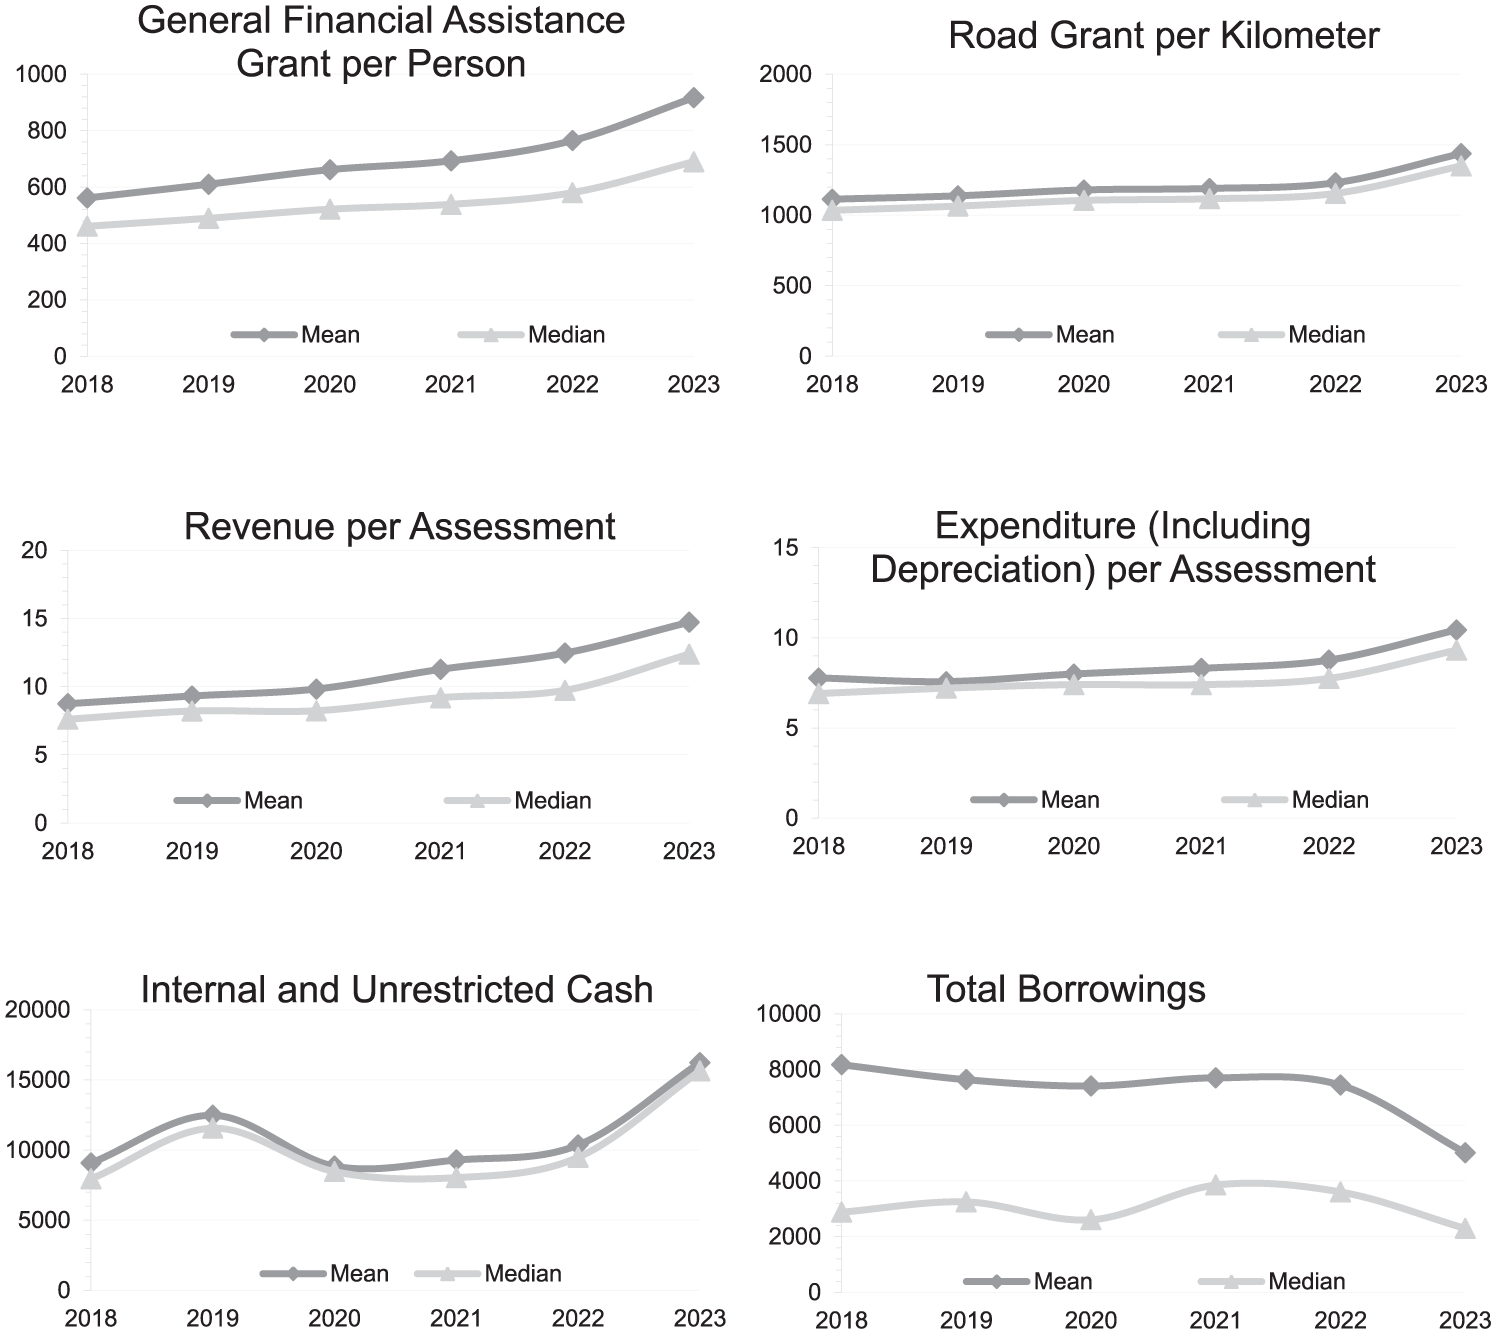
Additional indicators of performance for population decline local governments, 2018–2023.
The centrepiece of our work is the construction of summary measures (derived from the aforementioned ratios), and regression of same which will allow for ceteris paribus judgements regarding the association between financial sustainability and population decline.
As noted earlier we constructed three different PCA scores for each LGA for each year to summarise the various financial sustainability metrics. Part of the reason for doing so was to demonstrate the benefits of PCA as a method for summarising financial sustainability. It was our contention earlier that the linear projection technique, which maximises retained information value, would be resistant to material change due to the addition or subtraction of a given ratio, or slightly different specification of same. For this reason, PCA might be expected to be better for gaining a wholistic appreciation of financial sustainability than, say, regressions conducted on individual ratios. (Also, we have already examined the ratios individually through graphical means, therefore making individual regression work for each ratio somewhat redundant [in addition to unwieldy]). Our results below seem to confirm our contentions regarding PCA’s robustness – most of the regressors attenuate only slightly in response to differences in the number and specification of the various financial sustainability ratios used to construct the different PCA scores.
We particularly note the result for PCA3 which is our preferred measure and statistically significant at the 1% level – as population decline became more pronounced financial sustainability increased. This is the precise opposite of the assumption we find in most of the grey literature, but completely consistent with both our earlier exploration of theory as well as our review of the individual metrics for each financial sustainability ratio.
Also important, is the consistency especially with respect to the high statistical significance of the association between the rate of population decline and financial sustainability according to various PCA, ceteris paribus 5 (this is also consistent for the mixed effects regression in the Appendix). Thus, our findings are completely in line with both our earlier exploration of context, and the graphical overview in trends in specific financial sustainability metrics over time. This is important because sometimes people might doubt the results of sophisticated empirical analysis – but when all three modes of investigation (context, graphical, and regression) concur, then it is reasonable to declare that the results are convincing.
Some of the other results presented in Table 2 also warrant a little discussion. We found that the size of LGAs was typically negatively associated with the PCA score, albeit with varying levels of statistical significance. This result is consistent with Drew, Miyazaki, and McQuestin (2024) and suggests that small LGA’s are statistically more likely to be better in terms of financial sustainability. The operating grant regressor was positive, as expected from our application of theory as well as the graphs presented in Figure 4. The proportion of people on the aged pension was negatively associated with financial sustainability, albeit not statistically significant. This latter result is consistent with the requirement for a mandatory taxation discount for pensioners which is only partly refunded by the state government. The wage regressor was both negative in sign and also mostly significant – this is likely to be an artefact of the five-decade tax limitation regime that has operated in the state and largely broken the nexus between incomes and taxation.
Financial Sustainability and Size, New South Wales, 2018–2023 Inclusive.
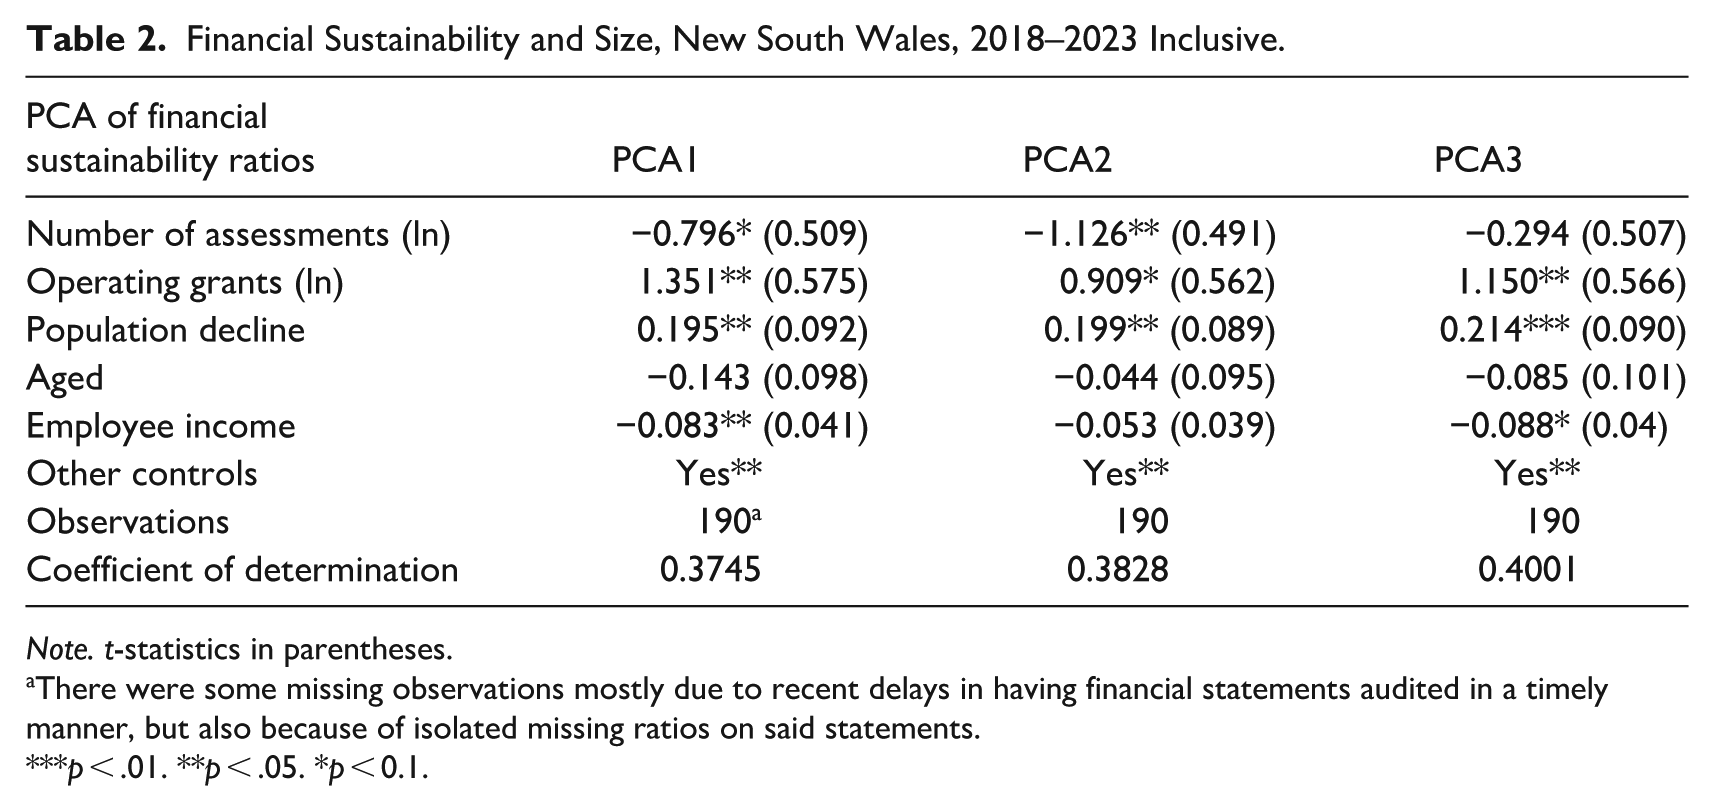
Note. t-statistics in parentheses.
There were some missing observations mostly due to recent delays in having financial statements audited in a timely manner, but also because of isolated missing ratios on said statements.
p < .01. **p < .05. *p < 0.1.
In sum, all three modes of investigation confirm that population decline does not ineluctably lead to a decline in financial sustainability, as some might have believed. Moreover, the results also point to some important public policy implications as well as risks for the future: the enumeration of these is the task to which we will presently direct our attention.
Conclusion and Public Policy Recommendations
This work represents another example of the importance of testing assumptions with scholarly theory and evidence. As we have seen, the effect of population decline on organisational sustainability is not what some have imagined. Of particular importance, was the specific structure of the NSW local government revenue base, as well as the response in expenditure to decline.
Our predictions based on an examination of context were also attested to by a review of individual financial ratio data over the time period, and ultimately the sophisticated regression work. Otherwise stated, all three ways of understanding all point in the same direction and readers can thus rest assured in our conclusion that there is no good reason to believe that population decline will ineluctably result in a decline to financial sustainability – certainly for the case of NSW Australia.
Nonetheless, any empirical work can be subject to caveats. For instance, some might wonder whether our six-year panel – relatively large by scholarly standards – was sufficiently long. Others might argue about particular alternate PCA or regression techniques that could conceivably produce nuanced results. In addition, we have made it clear that our work has nothing to say about the differing effect of rapid compared to gradual declines, the location of possible tipping points, nor also the interaction effects of rural versus urban service provision. We also did not control for spatial effects given both the predominate driver of decline (death) and the vast distances between NSW local governments – although we conceded this might slightly impact on results. Future work could examine all of these side-issues in due course.
Our findings have a number of implications for public policymakers. Most notably, we now know that the emphasis on population decline – with reference to the surveillance of financial sustainability as well as policy interventions such as amalgamation – has been without good foundation (certainly in NSW). Population decline has been demonstrated with a high level of assurance to make LGAs more sustainable, not less so, and this is likely to be the case anywhere in Australia, or in jurisdictions abroad with similar characteristics. Our work has also underlined the importance of unimproved land value as a tax base for local government areas experiencing population decline. This finding is important also in jurisdictions abroad – especially where the merits of Georgian (2006) taxation are still being debated. In addition, we have also presented evidence that underscores the critical role of horizontal fiscal equalisation grants – including grants directed to road maintenance – for minimising the effects of decline on local government organisations. This finding supports calls by other academics such as Valkama and Oulasvirta (2021).
These various policy implications also point to corresponding risks for local governments experiencing chronic decline. First, it is possible that pervasive assumptions regarding the effect of decline on financial sustainability may have encouraged more prudent spending and stewardship (which could partly explain our results; see, also de Widt 2021). If our work becomes widely known, it is possible that decision-makers might relax somewhat with corresponding deleterious effects to sustainability. Second, any change to the extant local government tax system could lead to diminished revenue from this stream that would result in diminished sustainability. Current, musings of regulators naïvely promoting capital improved value taxation might therefore present some danger for the future of declining local government areas (Drew 2022). Third, the grant transfers have clearly performed a pivotal role in the results that we found. We thus encourage grants commissions to continue to make moves to allocate monies in better accordance with the horizontal fiscal equalisation intent of the enabling legislation. Clearly any change to these recent endeavours, or any freezing or reductions to the grant pool, would have serious implications for local government areas suffering chronic population decline.
This paper also provided further attestation for the use of principal components analysis as a way to robustly summarise financial sustainability metrics. Hopefully, as additional scholars become aware of the technique, more might be encouraged to empirically explore a topic which seems paramount to regulators, but largely missing from the corpus of empirical scholarly research.
In sum, it is becoming increasingly clear that common assumptions are commonly incorrect: our work demonstrating that population decline does not ineluctably result in declines to financial sustainability is yet another salient example. We thus commend it to our peers and encourage others to also subject pervasive assumptions to the flame of rigorous scholarship.
Footnotes
Appendix
Mixed-effects Regression Estimates (Only Conducted on Our Preferred Model – PCA3).
| Variable | PCA3 | |
|---|---|---|
| β | SE | |
| Number of assessments (ln) | −.294 | .460 |
| Population density (ln) | .174 | .258 |
| Operating grants (ln) | 1.150** | .532 |
| Population decline | .214** | .084 |
| Aged | −.085 | .096 |
| Under 15 | .102 | .088 |
| Employee income | −.088** | −.037 |
| Additional controls | Yes* | |
| Observations | 190 | |
| Random-effects parameters | ||
| Rural/Metropolitan | ||
| SD constant | 4.05e-10 | 1.18e-08 |
| SD residual | 1.796 | .190 |
**p < .05. *p < 0.1.
Funding
The authors received no financial support for the research, authorship, and/or publication of this article.
Declaration of Conflicting Interests
The authors declared no potential conflicts of interest with respect to the research, authorship, and/or publication of this article.
Data Availability Statement
All data used was from publicly available sources – audited financial statements, and Australian Bureau of Statistics data.