
Abstract
Equitable education systems contribute to fostering thriving societies. However, decentralization reforms in school finance pose challenges to equity and social justice. Using longitudinal multilevel models, we examined the trends in equity of local education funding distribution in 250 Israeli local authorities from 2014 to 2020. Our findings revealed a consistently inequitable allocation: high-SES and majority-populated areas allocated double the resources compared with low-SES and minority-populated areas, with funding disparities increasing over time. These findings suggest the need for regulations governing local funding, particularly in diverse societies, to promote equity in education finance.
Introduction
The literature emphasizes equitable education as highly crucial for fostering thriving societies (e.g., BenDavid-Hadar 2025; Campbell-Green 2021; Rice 2024). Studies on education finance suggest that a positive relationship exists between equitable funding, that provides additional support to students with greater educational needs, and improving educational achievement distribution. Consequently, many countries, including Israel, allocate significant public resources to education to promote equity (e.g., BenDavid-Hadar 2025; Baker 2022; Jackson and Mackevicius 2024; Kolbe, Dhuey, and Doutre 2023; Lafortune and Schönholzer 2022; Needham and Houck 2021; Rice 2024). However, Israel’s educational achievement distribution, as seen in international assessments such as the Programme for International Student Assessment (PISA), shows substantial disparities compared with other Organization for Economic Co-operation and Development (OECD) countries (Dadon-Golan et al. 2019).
The fiscal decentralization literature highlights that local policy makers tailor public services to local preferences. This leads to efficiency gains through diversification of local public outputs, and to competition among jurisdictions, further incentivizing local governments to enhance responsiveness and meet local demands (Arends 2020; Fedelino 2010; Oates 2005; Tiebout 1956). However, decentralization can undermine efficiencies due to diseconomies of scale, local interest group pressures, and fiscal mismanagement (Adam, Delis, and Kammas 2014). Thus, it requires careful management to mitigate potential efficiency losses and widen educational disparities (Arends 2020; Diaz-Serrano and Meix-Llop 2019; Letelier and Ormeño 2018).
In Israel, although the central government primarily funds the public school system, there is a growing trend of local authorities (LAs) playing a more significant role in education finance. Some LAs allocate additional resources to education, whereas others face financial challenges in doing so. This decentralization poses challenges in achieving equity despite national policy goals (OECD 2017).
The objective of this study is twofold: First, it assesses equity and equality in the supplemental allocation of education funds by LAs across different characteristics from 2014 to 2020. Second, it examines the trends in equity and equality throughout the examined period. The following questions were addressed: (1) To what extent, if at all, is there equity and equality in the distribution of supplemental resources for education among different LAs? (2) What are the trends in equity and equality over the period under examination (2014–2020)? This investigation aims to provide valuable insights into the dynamics of supplemental education funding within the Israeli context and its implications for achieving equity. The findings are also relevant for other countries with diverse ethnic distributions and that seek to achieve educational equity while decentralizing their funding systems.
The paper is structured as follows: Section “Relevant Literature” reviews relevant research on education finance and equity. Section “Method” outlines the methodology, followed by Section “Findings,” which presents the results. Finally, Section “Discussion and Conclusions” discusses the findings and their policy implications. But first, the Israeli background will be introduced to the international reader.
The Israeli Background
The Israeli Local Authorities (LAs)
Israel has a single sub-national level of government comprising 257 LAs (OECD 2020). These administrative-geographic units operate under the oversight of the central government, providing LAs and state services as mandated by law (Ladner, Keuffer, and Bastianen 2022). Specifically, a central government oversees local taxation and requires LAs’ financial management to be approved by the Minister of the Interior (Beeri 2020; Israeli Parliament 2023; State Comptroller 2021).
Recent Israeli governance reforms emphasize the devolution of authority to LAs and deregulation across multiple sectors, including education (Government Secretariat 2021; Israeli Parliament 2023). This policy shift represents a significant departure from the historically centralized administrative structure, including the educational domain.
LAs’ revenue is largely derived from property tax. This tax consists of commercial non-residential property tax and residential property tax. On average, commercial property tax generates four times more revenue than residential property tax. As a result, LAs with extensive commercial zones can generate substantially higher self-generated revenue. However, LAs with low SES and predominantly minority populations face challenges in developing commercial non-residential area, thus limiting their potential commercial property tax revenue (Razin 2016; State Comptroller 2021).
The Israeli Education System
Israel is a young country with 9.7 million residents (geographically, it resembles the size of New Jersey). It is often described as a mosaic society, characterized by various ethnic groups and cultures. About 80% of its permanent residents are Jews (7.6 million), most of them immigrants or descendants thereof (from Western and Central Europe, North America, Africa [e.g., Ethiopia], and other Middle Eastern countries). The rest of the population consists of ethnic minorities, mainly Arab (2 million; Israel’s Central Bureau of Statistics 2023).
Education for all is a fundamental principle, enshrined in law for children aged 3–18 and who have resided in Israel for three months or more. Since it is a relatively young country, Israel’s compulsory education age range covers approximately 28.8% of the total population, highlighting the pivotal role of children in shaping its future.
The Israeli education system is public and emphasizes choice, offering the curriculum to be taught in either Arabic or Hebrew. All schools are publicly funded mainly by the central government. Israel’s education policy aims to reduce achievement gaps between the less advantaged and advantaged students. Within the Israeli context, less advantaged students are defined as students with low starting points (e.g., background characteristics, demographics, etc.; BenDavid-Hadar 2018). Most of the central government’s allocations to education are based on the principle of equality. In addition, there is a compensatory funding formula (based on the principle of equity). This formula comprises four elements that address deficiencies in students’ starting points using varied weights. This formula allocates additional resources to schools with higher percentages of students from families with low levels of parental education (40% weight), low-income families (20% weight), geographically peripheral locations (20% weight), and new immigrants (20% weight; for a further discussion, see: BenDavid-Hadar 2016, 2018).
However, Israel students’ achievement distribution in international examinations such as PISA and Trends in International Mathematics and Science Study (TIMSS) is characterized by large gaps, compared with other OECD countries (e.g., Dadon-Golan et al. 2019; von Davier et al. 2024). Although an equitable education finance policy from the central government is intended to support less advantaged students, LAs have recently increasingly supplemented resources for their schools without a similar policy (Meoded and BenDavid-Hadar 2025; Blass, Zussman, and Tzur 2019; Razin 2016).
Local Education Finance
The Israeli education system is public and largely funded by the central government. However, recently LAs have also been allocating supplemental resources to public schools within their jurisdictions (66%, 34%, respectively; OECD 2024). A primary source of LAs’ supplemental resources is commercial non-residential property tax (State Comptroller 2021). Israel’s educational landscape operates within a governance framework where supplementary funding flows through channels largely unbounded by central directives. The absence of defined parameters for local financial participation creates a mosaic of educational realities that vary considerably from region to region. Wealthier SES areas often use local tax revenues to supplement government allocations for education, whereas lower SES LAs face limitations due to lower local tax revenues, consequently restricting their ability to provide additional funding (Blass, Zussman, and Tzur 2019). This financial constraint hinders the LAs’ capacity to develop education funding policies beyond the Ministry of Education’s standards. The discrepancy in supplemental allocation among LAs highlights the tension between the equity aspirations of the central Ministry of Education and the regressive nature of LAs’ funding, thus motivating this research.
Relevant Literature
Fiscal Decentralization and Education
Fiscal decentralization in public finance allows local policymakers to tailor public services to local preferences, leading to efficiency gains through diverse local outputs and inter-jurisdictional competition. This competition enhances governmental responsiveness to local needs, while theoretical models suggest that populations self-sort across jurisdictions based on public service preferences (Arends 2020; Fedelino 2010; Oates 2005; Tiebout 1956). In contrast, central governments often face information constraints that limit their ability to accurately assess local needs and preferences (Arends 2020; Fedelino 2010).
However, decentralization can also undermine public sector efficiency due to diseconomies of scale, undue influence from local interest groups, and fiscal mismanagement (Adam, Delis, and Kammas 2014). Therefore, ensuring its effectiveness requires careful oversight to mitigate inefficiencies and prevent regional disparities. Empirical evidence from OECD countries suggests that while moderate fiscal decentralization enhances educational service efficiency, excessive decentralization may require policy adjustments, particularly when local special interests exert disproportionate influence (Arends 2020; Diaz-Serrano and Meix-Llop 2019; Letelier and Ormeño 2018).
In education as well, regional disparities in education spending across countries are shaped by governmental policy and jurisdictional authority. For example, in Australia, spending decisions are split between federal and state jurisdictions, leading to persistent inequalities across different regions (Nikolai, Kriesi, and Leemann 2022; Sinclair and Savage 2024). Additionally, fiscal decentralization often forces local governments to reduce education spending in response to voter preferences, often resulting in reduced investment (Garritzmann, Röth, and Kleider 2021; Letelier and Ormeño 2018; Park 2022).
The central governments have the authority to enforce uniform education standards and mitigate geographical inequalities (Arends 2020). However, variations in political interpretations and implementations, based on social context and historical factors as well as the power dynamics of the actors, can affect these regulations (Nikolai, Kriesi, and Leemann 2022). Strengthening fiscal equalization between local governments and adopting a selective approach to decentralization can enhance fiscal fairness and the delivery of education services as well as improve efficiency (Letelier and Ormeño 2018).
Regarding decentralization’s impact on student achievement, research indicates mixed results. Some studies suggest that decentralization improves government performance in OECD countries, benefiting educational outcomes and public sector efficiency (Diaz-Serrano and Meix-Llop 2019; Letelier and Ormeño 2018). However, Kameshwara et al. (2020), in their analysis of PISA mathematics scores across 65 countries, found that decentralization did not significantly affect student achievement.
Equity and Equality in Education Finance
School finance equity represents a funding approach whereby educational resources are differentially allocated based on students’ starting points, prioritizing additional support for those students with greater educational needs (e.g., BenDavid-Hadar 2025; Baker 2024; Berne and Stiefel 1999; Downes and Stiefel 2012; Jackson and Mackevicius 2024; Kolbe, Dhuey, and Doutre 2023). Recent studies identified a positive causal relationship between equitable resource allocation and improved education outcomes, especially for the less advantaged students (Baker 2024; Jackson and Mackevicius 2024). Education enhances economic prosperity, societal well-being, and promotes thriving communities (BenDavid-Hadar 2025; Campbell-Green 2021). Thus, an equitable education finance policy can improve social cohesion (Baker 2024).
The research literature identifies several concepts of equity in resource allocation to education (e.g., BenDavid-Hadar 2025; Baker 2024; Berne and Stiefel 1984, 1999; Jackson and Mackevicius 2024; Kolbe, Dhuey, and Doutre 2023; Needham and Houck 2021; Owings and Kaplan 2020). This study specifically examines two key concepts: horizontal equity and vertical equity, which will be explained in detail below.
Horizontal equity means that students who are alike should be treated similarly. According to this principle, students in the same grade (e.g., 10th grade), program, or area of study are entitled to similar levels of resources (Abbott, Houck, and Lauen 2022; Baker and Green 2012; Berne and Stiefel 1984, 1999; Chu 2019; Knight and Toenjes 2020; Odden and Picus 2008). Indicators used to measure horizontal equity include, among other measures, the McLoone index (e.g., BenDavid-Hadar 2025; Kolbe, Dhuey, and Doutre 2023; Needham and Houck 2021; Owings and Kaplan 2020) and the coefficient of variation (CV; e.g., Baker and Green 2012; Chu 2019; Odden and Picus 2008).
The vertical equity principle states that different groups of students should be treated differently, specifically through higher allocations to those students with greater educational needs, such as those students experiencing poverty, learning disabilities, or immigration-related barriers. In practice, this concept is implemented through mechanisms like the Weighted Student Funding (WSF) models in the U.S. and the differential per-student funding formulas in Israel, where the amount of funding is determined by the depth of the students’ needs (Abbott, Houck, and Lauen 2022; Baker 2024; Baker and Green 2012; Berne and Stiefel 1984, 1999; Chu 2019; Knight and Toenjes 2020; Odden and Picus 2008). The analysis of vertical equity can be measured through various statistical methods, including multiple regression, ordinary least squares (OLS) regression, and the Spearman correlation (e.g., Needham and Houck 2021; Odden and Picus 2008; Stiefel and Sarah 2015).
Another principle of proper allocation in education is equality. It is defined as equal resource allocation to all students, regardless of their individual needs (Berne and Stiefel 1999; Houck and Eom 2012; Minow 2021; Thomas, Wang, and Fan 2002). Equality is measured using tools such as standard deviation, ratios, the Theil Index, and the Gini coefficient. This study assessed equality using the Gini coefficient, consistent with established practices in education finance literature (e.g., Needham and Houck 2021). This measure provides a comprehensive evaluation of distributional equality across the entire population.
Equity and Equality in Local Education Finance
Education finance at the local level primarily comes from local property and sales taxes (Fisher 2022; Green, Baker, and Oluwole 2020; Ladner, Keuffer, and Bastianen 2022). As a result, differences between LAs might exacerbate equity issues. For example, research from Australia revealed significant funding disparities in public schools between states (Sinclair and Savage 2024). Similarly, Canada has substantial disparities in funding. However, these disparities are related to fundraising gaps between schools in both affluent and low-income neighborhoods (Winton 2019).
Disparities in local education funding are often related to ethnicity/race, socio-economic status (SES), and geographical location. The following sub-sections address this issue.
Local Education Funding and Ethnicity/race
Disparities in education funding may also be influenced by ethnicity/race, where districts with more students of color receive less funding than those with fewer minority students. This is due to differences in the taxable property wealth, since local public-school districts heavily rely on property taxes, leading to race-based disparities in school funding due to differences in district wealth. Districts with more students of color typically have less revenue capacity compared with nearby majority-white districts. Consequently, these districts have a limited local capacity to generate revenue for their schools and need additional resources to achieve a similar educational performance (Baker 2022; Green, Baker, and Oluwole 2020; Knight and Mendoza 2019; Morgan and Amerikaner 2018).
Local Education Funding and Poverty
Disparities in education funding may also be influenced by SES, where high-income students attend affluent districts with more resources, whereas low-income students attend under-resourced schools. Hence, there is significant variation among states regarding the relationship between districts and socio-economic conditions (Jang and Reardon 2019; Morgan and Amerikaner 2018). Moreover, income inequality and the emphasis on education funding policies widen the SES gap and may exacerbate student achievement gaps and perpetuate poverty (Reardon et al. 2018).
Local Education Funding and Geographical Location
Disparities in education funding may also be influenced by geographic location (e.g., peripherality/rural, inner city), where rural and peripheral districts face unique challenges, such as student sparsity and geographic isolation, compared with urban areas. These challenges include high transportation costs due to dispersed populations, as well as elevated expenses for education infrastructure and teaching staff relative to the number of students, which generally strain school budgets (Goldhaber et al. 2020; Kolbe et al. 2021).
Although the Israeli central government provides substantial and equitable funding to reduce achievement gaps, the growing role of LAs in supplementing resources presents a critical challenge. This decentralized approach risks exacerbating educational inequalities. Although research exists on fiscal decentralization and education finance, there is limited empirical evidence on how these dynamics impact equity and equality in local education funding, particularly regarding Israel’s diverse populations and education levels. This study aims to bridge this gap by investigating equity in education finance. More specifically, the horizontal and vertical equities in the allocation of supplemental resources from LAs to the school system are analyzed in their jurisdiction from 2014 to 2020.
We hypothesize that the characteristics of LAs play an important role in determining the supplemental allocation per student. Specifically, LAs with predominantly majority group populations, high SES, and central geographic locations will allocate more equitable and equal supplemental resources. Additionally, we hypothesize that the disparities in the equity and equality of these allocations have been reduced from 2014 to 2020.
Method
This study is part of a broader Israeli Science Foundation-funded project spanning 2020–2024, which examined the policy implications of fiscal decentralization of local education in Israel (BenDavid-Hadar 2020). The extent of equity and equality in supplemental education resources was analyzed using financial reports from each participating LA, along with trends over the last half decade. This longitudinal perspective helps assess progress toward achieving equity in education resource allocation.
Data
The datasets include educational supplemental allocations of LAs. Reports were analyzed from the Israel Ministry of Interior (n.d.), the Israel Central Bureau of Statistics (ICBS), and the Israel Ministry of Education (n.d.). Data were used from the available reports of 246 LAs for 2014, and 250 LAs for 2020 (about 96% of the LAs in Israel). Full reports are available upon request. The supplemental allocation of the local education was computed by subtracting the LA’s revenues in the “State Services Education” budget chapter and “Own Revenues for Education” from payments for “State Services Education,” and then calculating the ratio of supplemental allocation according to the number of students aged 3–18. Data were collected from 2014 to 2020, to capture trends in equity and inequity in LAs’ allocation of educational resources.
Instruments
The datasets include the LAs’ characteristics, which constitute the research variables in the analysis:
This study has several limitations because the LAs’ economic capabilities are affected by local taxes. Although socioeconomic status is measured based on the residents’ wealth, the local authorities’ ability to supplement educational allocations might be constrained by local revenue, primarily from non-residential property tax. Potentially, this might limit the findings on equity and equality in supplemental education funding. Despite these limitations, the findings remain robust due to the established relationship between Israeli local authorities’ economic capabilities and their residents’ socioeconomic status (State Comptroller 2021).
Research Variable.
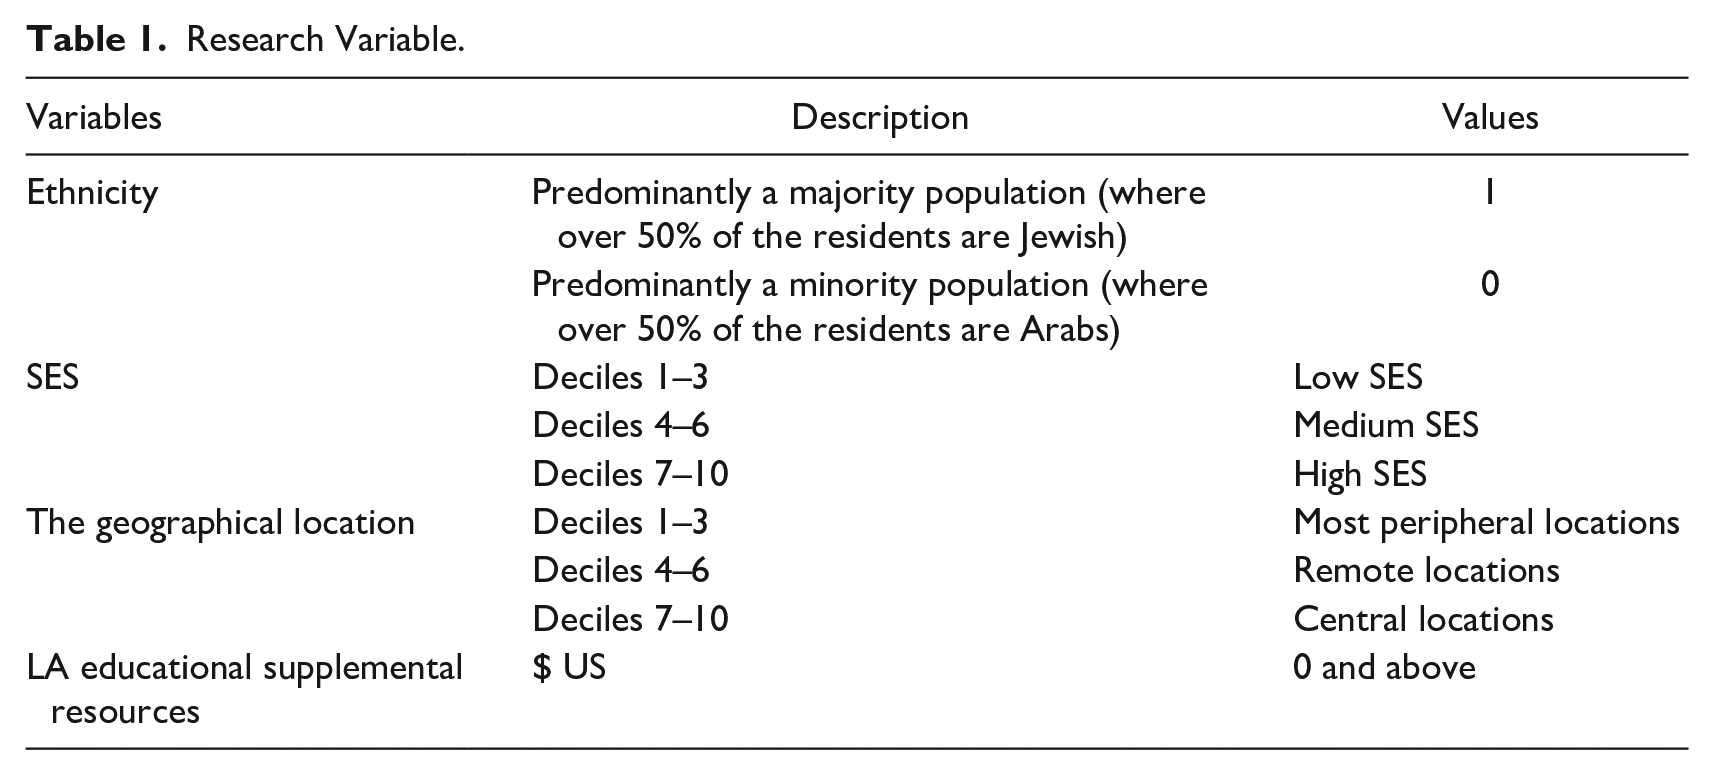
We analyzed horizontal and vertical equity using the work of Berne and Stiefel (1999; Downes and Stiefel 2012; Kolbe, Dhuey, and Doutre 2023). Horizontal equity is measured using the McLoone index and the coefficient of variation (CV), and vertical equity is analyzed using multilevel linear models (MLM). In addition, we analyzed equality using the Gini coefficient (Berne and Stiefel 1999). Finally, we analyzed the trends in equity and equality using MLM.
Data Analysis
This study analyzes horizontal and vertical equity as conceptualized by Berne and Stiefel (1984, 1999; BenDavid-Hadar 2025; Baker 2024).
In our setting, let yij be the LAs’ supplemental allocation per student for budget year i in LA j. The LAs’ supplemental allocation per student is a linear function of a series of covariates (xij) that can be at the budget year and the LA levels plus a random error (εij):


In equation (2), the random part
The “intra-class correlation coefficients” (ICC) is the ratio of one level of variance to the total variance. Here, we can measure ICC at the LA level, which is the proportion of the variance due to differences between LAs. To be more precise, it is defined as:

Considering the ICC at the LA level (ρ3) and the variance between LAs (σ2vo), when the LA-level variables (the ethnic distribution, SES, and geographical region) are included in the model and they have some explanatory power, the variance components are expected to decrease, because covariates can explain a fraction of the LA-level variance, which was entirely attributed to unobserved LA characteristics.
Thus, our main interest lies in checking the explanatory power of the variables related to the background characteristics of the LAs, and in assessing how much of the variation observed at the LA level can be explained by these covariates; the remaining LA variance is due to other characteristics (such as the psychological aspects of the decision-making process).
Findings
Mind the Gap
The mapping of inter-LA gaps in supplemental allocation to education is generally presented based on ethnicity. Within each ethnic group, cross-sections are further delineated according to SES and geographic location.
We found large gaps in the average supplemental allocation favoring LAs in which most of the residents belong to the majority group. Specifically, in 2020, the average supplemental allocation per student in LAs populated predominantly by the majority was more than three times higher than in LAs with predominantly minority group populations ($715 and $245, respectively, Table 3).
This gap was narrowed by a third between 2014 and 2020. During this period, the average supplemental allocation in LAs with predominantly minority group populations was increased by an annual average gain of 4.2%, compared with 2.5% in LAs with predominantly majority group populations (Tables 2 and 3). However, it remains significantly lower compared with LAs with predominantly majority populations.
Horizontal Equity and Equality Statistics for LAs’ Supplemental Allocation Resources per Student in 2014.
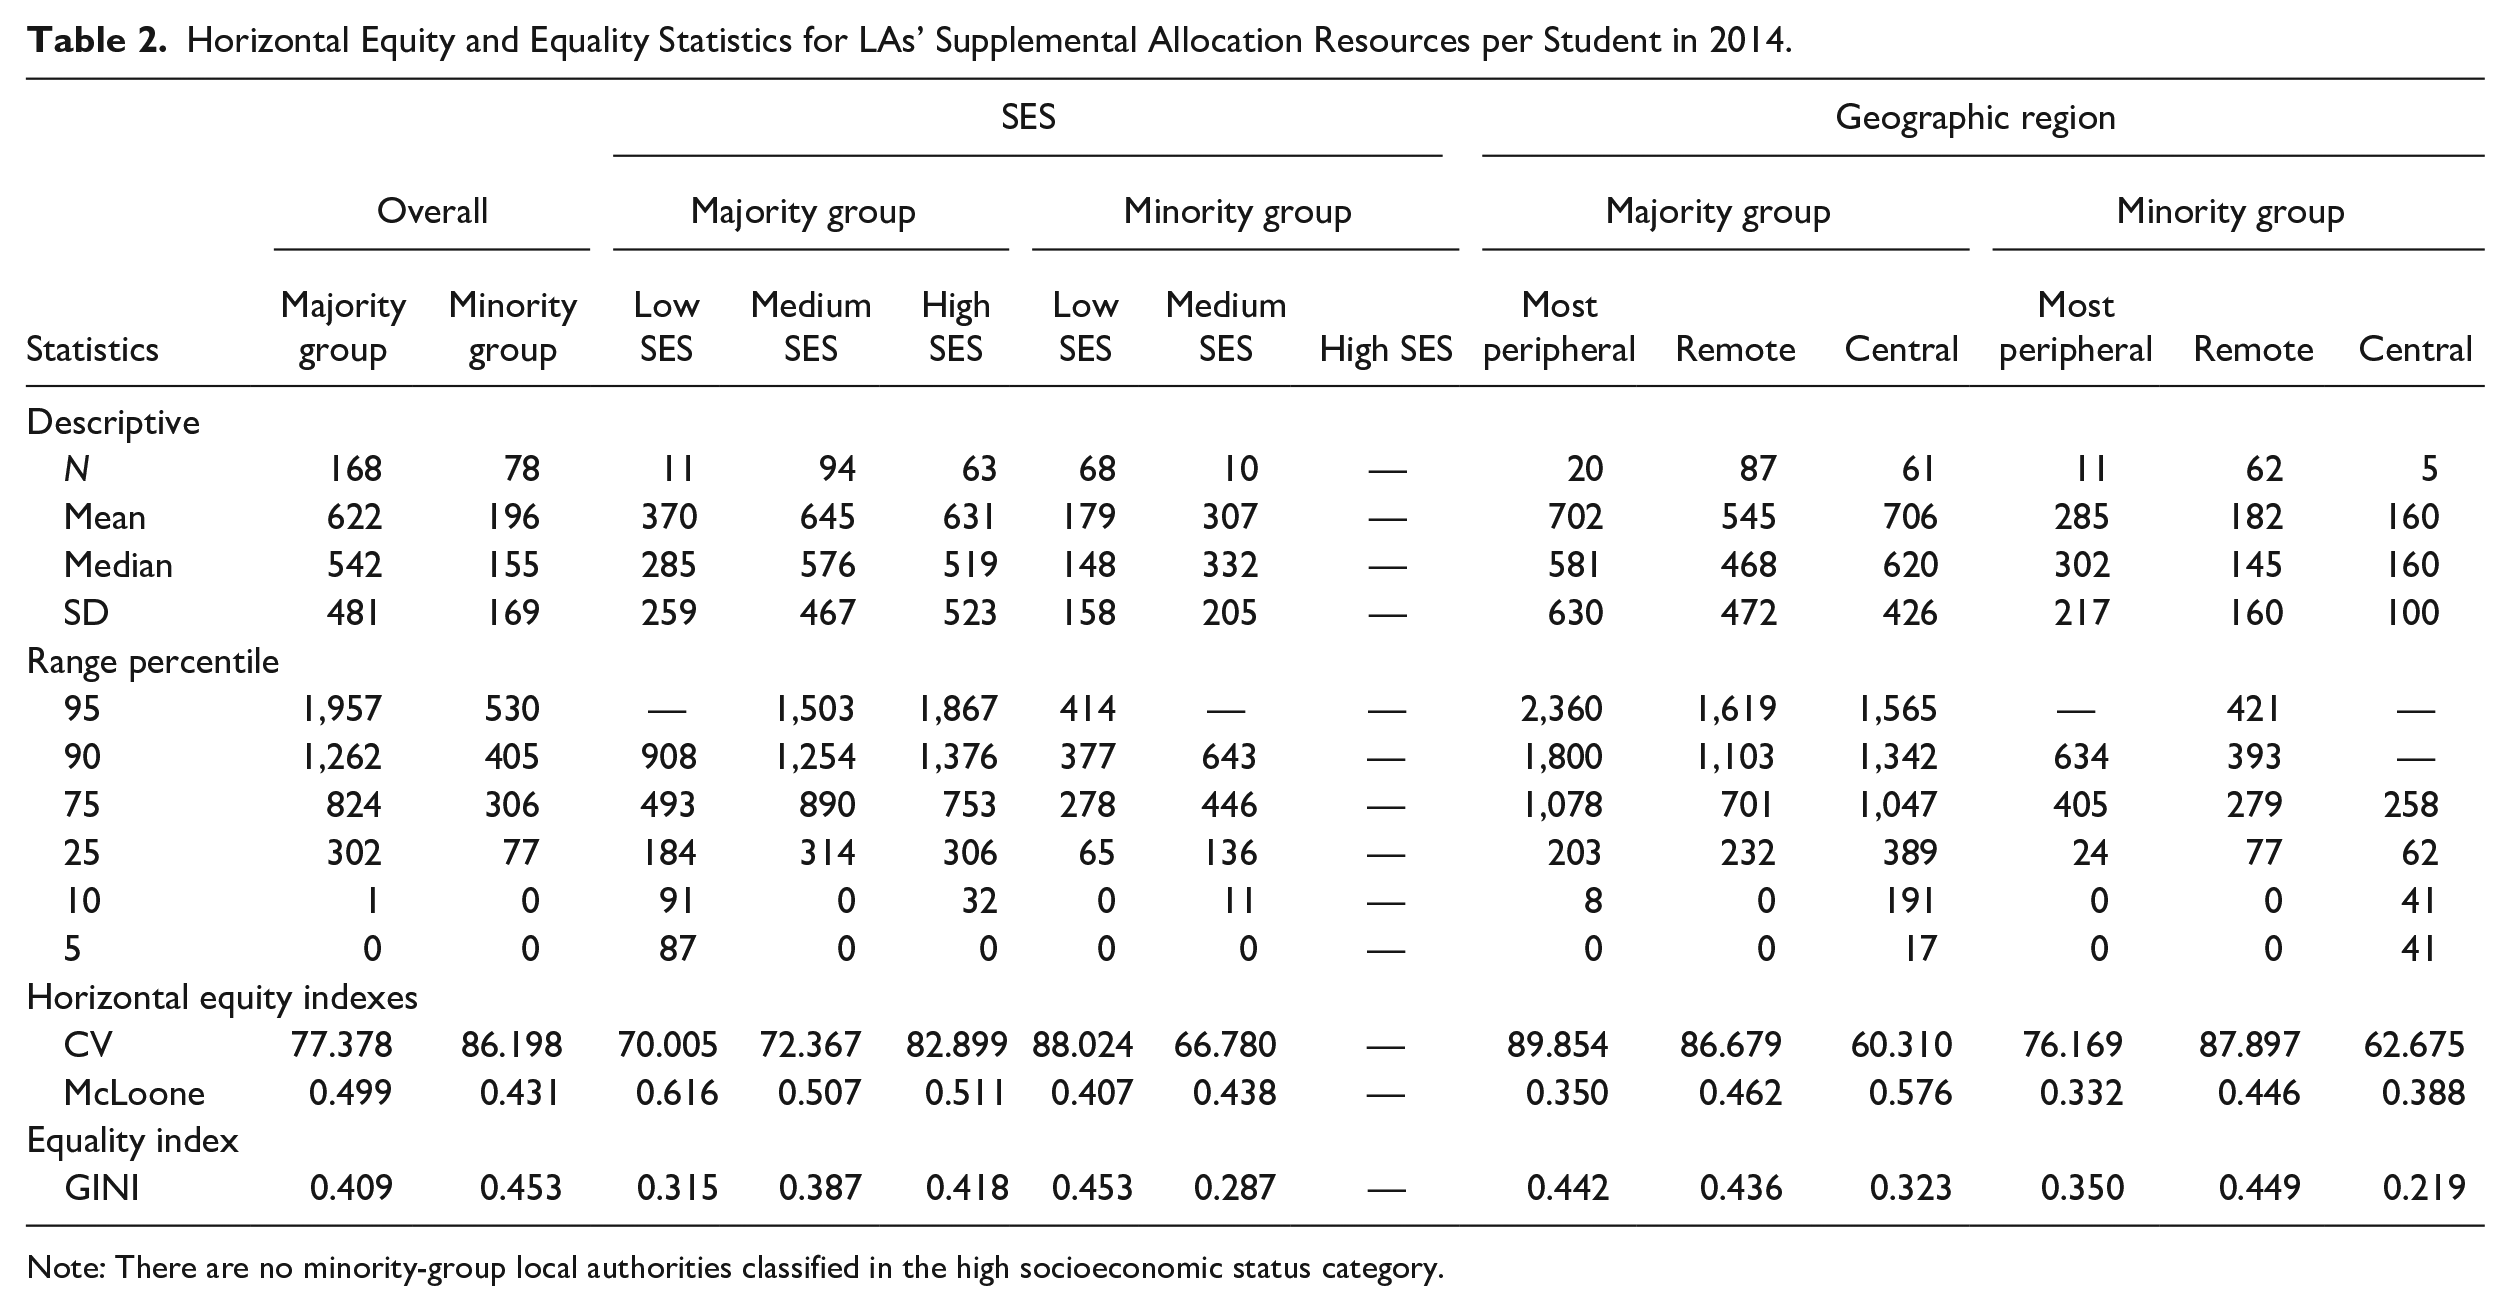
Note: There are no minority-group local authorities classified in the high socioeconomic status category.
Horizontal Equity and Equality Statistics for LAs’ Supplemental Allocation Resources per Student in 2020.
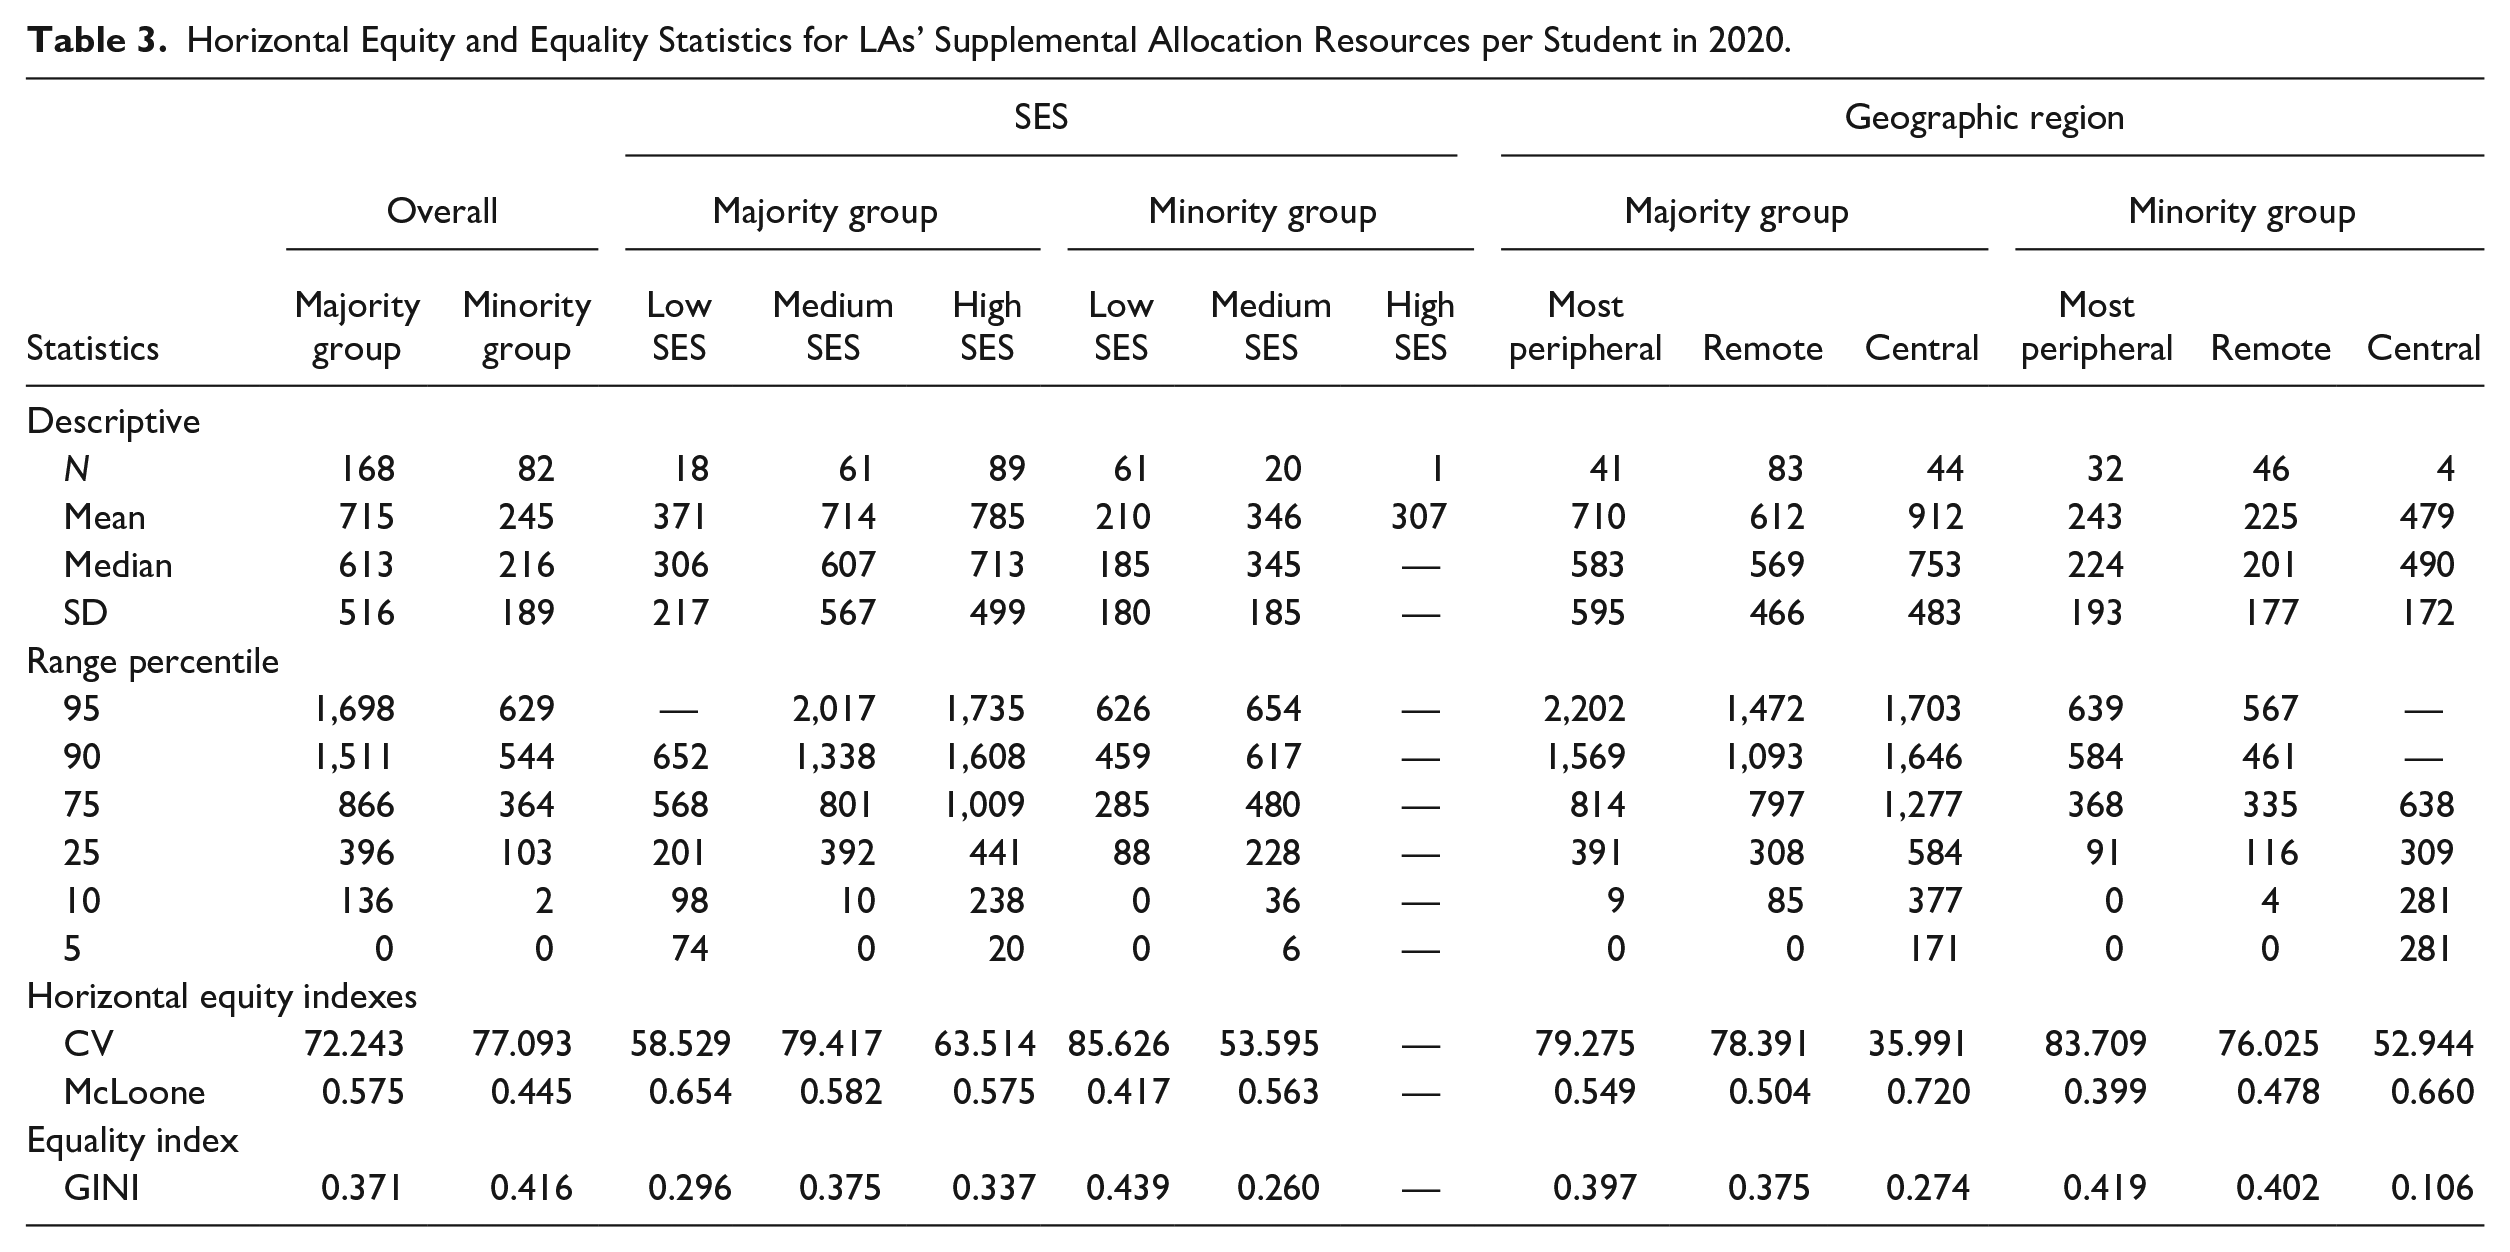
In addition, we found large gaps in the average supplemental allocation favoring high SES LAs in both ethnicities. However, these gaps are more dominant in LAs with predominantly majority group populations. Specifically, in 2020, the average supplemental allocation of high SES LAs with predominantly majority group populations was more than twice as high as the low SES LA allocation ($785 vs. $371, respectively, Table 2). Interestingly, between 2014 and 2020, these gaps were narrowed in LAs with predominantly minority group populations by an annual average decrease of 4.2%, compared with an annual average gain of 6.8% in LAs with predominantly majority group populations (Tables 2 and 3). However, it remains significantly lower than that of the high SES LAs.
In addition, large gaps were found in the average supplemental allocation favoring LAs located in the center in both ethnicities. However, these gaps are more dominant in LAs with predominantly minority group populations. Specifically, in 2020, the average supplemental allocation of centrally located LAs with predominantly minority group populations was more than twice as high as the most peripheral region LAs ($479 vs. $243, respectively, Table 3). These gaps were increased favoring the central region in both ethnicities’ LAs between 2014 and 2020. During this period, the gap between central and the most peripheral location was increased by an annual average gain of 190% in LAs with predominantly majority group populations, compared with 28% in LAs with predominantly majority group populations (Tables 2 and 3). Importantly, this highlights a substantial gap in allocation between LAs based on their geographic region.
To What Extent is the Allocation Equitable and/or Equal?
To address our first research question, a series of analyses of horizontal equity and equality in LAs’ supplemental allocation were conducted. The analyses are presented by ethnicity (predominantly majority or minority group populations). In addition, within each ethnic group, cross sections are presented according to SES and geographic region. The horizontal equity is analyzed using the McLoone index and the CV. The equality is analyzed using the Gini coefficient.
Horizontal Equity of Supplemental Resource Allocation
Interestingly, large gaps were found in the horizontal equity of the LAs’ supplemental allocation favoring LAs with predominantly majority group populations. Specifically, in 2020, the horizontal equity in the allocation of LAs with predominantly majority group populations was higher than in LAs with predominantly minority group populations (CV = 72.2 vs. 77.1, McLoone = 0.6 vs. 0.4, respectively; Table 3). This gap was narrowed and reduced between 2014 and 2020 favoring LAs with predominantly majority group populations. During this period, the horizontal equity in the supplemental allocation of LAs with predominantly majority group populations increased by a rate close to 15%, compared with a minimal increase in LAs with predominantly minority group populations (Tables 2 and 3).
Additionally, large gaps were found in the horizontal equity of the supplemental allocation across LAs’ SES. LAs with predominantly majority group populations favored low SES, whereas LAs with predominantly minority group populations favored medium SES. Specifically, in 2020, the horizontal equity in the allocation of LAs with predominantly majority group populations with a low SES was higher than the high SES LAs (CV = 58.2 vs. 63.5, McLoone = 0.7 vs. 0.6); this is in contrast to LAs with predominantly minority group populations, where the medium SES LAs were higher than the low SES LAs (CV = 53.6 vs. 85.6, McLoone = 0.6 vs. 0.4, respectively; Table 3). However, this gap was narrowed and reduced between 2014 and 2020 favoring high SES LAs with predominantly minority group populations. During this period, the horizontal equity in the supplemental allocation of high SES LAs with predominantly minority group populations increased by 28% more than the minimal increase in high SES LAs, and it was higher than that of LAs with predominantly majority group populations (Tables 2 and 3).
Furthermore, a lower horizontal equity in the supplemental allocation was found favoring the central geographic region LAs in both ethnicities, with more dominance in predominantly majority group population LAs. Specifically, in 2020, the horizontal equity in the allocation of the central region LAs was higher than most peripheral region LAs in LAs with predominantly majority and minority group populations (CV = 79.3 vs. 36.0, McLoone = 0.5 vs. 0.7; CV = 83.7 vs. 52.9, McLoone = 0.4 vs. 0.7, respectively). The horizontal equity increased significantly for LAs with predominantly minority group populations favoring central regions, between 2014 and 2020, compared with an increase in the horizontal equity of most peripheral LAs with predominantly majority group populations (Tables 2 and 3).
Equality of Supplemental Resource Allocation
There were large gaps in the equality of the LAs’ supplemental allocation favoring predominantly majority group populations. Specifically, in 2020, the equality in the allocation of LAs with predominantly majority group populations was 12% higher than in LAs with predominantly minority group populations (Gini coefficient = 0.37 and 0.42, respectively; Table 3). However, this gap was narrowed and reduced between 2014 and 2020 in both ethnicities. During this period, equality in the supplemental allocation of LAs with predominantly majority/minority group populations increased at similar rates (10% and 9%, respectively; Tables 2 and 3).
Additionally, there were large gaps in the equality of the supplemental allocation across LAs’ SES. LAs with predominantly majority group populations favored low SES, whereas LAs with predominantly minority group population favored medium SES. Specifically, in 2020, the equality in the allocation of medium SES LAs was higher than that of the low SES LAs (Gini coefficient = 0.26 vs. 0.44, respectively; Table 3). The equality increased slightly for medium SES LAs between 2014 and 2020, compared with low SES LAs (Tables 2 and 3). This highlights a substantial gap in allocation between LAs based on their SES.
Furthermore, the equality was lower in the supplemental allocation of most peripheral regions in both ethnicities, with more dominance in LAs with predominantly minority group populations. Specifically, in 2020, the equality in the allocation of central region LAs was higher than that of most peripheral LAs (Gini coefficient = 0.27 vs. 0.40, 0.10 vs. 0.42, respectively; Table 3). During this period, the equality increased across all geographical locations in LAs with predominantly majority group populations, whereas a mixed trend was observed in LAs with predominantly minority group populations (Tables 2 and 3). Hence, regarding the lower horizontal equity and the equality of the most peripheral LAs, there are significant gaps in the horizontal equity and the equality between LAs that differ in their geographic region.
Overall, our expectations about the fundamental role of LAs’ characteristics in shaping the supplemental allocation per student were corroborated by our data. The results confirm our hypothesis regarding how the LAs’ ethnicity distribution, SES, and the geographic region’s characteristics contribute to an equitable and equal supplemental allocation. Thus, LAs with a predominantly majority group population, high SES, and central geographic region allocate a more equitable and equal supplemental allocation.
The Empirical MLM Longitudinal Model Showing the Extent of the Trends in Vertical Equity Throughout the Examined Years
Vertical Equity of Supplemental Resource Allocation
To completely address our first research question, the vertical equity in the LAs’ supplemental allocation was analyzed. The analysis is presented here by ethnicity (predominantly majority or minority group populations). In addition, within each ethnic group, cross sections are presented according to SES and geographic region. The vertical equity is analyzed using the MLM analysis.
Importantly, there were large gaps favoring LAs with predominantly majority group populations. Specifically, supplemental allocation is positively associated with ethnic distribution (β = 0.67**, Table 4, Model 3, Column 5). This means that LAs with predominantly majority group populations allocate more supplemental allocation per student than LAs with predominantly minority group populations.
LAs’ Multilevel Analysis of VE in the Supplemental Allocation over Time.
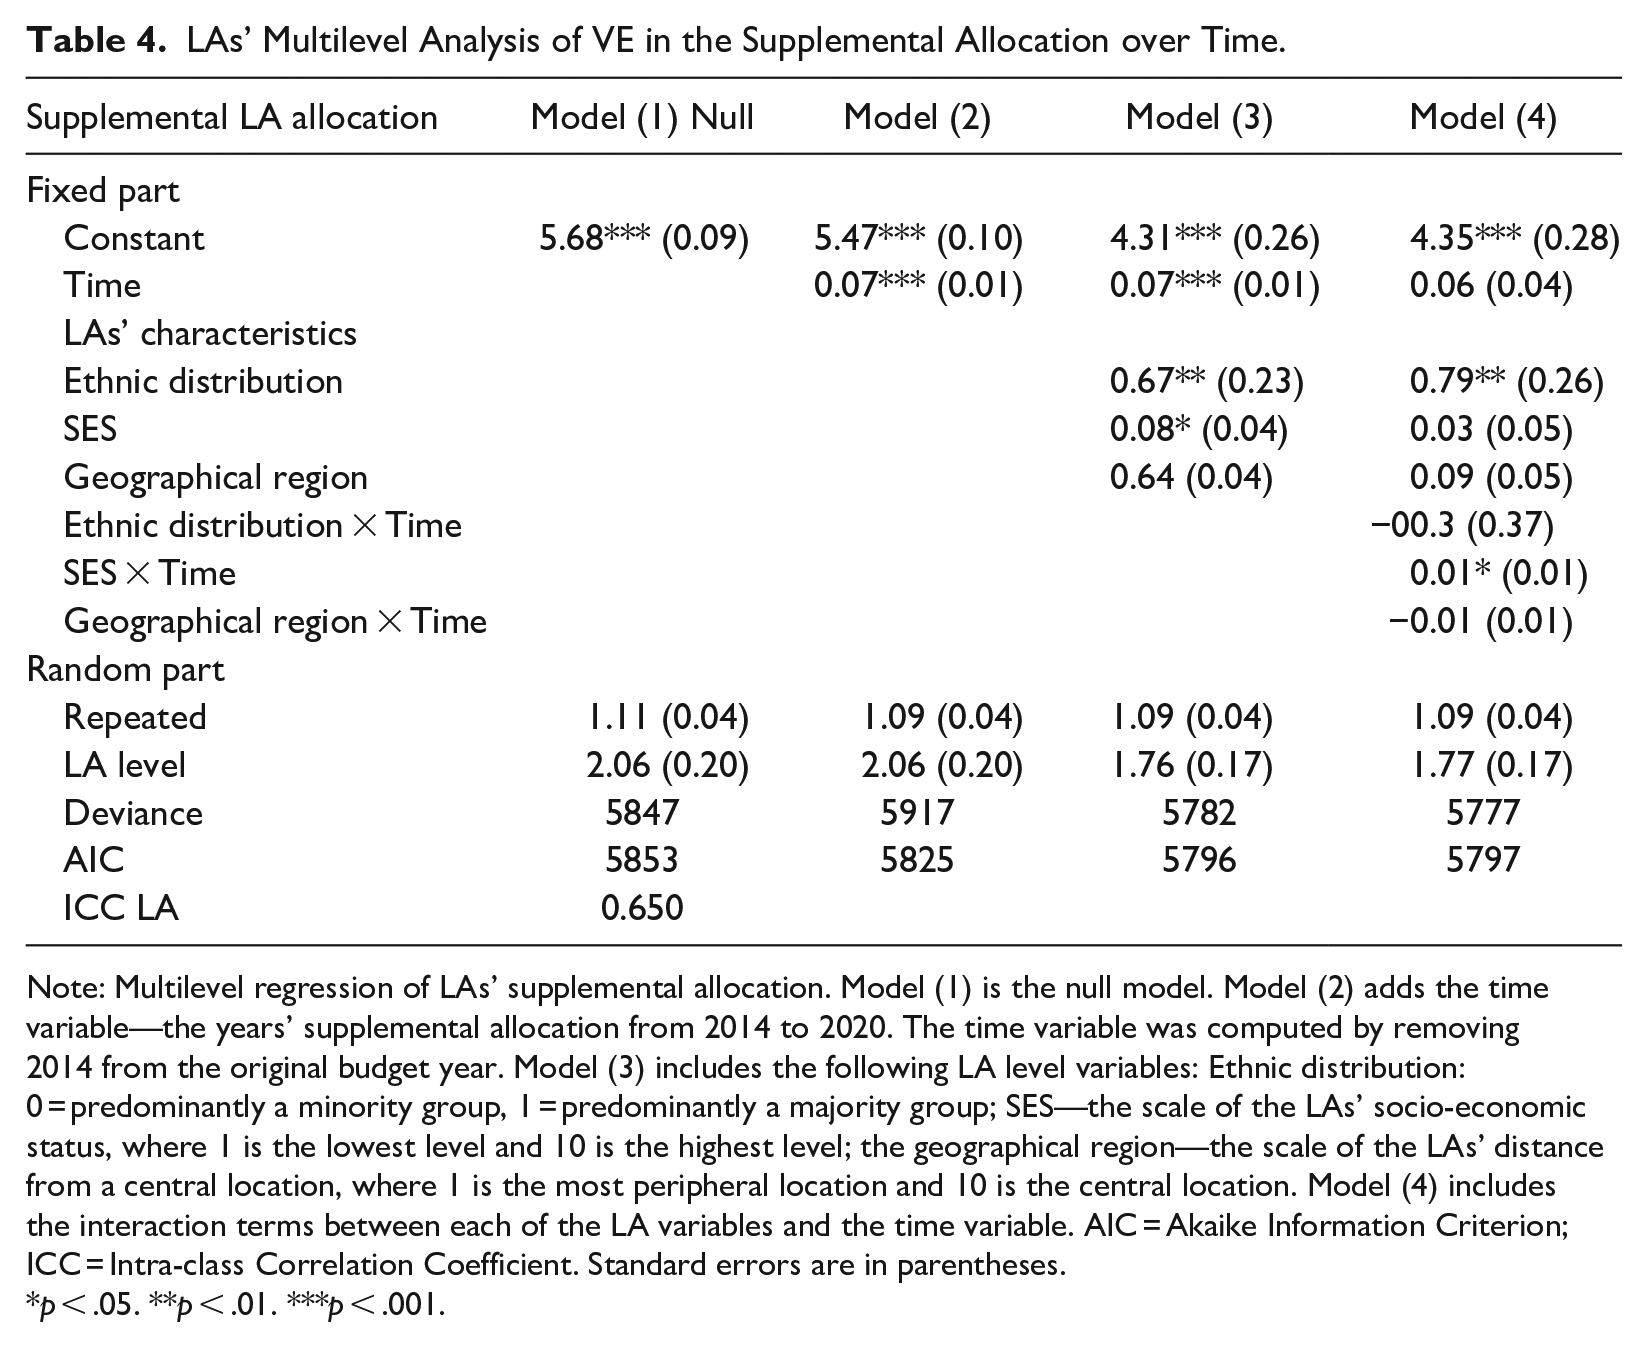
Note: Multilevel regression of LAs’ supplemental allocation. Model (1) is the null model. Model (2) adds the time variable—the years’ supplemental allocation from 2014 to 2020. The time variable was computed by removing 2014 from the original budget year. Model (3) includes the following LA level variables: Ethnic distribution: 0 = predominantly a minority group, 1 = predominantly a majority group; SES—the scale of the LAs’ socio-economic status, where 1 is the lowest level and 10 is the highest level; the geographical region—the scale of the LAs’ distance from a central location, where 1 is the most peripheral location and 10 is the central location. Model (4) includes the interaction terms between each of the LA variables and the time variable. AIC = Akaike Information Criterion; ICC = Intra-class Correlation Coefficient. Standard errors are in parentheses.
p < .05. **p < .01. ***p < .001.
In addition, there was a large gap favoring high SES LAs (Table 3). Specifically, high SES LAs allocate supplemental resources twice as high than do low SES LAs. Our expectations about the fundamental role of LAs’ characteristics in shaping the supplemental allocation per student were corroborated by our data. The results partially confirm our hypothesis regarding how LAs’ ethnicity distribution and SES characteristics contribute to an equitable supplemental allocation.
Multilevel Analysis
To address our second research question, we conducted a series of MLMs to accommodate the nested data structure by examining the growth in the supplemental allocation per student over time. We also tried to determine whether the LAs’ characteristics contribute to predicting the supplemental allocation and whether the growth rate is moderated by the LAs characteristics (i.e., the characteristics of the Time * LAs’ interactions). The LAs’ characteristics that were tested were the predominant population group (the ethnic distribution), SES, and the geographical region. Estimates of the multilevel models are presented in Table 4. Model (1) presents the estimates for the null model. However, this model does not include covariates other than a constant and allows us to obtain the proportion of variability, calculated using the variances estimated for the errors (a random effect) over time and between LAs. More specifically, Model (1) is used as a benchmark to see what happens to the decomposition of the variance when time and the LAs’ characteristics are incorporated in subsequent regression models. Model (2) analyzes how the time variable affects the supplemental allocation from 2014 to 2020. The time variable was computed by removing 2014 from the original budget year. Model (3) analyzes how the LAs’ characteristics affect the supplemental allocation by incorporating the following factors in the model: ethnic distribution, SES, and geographical region. Model (4) analyzes the interaction terms of the time variable with the LAs’ characteristics in order to test the variation in allocation over time (i.e., the growth rate), depending on the different characteristics of the LAs. 1
Table 4 summarizes the supplemental allocation over time using the MLM analysis.
Table 4 shows that overall, the decrease in the deviance and the AIC index reveals the superiority of models 2–4, confirming that time as well as the LAs’ characteristics and the interaction term of the LAs’ characteristics’ * time predict the variation in supplemental allocation resources; therefore, they should be considered.
In model (2), in which the time variable was added, there was a positive significant coefficient, meaning that there is an increase in the supplemental allocation over time. These results confirm our hypothesis that a positive relationship exists between the time variable and the average LA supplemental allocation per student.
In model (3), in which the LAs’ characteristics were added, there were positive significant coefficients of the ethnic distribution and SES, meaning that students who live in LAs with a predominantly majority group have higher supplemental allocations per student compared with those who live in LAs with a predominantly minority group. In addition, the higher the SES of the LA, the higher the supplemental allocation per student. Note that the geographical region was not found to be a significant predictor of the supplemental allocation per student.
In model (4), in which the interaction terms were added, there was a positive significant coefficient of the interaction term “SES * time,” suggesting that the rate of growth in the supplemental allocation per student over time was faster for higher SES LAs compared with lower SES LAs. This finding is contrary to what was proposed in the research hypothesis. Note that the remaining interaction terms were not found to be significant.
Our goal was to determine whether those students living in LAs characterized by predominantly a majority group, a higher SES, and a central geographical region allocate higher sums than others and whether the effects of these LAs’ characteristics on the supplemental allocation change over time. The LAs’ intra-class correlation coefficient (ICC) of the null model is 0.650, meaning that 65% of the total variance is due to cross-LA variability.
After considering the time variable, added in model (2), we verified that the variance component, representing variation over time, diminished from 1.11 (estimated in model (1)) to 1.09 (estimated in model (2)), meaning that the time variable can explain 2.0% of the variation in the average supplemental allocation per student over time. In addition, considering the LAs’ characteristics, added in model (3), we verified that the variance component representing variation between LAs diminished from 2.06 (estimated in model (2)) to 1.76 (estimated in model (3)), meaning that the LAs’ characteristics can explain 17.02% of the LAs’ variation in the average supplemental allocation per student. In addition, considering the interaction terms, added in model (4), the variance component representing how the LAs’ characteristics affect the change in the supplemental allocation over time diminished from 2.06 (estimated in model (1)) to 1.77 (estimated in model (4)). Overall, the results indicate that our model explains 16.53% of the variance in the supplemental allocation per student.
Regarding the main purpose of this analysis, the results suggest that the LAs’ characteristics can explain differences in their average supplemental allocation per student and that the explanatory power of these characteristics is greater than the explanatory power of the time variable. As expected, the LAs of a predominantly majority group allocate more supplemental allocation per student. In addition, the LAs’ SES explains the average supplemental allocation per student, favoring LAs that have a higher SES. In contrast, our results also show that the geographical region has a non-significant effect on the LAs’ supplemental allocation per student.
Overall, our expectations about the fundamental role of the LAs’ characteristics in shaping the supplemental allocation per student were corroborated by our data. The results partially confirm our hypothesis that a positive relationship exists between ethnic distribution and SES and the supplemental allocation per student. The interaction term between the LAs’ characteristics and the time variable was found to be significant for SES only, indicating that the rate of growth in the supplemental allocation per student over time was faster for higher SES LAs than for lower SES LAs.
Discussion and Conclusions
This paper examines the extent and trend of the equity and equality of LAs’ supplemental allocation for education from 2014 to 2020. First, our findings revealed an inequality over time based on the LAs’ financial capabilities: wealthier and majority populated LAs or those in central regions allocated more supplemental allocation per student. Our results are in accordance with previous research indicating that property tax revenue is a significant component in the LAs’ budgets, which can vary from one LA to another, and contributes considerably for education. Hence, greater property tax revenue in wealthier areas brings more revenue to schools in those districts (Allegretto, García, and Weiss 2022). Moreover, rural areas face unique challenges related to significantly higher educational costs compared with urban districts. These challenges are driven by factors such as lower population density, increased transportation expenses, and difficulties in recruiting and retaining qualified educators (Goldhaber et al. 2020; Kolbe et al. 2021).
Furthermore, low horizontal equity, vertical equity, and inequality are evident in LAs with a low SES and in most peripheral locations, particularly among minority groups. A higher SES and peripheral LAs are associated with lower equity levels, indicating a failure to allocate resources based on student needs. This is contrary to the guiding allocation principle, “As the depth of need so is the size of the allocation” (BenDavid-Hadar 2018). Additionally, interaction terms between LAs’ SES and time variables were found to be significant, suggesting a significant increase in the supplemental allocation for higher SES LAs over time, consequently increasing the disparity between LAs.
These findings align with empirical evidence demonstrating substantial opportunity gaps among schools in different countries, based on SES disparity, living locations, as well as majority and minority groups (Lamb et al. 2020; Sinclair and Brooks 2022; Yoon, Young, and Livingston 2020). The SES gap has notably expanded recently due to rising income inequality and shifts in education funding policies (Reardon et al. 2018). In addition, race-based funding disparities primarily stem from variations in taxable property wealth; for example, majority-Black districts struggle to generate local revenues compared with nearby majority-white districts (Baker 2022; Green, Baker and Oluwole 2020).
These funding gaps lead to achievement disparities between districts (Hanushek et al. 2019; Jang and Reardon 2019). Jackson and Mackevicius (2024) showed that a $1,000 increase in per pupil spending raises test scores by 2 percentage points. Thus, the state education funding policy significantly relationship with equity, shaping the relationship between educational opportunities and SES and is related to social and economic equality by the educational outcomes (Morgan and Amerikaner 2018).
This paper revealed a discordance between the government’s aspirations for equitable education funding and the inequitable allocation by LAs. In Israel, decentralization challenges achieve equity. Similarly, in different countries, education is financed mainly by state and local sources without a common policy. Variations in regional spending may be related to governmental ideologies and authority (Garritzmann, Röth, and Kleider 2021; Park 2022; Sinclair and Savage 2024; Winton 2019), although central governments may ensure common standards (Arends 2020). The literature highlights the benefits of common policies. Rose (2022) found a positive relationship between revenue and poverty in California’s equity-based funding formula. Local importantly, local revenue sources dampen this relationship, whereas federal sources strengthen it, encouraging educational gaps. Thus, advocacy with policymakers is crucial for designing fair finance policies (Baker 2022). In light of these considerations, countries with disparities in resource allocation may struggle to achieve equity in education outcomes.
Our research findings emphasize that decentralization challenges equity in funding. Future studies could consider examining how this affects student achievement. Since current research shows mixed results regarding the relationship between decentralization and student outcomes (Diaz-Serrano and Meix-Llop 2019; Hanushek et al. 2019; Jang and Reardon 2019; Kameshwara et al. 2020; Letelier and Ormeño 2018), additional research would help clarify this connection.
This paper highlights the need for and provides a framework for examining school finance policies, thereby improving a country’s ability to provide equitable education for all. The Israeli case offers practical implications for other countries undergoing fiscal decentralization, particularly in disparate supplemental allocation among local authorities, states, or schools. Policymakers should design education funding policies for all education funding sources, similar to government policy. Moreover, non-governmental/non-federal funding overhead can reduce gaps based on SES disparity, central and peripheral locations, as well as majority and minority groups. Adequate education funding policies may lead to a more equitable funding and consequently improve students’ achievements.
Footnotes
Acknowledgements
We would like to express our deep gratitude to Mrs. Tammy Shterental, our research statistician, for her patient guidance and useful critiques of this research work. Tammy’s meticulous contributions and commitment to precision have been instrumental in elevating the quality of our research.
Data Availability Statement included at the end of the article.
Data Availability Statement
The research data used in this study is publicly available on the Israeli Ministry of Education’s transparency website: https://shkifut.education.gov.il/home, and on on the Israel Ministry of Interior website: ![]()
Declaration of Conflicting Interests
The author(s) declared no potential conflicts of interest with respect to the research, authorship, and/or publication of this article.
Funding
The author(s) disclosed receipt of the following financial support for the research, authorship, and/or publication of this article: This work was supported by the Israeli Science Foundation (ISF) [grant no. 1832/20], the Israeli Ministry of Education Chief Scientist [grant no. 3-19050].