
Abstract
Tax complexity makes it challenging for citizens to understand how taxes imposed by state and local governments affect their tax bill. This paper considers citizen awareness and preferences for tax revenue options in the presence of tax features that increase complexity. The researchers mailed a survey questionnaire to a random sample of South Carolina voters measuring their level of knowledge and preferences for school tax funding during the last half of 2021. A sizable majority of respondents report the property tax as their least preferred option to fund school operations when compared to sales tax or commercial property tax, with variation in support by ideology, homeownership, and partisanship. However, respondents are broadly uninformed of current school tax funding mechanisms regardless of college degree attainment, ideology, and other important indicators. Most respondents are not aware of the “tax swap” that replaced residential property tax with a one-cent sales tax to fund South Carolina school operations.
Citizens can view taxes as necessary, evil, or both. Recent history shows that taxpayers are frequently irritated by prospective tax increases and will sometimes mobilize and reject their enactment. Nevertheless, paying taxes is a near certainty in life, an inevitable cost of membership in a political system. No tax is likely to be well liked, but some revenue options can be more politically acceptable than others.
Public opinion studies on taxation in the United States consistently demonstrate that the property tax is one of the least popular tax revenue options. A 2005 Gallup poll revealed that over 40% of respondents identified property tax as the “worst tax” when compared to federal income, social security, state income, and state sales tax (Gallup 2005; Jacobe 2005). A more recent poll in California showed that taxpayers prefer increases in user fees and sales taxes over higher property taxes to fund needed services (Fisher, Wassmer, and Kuloszewski 2019). “Tax revolts” orchestrated through citizen initiative and referenda campaigns pushed governments to enact broad-based property tax limitations in dozens of states in the late twentieth century and early 2000s (Campbell 1998; Martin 2008; Morgan 2007; Lowry 1982; Lowry and Sigelman 1981; Rabuska and Ryan 1982; Sears and Citrin 1985).
At this point, most states and many local governments have reacted to anti-tax mobilization by setting some sort of millage or assessed value limits. As of 2019, 36 states constrain the annual increase in the property tax rate enacted by a local jurisdiction, 37 states place limits on the overall levy of tax revenues that can be collected by local jurisdictions, and over a dozen states limit increases in assessed property values (Langley and Youngman 2021). It is also common for state and local governments to allow exemptions to the existing property tax base. Homestead exemptions set a specified portion of the market value of a home to be “off limits” when calculating the millage tax for that property. Often these tax privileges are available only to certain groups of homeowners, such as seniors, veterans, or people with disabilities (Combs and Foster 2021; Lincoln Institute of Land Policy and George Washington Institute of Public Policy 2019, 2022). Exemptions may also apply to only a segment of the total local property tax bill, such as school operations millage (e.g., Eom et al. 2014). But even if an exemption is extended broadly to most property taxpayers, it may not always be noticed by citizens as a government “benefit” due to the increased tax complexity that exemptions create (Mettler 2011). This paper examines how state-provided exemptions for school tax millage go undetected by citizens. Even when a state supplies generous property tax relief citizens may not notice it, while still receiving its tax-free benefits.
When states and localities limit property taxes, they must diversify their revenue portfolios and leverage other funding sources to pay for services (Carroll 2009; Lewis 2001; York and Walczak 2022). A typical response is to tap into sales taxes. Local option sales taxes are adopted by city and county governments to fund special capital projects or to provide general property tax relief (Afonso 2015; Sjoquist et al. 2007). Some state governments, such as South Carolina and Indiana, have enacted statewide sales taxes for funding education as a substitute for school tax on first homes (Cavazos and Elliot 2015; Cone 2016). 1 A sales tax may be more politically acceptable for funding schools than a property tax because of its lower perceived cost impact to in-state homeowners. Scholarship reveals that sales taxes allow states to export the tax burdens to tourists and consumers who travel in from other states (Foster and Fowles 2016; Murray 2006; Seligman and Hou 2005).
But sales taxation shifts the tax burden to the wide consumer base of in-state residents as well. Consumers may not feel “the punch” of multiple penny-on-the-dollar sales tax transactions paid over time, as compared to a large lump-sum property tax bill at the end of year. Product prices are typically presented exclusive of the sale-tax, lowering consumer salience of the final price with sales taxes added. Colantuoni and Royas (2015) showed that the imposition of a 5.5% sales tax on sodas in Maine had no effect on consumer demand for the beverages, attributable to the low salience of sales tax. Chetty, Looney, and Kroft (2009) found that consumer expenditures were higher on products with sales-tax exclusive pricing when compared to sales-tax inclusive pricing. Another study found that even when pricing is presented as sales tax-inclusive there is little impact on consumers’ choice to buy the items because they willfully ignore sales taxes in their purchasing behavior (Feldman and Ruffle 2015). This is true even when sales tax rates are relatively high, because a consumer’s prior intent to purchase an item conditions them to disregard the sales tax rate (Feldman, Goldin, and Homonoff 2018). So whether it is due to sales tax costs being less noticeable because of their incremental accumulation or because customers deliberately overlook them in their desire to acquire a product, the typical consumer is likely to under-assess the costs of sales taxes.
While sales taxes may be better tolerated by taxpayers, the heightened salience of home property tax increases can provoke opposition (Cabral and Hoxby 2012). Homeowners generally receive their property tax bill in one lump sum at the end of the year, and unless they have “installment” payments deducted monthly to an escrow account, homeowners directly pay their property taxes in sizable annual or semi-annual payments (Langley 2018). Scholars of behavioral public finance find that the complexity of tax presentation and associated visibility of taxes impacts citizen awareness and cognition of the actual costs imposed by a tax (Congdon, Kling, and Mullainathan 2011; Goldin 2012; Schenk 2011; Shanske and Gamage 2011; Wagner 1976). The burden of property tax costs is likely to appear magnified to citizens when compared to other revenue options that exact costs more incrementally over time, namely the sales tax. Thus, governments are incentivized to move to use the sales tax as a revenue instrument, creating a “fiscal illusion” by imposing taxes in a manner more tolerable and/or less noticeable to taxpayers (Afonso 2014; Krishna and Slemrod 2003; Maher and Johnson 2008; Puviani 1903). 2
In summary, it is important to consider how information limits impede residents’ abilities to accurately assess the true cost of taxes. Citizens may be predisposed to view the possibility of property tax increases as a threat, even if their state or local government currently provides them property tax-free exemptions. They may tolerate one tax instrument over another without a clear understanding of the current effects of various tax mechanisms on their budgets. As tax complexity increases, and individuals face challenges in understanding tax features such as exemptions, at least one recent study found that ideological orientation explains citizen tax preferences more so than informed self-interest (Fisher, Wassmer, and Kuloszewski 2019). A tax can be salient to a citizen without the citizen having an accurate assessment of the true cost of the tax. This paper uses the case of South Carolina to consider citizen awareness of revenue mechanisms and preferences of citizens for different tax options in the presence of low information and cognition limits. It explores two research questions about citizen tax knowledge and attitudes. First of all, how informed are South Carolina voters about the particular tax treatment of residential property and consumer purchases in their state to fund school operations? Second, do citizens prefer one tax instrument to be used over the other?
South Carolina’s “Tax Swap”
South Carolina is a good case for examining citizen knowledge, perception, and attitudes toward preferred tax mechanisms due to its exceptional approach to K-12 school funding, the result of significant tax limits set by the state legislature in 2006. This property tax relief bill, also known as Act 388, did the following:
○ Capped annual increases in local property tax rates to no more than the percentage increase of a city or county’s population plus the rate of inflation.
○ Limited appraised value increases to no more than 15% in a 5-year assessment period, unless there is a change in ownership of the property.
○ Exempted 100% of the fair market value of owner-occupied homes from property taxation for public school operations. 3 School revenues lost from the elimination of property taxes on primary residences would be replaced by a new 1% state wide sales tax (Cone 2016). The school tax exemption was passed solely by legislative statute, not by citizen referendum.
While state laws to cap local property tax rates and assessed value increases are now commonplace throughout the country, the total exemption of owner-occupied homes from school operating taxes is outside the norm. This paper’s authors have found no other state that has imposed a 100% home value exemption from school millage, although New York, Louisiana and others provide for partial exemptions (Lincoln Institute of Land Policy and George Washington Institute of Public Policy 2022).
State legislators who voted for Act 388 argued that they were “swapping” property taxes on homes for a more politically acceptable revenue mechanism (Cone 2016). Vocal taxpayer associations such as No Home Tax pushed this overhaul to provide affluent Charleston homeowners relief from skyrocketing appraised values during the pre-Recession real estate boom (Knoeppel, Pitts, and Lindle 2013). However, more modest income residents were also persuaded that the tax swap was a good thing. One activist interviewed in a historical study of the citizen campaign for Act 388 recounted: I remember I stopped at a little house in the country over in Greer; it was probably worth $15,000 or $20,000 and there were ten family members out in the yard talking. . . . They said the values are going up and we can’t pay the tax bills. And I said well let me ask you would you rather pay 3 cents extra on sales tax during the year, rather than pay this property tax bill whether it was $250 at one time, $500, or $2,000. Every one of them in that group of that family said we’d just rather pay the sales tax as we go. (Pitts 2010, 64)
The tax swap did produce some undesirable effects. Given the instability in the yield of sales taxes during economic downturns, a number of districts faced budget constraints during the Great Recession, some of them in the poorest counties. In years when sales tax revenue failed to match the property tax revenues received prior to Act 388, the state general fund was tapped to make up the difference (Saltzman and Ulbricht 2012, iii and 22–4). An additional drawback was the shifting of the school tax burden to commercial and business property. Rented homes, retail and office space, and other commercial property are not exempt from property tax for schools and bear a higher property tax burden as a result of the tax changes (Saltzman and Ulbricht 2012, 17; Walczak, Bishop-Henchman, and Loughead 2018).
Eligible homeowners (virtually all SC residents who reside in a home they own) receive the exemption by applying for a “Special Assessment Ratio” and declaring that the property owned is their “primary residence” (see an example application form for Aiken County Tax Assessor 2022 at https://www.aikencountysc.gov/Forms/ASR_SpecialAssessmentRatio.pdf). However, the homeowner is not expressly applying for the school tax exemption, but rather for a lower residential assessment ratio to be applied when calculating the total local property tax for their home. Upon receiving the special assessment ratio, the homeowner then gets the exemption from school tax by default. A homeowner may know that primary residences are assessed at a lower rate than commercial property, without understanding that receiving the special assessment ratio also shields their home completely from school operations property taxes.
Given that the exemption and education sales tax were enacted over a decade ago, and taxpayers face information limits in understanding taxes, it cannot be taken for granted that citizens are cognizant of these tax features. Fifteen years after the state legislature provided homeowners the “gift” of the school tax exemption many South Carolinians may not even be aware of this exceptional tax treatment of residential property.
Methods
This paper collects original public opinion data to answer questions about citizen knowledge and current attitudes regarding the school property tax exemption and the one-cent statewide sales tax for education. An important contribution is that it assesses the status of public knowledge many years after a major tax reform has occurred and discusses if residents are still averse to property taxes. This is the only South Carolina statewide public opinion tax survey of its kind known to the authors of this paper. This study also adds to the literature on tax complexity and tax salience by offering a quantitative assessment of how informed registered voters are about particular features of their state property and sales tax code. Whereas many studies of the impacts of tax complexity on citizen knowledge of tax costs utilize controlled experimental designs, this study obtains public opinion data to track the degree of awareness of tax features expressed by voters in the general state population.
There are two primary research questions addressed when looking at the survey data. First, are South Carolinians aware of the exemption for home property tax that funds K-12 school operations, as well as the statewide sales tax to fund school operations? Second, do South Carolinians prefer a sales tax or other tax revenue options instead of a home property tax for schools? The paper also offers suggestions to help citizens connect their attitudes on taxes to a more informed understanding of the mechanics of the tax.
In summer of 2021, the authors developed and mailed a survey questionnaire to a random sample of 5000 registered South Carolina voters. Invitees were given the option of completing their paper survey and sending it back by mail or completing the survey via a secure web link using a unique token for access. In all, 183 surveys were returned in July and August 2021, with a response rate of about 3.7%. In order to increase the number of returned questionnaires, surveys were mailed to a second wave of 2000 randomly selected registered voters in November of 2021. The response rate was similar at about 3.4%, with 67 surveys returned, making the total number of returned surveys 250.
The response rate suggests some threat of non-response bias. However, response rates of the reputable polling firm Pew Center were only about 6% in 2019 (Kennedy and Hartig 2019). Moreover, the U.S. Census Bureau’s Current Population Survey reported a continued downward decline in response rates during the COVID pandemic (Rothbaum and Hokayem 2021). The researchers for this project did take efforts to create incentives and reminders for less engaged voters to participate in the survey. All invitees were informed that they would be entered into a random drawing for five $25 gift cards, as is a recommended practice in the survey administration literature (Heerwegh 2006). Invitees also received a follow-up reminder postcard 7–10 days after the questionnaires were mailed encouraging them to complete the survey. Note that a full copy of the survey instrument is available upon request to the authors.
Although response bias on unobservable characteristics remains a concern with this survey, the researchers weighted the response sample on observed demographics, using South Carolinians registered to vote in 2021 as our population of interest. The sample was weighted to age category, race/ethnicity category, and gender based on summary statistics of South Carolinians registered to vote at the end of 2021. The researchers also weighted the sample to education category (high school or less; some college; college graduate) using 2020 Census estimates of educational attainment among South Carolinians over 18. In addition, the authors weighted the sample on party identification and ideology based on Gallup data (Jones 2019a, 2019b). The analysis uses a raking algorithm to converge on appropriate weights for the sample (Sharot 1986). Table 1 provides summary statistics of numerous indicators of the sample before and after weighting. Note that when employing the weighting strategy some surveys were excluded, due to respondents not answering on one or more of the items used for weighting. The analysis used in this paper used a final sample size of 218.
Descriptive Statistics of Key Indicators.
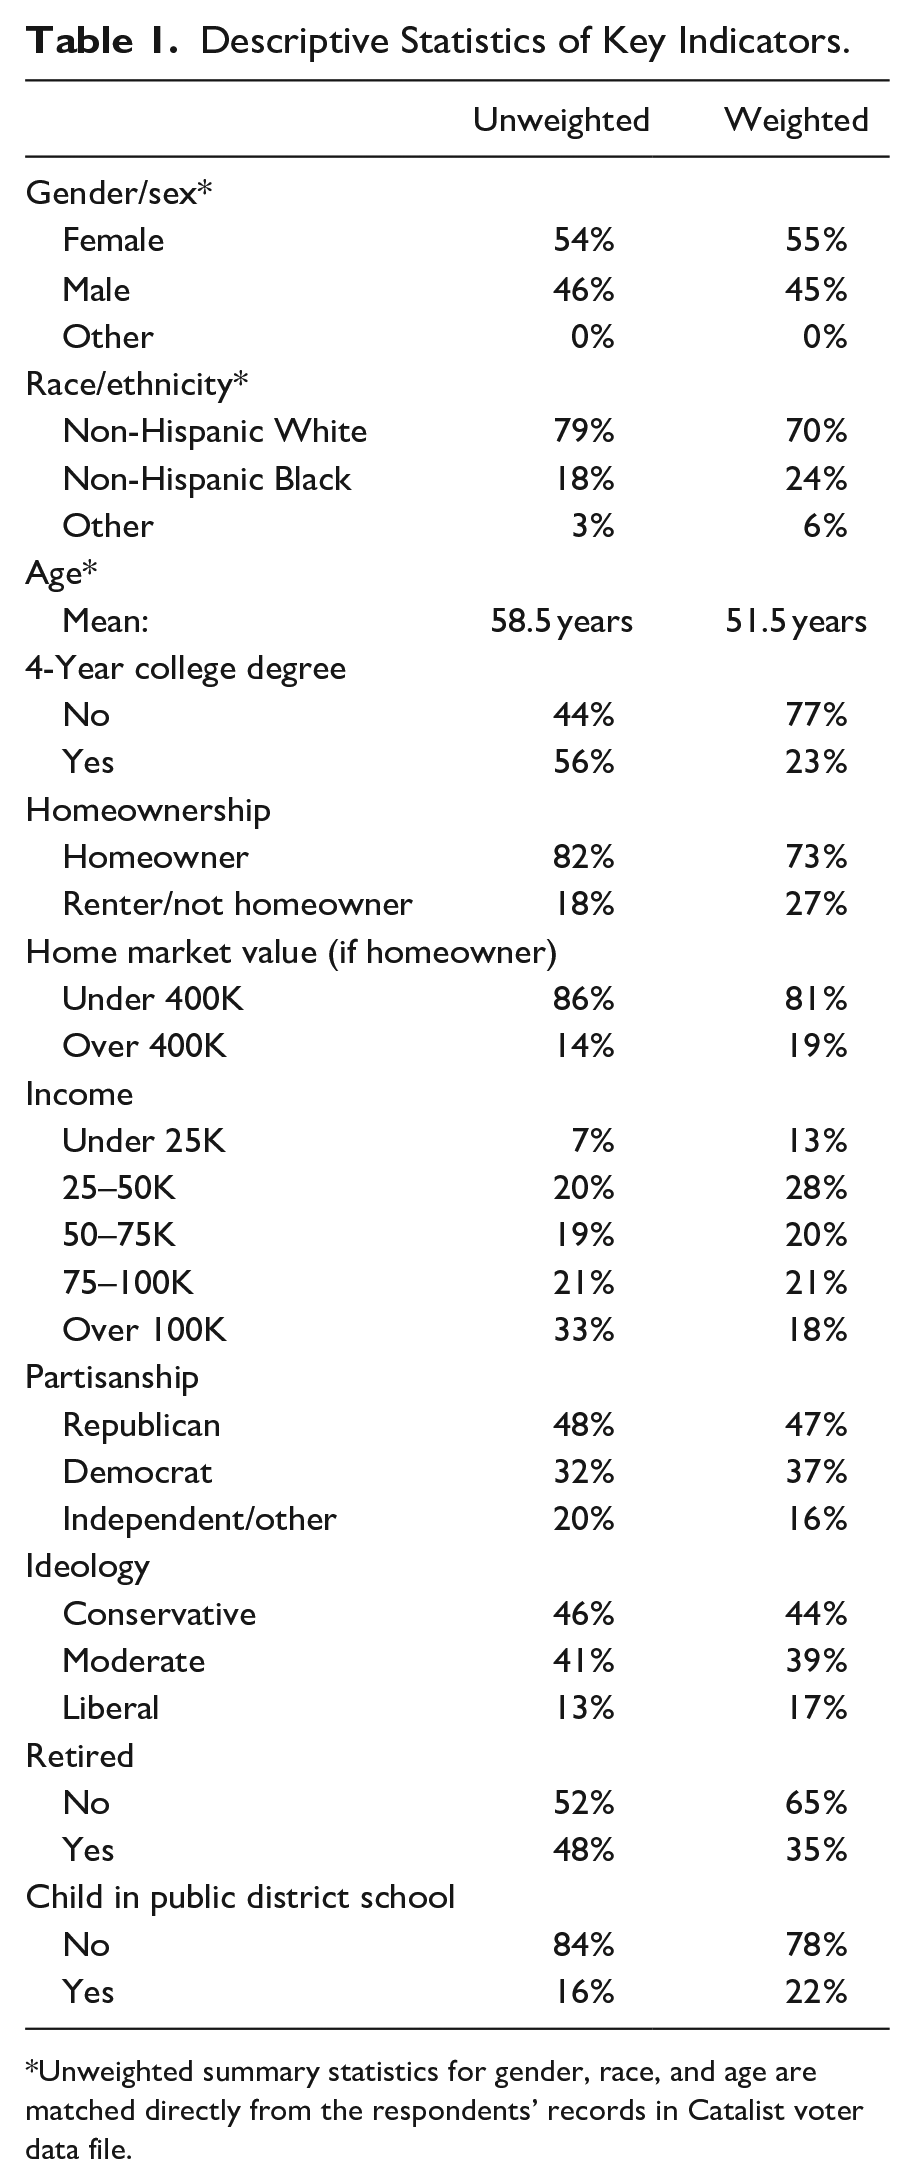
Unweighted summary statistics for gender, race, and age are matched directly from the respondents’ records in Catalist voter data file.
Previous research suggests that individuals who fail to complete surveys or engage in item nonresponse are less informed and/or feel less strongly about political issues than those who complete the survey (Cavari and Freedman 2018). It stands to reason that there may be an overreport bias in favor of educated, strong partisans. While this analysis could not weigh on unobserved covariates such as political sophistication, the weighting on education, party identification, and ideology ensures the sample is representative on these characteristics.
Analysis
The most basic question to answer is whether or not voters are even aware of the two key features of the “tax swap”: the exemption and the state-wide education sales tax. Only about 20% of the weighted sample correctly answered that there was an exemption on owner-occupied homes from school operating costs. 34% indicate there is no exemption, and 46% say they don’t know. The respondents may simply not understand what it means for the law to exempt a home from property tax. This is consistent with Mettler’s findings that citizens do not clearly understand how exemptions provide tax privileges to residents. As an alternative wording, the questionnaire also included an item asking respondents to indicate if school property tax on owner-occupied homes funded the operating costs of public schools. Only 10% of the weighted sample correctly answered that property tax on owner-occupied homes does NOT fund school operating costs, and nearly 66% of the weighted sample indicated belief that school operations are funded by property taxes on primary residences.
Figure 1 shows the percentage of respondents answering “Yes” and “No/Don’t Know” that there is a school property tax exemption per selected demographic indicators of respondents. Across each of these indicators only a minority of respondents express awareness of the exemption. Respondents who have retired show a statistically higher level of knowledge of the exemption, but this appears to be only a matter of degree. The majority of retirees (71%) are still un-informed. Knowledge of the school tax exemption is low across the spectrum of voters. Respondents with a 4-year college degree are about as uninformed as less educated groups. Homeowners with a home value of over $400,000 are a bit more informed than are those with lower valued homes, as over a third of the affluent homeowners were aware of the exemption, but the difference is only statistically significant at p < .10. Among homeowners overall their awareness is not statistically different from renters/non-homeowners in the weighted sample. Both groups are largely unaware of the exemption.
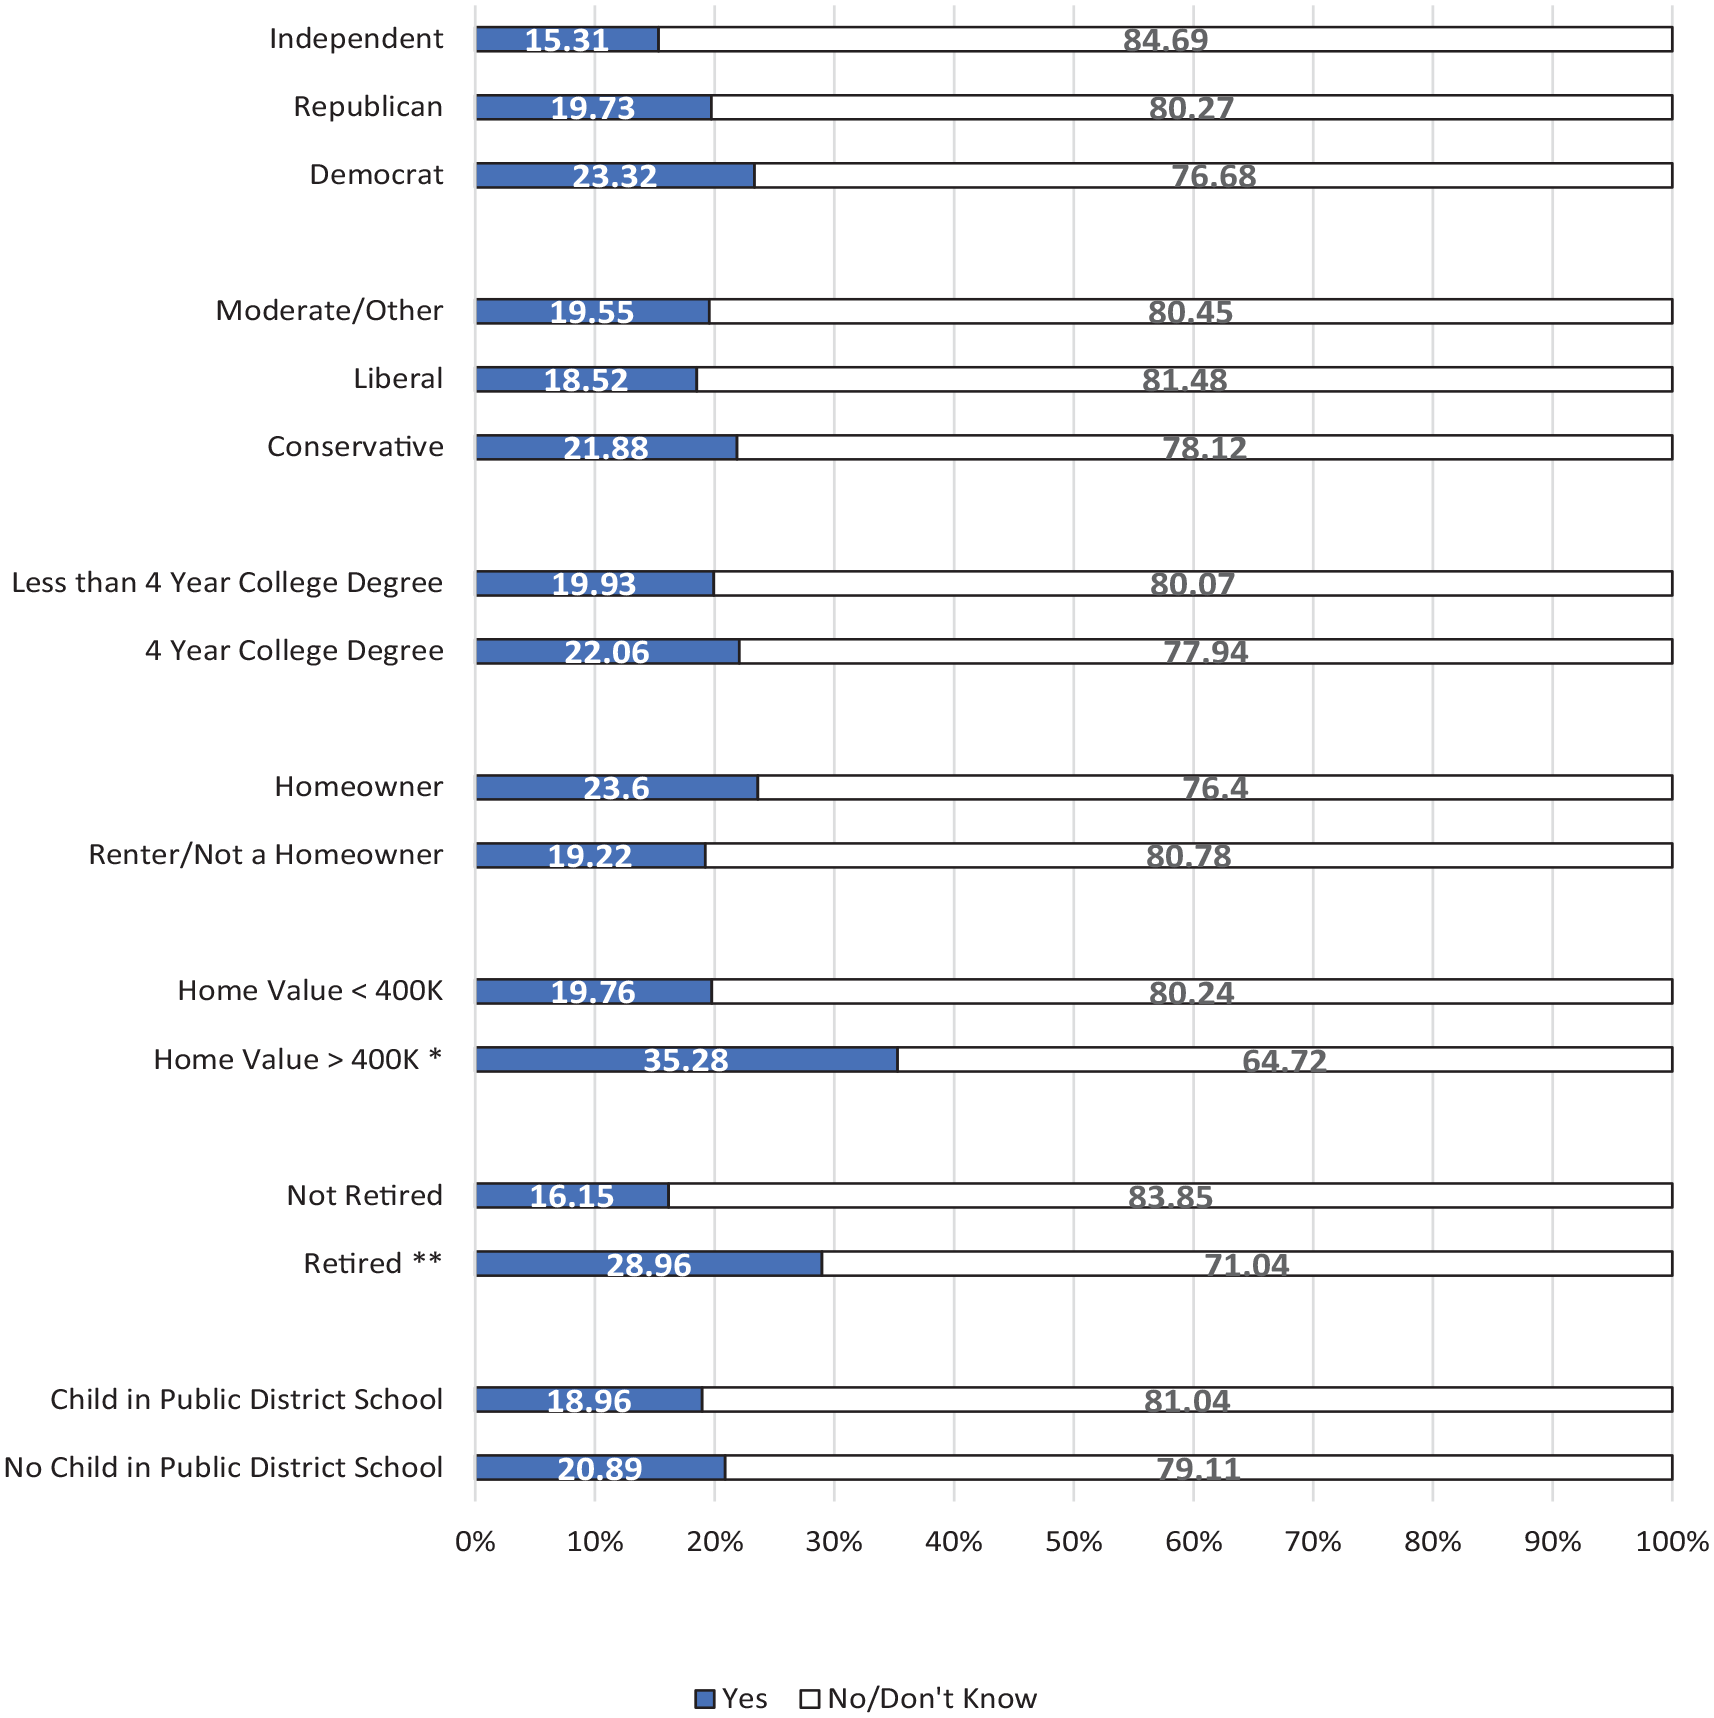
Percent of respondents with knowledge of the school property tax exemption: Selected variables (weighted sample).
Respondents also report higher awareness of the school sales tax than they did for the home exemption, with about 36% of the weighted sample answering that there is a one cent tax specified for public school funding. Still, the majority answered that they did not know, and 12% incorrectly answered that there was no funding from a state school sales tax. There is low public awareness that one cent on the dollar is imposed as tax for school operations.
As for attitudes on the preferences of voters for individual tax options, the questionnaire focused on the three types of revenue most impacted by the Act 388 “tax swap”: residential property, sales tax, and commercial property tax (as business property bears a higher property tax burden because of the home tax exemption). A large majority of respondents (62%) least prefer to see residential property taxes increase, followed by sales tax (32%) and commercial property tax (6%).
Figure 2 presents percentages of the weighted sample indicating their least preferred tax option to increase to fund schools per various respondent groups. In most group categories the majority least prefers a residential property tax increase. There are some exceptions, however. On party identification, Democrats are evenly divided among aversion to residential property and sales taxes, and Independents are more averse to property tax, while Republicans are even less supportive of residential property tax, and this difference is significant at p < .05. There is a somewhat similar pattern on ideology, with conservatives opposing residential property tax increases significantly more than other groups. The majority of renters/non-homeowners express that sales tax is their least preferred option, and the majority of homeowners express that residential property tax is their least preferred option, a large and statistically significant difference in percentages. The overall story is that property tax on homes is the least popular tax across most socio-economic classes. There is little to indicate an elite socio-economic bias to residential property tax opposition, perhaps other than such opposition ignores the tax preferences of renters.
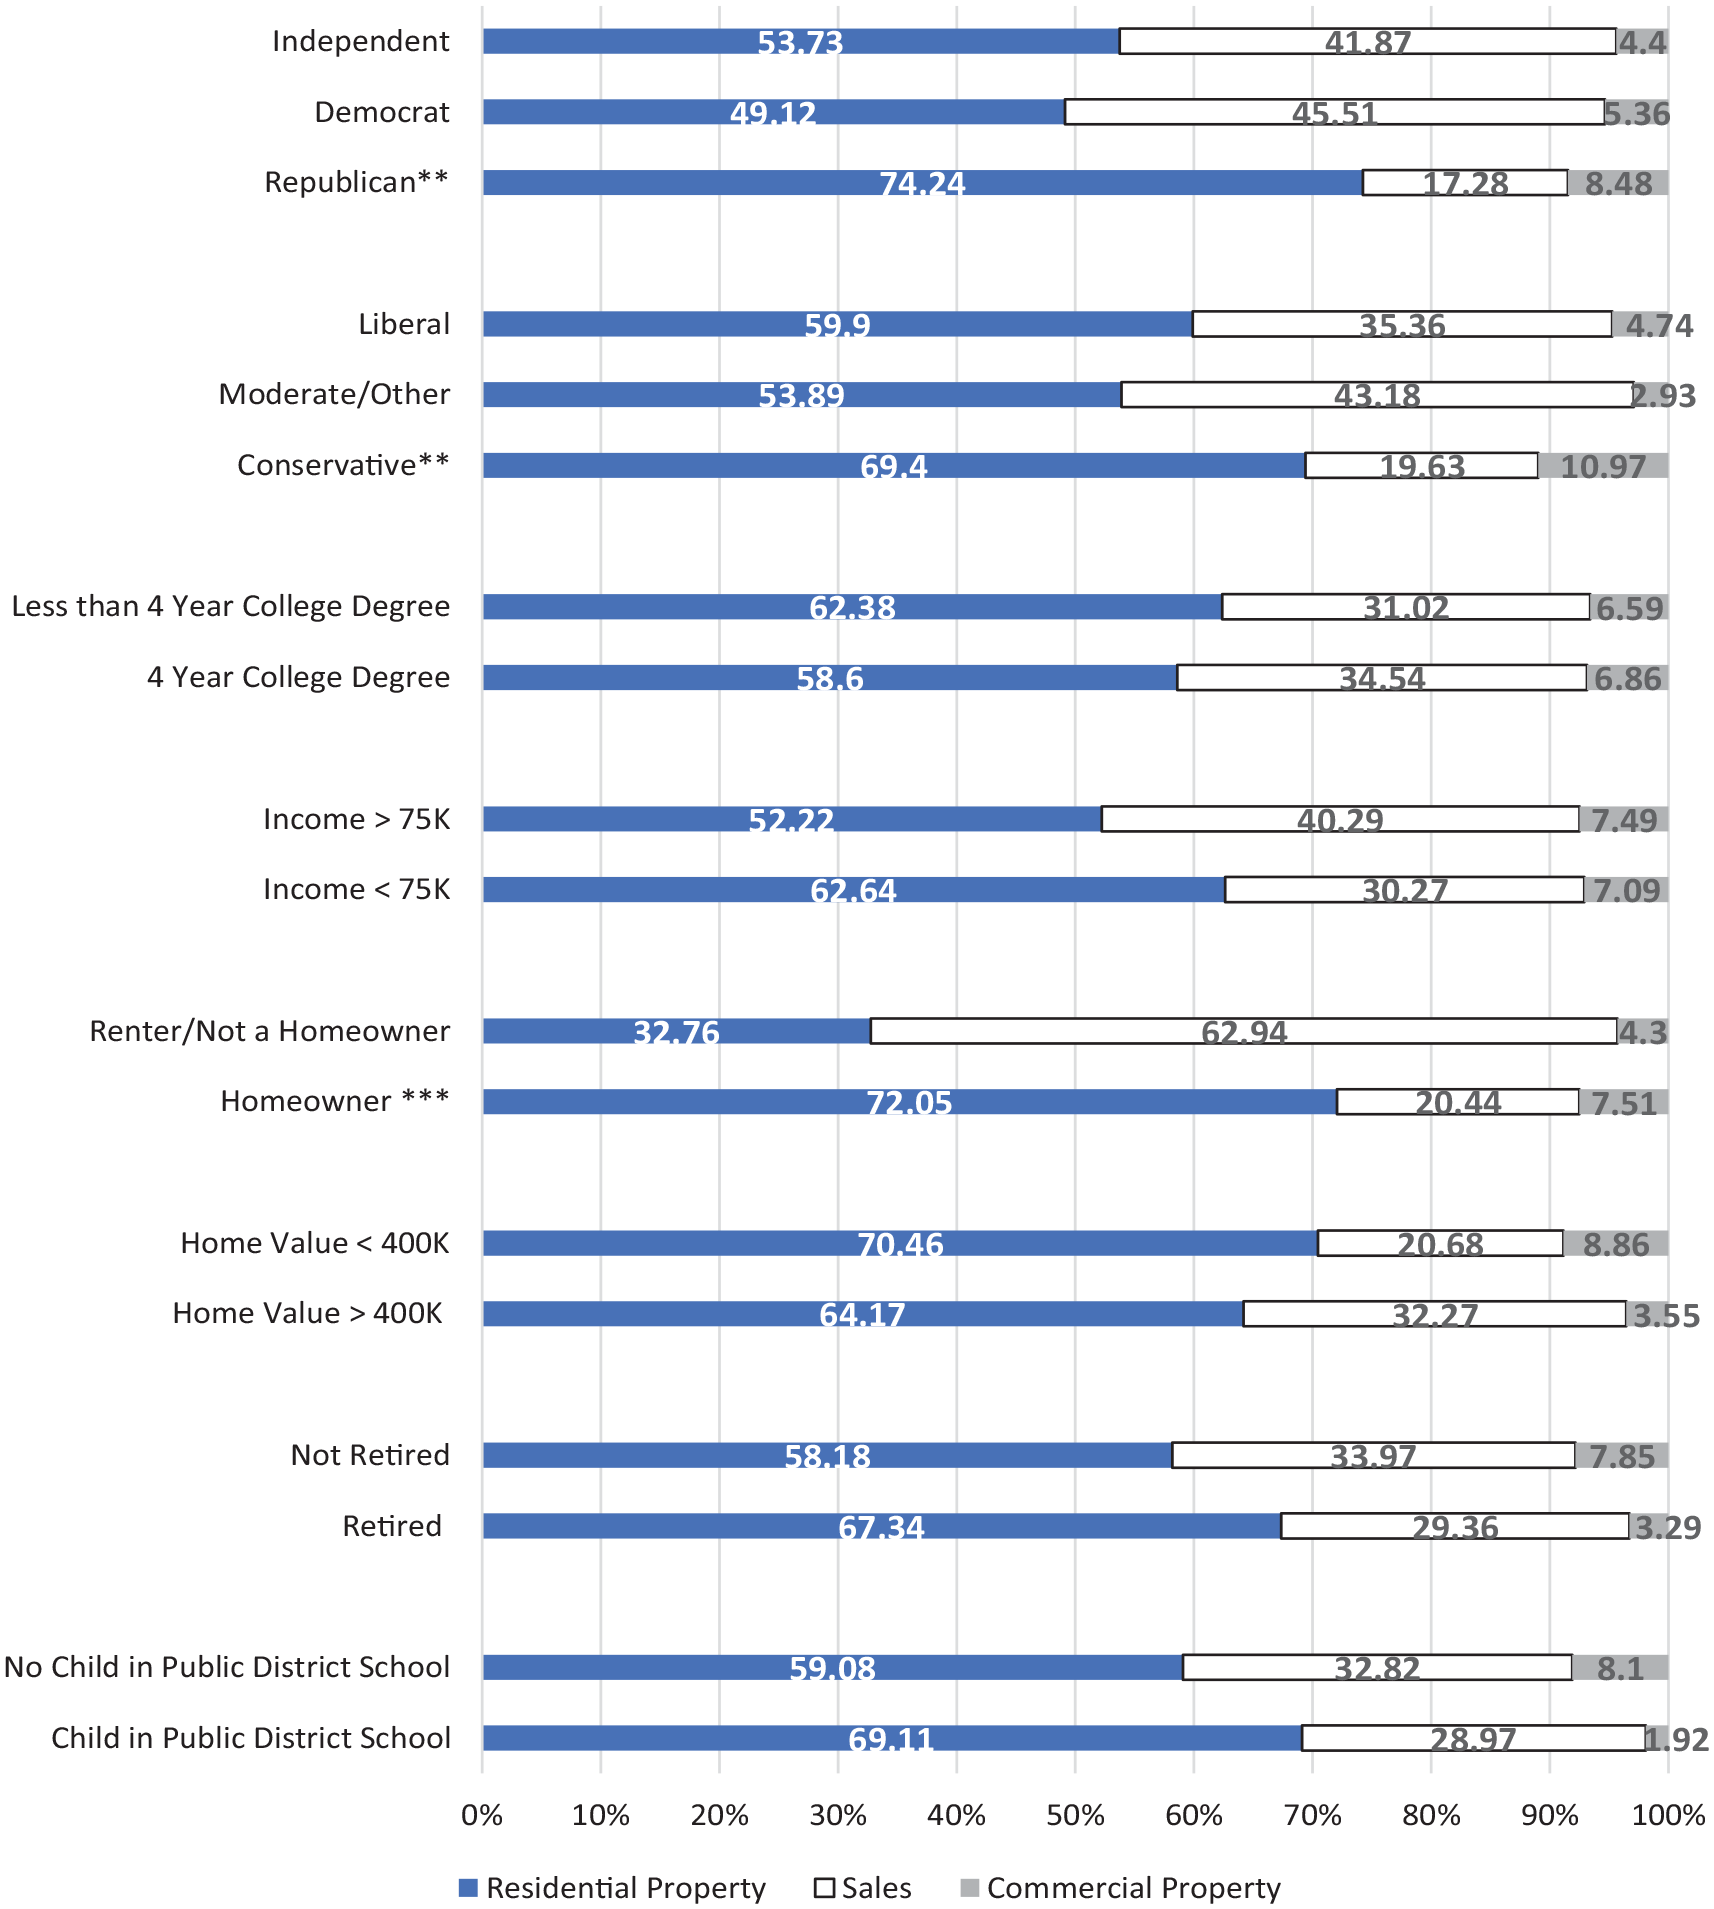
Least preferred tax option to increase to fund schools: selected variables (weighted sample).
The questionnaire also included an item asking respondents if they would support a tax increase for public schools via various tax options, allowing them to select multiple tax options. Respondents express little support for increasing residential property tax or state income tax, a bit more for sales tax, and alm-ost half express support for tax increases on commercial property, which already bears a large burden for funding school operations. Notably, nearly 27% of the weighted sample would support increases on NONE of these taxes to fund schools. Not only is residential property tax the least preferred option for taxation, but the majority of South Carolinians express opposition to increases on residential property tax, more than any other revenue option, even though a majority opposes sales tax increases as well.
Discussion
There is an important case to be made that taxpayers should have an informed knowledge of the taxes they pay to better monitor and consider their individual contribution to funding services and to track how their state and local elected officials are responding to their tax preferences. This examination suggests that taxpayers, in particular homeowners, oppose school property tax increases while being unaware that first homes are not currently taxed to fund this service. Non-homeowners are also largely unaware of the tax-free treatment received by most homeowners in funding school operations. While the current tax-free status provides property tax relief to South Carolinians, which these survey findings indicate they do in fact prefer, those preferences are not coupled with an informed understanding of how first homeowners are generally not burdened with taxes on their homes. Note that 66% of the weighted sample thought that school operations costs added to their property tax bill. At the same time, the majority of respondents do not support sales tax increases to fund public school operations. But as school budgets are squeezed and revenue increases are needed over time, taxpayers will likely be pressed to pay higher taxes to fund these operations, one way or another. It may be more politically feasible for elected officials to pass increases through continued imposition of sales taxes because voters lack awareness that a dedicated portion of sales taxes funds education. Still, the goal of good governance implies that the state should take efforts to inform taxpayers of how they are being taxed and to what purposes. It is not necessarily in the individual interests of non-homeowners and commercial business owners to absorb a heavier share of the tax burden without being aware of it. There are important equity implications for this current “swap” of sales tax funding to provide property tax relief as well. Sales taxes are regressive, hitting the budgets of low-income households (homeowners and renters alike) harder than higher-wealth households (Davis 2019). Voters’ assessment of the effectiveness and fairness of the current features of state tax policy will be enhanced if they have a clear understanding of how taxes fund public services and on whom those taxes are imposed.
The finding that such a small percentage of registered voters in our sample are aware of the school millage—exempt treatment of primary residences nearly 16 years after this tax-free benefit was introduced is compatible with scholarship suggesting that tax complexity impedes taxpayer awareness of their actual tax burdens. While our public opinion survey was not able to test directly how or why citizens fail to recognize the property tax exemption, the data does show that citizens are largely unaware of it. It is possible that some respondents in our survey who incorrectly answered that homes are not exempt from school millage are conflating referenda-approved property taxes to fund K-12 capital projects with “operating costs,” even though our questionnaire did take care to define operating costs to respondents. This unique treatment of school operating millage separate from locally approved taxes for school capital financing in fact adds another element of complexity to the state/local property tax code, and further complicates citizen understanding of taxes.
The survey findings also showed that while respondents were better informed about the existence of the one-cent sales tax specific to K-12 funding than they were of the school property tax exemption, only a minority of respondents indicated knowledge of this “penny tax.” Citizens may be unable to distinguish the state’s general use sales tax and special purpose local option sales taxes from the dedicated one-cent sales tax for education. Sales tax imposition is particularly complex in that it is imposed in so many different ways: state-wide, at the county and municipal level, for general use, and for special purposes. Citizens may operate from a context of bounded rationality when considering sales taxes, thinking of sales tax costs as an amorphous whole, unaware of each portion of the sales tax cost. Arguably, they would be able to make more informed choices about their tax preferences if they were clearly informed of which tax mechanism is paying for which services.
Recommendations and Next Steps
This look at descriptive statistics and bivariate relationships indicates that there is significant citizen aversion to using a residential property tax to fund public schools, a bit more tolerance for using sales tax as a mechanism to raise school revenues, and a preference for accepting the increased tax burdens on commercial property in South Carolina. The Act 388 tax swap provisions first enacted 16 years ago continue to align with public opinion and the expressed “will of the people.”
But this is coupled with a significant lack of knowledge that residential property is exempt from taxation, and that sales taxes are higher in order to fund school operations. The state has an important duty to fully inform citizens about tax features and how they fund services. One additional point is that elected officials in government could benefit from reinforcing to voters the extent to which the state legislature has been responsive to majority preferences for property tax relief up to this point.
The authors offer three practical recommendations to make the existence of the school property tax exemption and education sales tax more transparent to citizens. First, county tax offices could better specify that applying for the reduced residential property assessment ratio also gives homeowners access to the school tax exemption. This could be expressed up front on county special assessment application forms. Second, the legislature could explore options for incentivizing realtors and closing agents to clearly explain the school tax exemption to homebuyers at point of purchase. This could involve more explicit focus on the school tax exemption in real estate training courses already required for state licensure or provision of guidance documents by the state finance department about how to present the exemption to home-buyers to aid transparency. A first-time homebuyer is likely to need this cue at point-of-purchase to understand that receiving the special assessment ratio also erases their school tax liability. Third, state government-required itemization of the different portions of sales taxes on receipts for purchases could assist South Carolina consumers in recognizing that one cent on the dollar is levied for public school operations.
The findings of this paper admittedly have some limitations. As previously discussed, the response rate was low, although survey weighting was applied to correct for bias in the response sample. Qualitative methods such as interviews and focus groups could add a richer analysis of citizen limitations in understanding state and local school tax policy. This descriptive and bi-variate analysis is instructive, but more expansive multi-variate analyses is a goal in future iterations of this project. Follow-up studies directly asking respondents to indicate their preferred mix of tax options to use for public school funding and the preferred share of funding from each option would also add depth to unpacking citizen attitudes on state and local school taxes.
Footnotes
Correction (January 2024):
Data Availability Statement
Data collected and analyzed for this article is available upon request to the authors.
Declaration of Conflicting Interests
The author(s) declared no potential conflicts of interest with respect to the research, authorship, and/or publication of this article.
Funding
The author(s) disclosed receipt of the following financial support for the research, authorship, and/or publication of this article: This project was funded by an ASPIRE I grant provided by the University of South Carolina’s Office of the Vice President of Research and supplemental assistance from the USC Aiken Social Science and Business Research Lab.