
Abstract
The study examines the relationship between voting restrictions and public health in the 50 American states. Using a recently developed Cost of Voting Index (COVI) as a surrogate for variance in state electoral climate the research tests for a statistical relationship while controlling for other considerations that notably influence community health outcomes. The research uses the America’s Health Rankings composite indicator of state health as the dependent variable and examines the relationship at seven points of time over a 25-year period (1996–2020). In both bivariate and multivariate tests, a robust relationship is uncovered between the COVI and overall state health. In the bivariate tests, it is possible to see changes in state COVI values, overtime, corresponding with movement in the state public health scores.
Introduction
State election laws in the United States (US) have been a source of controversy throughout the country’s history (Keyssar 2000; Lichtman 2018). Moreover, since the Civil War Amendments to the US Constitution passed between 1865 and 1870, there has been significant concerns about the discriminatory intent of certain state election laws that disproportionately disenfranchised African Americans (Bentele and O’Brien 2013). Since the 2000 presidential election, and controversies in the state of Florida over election irregularities, there has been renewed concern over variation in state election laws (Argersinger 2004; Kincaid 2001). Then, following the 2016 presidential election, and unfounded accusations of massive voter fraud, scholars have been testing the effect different state election laws have on fraud (Cottrell, Herron, and Westwood 2018; Goel et al. 2020) and whether certain laws create a partisan advantage (Biggers 2019; Burden et al. 2017). Quite notably, in the post-2016 era, Norris (2019) finds that public doubts about electoral integrity undermine public confidence in democracy, which makes work on state election law particularly important (5). Notably, scholars have studied many different corollaries with variation in state election law. In this paper, I broaden the scope of concern by looking at the possible public health consequences of voting restrictions.
This work is not the first to imagine that a deficit in the quality of democracy, in the American states, will have public health consequences. However, the scope of existing works has been limited to specific health concerns such as life expectancy (Latner 2019) or community response to the COVID-19 pandemic (Papayo et al. 2022). Moreover, think tanks and non-academic outlets have produced much of the existing work. For instance, the Union of Concerned Scientists supported Latner’s (2019) work on the cost of voting and life expectancy. Other work that discusses a possible connection between voting and health outcomes, by Yagoda’s (2019), is a “white paper,” published by the Annals of Family Medicine. Yagoda’s paper offers a compelling theoretical argument without any pragmatic testing. My research will provide an empirical test of the thesis that restricted voting laws associate, generally, with overall health scores. I will test the thesis using econometric modeling and holding constant a whole host of other considerations scholars have found effect aggregate public health outcomes. Moreover, I will test for an effect on public health using between state differences in electoral climate and overtime within state changes in voting restrictions.
This research operates from the premise that the electoral climate in the American states varies. For instance, Oregon adopted a statewide vote from home option for citizens, before the 2000 presidential election. Today, all registered voters in the state receive a ballot in the mail, which they can fill out at the kitchen table and return in a self-addressed pre-paid envelope. Election officials instruct voters to sign the sealed envelope, which contains the ballot to identify themselves. As recent as 2020, voters in Alabama, Connecticut, Mississippi, and New Hampshire still had no options for early voting. The only possibility was to vote on Election Day, within a prescribed window of time (on a Tuesday). Clearly, some state citizens face greater “costs” than others do, when it comes to casting a ballot. There is a myriad of other state election laws, from poll hours to registration drive restrictions, which also hold the potential to affect the time and trouble associated with participating in civic life.
Moreover, we know that health outcomes vary across the American states. For instance, some states have greater life expectancy (Latner 2019) and others lower infant mortality rates. Considering infant death, researchers have broken this down and found within state variation at the city and county level (Woodruff, Darrow, Parker 2008). Scholars routinely tie uneq-ual health outcomes to education (McLeod, Nonnemaker, and Call 2004; Singh 1986), 1 income (Berinsky and Lenz 2011; Sondheimer and Green 2010), and other factors. 2 This research asks, what about the “cost of voting” and public health?
Stating the research question differently, when some states make it easier to vote, or to get involved in civic life, does this have implications for public health? To explore the question, I will make use of a Cost of Voting Index (COVI), which has quadrennial state specific values from 1996 to 2020 (Schraufnagel, Pomante, and Li 2020), and America’s Health Rankings (AHR) composite indicator of state health, which has annual values dating back prior to 1996. The intention is to learn if the two variables relate to one another in a predictable manner. Do restrictive voting practices, the COVI, associate with lower state-specific health outcomes as determined by AHR?
The Theoretical Relationship Between the Cost of Voting and Public Health
Academic studies on health commonly focus on the health of individuals (Hahn and Truman 2015; Ross and Wu 1995) or the collective health of countries (Bloom 2005). This study’s focus is the American states. Importantly, there are possible direct links between voting restrictions and health to consider. For instance, in the American states it is common for people to vote on ballot initiatives that affect public health, such as Medicaid expansion and clean air laws. Moreover, candidates for public office routinely make public health part of their election campaign messaging because it is among the top issues voters care about. Still more, an inclusive state electoral posture might lead to greater involvement in the decennial census, which helps determine how much funding communities get for transportation, housing, and health services. Not to mention, how many representatives’ communities get in national and state legislatures. These direct factors complement the possibility that higher levels of voting promote community connections, improve neighborhood cohesion, and foster community resilience.
Furthermore, it is possible that voting restrictions will relate to health via civic education. 3 Years of schooling might not be the only type of education that is relevant to health outcomes. Conceivably, greater civic involvement will educate citizens by exposing them to political debates and fuller information about civic life. This exposure, and learning, may increase awareness of precautionary health practices and cause people to make healthier life-style choices. In other words, politically engaged individuals may have access to more complete information and, consequently, make wiser healthcare decisions. This, in turn, should produce healthier individuals, communities, and American states. In other words, staying informed and getting involved, whether by volunteering, participating in elections, or advocating for a meaningful cause should expose individuals to alternative points of view, more community debate, and fuller information regarding civic life.
Dewey (1916) argued that one should not acquire all learning in formal school settings, and he advocated for experiential learning or learning by doing. Others claim that education is a “process,” which occurs at home, in schools, and in the community (Hahn and Truman 2015, 658, italics in original). Importantly, new research consistently finds that participatory democracy associates positively with better public health outcomes (Nazarov and Obydenkova 2021; Wang, Mechkova, and Andersson 2019). One work in this vein provides evidence that it is the “freedom,” associated with democratic process, which produces better health (Franco, Alvarez-Dardet, and Ruiz 2004, 1421). This research compliments these efforts by testing new operationalizations of a commitment to democratic process and public health, using the 50 American states as a testing ground.
Still more, scholars find that voting restrictions disproportionately disenfranchise minority populations and associate with a minority representation gap in state legislatures (Pomante, Schraufnagel, Li 2023, Chapter 6). Papayo et al. (2021) argue, “these [minority] populations may be more likely to support elected officials who favor public health and social welfare policies” (3). The same public policies that other scholars have tied to better public health outcomes (Courtin et al. 2020). Indeed, scholarship has established that in the American states different policy outcomes occur as the result of a differentiated commitment to democracy (Hill 1994, Chapter 6). Hill’s (1994) important work in this regard establishes this policy link by examining specific welfare and civil rights’ policies. Hence, many possible causal paths might explain an association between voting restrictions and public health. In federal systems, characterized by considerable decentralization of political authority, subunit governments have autonomy to establish unique election laws (Creek and Karnes 2010; Nussbaumer 2013) and by default voting restrictions. 4 This, in turn, can theoretically determine voter turnout, effective representation, and relevant public policies with health-related implications.
Methods
Scoring countries on the quality of democracy, using various indices, is commonplace in political science (Armstrong 2011; Högström 2013). Scoring the American states is somewhat more novel. However, researchers have begun to establish both, between state, and overtime within state variation in the restrictiveness of voting laws (Li, Pomante, and Schraufnagel 2018). In other words, the ease of casting a ballot in Minnesota is not the same as it is in Alabama. Texas is not the same as Vermont. Moreover, the potential for civic engagement via the ballot box is not constant within states overtime. Some state legislatures routinely shuffle their electoral arrangements. For instance, New Hampshire and Wisconsin, as recent as 1996, were among the top 10 least restrictive states. By 2020, both states were among the five most restrictive states. This occurs in part because state legislators failed to keep pace with new technologies that make voter registration easier but also because these states passed new restrictions such as direct and in-direct bans on voter registration drives and new photo identification laws.
The Cost of Voting Index (COVI) becomes the key explanatory variable in this research. Again, the presumption is that when states make it more difficult to vote there are consequences beyond lower voter turnout. When capturing inter-state and intrastate variation in the cost of voting, the authors of the COVI use Principal Component Analysis (PCA) to combine a whole host of state election laws and policies related to voting (Schraufnagel, Pomante, and Li 2020). For instance, they tap voter registration considerations such as registration deadlines and automatic voter registration laws along with balloting considerations such as photo identification and the number of early voting days. However, it does not stop there. They also look at pre-registration laws for teenagers, absentee voting processes, and whether citizens are provided time off from work to vote. Depending on the year, the authors use between 37 and 54 unique considerations of state policy and law, always scoring variables in a manner that larger numbers indicate greater cost or more time and effort associated with participating in elections. The rows of numbers, representing each state, are then lumped into “issues areas” and the PCA extracts underlying dimensions called components, weights are applied, and the authors produce state specific values. 5
Importantly, there are COVI values for each of seven presidential election years to consider (1996–2020 inclusive). Consequently, I measure state public health at seven, corresponding, points of time. Specifically, I lag COVI values and all other explanatory variables by one year. For instance, the modeling employs 1996 COVI values, and other explanatory variable values, to predict state public health in 1997 and so forth. Supplemental Appendix B (Table B1) provides the results of a model that lags the COVI, and other considerations, by two-years. 6 Considering the seven quadrennial values, and public health, a state that consistently ranks low is Mississippi. A state consistently ranked high is Utah. Interestingly, both states have had Republican Party control of the state legislative process during the 25-year period studied, suggesting that partisan control of the state legislature is not the only, or even a primary, consideration when it comes to variation in state public health outcomes.
Before moving forward, it is imperative to settle on a suitable indicator of variation in public health across the 50 American states and across a 25-year period. I settle on the annual composite score of overall state health produced by America’s Health Rankings (AHR). 7 The group tracks data on many unique public health indicators to produce state values for the entire period studied. The group’s annual composite score for each state takes to heart the World Health Organization’s definition of health, which suggests, “Health is a state of complete physical, mental, and social well-being and not merely the absence of disease or infirmity.” 8
In all, AHR collects data in five broad categories to develop the state scores. The five areas are behaviors, social and economic factors, the physical environment, the availability of clinical care, and health outcomes such as the prevalence of disease and mortality rates. In 2021, the group based state scores on 51 different considerations in the five categories. Reflections range from occupational fatalities, drinking water violations, housing with lead risks, tobacco use, and childhood immunization rates. The group standardizes each set of numbers, provides weights for each of the five categories, and then combines them to produce the annual indicator of Overall State Health. 9 Importantly, there is within state variation in the health scores during the time studied. For instance, the state of New York ranked 39th in 1996 for overall health and improved to the 21st position by 2020. Going in the other direction, Idaho was the 11th healthiest state in 1996 but fell to 22nd place by 2020.
To initiate this query, consider Figure 1, which displays the results of a test for a statistical relationship between the COVI and Overall State Health at seven different points of time spanning 25 years. Each of the bivariate tests have a sample size of 50, representing the 50 American states. The Figure displays a strong statistically significant negative relationship between the cost of voting and the composite public health score. Considering the two columns of 50 numbers, representing the COVI and the public health score, one can be 99% confident that an increase in the cost of voting correlates with a drop in overall public health.
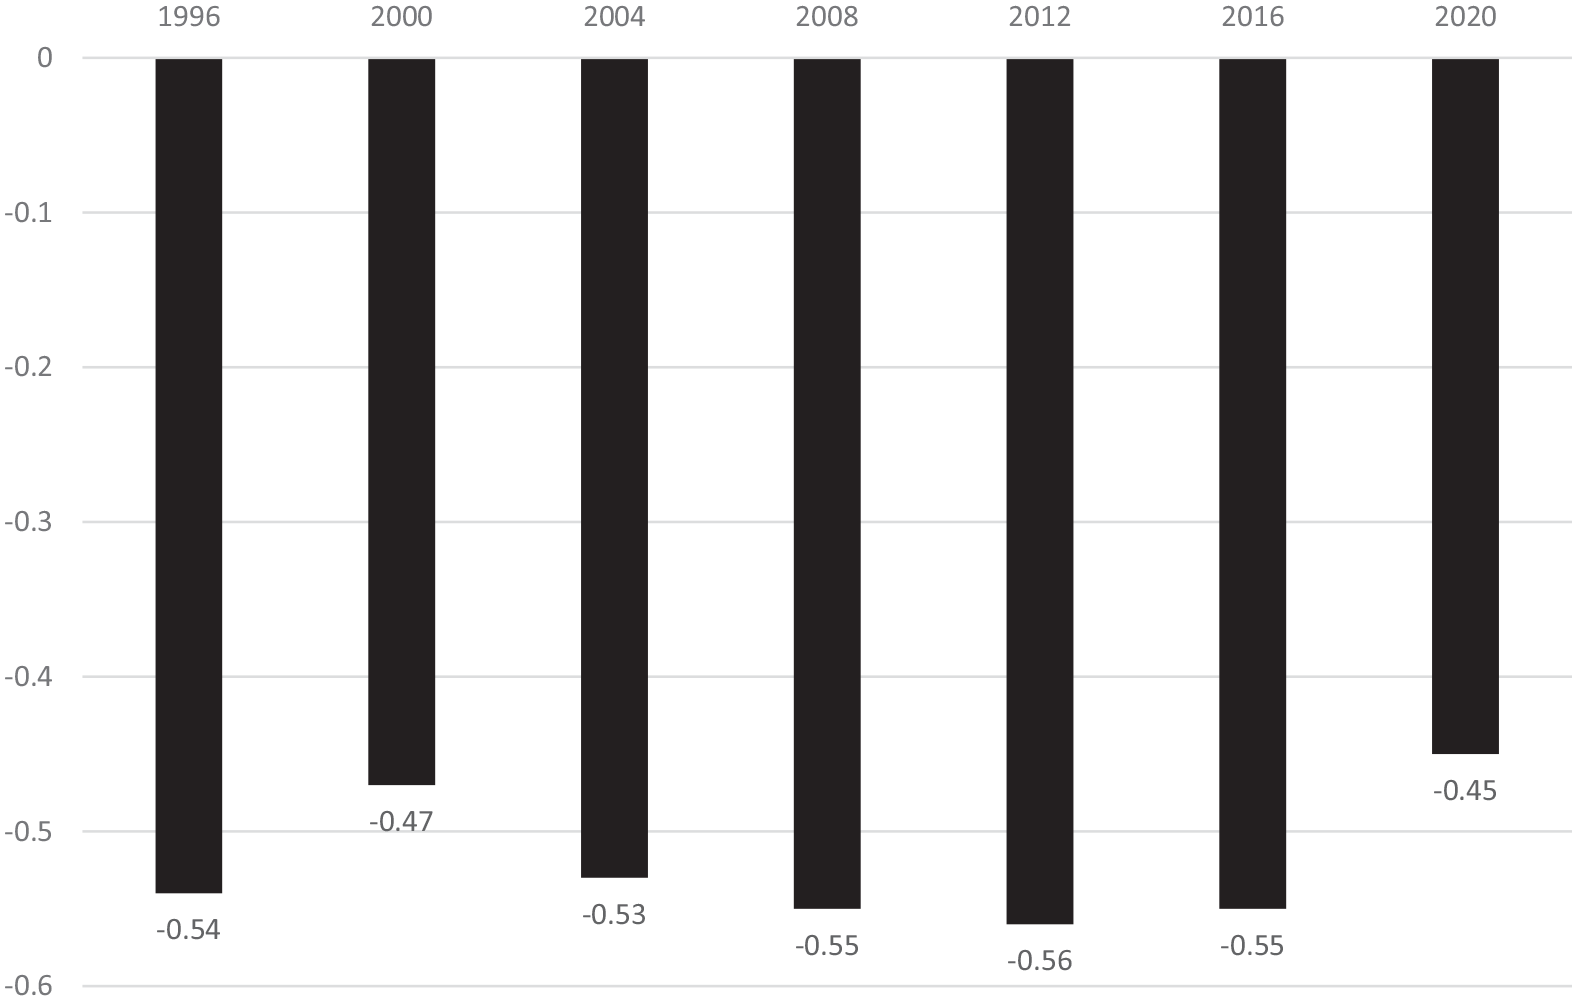
The bivariate relationship between the cost of voting and overall state health.
What is remarkable about these correlations is the strength of the association and the consistency over time. To provide some context, to reach a p-value of .05, a standard convention for statistical significance, with a sample size of 50, you only need a Pearson correlation coefficient of about 0.28. In many instances the value of the correlation between the COVI and the overall state health score is greater than 0.50. These are extremely high correlations between two rows of numbers, representing theoretically distinct concepts and developed by researchers with entirely distinct goals in mind. Importantly, the two groups of researchers do not us a single variable the same in the construction of the two indices. Moreover, the strong bivariate relationship exists, not in a single point of time, but over a 25-year period.
Nevertheless, a strong bivariate relationship can be misleading, and it is important to control for other considerations. For instance, it is possible that an antecedent variable is producing both higher COVI values and lower public health. If, for example, something about state culture can predict both COVI values and the indicator of overall health this might be the “true” explanation. If this is the case, the relationship between the COVI and health might be spurious. Consequently, it is important to control for both antecedent considerations and possible intervening variables to get a truer test. The research will elaborate on alternative explanations for state variation in public health and includes these in a multivariate modeling, which follows.
However, before leaving behind the bivariate scrutiny of COVI values and composite state health scores there is another consideration worth checking. When voting is getting easier in a given state, from 1996 to 2020, is there a corresponding noticeable improvement in public health? Likewise, when a state has made their electoral arrangements more restricting is there a drop in the public health score? Because there are other considerations that affect public health, there should be no expectation of a perfect match or perfect symmetry. Yet, if there were, no examples of this occurring that would be problematic. To test for this, consider Figures 2 and 3, which allow one to examine more closely if change in the cost of voting, within a given state, corresponds in a meaningful way with change in the state’s health score over the two and half decades that data is available. Figure 2 presents the COVI values and Figure 3 the overall state health scores.
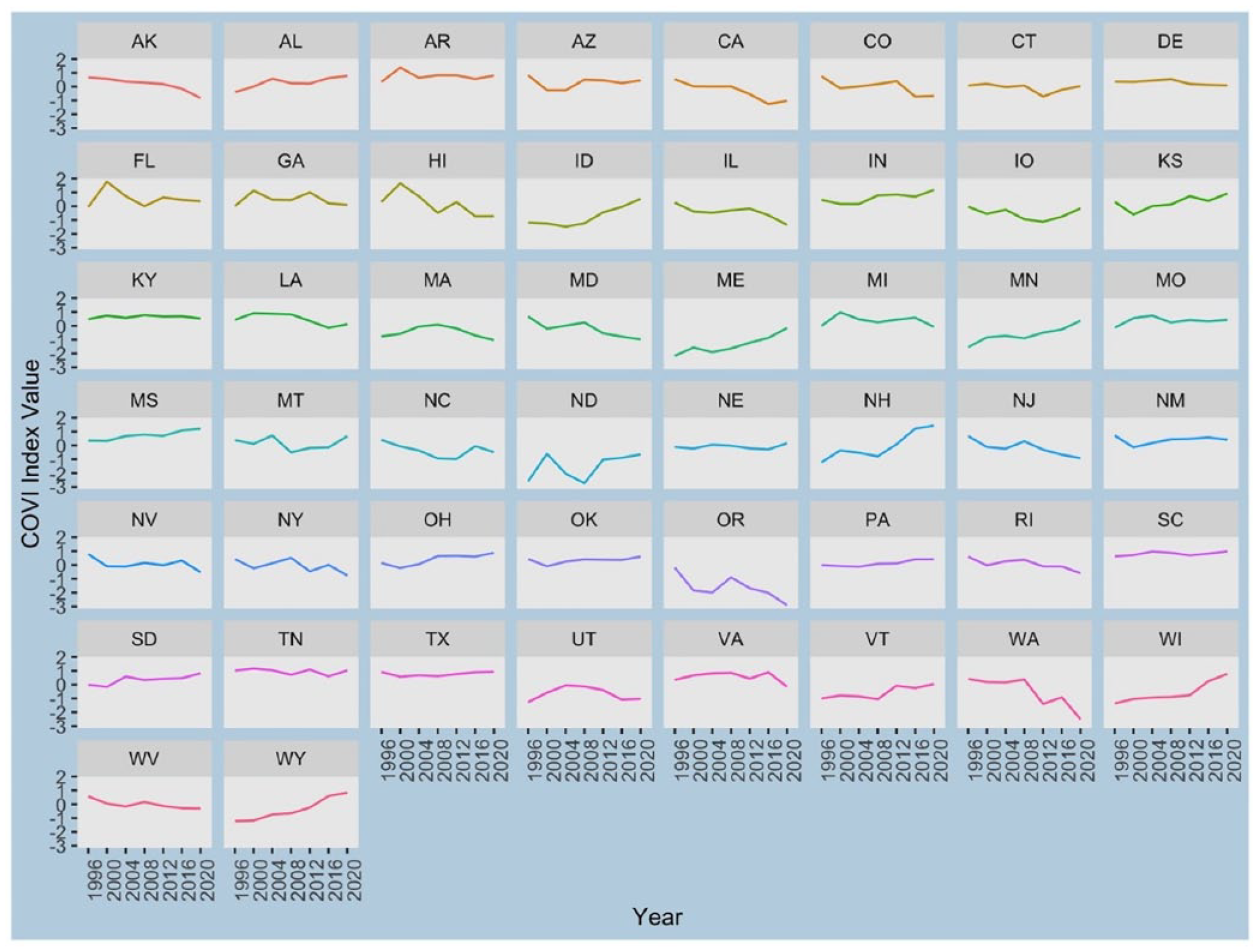
COVI values by state: quadrennial values.
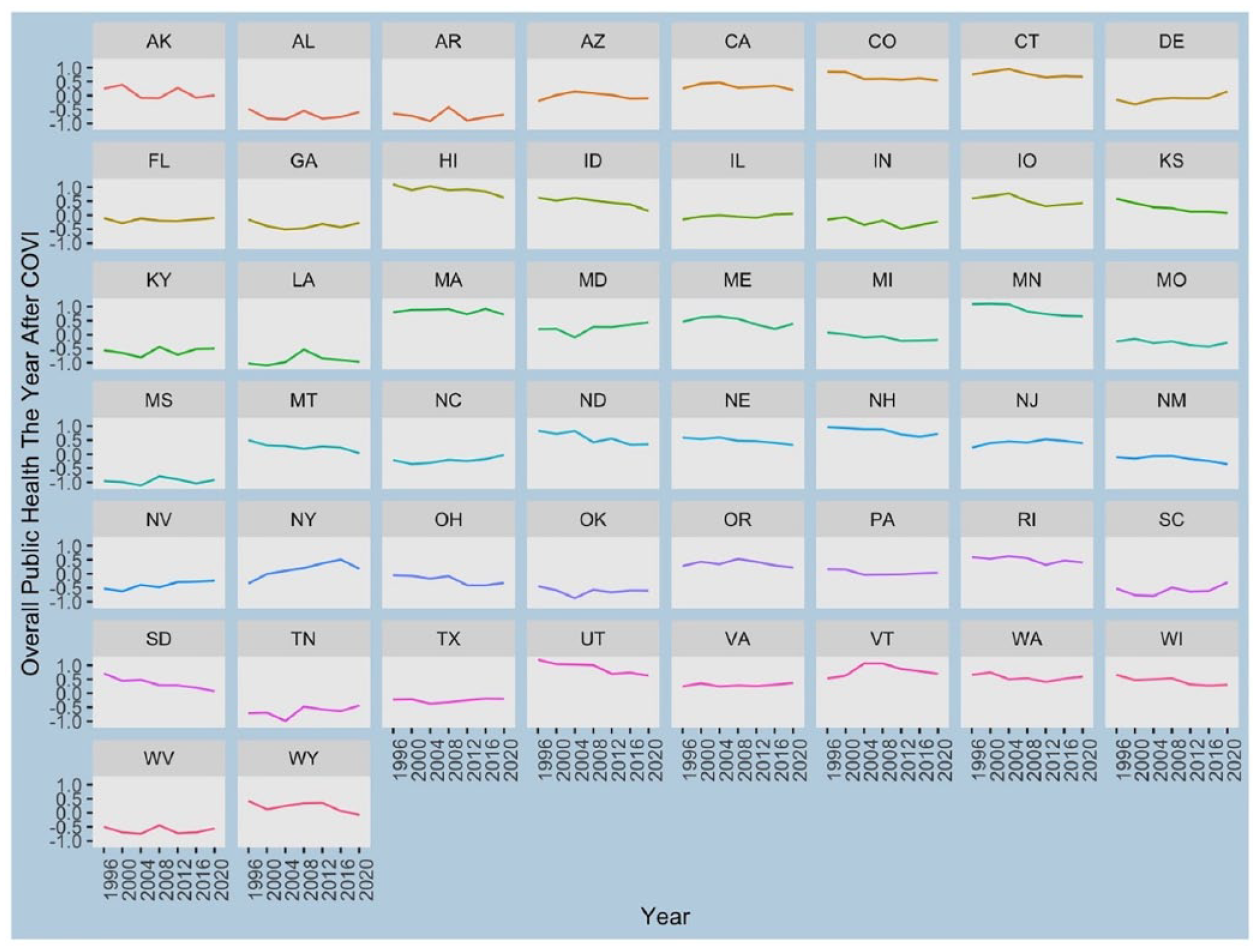
Composite overall state health values by state: quadrennial values.
From the Figures, one can easily note some congruity. For instance, the state of Idaho during the 25-year period increases the relative cost of voting (ID, Figure 2, second row) while overall state health has been declining (ID, Figure 3, second row). Minnesota (MN, third row both Figures) is another good example of the same scenario. The relative cost of voting and a reduction in overall public health appear to correspond to one another. Note, in this instance the increase in the cost of voting occurs right away (after 1996) and the corresponding drop in overall public health seems to lag some. Considering Maryland (MD, third row), one can note the opposite movement. The state has been making it relatively easier to vote and public health seems to be improving. More subtly, we can see the cost of voting improving in Virginia (VA, sixth row) and Washington (WA, sixth row), in Figure 2, and a slight improvement in relative overall health in Figure 3. Still more, consider Ohio (OH, fifth row both Figures) and Wyoming (WY, seventh row both Figures) the states have made the cost of voting, relatively speaking, higher in the period studied and the overall public health scores have dropped.
As expected, there is not a perfect match. For instance, in Oregon (OR, fifth row both Figures) voting has gotten relatively much easier over the period studied, but public health is only flat. This suggests there is something more going on. Each state likely has its own unique story. For instance, in Oregon we know the cost of voting dropped dramatically when the state became the first to adopt an all vote-at-home process in 2000. One can imagine voter turnout and corresponding changes in representation would not increase in such a sweeping fashion. Hence, there is no immediate improvement in public health. Notably, the lack of an exact match, considering each state, suggests it is prudent to control for other considerations.
Control Variables
In across-country studies, scholars find the physical environment people reside in affects public health outcomes (Pathak 2007). In this instance, the use of the American states as a unit of analysis has great advantages. Pronounced variation in access to hospitals, potable water, or sewage and sanitation services, for instance, does not vary greatly across the American states during the time period studied. Relatively speaking, the research design employed here holds these considerations constant. 10 Notwithstanding the advantages provided by the research design, it is important that the modeling still account for several contextual factors. To address this, I control for several different considerations, in the multivariate model, and cluster the standard errors by state to ensure residuals or model errors are randomly distributed (Strickland 2020). 11
Considering State Culture
A paramount antecedent consideration is state “culture.” Something about the socio-political ethos of each state might predict both the COVI and the indicator of public health. There has been considerable debate over the utility of a broad construct such as political culture for explaining anything (Morgan and Watson 1991; Sharkansky 1969). The concern is that the concept is so broad that it is difficult to imagine what exactly it is capturing. Yet, a concept such as culture is the ultimate sort of antecedent condition one ought to consider (Lieske 2012). In the end, this research uses the measurement strategy developed by Johnson (1976), which makes use of Elazar’s (1966) insights, and religious census data, to produce state designations. Johnson maintains Elazar’s tripartite distinction, which labels the American states as Individualistic, Moralistic, and Traditionalistic.
Morgan and Watson (1991) write, the Moralistic Culture views government in a positive light. Government “becomes a vital force in the search for the good life, in the quest for a common [well-being]” (33). On the other hand, Individualistic Culture “conceives of the political system as a marketplace, in which individuals and groups advance their self-interests through political action. Politics is utilitarian” (33). The Traditionalistic Culture envisions “an active role for government, but primarily as keeper of the old social order” (33). This view holds that “Political affairs should remain chiefly in the hands of established elites who often claim the right to govern through family ties or social position” (33). The research creates three dummy variables and, in the regression run, the modeling leaves out the states identified as having a moralistic culture. 12 Among the Moralistic states are California and Minnesota: two states in the top quintile on the Overall State Health measure. The results of the regression run will tell us something about the relationship between Individualistic and Traditionalistic state culture and public health, as compared to the omitted category, which provides an important check on the possibility that COVI values relate to state public health. 13
One can note an extraordinary strong negative correlation between the states identified as having a Traditionalistic state culture, which embraces elitism in governance, and overall state health (Pearson-R = −0.70). The states with a more Traditionalistic state culture, 12 are also more comfortable with voting restrictions and are statistically linked to higher cost of voting values (Pearson-R = −0.51). This maybe the answer to why COVI values are so closely associated with the public health outcomes. A high cost of voting and poorer public health, might both be the result of more Traditionalistic state cultures. Hence, it is crucial to control for this possibility in the modeling.
Controlling for Education and Income
Considering the prevailing literature, there is overwhelming agreement that educational attainment and economic well-being affect health, even if there is not a single agreed upon measurement strategy for these important concepts. Indeed, uncertainty-surrounding measurement, for empirical testing, is the bedevilment of much social science research. One can attenuate these concerns some by testing multiple measures of the same concept. The research moves forward in this vein and considers more than one measure of both education and income to learn whether the measurement strategy makes a difference.
Concerning education, Table 1 exhibits the relationship between the measure of public health and two indicators of state educational attainment. Specifically, I test the percent of state residents who have graduated high school and the percent who have graduated college. I hold that the % College Graduates is, theoretically, the more relevant consideration. Presumably, this is the level of education one might expect necessary for people to be more inclined toward political or civic engagement of the type that might associate with better health. In other words, the college educated might accumulate and share the relevant information that produces better public health outcomes. 14 Importantly, the use of High School graduation rates in the modeling does not appreciably alter the findings regarding the key concept, the COVI.
The Link Between the COVI, Public Health, and Two Measures of Education.
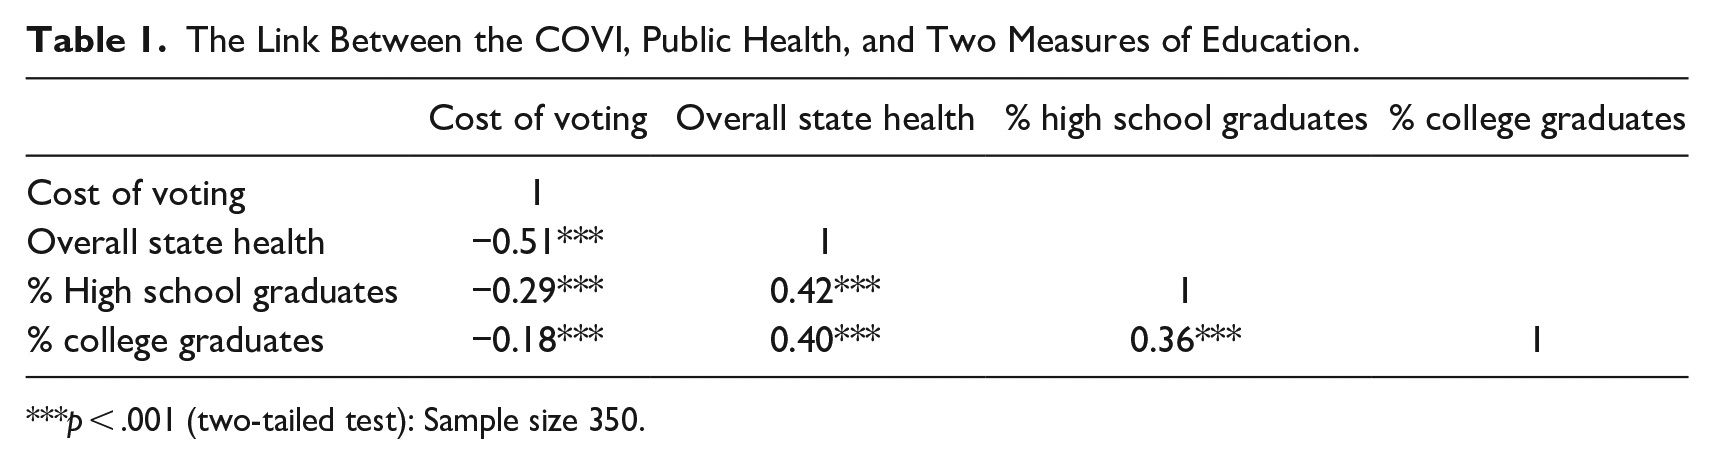
p < .001 (two-tailed test): Sample size 350.
Table 2 displays the bivariate relationships between the COVI, public health, and three indicators of the relative economic well-being of each American state. In this instance, the research holds Median Household Income and Income Inequality (the Gini Index) are, theoretically, most relevant. In the first instance, the consideration of median income, arguably, captures something more about the economic climate of a state than per capita income. Moreover, previous research finds fault with per capita income as a predictor of health outcomes (Torras 2005). Specifically, there is concern over possible reverse causation or the likelihood that better health can predict higher per capita income. Although not immune from criticism, a direct reverse causal link, whereby health predicts medium household income is somewhat less worrying. Still more, previous research suggests income inequality is a good predictor of both environmental and health outcomes (Torras 2005; Weissert and Uttermark 2017). The argument is that reduced inequality leads to greater communication, negotiation, and consultation between societal cleavages or groups. The Gini Index is the most used metric of income inequality. A value of “0” represents perfect equality across a society. The model employs the Gini Index value for each American state measured at seven points of time, coinciding with presidential election years from 1996 to 2020.
The Link Between the COVI, Public Health, and Three Indicators of State Economic Well-Being.
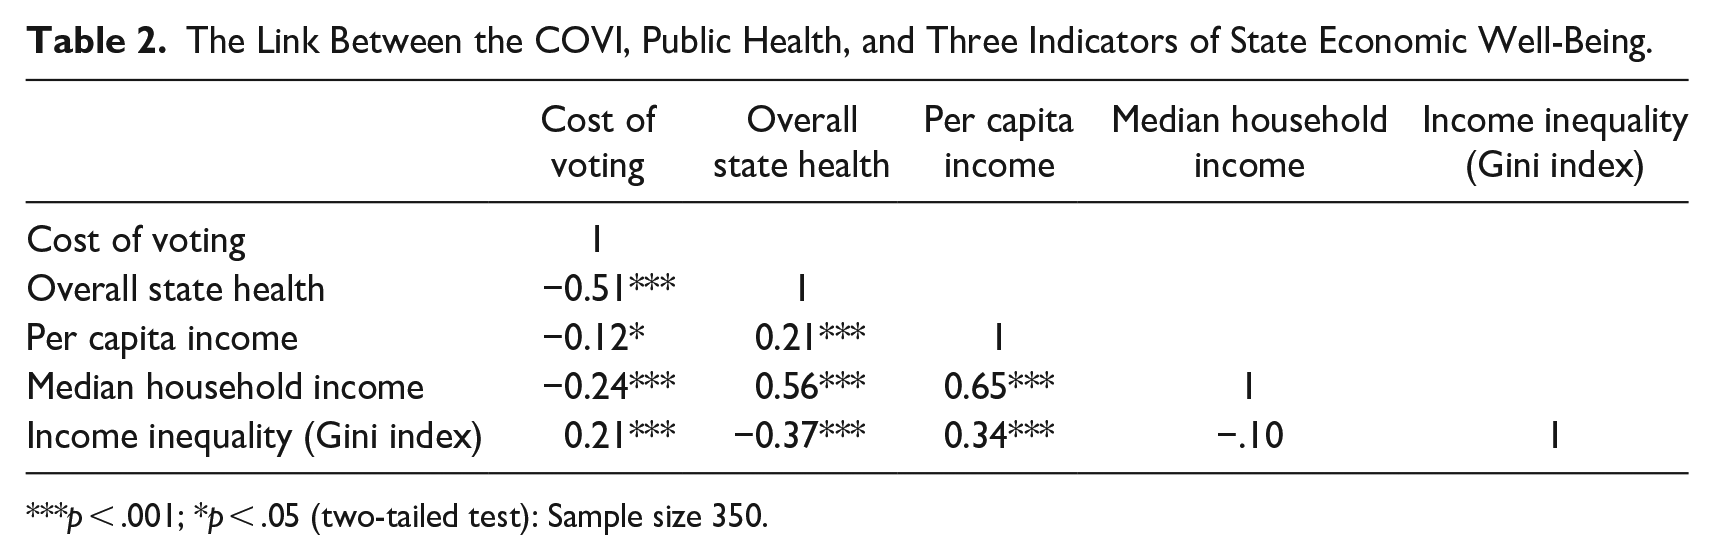
p < .001; *p < .05 (two-tailed test): Sample size 350.
Other Considerations
There is a special focus on education and income in this research because these two considerations are so central to previous scholarship. Yet, there are other concerns one must consider. Beyond state culture, and education and income, this research also controls for the partisanship of state legislatures (% Republican Legislators). In the United States, scholars find that Democratic Party control of state legislatures, “mitigates the negative impact of racial diversity on inequality in healthcare coverage” (Zhu and Clark 2015, 239). Others find that conservative state legislators are less committed to better public health outcomes (Dodson et al. 2013). Specifically, I use the percentage of seats in each state legislature occupied by members of the Republican Party (GOP) at the seven different points in time and anticipate a negative association with overall state health. Most specifically, I divide the total number of sitting GOP state legislators by the total number of legislative seats (Upper Chamber + Lower Chamber) and multiply the quotient by 100. It can be noted, the measure has a negative bivariate association with overall state health that is not statistically significant (Pearson-R = −0.04; p < .49; n = 350). 15
One obvious consideration, which ought to influence the outcome variable, is Public Health Funding. More public funding ought to lead to better overall state health. International research, notes the level of government financial commitment to healthcare is an important predictor of health outcomes (Ghobarah, Huth, and Russett 2004). To measure public health funding, at the American state level, I make use of the composite Z-scores provided by the America’s Health Rankings, which taps several different indictors of state financial commitment to public health. Supplemental Appendix A explains data sources and other pertinent information on all the variables included in the analysis.
Another obvious consideration is state residents without health insurance (% Uninsured). Specifically, the modeling uses the percentage of state residents without insurance of any kind, as reported by America’s Health Rankings. The survey question they employ is, “Do you have any kind of health care coverage, including health insurance, prepaid plans such as HMOs, or government plans such as Medicare, or Indian Health Service?” The strategy finds as few as 3% of state residents with no health insurance in Massachusetts in 2020 and this grows to 24.9% in Texas, in 2008. The expectation is a negative association between state residents without health insurance and overall state health.
The next consideration is the extent to which a state legislature is a fulltime body with adequate resources to address health problems. Some state legislatures have more resources and meet more often to address societal problems. For instance, the Montana, Nevada, North Dakota, and Texas legislatures only have a regular session every other year. Moreover, state legislatures vary greatly in staff resources. I use the Squire (2007, 2017) Index of Legislative Professionalism. The variable is included because it is easy to imagine part time or amateur legislatures not expending the time and resources necessary to promote better public health outcomes. Moreover, less professional state legislatures are more elite bodies, on average. The low salaries in amateur state legislatures dictates that only the wealthy, or those in retirement, will have the financial wherewithal to work an additional part-time job for little or no pay. The state of California routinely receives a high Squire Index score indicating a state legislature compensating lawmakers well, providing considerable staff resources, and meeting year-round. The Squire Index ought to associate positively with overall state health.
Last, I control for the size of each state’s Black and Hispanic populations (% Black and % Hispanic). Existing research has found “that certain U.S. subpopulations have cultural advantages or disadvantages relating to health” and that these compensations are a product of regional subcultures (Jackson 2013, 461). These politically under-represented groups are lower on the socio-economic ladder, on average, than majority whites, which produces health-related concerns. Research routinely finds larger Black populations associated with compromised health outcomes (Deaton and Lubotsky 2003; McLeod, Nonnemaker, and Call 2004; Mellor and Milyo 2002). Considering state Hispanic populations, previous literature is more mixed. Overall health, among Hispanics is lower. However, some refer to a Hispanic paradox as it relates to infant mortality and find that larger state Hispanic populations associate with a lower infant mortality rate, all else being equal (Hummer et al. 2007). In the research, the anticipation is that, larger state Black populations will associate with lower overall state health scores. Once controlling for income and education I do not anticipate that the size of the state Hispanic population will relate to health either positively or negatively.
It is now time to put all the variables into a single model to learn if the COVI, a surrogate for the restrictiveness of a states’ voting laws, will still associate with lower overall state health. The test, which follows, employs a Generalized Least Squares (GLS) regression to account for data arrayed across sections (the 50 American states) and over time (seven presidential election years). This methodological strategy accounts for the possibility of autocorrelated errors or residuals. 16 Because the research is interested in both across state difference and within overtime-state differences, I use a random effects model specification. This approach averages between state effects and within state effects. 17
Findings
Table 3 exhibits the findings of the multivariate test. The results suggest the COVI associates negatively, in a statistically significant manner, with this particular measure of state health. When the cost of voting is higher, overall state health scores are lower. This finding is quite impressive considering the model holds constant the antecedent condition of state culture and a whole host of other possible explanations for between state and within state variation in health outcomes. It is important to reiterate there is no overlap in the measurement of the COVI and the state public health composite score. One might imagine when constructing indices that include a large number of state-level considerations that a strong relationship might occur because one or two component parts of the two indices is the same. In this case, the measurement strategies are entirely distinct.
Predicting Quadrennial State Public Health Outcomes (1996–2020). Model: GLS Regression–Random Effects With Standard Errors (SE) Clustered by State. a
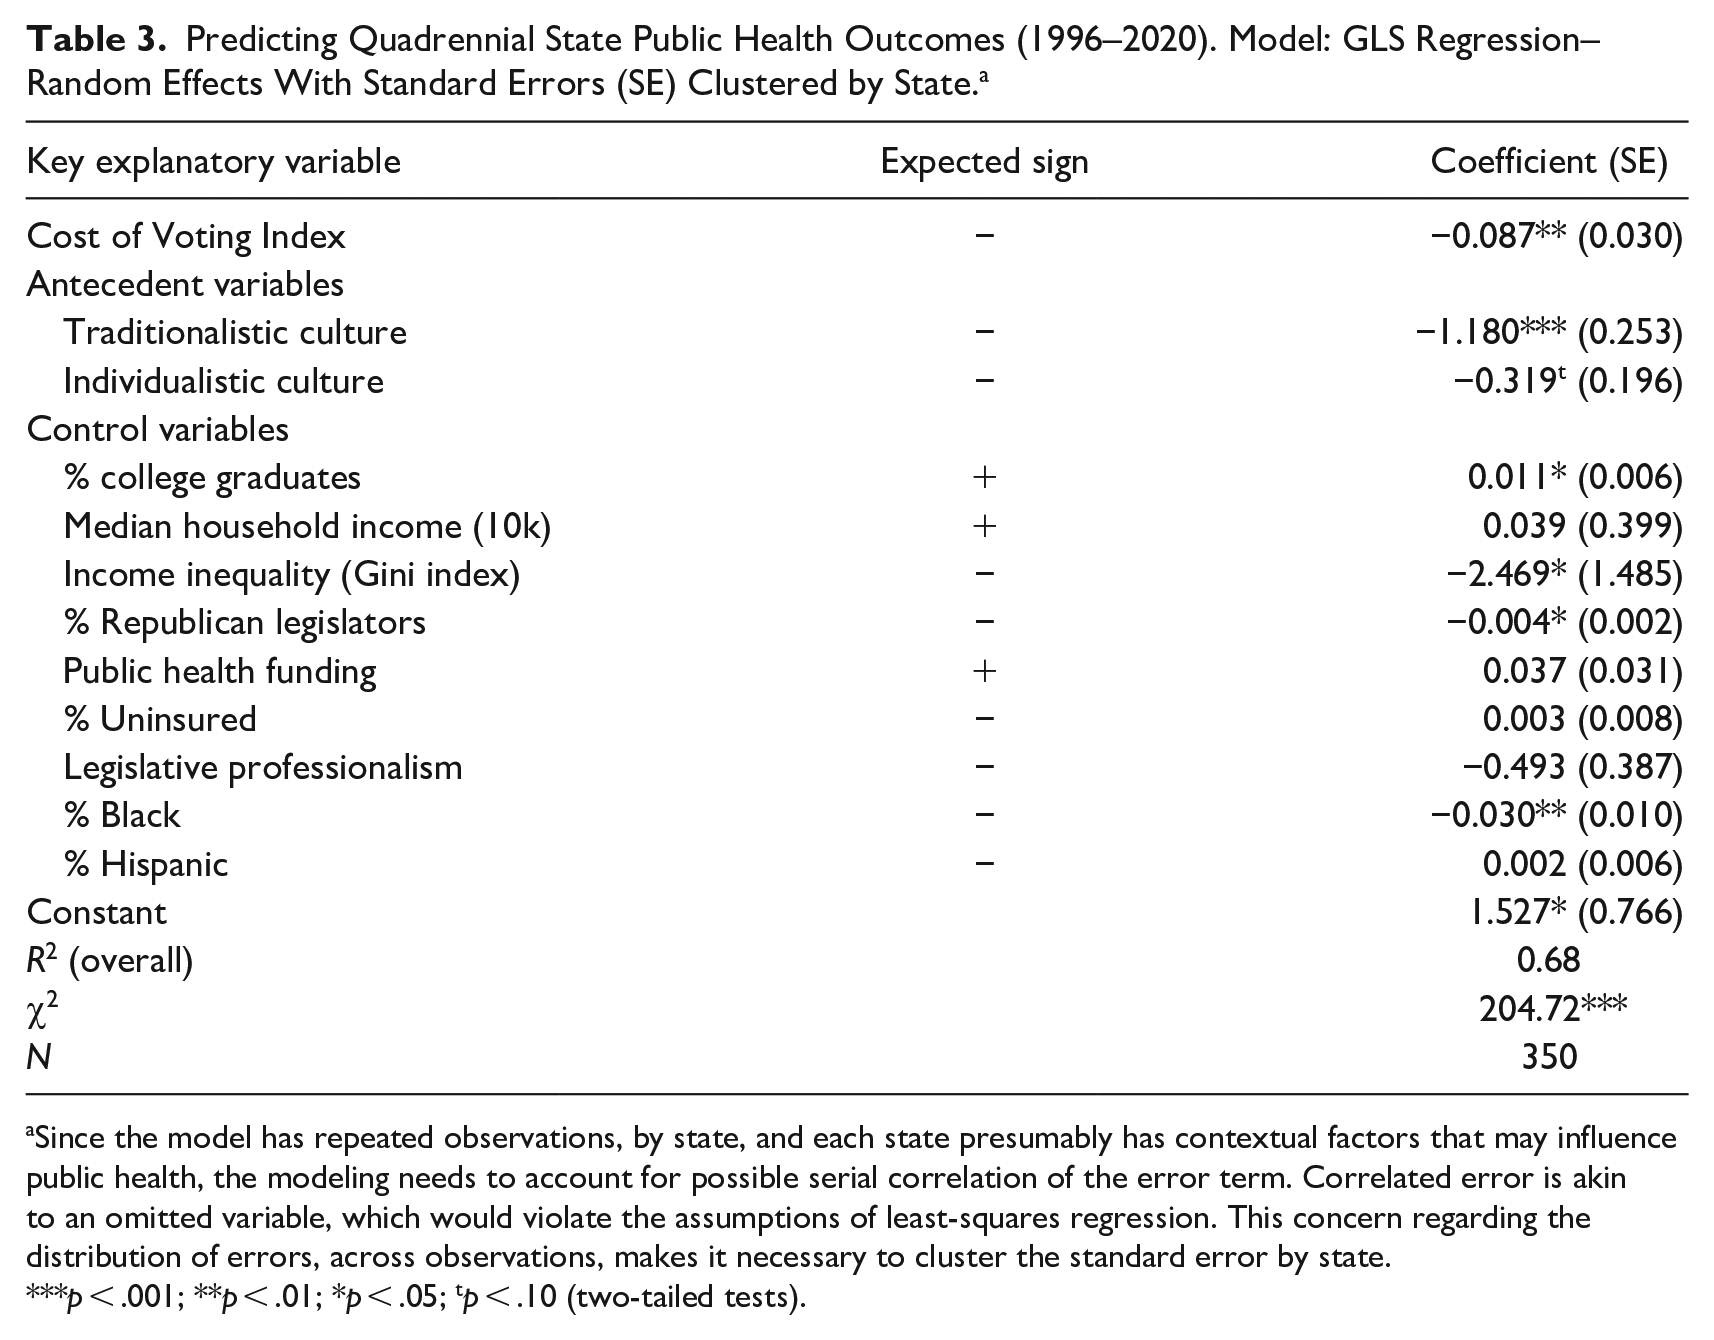
Since the model has repeated observations, by state, and each state presumably has contextual factors that may influence public health, the modeling needs to account for possible serial correlation of the error term. Correlated error is akin to an omitted variable, which would violate the assumptions of least-squares regression. This concern regarding the distribution of errors, across observations, makes it necessary to cluster the standard error by state.
p < .001; **p < .01; *p < .05; tp < .10 (two-tailed tests).
The coefficient (−0.087) suggests that a one standard deviation increase in the cost of voting associates with about a 0.09 decrease in a state’s standardized overall health score, on average, all else being equal. Substantively, this might not seem like a large effect, but given the range of the overall state health score is only 4.35 the coefficient is, arguably, more meaningful. To illustrate, in 2020, the state of Delaware had a little more than a one standard deviation lower COVI score than South Carolina. This suggests Delaware was making it easier for state citizens to vote. Correspondingly, there was a 0.84 greater standardized overall state health score in Delaware than there was in South Carolina in 2020. It is difficult to extrapolate more completely. Yet, it is safe to assume that the better health score in Delaware is responsible for a higher quality of life in The First State and may even be responsible for saving lives.
Considering some of the control variables, the test returns results that comport well with expectations. For instance, a Traditionalistic State Culture in strongly linked to poorer public health outcomes, when compared to Moralistic states. States with more college graduates associate with better public health and states with greater income inequality experience a lower public health outcome. Although there was a strong and statistically significant bivariate relationship between median household income and health (Pearson-R = 0.56; p < .001), this consideration is not significant in the multivariate model. It is worth mentioning that the political party in control of the state legislative process, the % Republican consideration, associates with a lower overall state health score. This finding is consistent with earlier research (Zhu and Clark 2015). State’s with larger Black populations experience worse public health outcomes, on average, all else being equal. Yet, the state Hispanic population, after holding other considerations constant, does not associate with a lower overall score.
Considering the key explanatory variable (the Cost of Voting Index), the results point to obvious policy prescriptions. States interested in better public health outcomes ought to consider removing barriers to voting. For instance, some states with lower COVI values allow 16 years old to pre-register to vote and accompany this state law or policy with a mandate to teach civic education in public high schools. Moreover, making it easier to vote by dropping voter registration and absentee voting restrictions might produce an opening for more civic engagement of the type that educates people and exposes them to more complete health care information. Still more, providing citizens time off from work to vote might relieve stress associated with finding time to vote, with possible health benefits.
Conclusion
One theoretical claim advanced, here, suggests a more engaged citizenry will gain access to quality information related to better health decision-making. The research needs to make several measurement assumptions to test the theory. Admittedly, it is quite impossible to find a perfect measure of any concept, let alone, “an increase in meaningful civic engagement born of fewer voting restrictions.’” Despite this, the outcome variable in this research, state health, is too important to ignore. Making use of the recently developed Cost of Voting Index as a proxy for voting restrictions and the potential for citizen civic involvement, this research has developed a novel means of testing for a positive relationship between a more engaged body politic and better health outcomes. The research makes a sincere effort to falsify the hypothesized relationship, by controlling for a host of other considerations. The attempt to falsify has been unsuccessful. Instead, the research findings suggest a more restricted state electoral climate may stunt the flow of information that would necessarily lead to better community health outcomes.
This research has uncovered a robust relationship between the cost of voting in the American states and overall public health. This is the case after controlling for state educational attainment, median household income, income inequality, and the antecedent condition of state culture. Arguably, “culture” can affect both voting restrictions and overall health. I find that the Traditionalistic elite-based ethos, found in the Southern states, does relate predictably to higher cost of voting values and lower public health outcomes. Moreover, Traditionalistic states relate to many of the other control variables in this analysis. Southern states, on average, experience lower median household incomes and lower educational attainment. This correlation of many different variables in the same statistical model has the potential to produce multicollinearity of the type that boosts standard errors and causes bias in inferences. The threat is that explanatory variables will not statistically link to the dependent variable because of the inflated error. Yet, this is not the case. After controlling for all the related conditions, the research still finds that overall health, across the American states and over time, moves with COVI values in the hypothesized manner.
Scholars have long imagined that both voting (Hillygus 2005) and a commitment to democracy might matter when it comes to public health. This research has uncovered evidence that supports their suspicions. Unfortunately, as is the case with most social science research, one must stop short of a causal claim. Moreover, I have not been able to disentangling the competing theoretical arguments regarding a causal mechanism. The findings warrant further research that takes a qualitative approach and studies single states such as Wisconsin and New Hampshire that have increased the relative cost of voting rather dramatically in the past 25 years. The work should check changes in representation and policy that have occurred since these states made voting more cumbersome. Specifically, it would be important to learn if voting restrictions produced a different partisan mix of state legislators and subsequent changes in public health resource funding. For now, all that is certain is that states where voting is more difficult associate with poorer public health outcomes.
Supplemental Material
sj-pdf-1-slg-10.1177_0160323X231202421 – Supplemental material for Voting Restrictions and Public Health: An Analysis of State Variation 1996–2020
Supplemental material, sj-pdf-1-slg-10.1177_0160323X231202421 for Voting Restrictions and Public Health: An Analysis of State Variation 1996–2020 by Scot Schraufnagel in State and Local Government Review
Footnotes
Declaration of Conflicting Interests
The author declared no potential conflicts of interest with respect to the research, authorship, and/or publication of this article.
Funding
The author received no financial support for the research, authorship, and/or publication of this article.
Supplemental Material
Supplemental material for this article is available online.
Notes
Author Biography
References
Supplementary Material
Please find the following supplemental material available below.
For Open Access articles published under a Creative Commons License, all supplemental material carries the same license as the article it is associated with.
For non-Open Access articles published, all supplemental material carries a non-exclusive license, and permission requests for re-use of supplemental material or any part of supplemental material shall be sent directly to the copyright owner as specified in the copyright notice associated with the article.