
Abstract
This article outlines how counties and municipalities in North Carolina prepared their fiscal year 2020–21 budgets amid the uncertainties of the COVID-19 pandemic. In response to an April 2020 survey, 92 percent of jurisdictions reported anticipating a general-fund shortfall for FY 2021, and over 20 percent expected shortfalls exceeding 10 percent of their general funds. Over three-quarters of jurisdictions reported not budgeting for any new positions, and over half instituted hiring freezes. This research presents important insights into how counties and municipalities prepared for the recession and highlights the differences and similarities of those strategies.
Introduction
Arguably, every budget season is an exercise in planning for the unknown. Will that plant close down? Will there be a hurricane? However, budgeting for FY 2021 put budget and finance officers in an unprecedented situation. In the spring of 2020, economists were confident that the United States would likely be entering a recessionary period within the coming twelve months, and many believed that it would “be the worst recession in generations” (Pickert, Qiu, and McIntyre 2020), so local governments found themselves in the position of budgeting for a not-yet-realized but substantial recession. Furthermore, there was, and continues to be, great uncertainty about (1) how long communities would feel the effects of the COVID-19 pandemic, (2) the timing of stay-at-home orders and people’s reluctance to resume their normal activities, and (3) the ultimate impact of COVID-19 on businesses and employers.
In past recessions and economic downturns, local governments have been tasked with the difficult job of balancing their budgets and providing vital services while being constrained by tax limits, expenditure limits, and other political realities. While there is no formula for local governments to follow to best craft these budgets, the literature does suggest that some behaviors are better for local governments’ economies and citizens. These strategies include maintaining spending levels, increasing infrastructure spending, and avoiding tax increases if possible (Fisher 1997; Orszag and Stiglitz 2009; Marlowe 2009; Miller and Svara 2009; Afonso 2013). Given that local governments had advanced knowledge of an oncoming economic downturn, this research examines early evidence of whether FY 2021 budgets employ budgeting best practices more so than in previous recessions. It also explores the differences between counties and municipalities, which provide different services, use different sets of revenues, and operate under different constraints.
This analysis presents the results of a survey conducted in North Carolina in April 2020, in the midst of budget season. 1 The survey was conducted by the North Carolina Local Government Budget Association and the North Carolina League of Municipalities. It presents the working assumptions behind the preparation of FY 2021 budgets and the budget balancing strategies employed when revenue shortfalls were anticipated. This research complements recent studies that have begun to explore local government issues around resilience in response to the pandemic, opportunities for innovation, and their accompanying challenges (Maher, Hoang, and Hindrey 2020; Dzigbede, Gehl, and Willoughby 2020; Anessi-Pessina et al. 2020). Overall, the data suggest that local governments in North Carolina prepared for a recession by appropriating fund balance and using common cutback-management strategies that have been identified in the literature, like reductions in staffing including hiring freezes and budgeting for no new positions.
This analysis proceeds with a brief discussion of the pandemic response in North Carolina. It is followed by an introduction to the survey instrument that was employed in the Spring of 2020 to assess county and municipal budget preparations for FY2021. Then the anticipated impacts of the pandemic regarding revenues are explored, which is followed by a discussion of the budget balancing strategies being employed in response to anticipated revenue shortfalls. Lastly, conclusions and implications for local governments are discussed.
The Response to COVID-19 Pandemic in North Carolina
While every state was impacted on a slightly different timeline and to different extents by the pandemic, North Carolina’s experience reflects the broader national trends. The North Carolina governor’s stay-at-home order went into effect on March 30, 2020. It was initially scheduled to end on April 29, 2020, but was later extended into May, when conditions were expected to be conducive to reopening nonessential businesses. 2 While no formal statewide stay-at-home order had been in place previously, many local jurisdictions had already issued their own. Many school systems had already canceled in-person classes and moved to remote instruction. Thus, restrictions on public gathering and the closing of businesses began affecting some local economies before the statewide order went into effect. This experience reflects the broader national trends.
In the early stages of the pandemic, when this survey was conducted, it appeared that North Carolina had not experienced the public-health crisis as dramatically as some states, like New York, Illinois, and Louisiana (Kommenda, Gutierrez, and Adolphe 2020), and was representative in many ways of other, less affected states in terms of its timeline and response. North Carolina was one of twenty-six states that issued statewide stay-at-home orders between March 23 and March 30 (Kates, Michaud, and Tolbert 2020). This period coincides with the most intense portion of “budget season” in North Carolina since proposed budgets are presented to elected officials in May typically and must be adopted no later than June.
The ways in which local governments are able to respond to economic downturns are also driven by the responsibilities and available revenues. County governments in North Carolina must provide law enforcement, courts, capital for public schools (though there are separate school districts), social services, public health services, and mental health services. They often provide additional services, such as libraries, community colleges, and fire protection. The only service that municipalities are required to provide is building-code enforcement, but many also provide other services, such as law enforcement, streets, water systems, sewer systems, solid-waste disposal, and parks and recreation (Lawrence 2020). To finance those services, North Carolina counties and municipalities rely on a mix of revenue streams that mirror much of what local governments elsewhere rely on. The three major revenue sources for counties in North Carolina are property taxes, sales taxes, and a number of sales and services, including parking revenues, rents, royalties, and library services. The three major revenue sources that municipalities in North Carolina rely on are utility revenues, property taxes, and sales taxes. 3 Although counties and municipalities rely on sales tax revenues, only counties levy sales taxes, the revenue from which is then shared with municipalities. This tax base includes food sales, which may lead to more-stable revenues. 4
The Survey Instrument
In April 2020, the North Carolina Local Government Budget Association and the North Carolina League of Municipalities sent out a survey on budget strategies to all local governments in the state of North Carolina. The survey instructed each jurisdiction to have a single person complete the survey. The survey had three sections. The first section solicited basic information about the jurisdiction, including the number of people it employed and its general-fund budget. The second contained questions about revenues for FY 2021 and the fourth quarter of FY 2020. The third contained questions about budget strategies, including staffing decisions and departmental allocations. The three sections together contained fifty-five items total.
The survey was open for two weeks and had 210 responses, 142 of which were usable and largely complete. The survey was sent out by the NCLGBA and the NCLM. In total, three emails were sent to request participation. Seventy-one of North Carolina’s one hundred counties were represented by the municipal and county jurisdictions reporting. In total, there were responses from twenty-nine counties and 113 municipalities, with strong regional representation across the state. There was also a good mix of rural, urban, and tourism-rich counties represented.
The responding communities were diverse not only in geography but also in size. For example, the Town of Lattimore in Cleveland County has a reported general-fund budget of $89,000, with no full-time staff and only two part-time staff members. Wake County, in contrast, reported a general-fund budget of almost $1.5 billion, with a full-time staff of 4,361 and a part-time staff of 117. Table 1 shows the distribution of size among the reporting jurisdictions.
Survey Respondent Jurisdictions: Size of General Fund and Staffs.
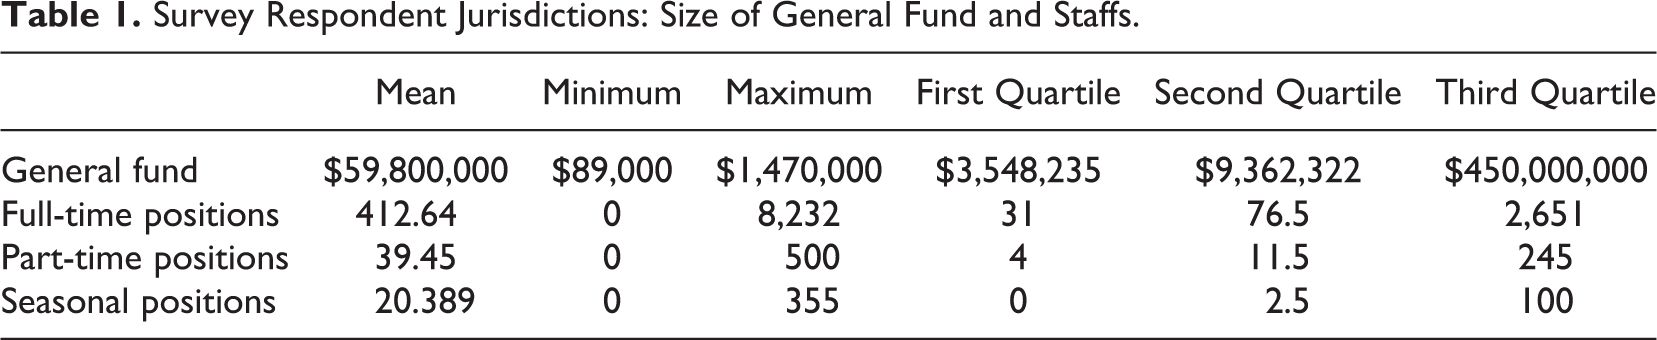
Despite this diversity, there was consistency in the perceptions of local economic conditions. Respondents assessed many industries, like real estate, construction, and manufacturing, as stable and, in some instances, growing. Other industries, like tourism, restaurants, and retail, were declining in the majority of communities.
The Impact of COVID-19 on Finances
As COVID-19 created the need for stay-at-home orders, it quickly became apparent that many revenue sources at the federal, state, and local levels would be adversely affected. However, the effects were expected to be felt most strongly at the state and local levels, where most jurisdictions rely on taxation of income, sales, and property and are unable to deficit spend like the federal government. Local governments that rely heavily on occupancy or sales taxes immediately feel the effects when employment and consumption decline. Although effects on property taxes may lag, demand for property can decline, and property taxes can decline with them in the short term (Pagano and McFarland 2020). Not all local governments in North Carolina have occupancy taxes, but most rely on property and sales taxes.
The survey results suggest that the majority of respondents were anticipating budget shortfalls and budgeted accordingly. While many were experiencing substantial revenue decreases in FY 2020 Q4, the vast majority (92 percent) anticipated continued general-budget shortfalls in FY 2021. More than 20 percent of respondents expected those shortfalls to exceed 10 percent of their budgets for general funds. Perhaps most surprising, almost 40 percent of respondents expected property taxes to decrease within the next fiscal year.
Figure 1 presents the average anticipated reduction in revenues by county area. The respondents who answered yes to the revenue-shortfall question were prompted to answer the follow-up question, “What percentage range of your General Fund budget do you expect the shortfall to be?” The options were 0–5 percent, 6–10 percent, 11–20 percent, and 21–50 percent. If the previous response was No or Unsure (five respondents selected these options), the revenue-shortfall question was assigned a value of zero for the purpose of calculating the average. The upper bound of each range was used when respondents answered in the affirmative. The county areas expecting the greatest impact were primarily rural: Johnston, Dare, Rutherford, and Jones Counties. The one exception was Forsyth, which also reported high anticipated shortfalls and is home to Winston-Salem, a mid-sized city. Otherwise, the anticipated effects of the pandemic on revenues are distributed across the state and county areas relatively evenly.
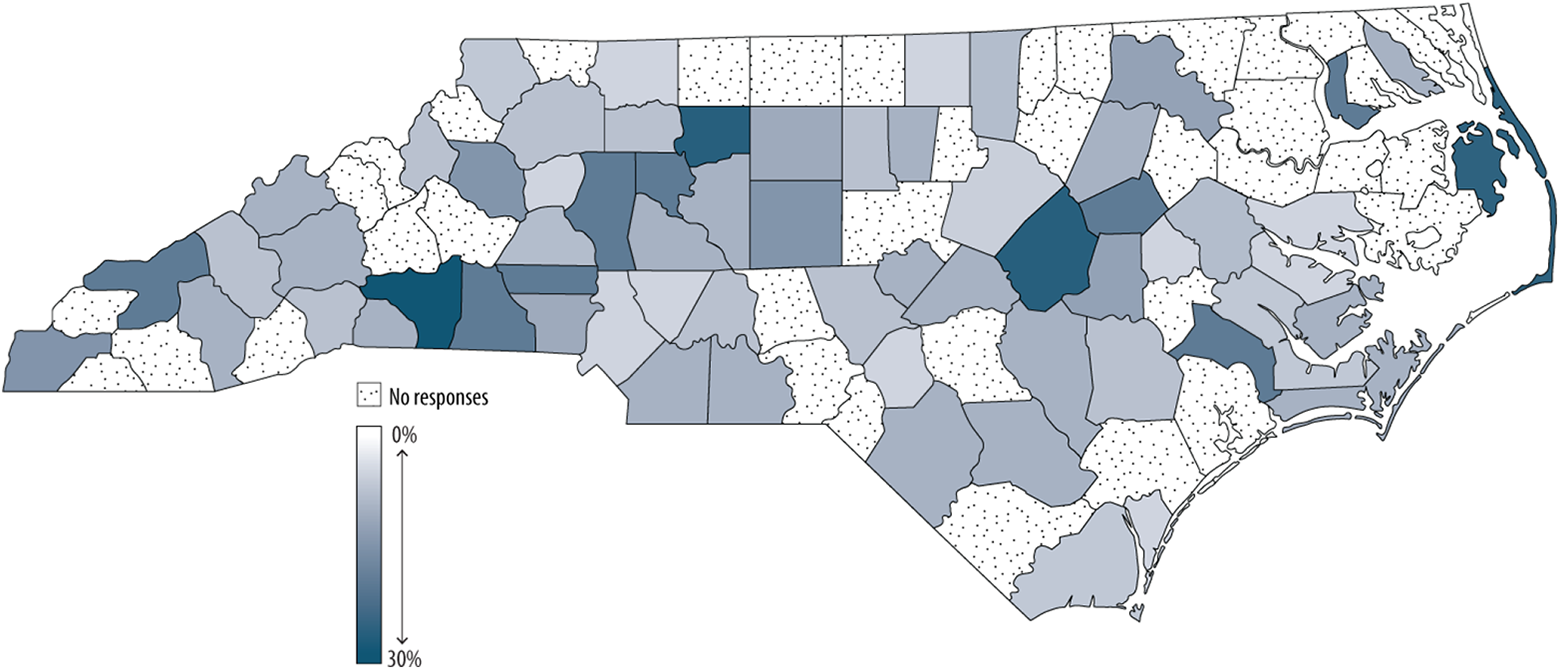
Percentage of general fund shortfall anticipated for fiscal year 2021 by county area.
The majority of reporting jurisdictions were anticipating reductions in sales tax revenue. As previously mentioned, North Carolina municipalities do not have the authority to levy a local sales tax, but they do receive a portion of the revenue generated from county-levied sales taxes. It is important to note that this survey was conducted in April 2020, and there is a lag of approximately three to four months between when a sale occurs and when the state distributes the tax revenue, so local governments had not yet seen how their sales tax revenues had been affected by the pandemic in FY 2020. Figure 2 presents the expected impact of COVID-19 on these revenues by quarter from FY 2020 Q4 to FY 2021 Q4. The majority of jurisdictions anticipated a substantial reduction starting in FY 2020 Q4, but most were also optimistic that by FY 2021 Q2, the effect on local sales taxes would be minor. Many respondents even projected growth in sales tax revenues by the end of FY 2021.
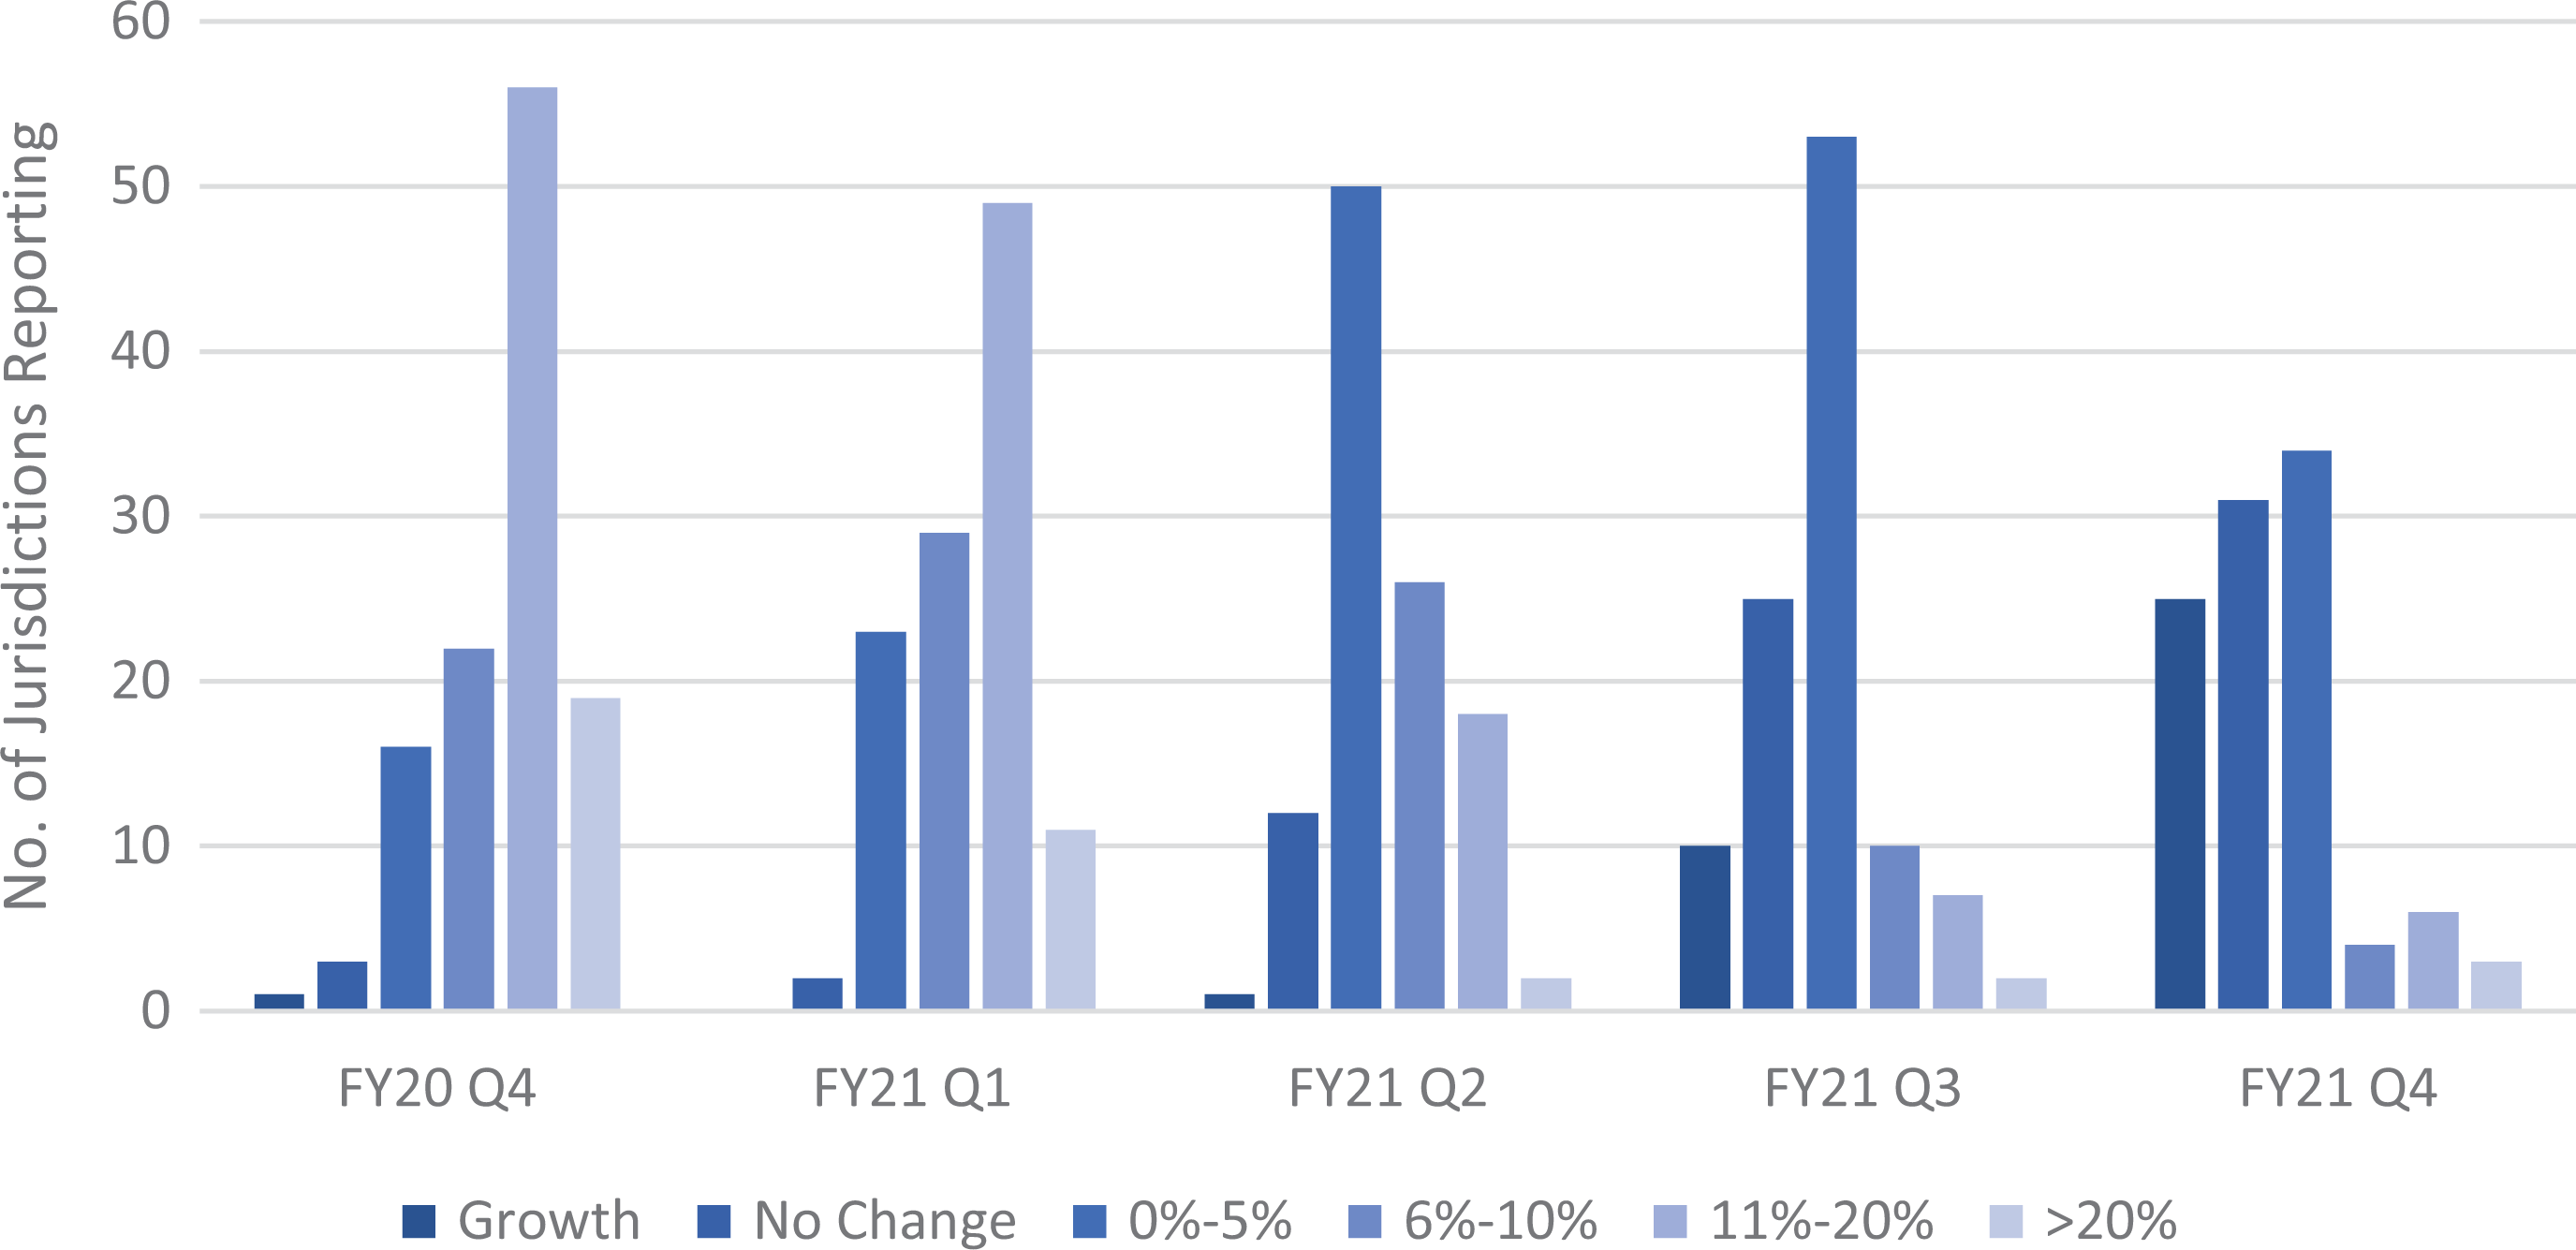
Expected reduction in sales tax revenue: municipal and county.
Less than 4 percent of respondents did not anticipate declines in sales tax revenues for FY 2020 Q4, and almost two-thirds anticipated a greater-than-ten-percent reduction. This trend grew stronger for FY 2021 Q1, when all counties anticipated reductions and only two municipalities forecast for no change in sales tax revenues and 84 percent anticipated greater-than-ten-percent reductions and 47 percent of municipalities did with an average of 52 percent of the respondents anticipating dramatic declines. The anticipated reductions decreased sharply beginning in FY 2021 Q2, with less than 20 percent of jurisdictions anticipating a greater-than-ten-percent reduction. By FY 2021 Q4, less than 13 percent of jurisdictions anticipated a greater-than-six-percent reduction. While county and municipal expectations follow similar trends, counties were on average more conservative with their forecasts. This is an interesting finding since they share the same tax base. In fact, municipalities do not levy sales taxes and just receive a share of the county’s sales tax. This difference in expected reductions is likely due to the dependence on sales taxes, counties in North Carolina rely more heavily on sales taxes than municipalities do. Sales taxes are the second largest source of own source revenues for counties making up 15.5 percent of own source revenue. In contrast, sales taxes are less than 10 percent of own source revenue for municipalities (Nida and Afonso 2019).
Respondents anticipated reductions not only in sales taxes but also in occupancy taxes and property taxes. Figure 3 presents the pandemic’s anticipated impact on both of these revenue instruments. It is worth noting that occupancy taxes are not generally authorized in North Carolina but require authorization from the state legislature via local acts (McLaughlin 2013), so not all jurisdictions have them. Most municipalities and counties with occupancy taxes anticipated reductions in revenue for the remainder of FY 2020, with slightly less dramatic reductions in FY 2021. However, expectations for property taxes were more divergent. Numerous jurisdictions were still expecting growth in property tax revenues in FY 2021, but many were anticipating declines (though generally small declines). Respondents were able to comment on these expectations in the survey, and a few noted that they were anticipating reduced collection rates. For example, Durham County expected a reduction in property tax revenue of 0–5 percent and commented, “Expecting property tax collection rate to suffer. We are currently at 99.6%, planning 99.1% for FY 20–21.”
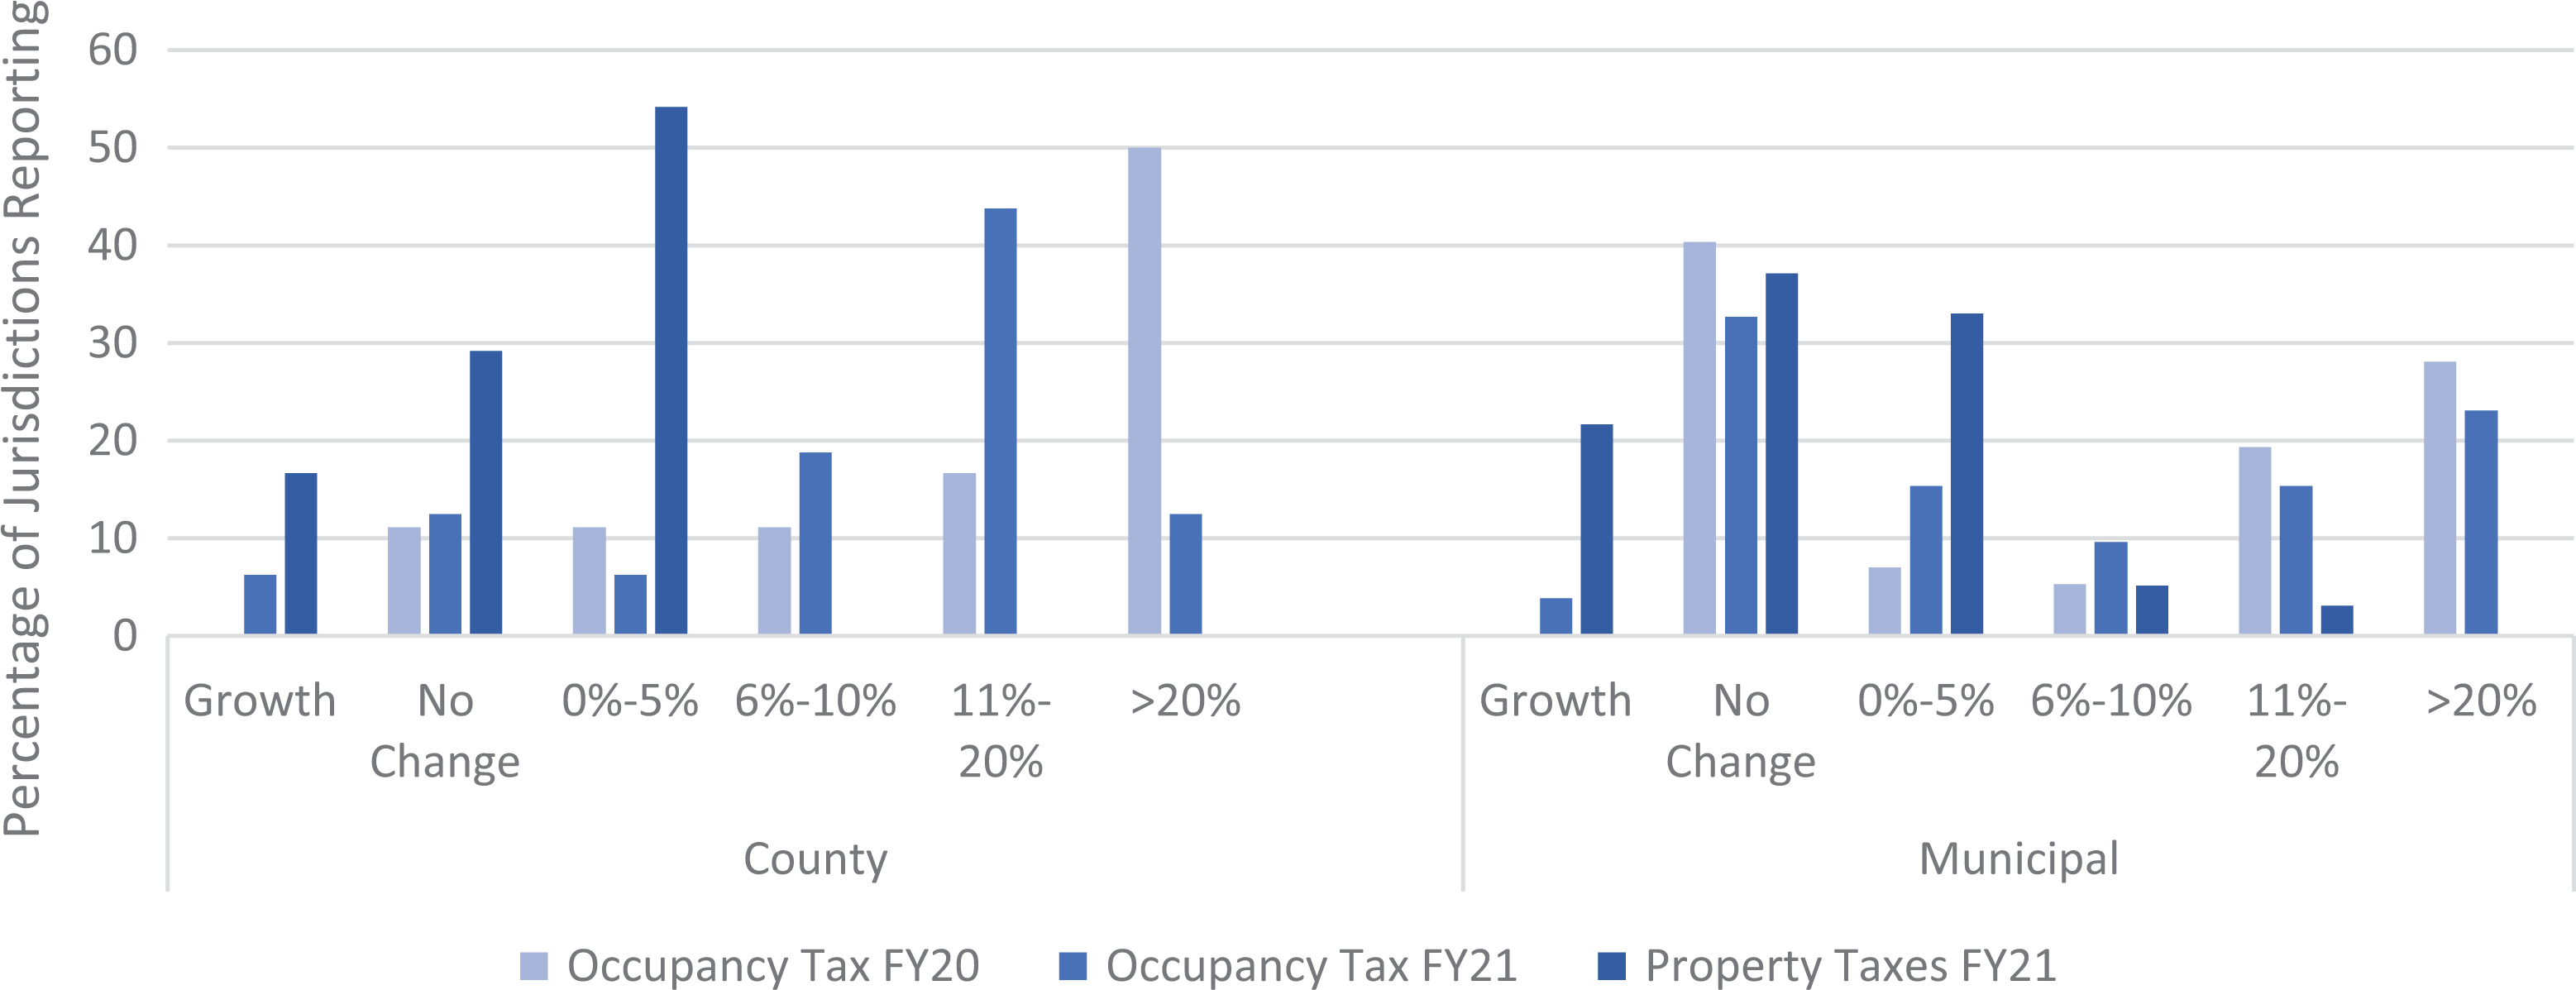
Expected reductions in occupancy and property taxes.
There was a field where respondents could comment on “Other Revenues for FY21,” and the most commonly noted were utility revenues. Twenty-seven jurisdictions commented that they were budgeting for reductions in utility revenues (water, sewer, and in some cases, electric), though two jurisdictions said that they believed utility revenues would be higher. Many respondents said that, due to some residents’ inability to pay, the jurisdiction was neither charging late penalties nor disconnecting service. For example, the Town of Granite Falls anticipated revenue from the electric utility to decrease by 15 percent in FY 2020 Q4 and for water and sewer revenues to decrease by 8 percent. The other most cited additional decrease in revenues was a reduction in investment or interest earnings, with sixteen jurisdictions budgeting for sharp declines. The Town of Montreat was representative of many jurisdictions, expecting interest earnings to decrease by 75 percent and revenues from water and sewer services to decrease by 10 percent due to residents’ inability to pay. Other revenue declines mentioned by respondents included user fees (two respondents), landfill-hosting fees (one), building permits (three), recreation revenues (twelve), and taxes on car rentals (two), real estate transactions (one), vehicles (two).
The last revenues reported are intergovernmental transfers (IGTs) from the state and federal governments. This revenue category contained the most responses of Unknown. Thirty jurisdictions reported Unknown for anticipated change in state IGTs, and thirty-eight responded Unknown for anticipated change in federal IGTs. However, of those comfortable with their projections of IGTs, the counties appeared more optimistic about the stability and growth in IGT revenues from both the state and federal governments, with 40 percent reporting expected increases from the state and 33 percent reporting expected increases from the federal government. Most municipalities expected no change, but a higher percentage expected decreases in both state and federal IGTs than counties, with only 2 percent expecting increases from the state and only 10 percent expecting increases from the federal government. These differences may be the result of the different services counties and municipalities provide, where counties are responsible for a larger portion of social and health related services that are also often mandatory and whose costs would be expected to increase during a pandemic induced recession. Future research should examine the differences in IGTs and explore underlying reasons and impacts for differences, should they be found.
Actual Revenues for Fiscal Year 2021
As Figures 2 and 3 show, the majority of respondents budgeted for dramatic decreases in sales tax revenues for the first half of FY 2021. In actuality, local sales taxes during that period rebounded quickly for most jurisdictions. The average year-over-year growth in gross collections was 8.84 percent across the state. Of course, this growth was not evenly distributed—revenue changes ranged from a 44.32 percent increase to a 7.75 percent loss—but only one county experienced no growth in the first half of FY 2021 (NC DOR 2021). The trend across the state has been that urban counties usually have the lowest growth rates. 5 Fewer data are available for other revenue sources, but there is early evidence on collection rates for property taxes: Twenty-four of North Carolina’s 100 counties in North Carolina reported their collection rates as of January 2021, when property taxes are due in North Carolina. Of those twenty-four counties, three reported a reduction in collection rates, two reported no change, and nineteen reported increases (C. McLaughlin 2021, pers. commun.). 6 These numbers, though early, suggest that local governments forecasted revenues as significantly lower than what was collected. While it is considered a best practice to err on the side of caution when it comes to forecasting revenues, the apparent large gap between actual revenues and forecasted revenues has real opportunity costs for local governments and the residents they serve. The result of such dramatic under forecasts is that local governments either increase taxes and fees unnecessarily, or more commonly as we see in this analysis, they make larger cuts than needed.
Local Governments’ Budget-Balancing Strategies
Given that local governments anticipated widespread revenue shortfalls, averaging between 5 and 30 percent through the state, it is critical to understand how they budgeted for them. In many ways, their budgets were consistent with a typical recession, but they also had a unique opportunity to mitigate the effects of an economic downturn because this recession had not happened yet. For example, county commissioners during the Great Recession believed that the most effective way to minimize the effects of an economic downturn was to be “proactive in planning ahead, through mechanisms like fund balances and monitoring your local economy” (Afonso 2013, 768). The research presented here sheds light on what was expected to be the first economic downturn since the Great Recession and the first time that local governments had been able to budget for a recession before it actually manifested. Have their budget strategies reflected what the literature and local elected officials view as best practices?
The literature has identified that local governments can best serve their economies and citizens by maintaining spending levels, increasing infrastructure spending, and avoiding tax increases if possible (Fisher 1997; Orszag and Stiglitz 2009; Marlowe 2009; Miller and Svara 2009; Afonso 2013). Figure 4 shows jurisdictions’ budget-balancing strategies, including the appropriation of fund balance, a common way to smooth expenditures in the face of declining revenues. For FY 2021, fund balance was the most frequent strategy for counties and the second most frequent for municipalities. Appropriating fund balance was also an area where the differences between counties and municipalities was significant. In 2017, for example, average solvency was 26.77 percent for counties and 148.91 percent for cities. 7 It is important to note that respondents were able to report multiple strategies. On average, counties reported two strategies and municipalities reported 1.88 strategies.
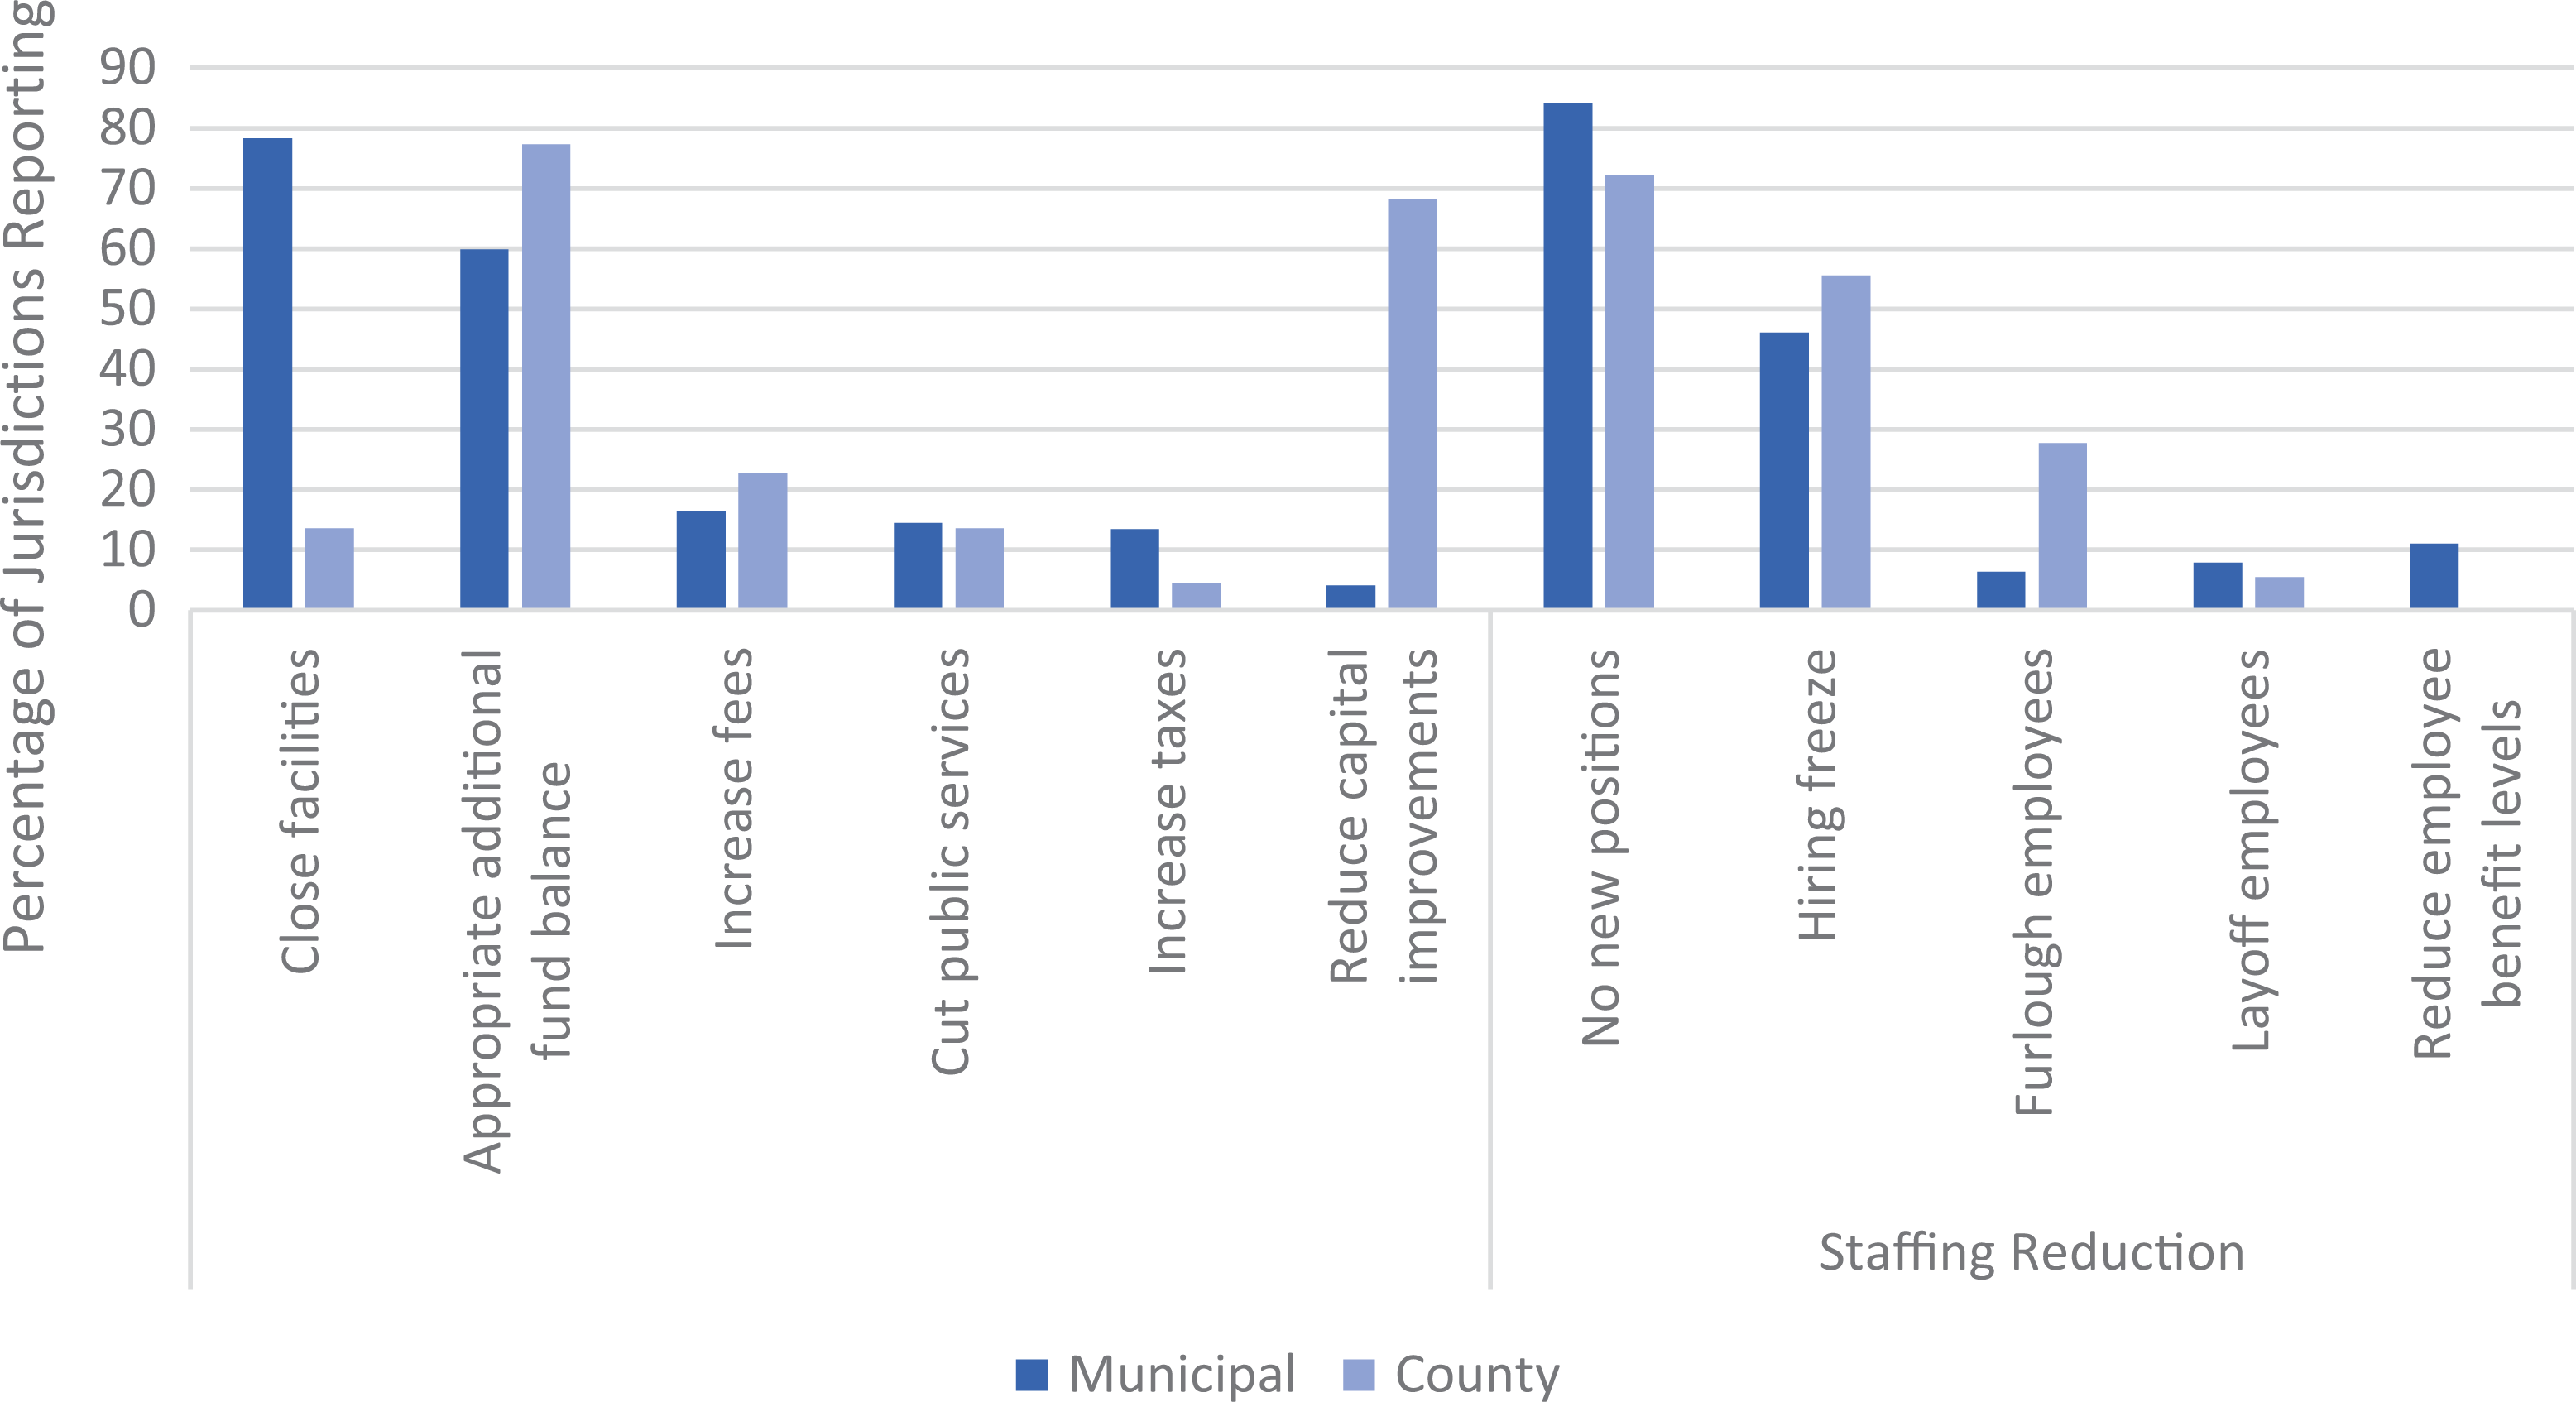
Strategies to balance the budget in response to projected revenue shortfall.
The appropriation of fund balance was in keeping with the best practices from the literature, suggesting that advanced knowledge of the recession may have led to better financial-management strategies. However, the survey reveals that while fund balance was the most common budget tactic, many other budget balancing strategies were used in conjunction with it. This is consistent with the literature, which has consistently found that jurisdictions are reluctant to spend down reserves (Gianakis and Snow 2007; Gore 2009; Marlowe 2012; Stewart, Hamman, and Pink-Harper 2018) and, more recently, that fund balances are correlated more strongly with the ability to save than with the need to save (Gorina, Maher, and Park 2019), suggesting that many communities may have had insufficient reserves.
For counties, reducing capital expenditures was the second-most-common strategy, followed by increasing fees, with only one jurisdiction reporting an intent to increase taxes. Reducing capital expenditures is a common strategy implemented to balance budgets during economic downturns (Jordan 2003; Afonso 2013, 2014; Raudla, Savi, and Randma-Liiv 2015; Srithongrung, Yusuf, and Kriz 2019), though it may have long-term consequences (Berne and Stiefel 1993; Marlowe 2009; Miller and Svara 2009; Rivenbark, Afonso, and Roenigk 2018). Municipalities, however, have relied most frequently on closing public facilities, and increasing fees was their third-most-frequent strategy. Their least common strategy was reducing capital expenditures, and thirteen reported intending to increase taxes. Exploring possible reasons for the differences in strategies employed by counties and municipalities is a promising area for future research.
Tax increases, while not optimal, are often considered the next-best option if fund balance and IGTs are insufficient, especially when the taxes under consideration are progressive (Orszag and Stiglitz 2009; Dynan, Skinner, and Zeldes 2004; Johnson, Oliff, and Williams 2011; Chapman 2009). However, tax increases became an unpopular strategy for closing budget and revenue shortfalls during the previous two recessions (Maag and Merriman 2003; Pennington, Johnson, and Nicholas 2009; Hoene and Pagano 2009). The difficulty in increasing taxes has made increasing user fees a more common strategy because voters find them more palatable and they are seen as fair because they satisfy the benefit principle (ACIR 1986; Justice 2009). This analysis observes this preference for increasing user fees over taxes.
The literature on budgeting during recessions has suggested that one of the most common strategies local governments use to balance their budgets is to make adjustments and reductions to their staffing and personnel costs (Klase and Dougherty 2008; Ammons and Fleck 2010; Afonso 2013; Raudla, Savi, and Randma-Liiv 2015) though these practices can lead to the “productivity paradox” (Levine 1979). This survey found staff cutbacks to be another common budget-balancing strategy. The most common policy, implemented by 84 percent of municipalities and 72 percent of counties, was to not add any new positions. Fifty-five percent of counties chose to institute hiring freezes and 46 percent of municipalities did the same. Many counties (28 percent) furloughed employees, but this strategy was rare for municipalities (only 6 percent). Neither counties nor municipalities reported widely reducing employee benefits or laying off staff. The average number of strategies employed was 1.6 for counties and 1.7 for municipalities.
When looking at the strategies employed by jurisdictions grouped by their expected general fund shortfall, for the majority of strategies, jurisdictions expecting greater shortfalls implemented more strategies. A notable exception is appropriating fund balance. While more than half of all respondents report using this strategy in the expected shortfall of 0–5 percent, 6–10 percent, and 11–20 percent (with almost two-thirds reporting it for the jurisdictions reporting a 6–10 percent shortfall), no jurisdictions anticipating a greater than 20 percent shortfall report appropriating fund balance. This is worth further analysis in the future and may reflect a reluctance to spend down reserves before they understand if the recession will get significantly worse in future years or may reflect that they have lower abilities to save (Gorina, Maher, and Park 2019).
Charlotte, the largest city in North Carolina, is an interesting example. Charlotte reported anticipating revenue shortfalls of between 0 and 5 percent due to anticipated reductions in sales and occupancy taxes, offset by increases in property tax revenues. The strategy they adopted to balance their budget relied on eliminating 26 vacant positions, not allocating funds for new initiatives, and shifting funds out of the debt service fund. They did not reduce capital expenditures or appropriate fund balance. While all three of these strategies were critical to balancing their budget, they had different impacts on the budget. For example, the elimination of new initiatives and the 26 positions saved the city $8.5 million each, respectively. However, the shifting of funds from the debt service fund to the general fund was a transfer of approximately $15 million (Afonso, Allen, and Carey 2021). Charlotte serves as a good example of using a mix of different strategies and the goal of protecting core services and employees that is representative of what many jurisdictions do.
Conclusion
Local governments nationwide were faced with the unique challenge of crafting FY 2021 budgets in the midst of uncertainty over the length of stay-at-home orders, the timing of the economic rebound, the services that would be required, and the revenues that would be available. In North Carolina, counties and municipalities anticipated general-fund shortfalls of 5–30 percent, averaging around a 10 percent shortfall, and expected sales taxes to suffer most severely in the first two quarters of FY 2021. To cope with these reductions in revenue, they avoided creating new staff positions, instituted hiring freezes, appropriated fund balance at higher levels, reduced capital expenditures, and closed facilities. This is in keeping with the strategies used in previous economic downturns in North Carolina and nationally (Ammons and Fleck 2010; Afonso 2013; Raudla, Savi, and Randma-Liiv 2015). Although institutional features unique to North Carolina inevitably influenced governments’ options and decisions, North Carolina local governments are also representative of the nation more broadly (Afonso 2016, 695). Their budgeting tactics in previous recessions have aligned with those from other states (Ammons and Fleck 2010) and with preliminary evidence from other regions during the current recession (Maher, Hoang, and Hindrey 2020). Given that many of the same strategies from previous recessions were employed in preparing the FY 2021 budget, a promising area of future research is to understand why best practices were not further implemented and to explore ways that these practices can be encouraged.
The research presented here informs both practitioners of the strategies and expectations of local budget offices and researchers of budget choices to provide a way to begin to analyze the impacts on budgets and changes in service provision moving forward. This study is an early step toward understanding the current recession and its effect on local governments. It is intended, for local governments, to serve as a reference and benchmark and, for academics, as a snapshot of local governments’ approaches to budgeting under the unique circumstance of having advance knowledge of a recession. It is clear that there was great concern about the impacts of the pandemic on revenues and that, as is typical, local governments forecasted conservatively. Local governments also forecasted based on previous recessions rather than by considering how a pandemic induced recession would differ. While it is typical to use previous recessions for forecasts, it was inappropriate in this case because of the unique nature of this recession. This is likely one of the causes for the notable difference between forecasted and actual revenues, a difference that has real opportunity costs for local governments and the residents they serve. The result of such dramatic under forecasts is that local governments either increased taxes and fees unnecessarily or they made larger cuts than needed, or some combination of the two strategies. The results presented here suggest that it was primarily through reductions in service provisions and reductions in staff costs, both of which can have long term impacts on service quality (Berne and Stiefel 1993). However, conservative forecasting is unlikely to be abandoned because of the consequences of over forecasting revenues, thus reinforcing the advantages of strategy of appropriating fund balance during recessions. If the forecast is too conservative the excess revenues can be used to replenish the fund balance without impacting services. The presentation, discussion, and potential implications of these choices and the data presented here help inform future practice and point to where additional scholarship is needed.
Footnotes
Declaration of Conflicting Interests
The author(s) declared no potential conflicts of interest with respect to the research, authorship, and/or publication of this article.
Funding
The author(s) received no financial support for the research, authorship, and/or publication of this article.