
Abstract
Advances in information technologies and vehicle automation have birthed new transportation services, including shared autonomous vehicles (SAVs). Shared autonomous vehicles are on-demand self-driving taxis, with flexible routes and schedules, able to replace personal vehicles for many trips in the near future. The siting and density of pick-up and drop-off (PUDO) points for SAVs, much like bus stops, can be key in planning SAV fleet operations, since PUDOs impact SAV demand, route choices, passenger wait times, and network congestion. Unlike traditional human-driven taxis and ride-hailing vehicles like Lyft and Uber, SAVs are unlikely to engage in quasi-legal procedures, like double parking or fire hydrant pick-ups. In congested settings, like central business districts (CBD) or airport curbs, SAVs and others will not be allowed to pick up and drop off passengers wherever they like. This paper uses an agent-based simulation to model the impact of different PUDO locations and densities in the Austin, Texas CBD, where land values are highest and curb spaces are coveted. In this paper 18 scenarios were tested, varying PUDO density, fleet size and fare price. The results show that for a given fare price and fleet size, PUDO spacing (e.g., one block vs. three blocks) has significant impact on ridership, vehicle-miles travelled, vehicle occupancy, and revenue. A good fleet size to serve the region’s 80 core square miles is 4000 SAVs, charging a $1 fare per mile of travel distance, and with PUDOs spaced three blocks of distance apart from each other in the CBD.
Keywords
Introduction
Cities are facing increasing demands for curb access from diverse users, like on-demand micromobility, transportation network companies (TNCs - like Uber, DiDi, and Lyft), and urban freight delivery, such that dedicating curb space for parking in dense urban centers is becoming less tenable (Marsden and Docherty, 2020). Agencies in charge of parking management have responded to new users by increasing staffing for greater enforcement and by piloting new mobility zones, particularly for TNCs in nightlife and entertainment districts (Butrina et al., 2020). Małecki’s (2018) review of pick-up and drop-off zones (PUDOs) for TNCs estimated that they reduce operational failures that arise when demand for curb space exceeds capacity, thereby reducing issues of pedestrian safety, traffic congestion, conflicts with bike lane users, and emergency vehicle access. The transition to a sharing economy with the expected arrival of shared autonomous vehicles (SAVs), which do not require a driver, do not have to look for off-street parking, and can carry dozens of different users per day, warrants further exploratory analysis on the operational performance of PUDOs.
The demand for SAVs will vary over time and space, day of week, and month of year, as a function of many factors. A key factor in SAV mode choice is the use of PUDOs (rather than door to door service) and their locations, which affect traveler access costs, wait times, and vehicle occupancy levels. As such, it is important to capture the interaction between demand and supply and impact of PUDO locations on SAV demand and fleet operations. While self-driving vehicles contribute to urban sprawl – by making “driving” easier, curb protections, road pricing, and shared rides (in SAV fleets) can counter those tendencies (Brueckner, 2000; Zhang and Kockelman 2016).
City centers typically have expensive, scarce parking supply and complex rules governing curb use. Parking along some roads may allow for unlimited free parking, others have time limits, while others require a permit or charge by the hour. Many have bus stops or bike storage, loading zones for commercial use, and paid parking stalls – all in the curb space on one side of a single block of land. Expensive parking, traffic congestion, and curb restrictions tend to reduce vehicle ownership, making SAVs more popular in the future (Ostermeijer et al. 2019). Setting aside designated PUDO zones can simplify the search for loading and unloading sites for SAVs.
This paper simulates SAV fleet activities across the Austin, Texas region. It expands existing programs in POLARIS (an agent-based model) to evaluate the effects of different PUDO configurations on fleet performance metrics, including traveler wait times and walk distances, average SAV seat occupancies, and vehicle-miles traveled (VMT) in an integrated supply and demand context (where demand is endogenous, and impacted by added wait times and longer walk distances). By varying the presence and spacing of PUDOs (taking into account curb access limitations) and SAV fleet size, simulation results for 18 scenarios provide valuable insights for municipalities considering how to accommodate the coming curb demands of SAV fleets and for fleet managers seeking to anticipate demand and cost, while optimizing fleet size and fare/pricing decisions.
This paper tackles the following questions: • How does PUDO density impact demand for trips, response time to trip calls, empty vehicle-miles traveled (eVMT), the number of trips served, and other performance metrics? • What demands will SAVs place on curb space, and what is the appropriate number of spots to provide at each PUDO location?
This paper’s literature review synthesizes research and results on SAV modeling efforts and system evaluation. The methodology section explains modeling assumptions used, including program code details. It also explains the data sources used for estimating parking supply and demand, in order to choose PUDO sites. Case study results for Austin, Texas are then presented, followed by conclusions and suggestions for future work.
Literature Review
Shared autonomous vehicles differ from personal autonomous vehicles in that they are not owned by an individual but rather by a fleet operator. Instead of sitting in a parking lot once a trip is completed, they can drive themselves to begin another person’s trip. In addition, SAVs can carry unrelated riders who share similar destinations and departure times. The lack of a driver can significantly lower operating costs (Becker et al., 2020; Fagnant and Kockelman, 2015a; Loeb and Kockelman, 2019). When modelling SAV services, it is very important to carefully design curb allocation strategies, pickup and drop-off locations, vehicle assignment (to trip requests/travelers) decisions, and single versus shared ride strategies in order to provide a high-quality but cost-effective service. Relevant work on these four service-design strategies is summarized in this section.
Curb Allocation
Shared autonomous vehicles may congest already busy curbs, in downtowns, at airports, convention centers, and other popular sites. They may not be allowed to idle at any location, and may be charged a fee for every minute they linger. Since they are self-driving, they can be sent somewhere where parking is permitted and/or less expensive. Fleet managers will be expected to not stop SAVs in travel lanes to pick up or drop off passengers as human drivers often do. In areas where on-street parking is at a premium, like central business districts (CBDs) and airport terminal curbs, dedicated spaces for PUDO with very short idling limits of one or 2 min may be implemented to provide an easy-to-find open parking space and reduce SAVs cruising to find open curb space.
Predictions of the effects of SAVs on parking spaces and curb usage depend on scenario formulations of future vehicle ownership (privately-owned or fleet operator-owner), SAV saturation rate, and the share of people willing to share rides with strangers (Stead and Vaddadi, 2019). In a world of well-received SAVs, high utilization rates and vehicle occupancies in a near continuous operation could eliminate the need for off-street parking.
In the short term, lessons taken from managing curb space arising from TNCs and the emergent SAVs will inform policies to manage traffic at inter-/multi-modal transportation facilities and major destinations (e.g., office parks, universities, concert venues, nightlife districts). Cities should anticipate a large demand for passenger loading/unloading at destinations of TNC and future SAV trips and manage on-street parking to increase turnover or designated PUDO locations to meet demand (Marsden and Docherty, 2020).
Pick-Up and Drop-Off Modeling Techniques
In order to accommodate passengers beginning and ending their trips at different locations without adding to the trip length of all users of the shared vehicle, riders can be picked up and dropped off at designated locations. Riders walk to or from these sites instead of forcing the vehicle to make the trip all the way to each trip end (Li et al., 2016). When combined with dynamic ridesharing (DRS), which enables SAVs that are already carrying passengers to pick up additional riders who are not far off the SAV’s current path, greater vehicle occupancy and or lower fleet sizes could theoretically be achieved. An example of DRS and PUDOs leading to reduced SAV trip length is shown below in Figure 1. Path taken by shared autonomous vehicle using dynamic ridesharing with PUDOs disabled (A) and enabled (B).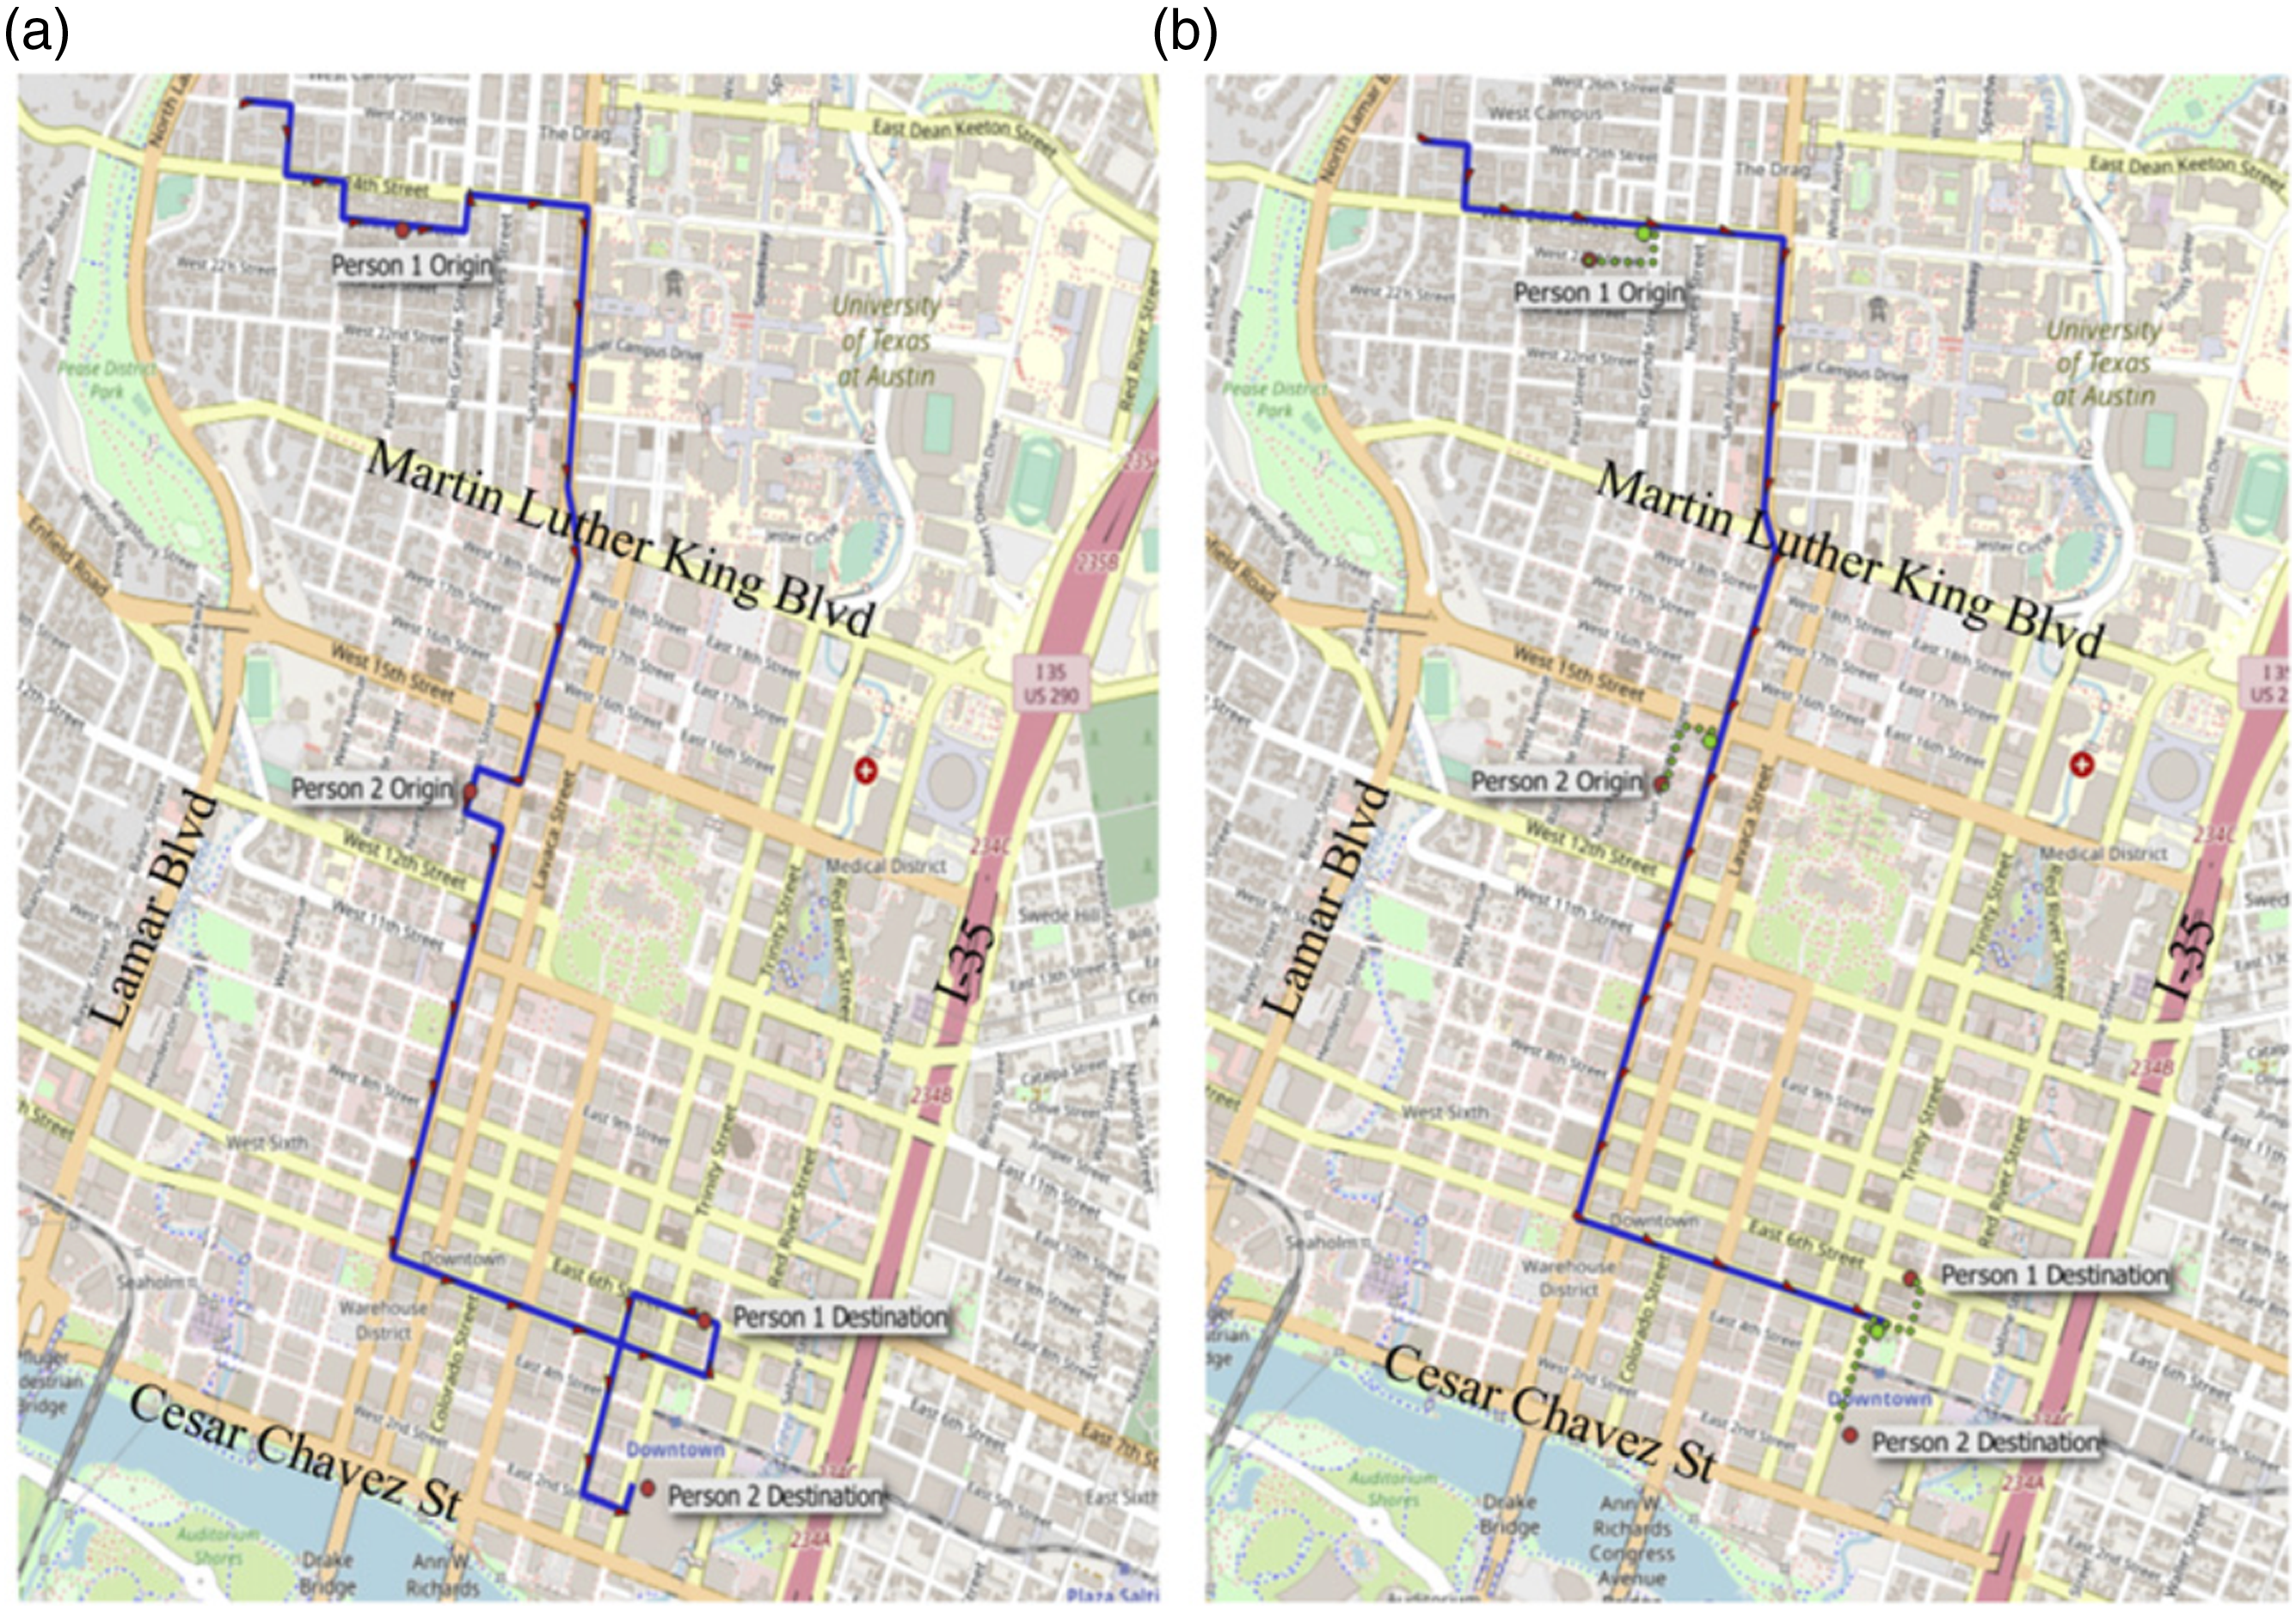
In Figure 1A, where there are no PUDOs, an SAV fulfilling two trips near the Austin CDB must leave the arterial it is traveling on several times to pick up a passenger at their exact origin point (see blue line), as well as take a convoluted path along several one-way streets at the end of the journey. With PUDOs (Figure 1B), the two riders walk to meet the SAV (path shown in green dots) without it having to make a detour onto side streets, then both are dropped off at the same PUDO and walk a few blocks to their final destination. This yields a reduced trip distance and reduced wait time for all riders involved.
Modeling PUDO stop aggregation for SAVs is more complex than matching a single user to an SAV vehicle which then picks up the passenger. Rather, Fielbaum et al. (2021) suggest one must consider vehicles passing near the origin and choose not only which vehicle to assign but also to what point to send the user on foot to meet the SAV. They expand on their previous framework (Fielbaum et al., 2021) by minimizing the combined costs to riders requesting a trip and those already traveling. The model results show that adding walking to the process reduces vehicle-hours traveled (VHT) by 10 percent, while riders in the highest demand areas also have to walk the farthest. The authors conclude by stating that further research is needed, such as determining the optimal vehicle fleet, how it is affected by PUDO points, and how demand further responds to these two variables.
Dynamic Ridesharing
Algorithms for approximately solving DRS problems have been extensively studied because of the difficulty of obtaining an optimal solution. In most cases particularly in agent-based simulation research, this challenge leads authors to pursue simplistic heuristics for matching vehicles with trips, often placing the traveler with the closest available vehicle. It is easy to imagine scenarios where a DRS opportunity barely fulfills those constraints but is selected over another opportunity that might be a better match for the current trip, because the opportunities are not being ranked or ordered.
Alonso-Mora et al. (2017) proposed a solution that is fast enough to dispatch vehicles in real time. In this example, only vehicles deviated from their current paths to meet users and users walking to a designated meeting point was not considered. Rather, they would wait at the exact location where they started their trip, such as in front of their home or workplace. The algorithm was formulated to minimize the wait time for passengers to be picked up. It also included a penalty for requests that went unassigned, that is, no vehicle picked up the individual who made the request. Every 30 sec a new set of requests were analyzed, and a graph of feasible paths and vehicles that could serve them was created. If a request was not assigned during a given batch of trip matching, the penalty for not serving that request would increase. Using a fleet of 2000 shared vehicles with a capacity of 10, wait time decreased more than in-vehicle travel time (IVTT) when compared with the base scenario of current single-occupant taxi service. Nighty percent of rides were shared and the algorithm was light enough to analyze trips in real time, finishing assignment of each batch in less than the 30 sec spacing between them. However, they also fail to adequately benchmark the algorithm against known methodologies. This makes it impossible to fully understand the model’s performance and determine the validity of the model results.
Farhan and Chen (2018) estimated that 13 privately owned vehicles can be replaced by a single shared autonomous electric vehicle (SAEV) using their Capacitated Vehicle Routing Problem formulation for Austin, Texas, with a wait time of about 6 min. However, their solution requires advance knowledge of the trip schedules, which - in a practical context - requires a reservation-based system. Liu et al. (2019) described a quadratic formulation of the SAV routing problem that can solve small subsets of the problem and may be viable in real time adjacent to a traffic simulation. This approach is unique in that it solves subsets of the problem to optimality. This quadratic formulation is unique and probably the fastest solution available. The challenge in implementing this in an agent-based transportation simulation is generating problem subsets that are small enough to solve in real time.
Shared Autonomous Vehicle Assignment
Vehicle dispatching has been studied closely, across many contexts, with conclusions that are relevant for SAV research and applications. For example, Levin et al. (2017) examined event-based logic for dispatching SAVs in an agent-based simulation of the Austin CBD with congestion feedbacks. In this simulation, all trips within this small region were assumed to be served by SAVs, Bösch et al. (2016) simulated low SAV penetration rates around Zurich to estimate fleet sizes required to meet different demand levels, though all demand levels represented less than 10 percent of the city’s total travel passenger-trip demand. The study found that dynamic traffic assignment models, like POLARIS, are needed to appreciate the congestion impacts of SAVs (since this new model can congest networks) and strong use of dynamic ride-sharing (between strangers) can abate such issues.
Fagnant et al. (2015b) described algorithms for distributed ridesharing including heuristics for reallocating idle SAVs that are frequently cited. Both are accomplished with some abstraction of the network as well as trip sampling. Hörl (2017) simulated an SAV service demonstrated on a toy model loosely based on Sioux Falls, in North Dakota. Bischoff and Maciejewski (2016) simulated SAV use in Berlin using MATSim, but only 10 percent of trips were simulated due to computational limitations. For SAV assignment to travelers, they used the common heuristic (shortcut) of assigning the closest vehicle to each trip request. Since they were not simulating shared rides, they avoid the complexity of the multiple-vehicle pickup-and-delivery problem (MVPDP).
Methodology
This section presents the methodology used to design simulation experiments to evaluate the impact of PUDO locations and densities on SAV fleet operation (e.g., wait time and VMT) and demand under different fare prices and fleet sizes.
POLARIS
POLARIS, an agent-based model developed by Argonne National labs, which can model the operation of SAVs in a region (de Souza et al., 2020) was used to analyze PUDOs. Similar to MATSim and other agent-based models, POLARIS lets its users track individual vehicles through a region and the road, walk, and bike links within it to individual destinations. This gives far more granular results than the aggregate zone-to-zone estimates of travel produced by trip-based models. POLARIS goes beyond traditional four-step travel demand modeling and provides an activity-based model (Miller, 2021) by tracking individual agents and vehicles throughout a network using dynamic traffic assignment. Agents choose their departure time and destination for individual trips, plan their day as a whole, and reschedule and re-route depending on the constantly changing conditions they experience. Instead of being aggregated into traffic analysis zones (TAZs) representing a neighborhood or block of land, trips can begin and end at individual addresses, referred to as “locations” in POLARIS.
In addition, every personal vehicle, freight vehicle, SAV, and so forth on the road is of a specific vehicle type. Links are modeled using a mesoscopic flow model that captures vehicles’ movements throughout various “cells” that subdivide each link (de Souza et al., 2019). This allows for detailed tracking of vehicle movements future expansions of SAV modeling such as the effect of SAVs pulling into the curb, unloading, and merging back into traffic has on vehicles in that cell of roadway.
Data Description
Home-Based-Work Mode Choice Utility Equation Parameters for Austin Region’s Household Travel Survey Data (2016–2017 NHTS Add-On).
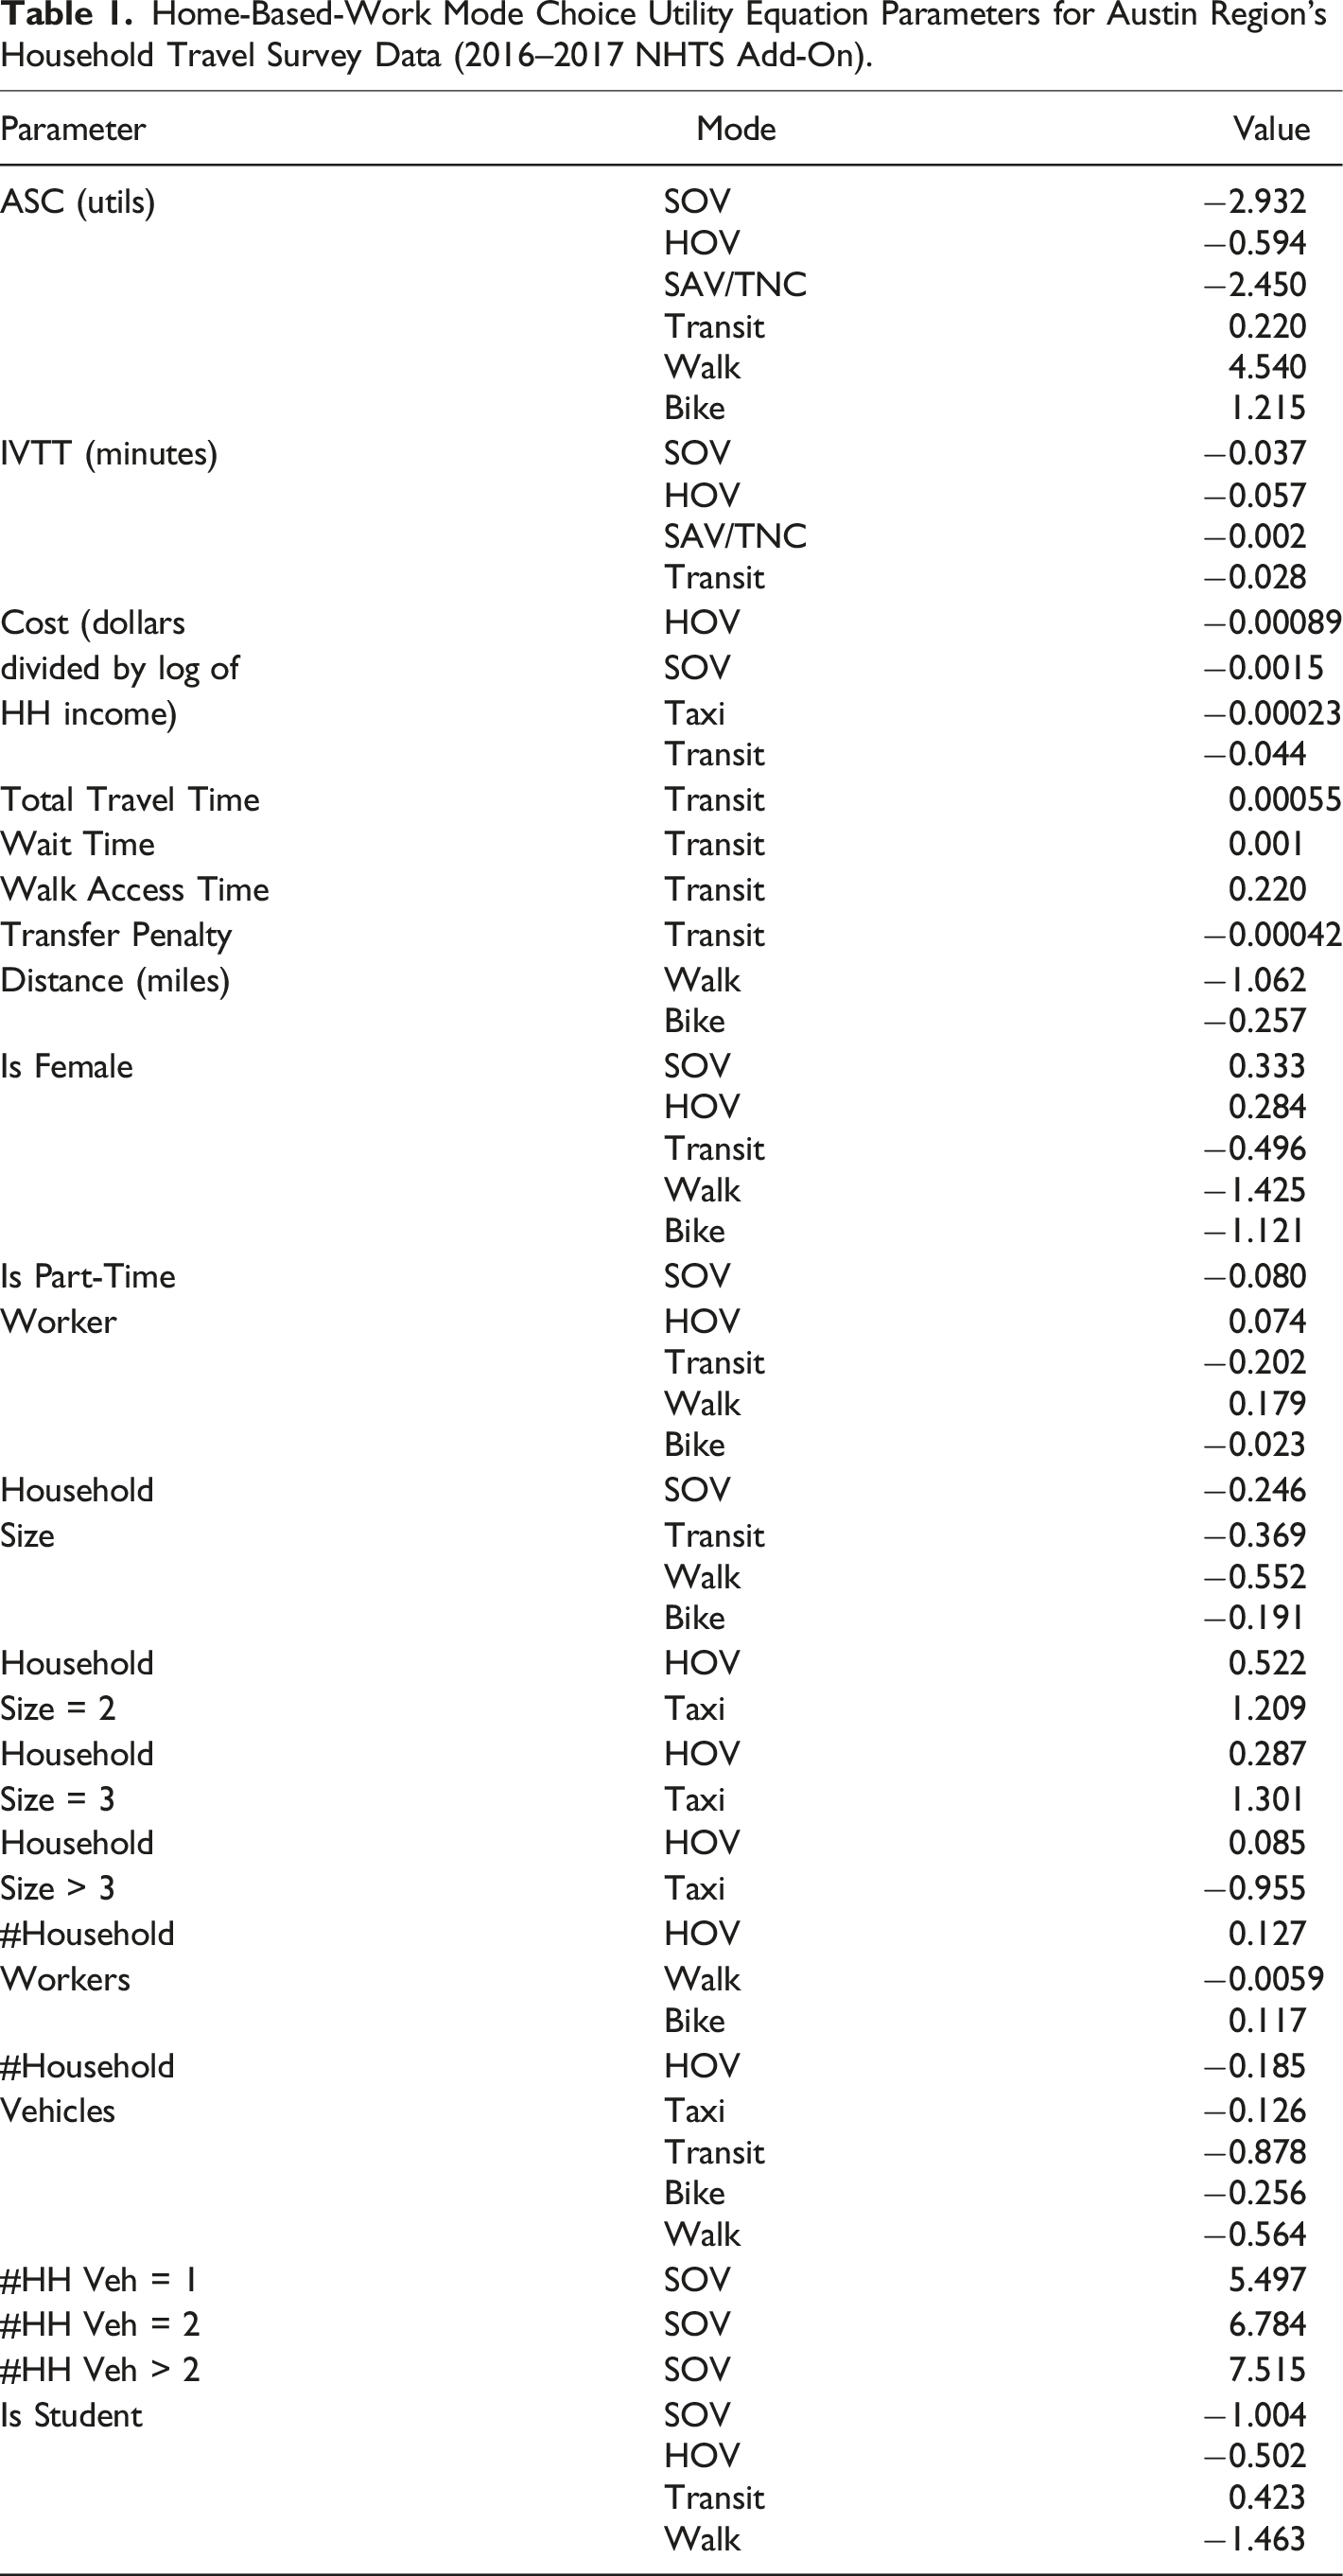
As shown in the mode choice parameters, there are less parameters to describe the Taxi/SAV mode. For instance, there is no breakdown of in-versus out-of-vehicle travel time or a walk access time component as there is in the transit mode. This lack of separation between walking, waiting, and riding limits the responsiveness of potential SAV users to parameters such as response time or spacing of PUDO locations. The travel survey did not capture enough TNC/Taxi users to give significant values for these parameters (and others such as gender, student status, etc.), and future work must be done to provide more detailed mode choice estimates for this mode.
Pick-Up and Drop-Off Modeling in POLARIS
This section presents the steps taken to identify and model PUDO locations in POLARIS, namely parking supply estimation, PUDO demand and siting, DRS, and PUDO aggregation.
Parking supply estimation
For PUDOs to be modeled, it was necessary to gain an understanding of where demand for curb space most challenged supply in the Austin area. When an SAV picks up or drops off a passenger, it must pull over to the curb or into a garage. Unlike some taxis or TNCs in real-world operation, an SAV will almost certainly not make stops in the middle of the roadway, no matter how brief the boarding or alighting, so as to minimize safety risks and therefore the potential liability of its owners. To calculate where this safe space was available, parking demand to supply ratios had to be calculated. Parking supply included on-street free and paid parking, and publicly available garage or lot parking (both privately and publicly owned). Three sources of data were used.
First, the City of Austin maintains a GIS database of on-street parking locations (Austin Transportation Department, 2021). This data was corrected, and Google Street View and on-location observations were performed to fill in the gaps in on-street parking in the CBD. An example of several downtown blocks of land is shown in Figure 2. Curb use designations in part of downtown Austin.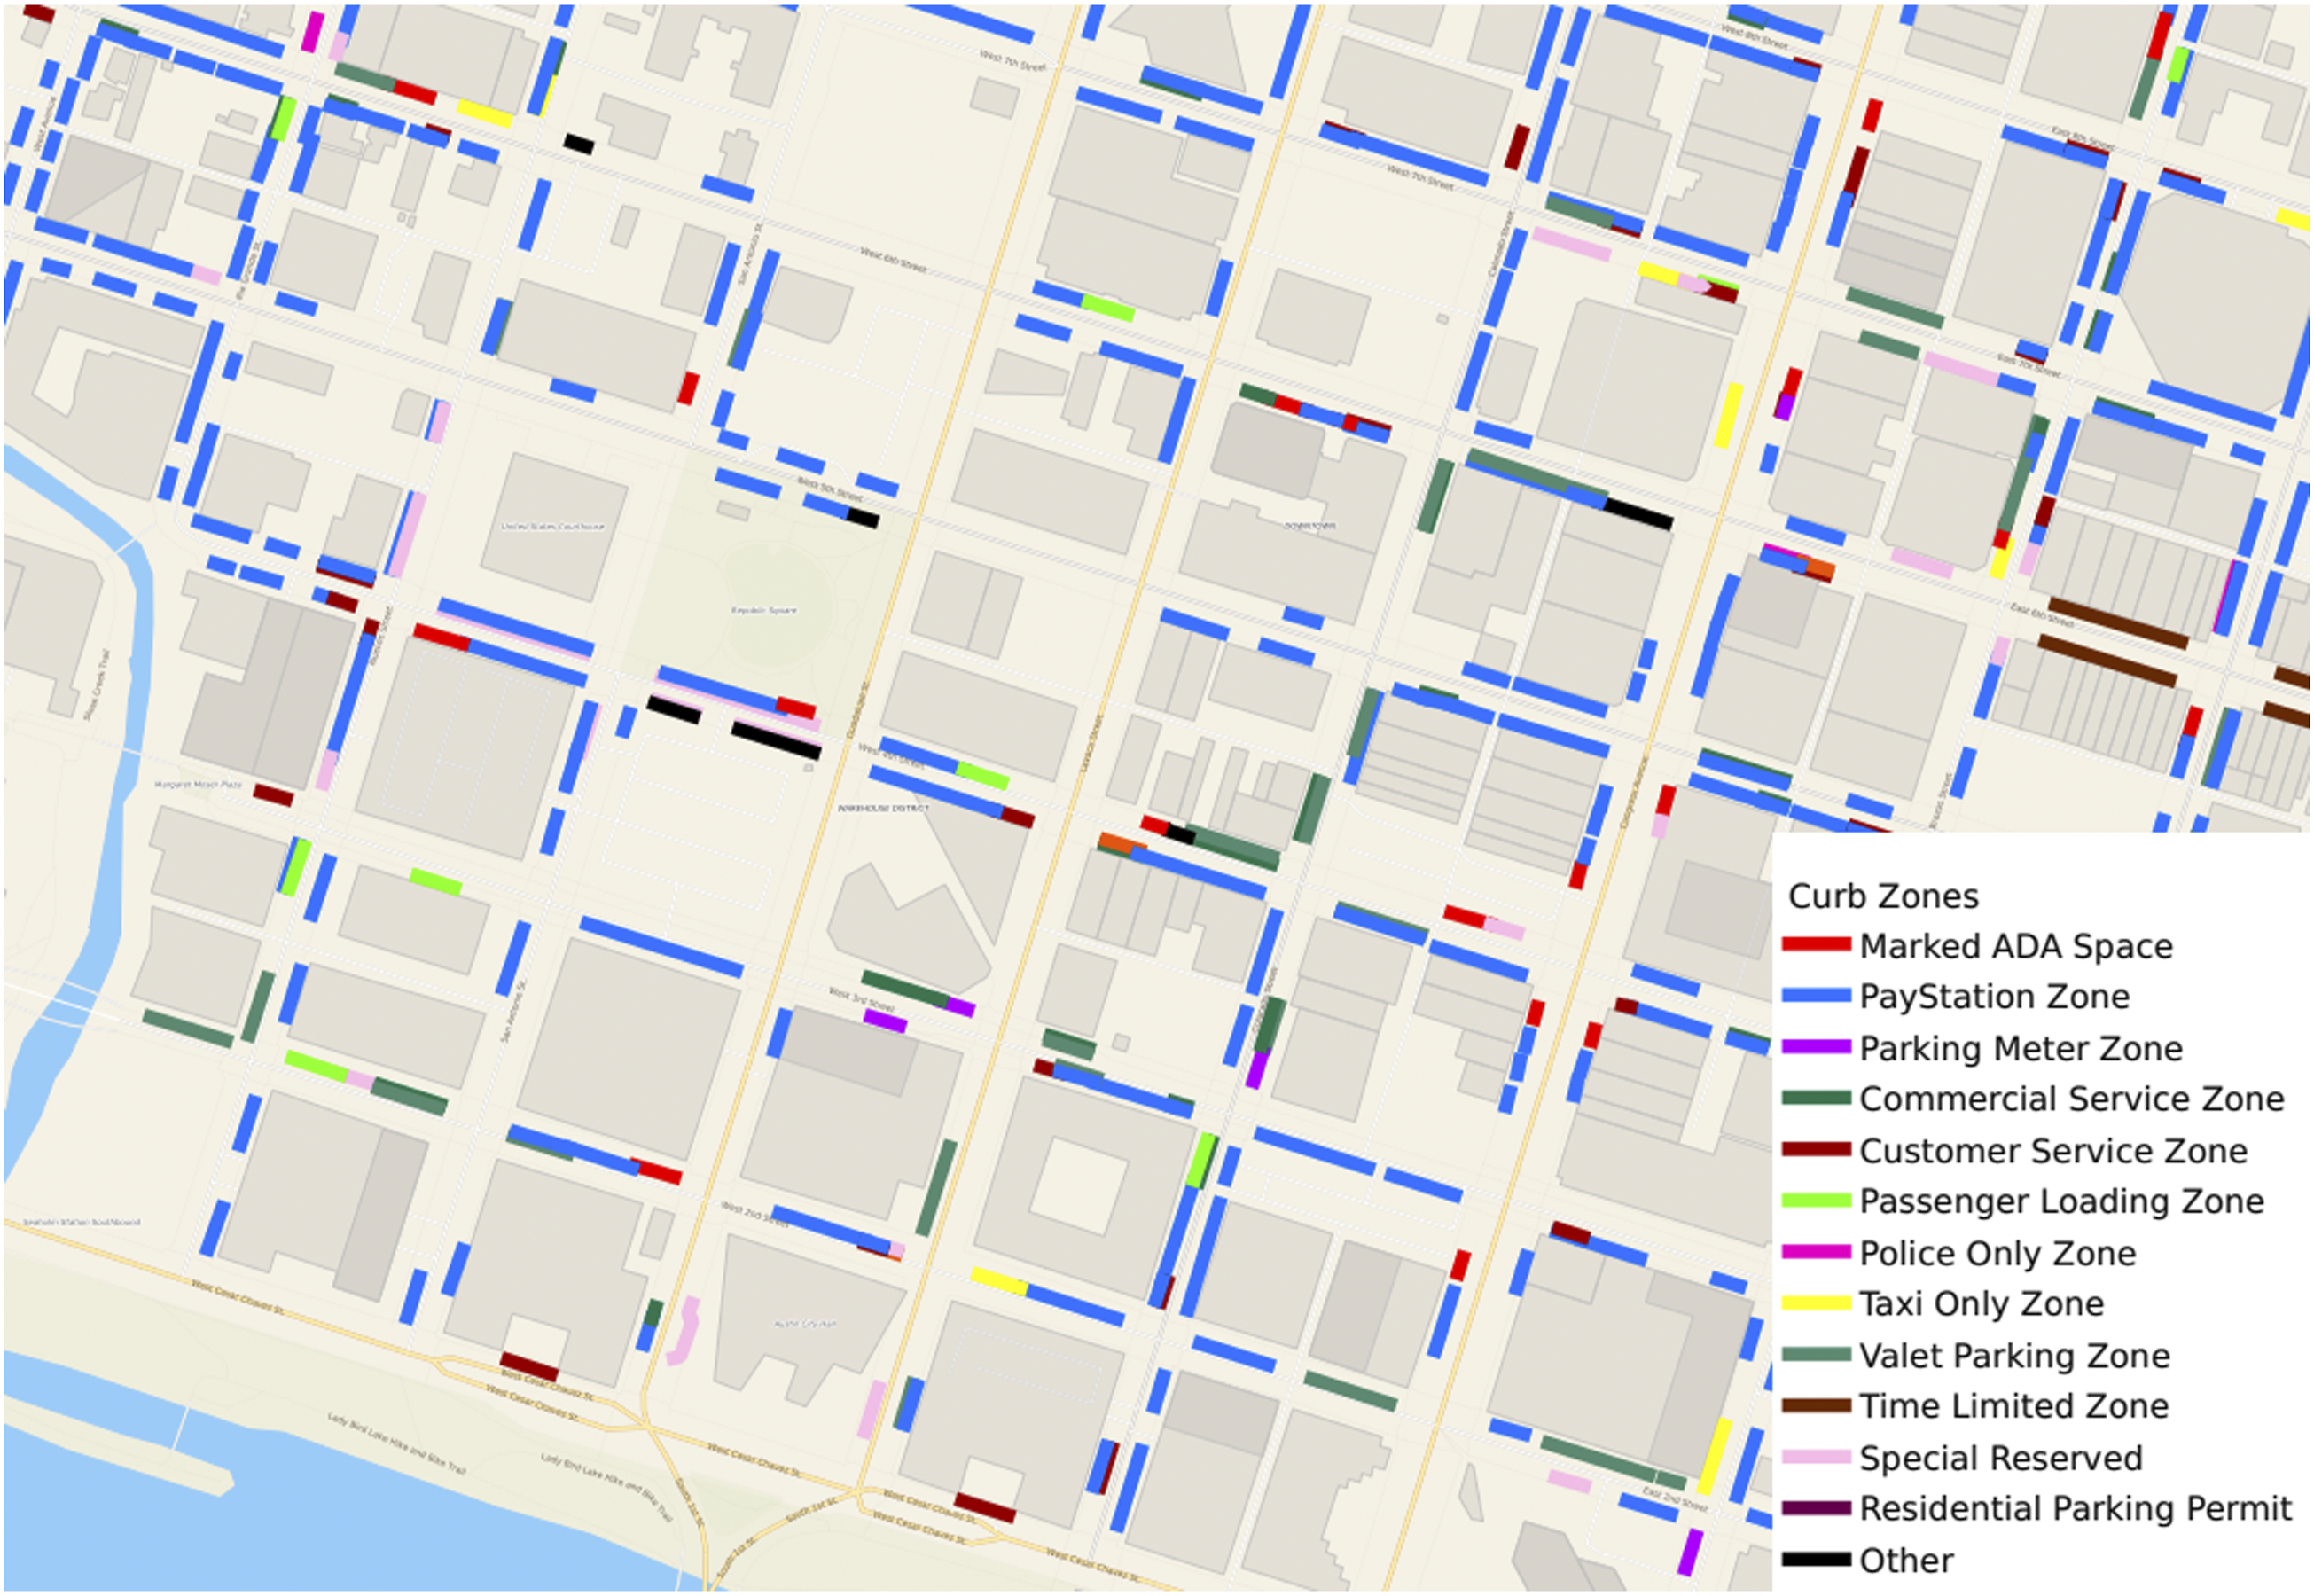
Next, an index of off-street lots and parking garages with their respective capacities geographic locations was compiled. Finally, as an exact accounting of parking on all streets in the region would be impractical and unnecessary, OpenStreetMap data was downloaded to provide a rough estimate of on-street parking in the rest of the six-county Austin metro area. Every road classified as tertiary or residential on the site was divided into 5-m segments to conservatively calculate the supply of parking provided about every 10 m on each side of the road on local streets.
Pick-Up and Drop-Off demand and siting
Next, demand for PUDOs was estimated. This was done using a simulation of 25 percent of the population of the Austin region generated by using POLARIS. Trip ends for single occupant, carpool, and TNC trips were gathered, as these modes are the greatest competitors for PUDO space against SAVs. Based on zones with the greatest observed demand, a geofence was created to focus SAV operation in the busiest areas, as shown in Figure 3. These zones would be the focus of the first group of scenarios, as discussed in the Model Scenarios section below. Initial SAV service area, in central Austin.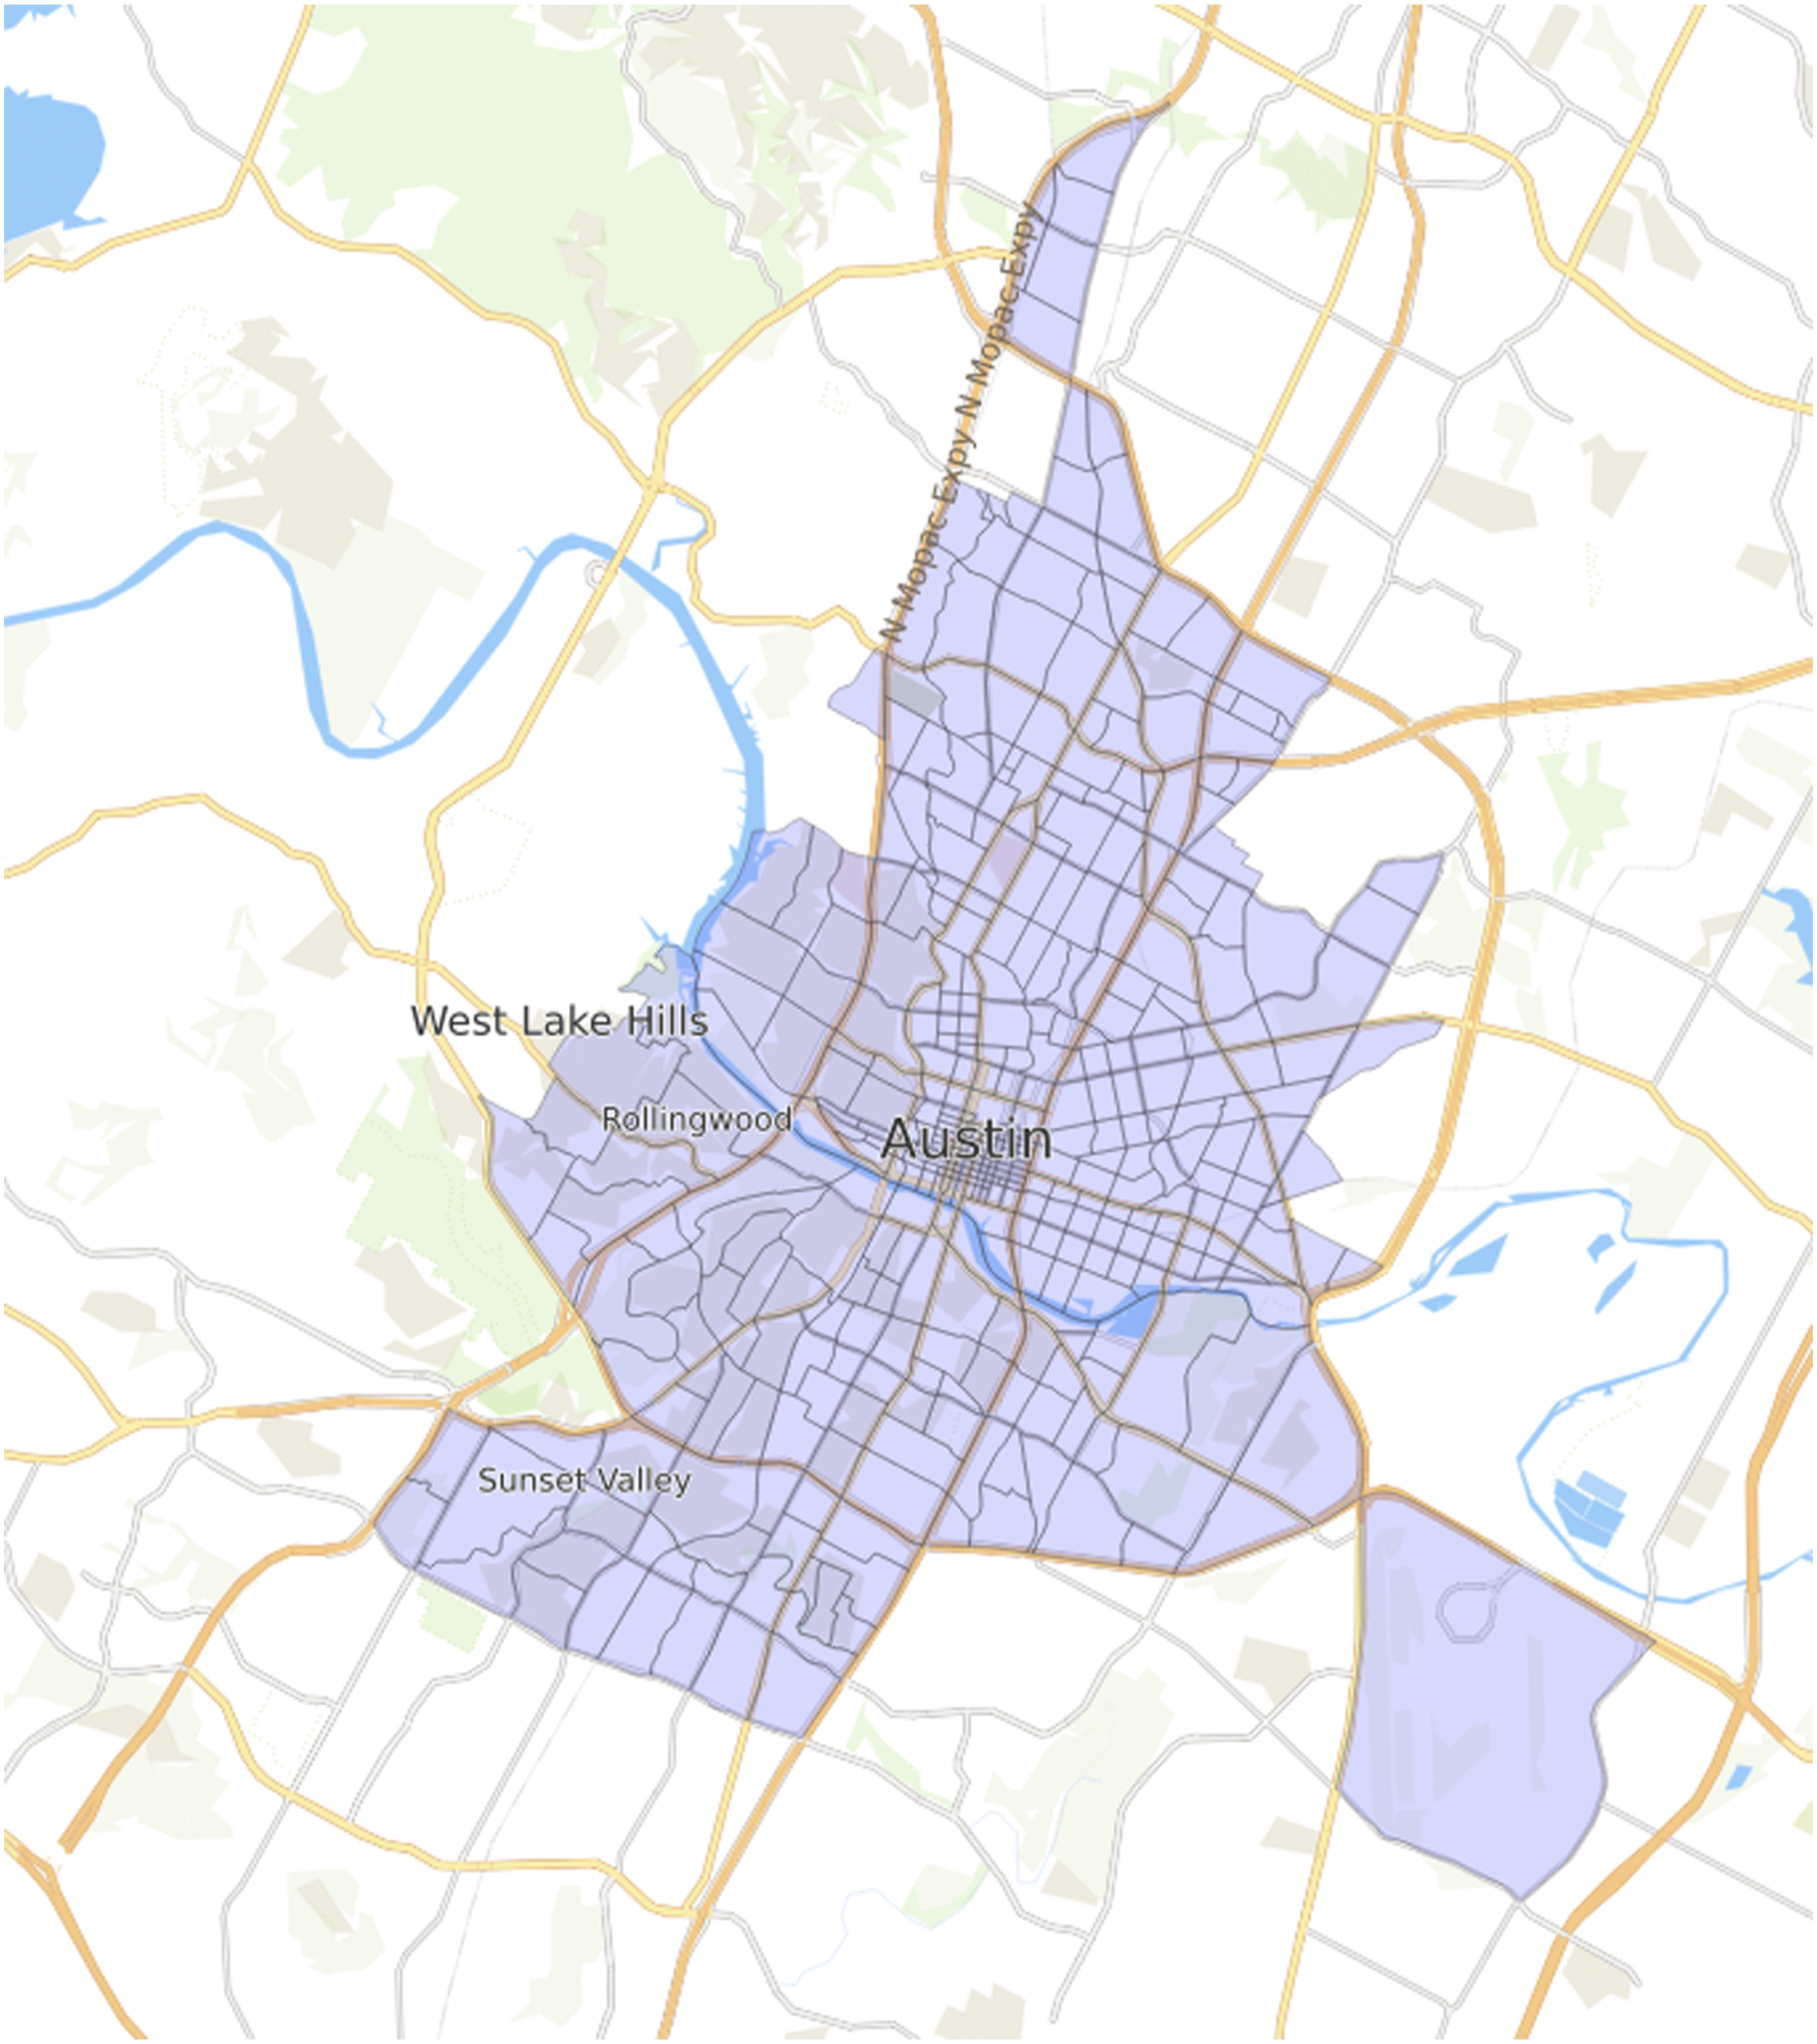
The total population within these TAZs is 326,597 persons, while total employment is 320,262 jobs, providing a good balance between trip generators and attractors. A grid was overlaid on the data to show the relationship of trip ends to parking supply, which is a proxy for the number of trips per parking space per 24-h weekday. The result is displayed below in Figure 4. Weekday parking trips per parking space near the Austin CBD, simulating 25 percent of population.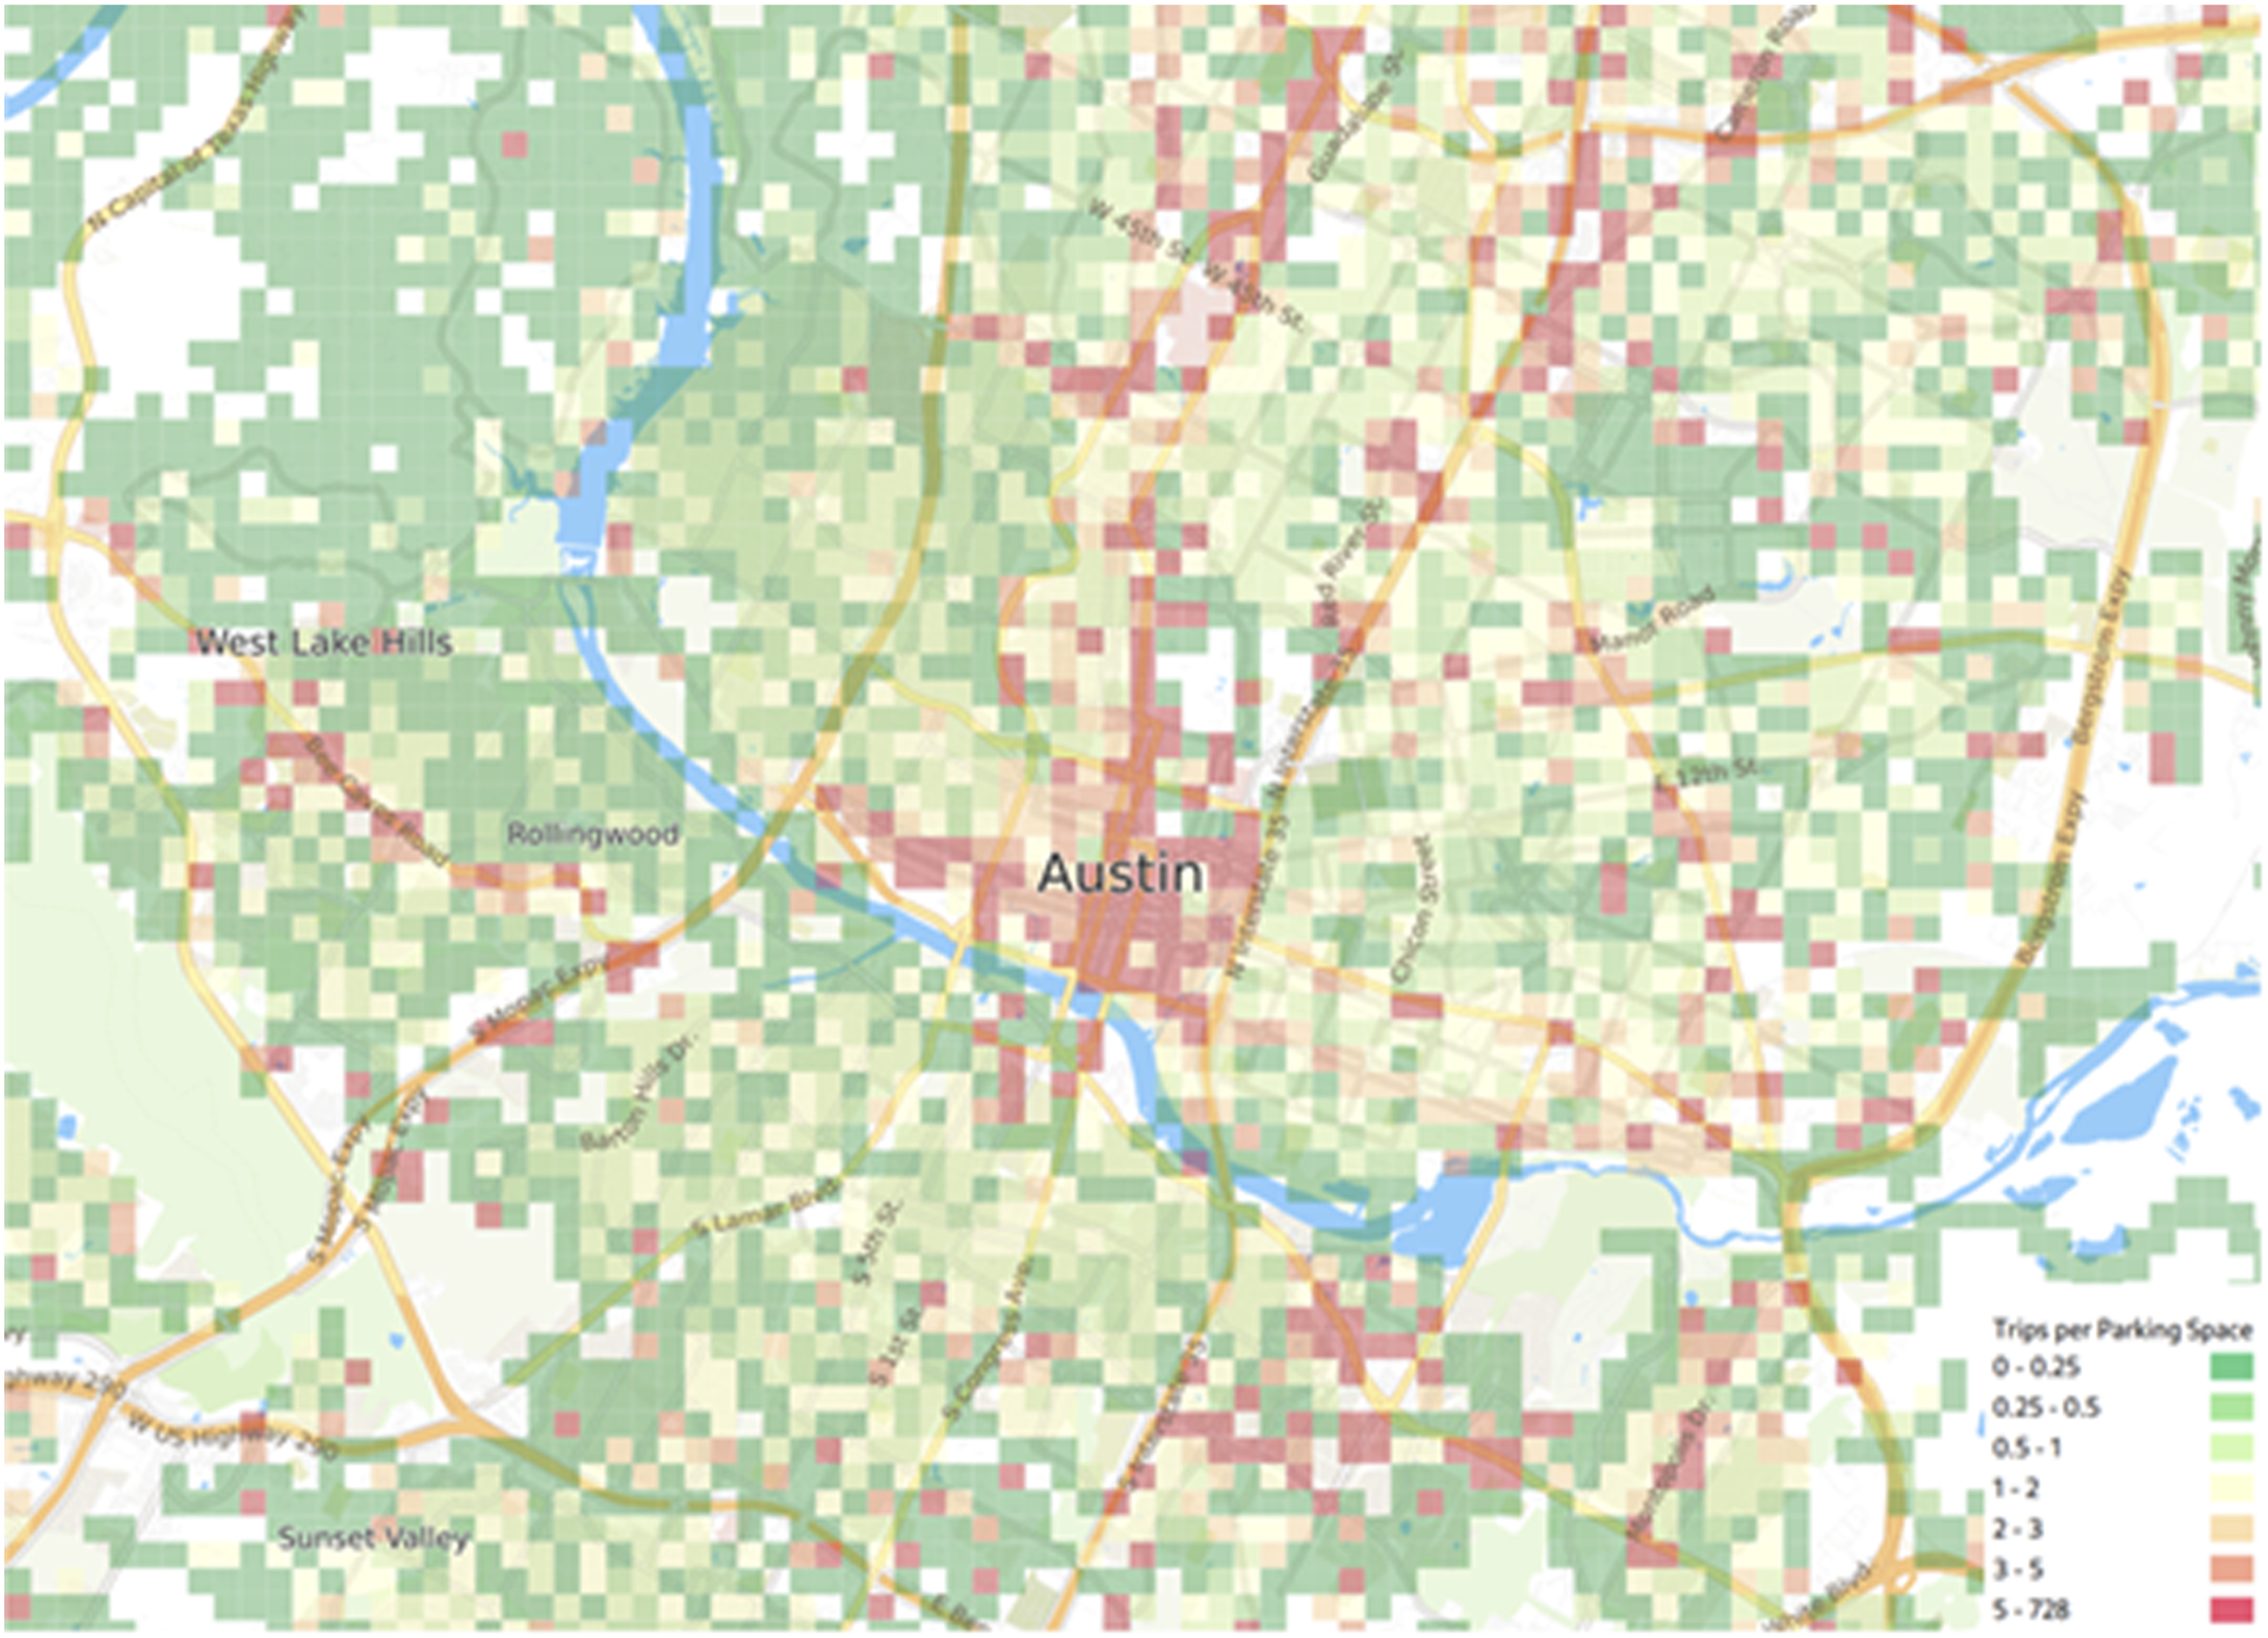
Areas with more than five trips per space per day in the 25 percent simulation, or 20 trips in a theoretical 100 percent simulation, are shown in red above and are a focus for this paper. With such a high number of trips per space, it is likely that supply will exceed demand along the curbs in that area, and SAVs will need designated PUDOs in order to find a predictably empty space to pull over in. Some of the areas in red extending from the center of the Figure 4, such as along the North Lamar, I-35, East Riverside, and Bee Cave corridors, are a false positive for high parking utilization. This is because free off-street parking provided by businesses or apartment complexes was not surveyed. Compared to the few dozen lots and garages in the Austin CBD, hundreds of small lots would need to be cataloged to obtain an accurate measure of parking supply along these and other similar corridors. To give context to streets, North Lamar and I-35 run north-south and are shown in Figure 1. East Riverside and Bee Cave run east-west. All are major arterials for the City of Austin. North Lamar and Bee Cave have four lanes each, in those red sections [Figure 4], with left-turn bays at intersections. East Riverside is six lanes, with raised medians, typically, and I-35 is a multi-lane freeway bounded by one-way multi-lane frontage roads. All are flanked by strip commercial development, with large parking lots on either side.
In the future, the three sources of parking mentioned earlier could be augmented through OpenStreetMap parking catalogs or using satellite data (Hawkins, 2021). For the purposes of this simulation and as confirmed through observation of these parking lots, there is nearly always ample parking in these areas and the need for PUDOs on these stretches of road can be disregarded. Therefore, PUDO sites are focusing in the Austin CBD (Figures 2 and 6), as bounded by Lamar Boulevard (on the west side), Martin Luther King Jr Boulevard (north side), Interstate Highway 35 (east side), and the Colorado River (south side) (DAA, 2021).
Dynamic Ridesharing and PUDO aggregation
POLARIS includes DRS and PUDO aggregation. The first feature involves searching among currently occupied SAVs when a trip request is first made to the SAV operator. If a vehicle is traveling nearby and making a small diversion to pick up additional riders that would not lead to significant delays for existing riders (a maximum of 5 min for the simulations performed in this analysis), the vehicle will be rerouted to pick up the new request. If such a vehicle is not found, the user will instead be matched to a nearby empty vehicle (Gurumurthy et al., 2020). Unlike in branded commercial implementations such as UberPool, in this simulation there is no discount for sharing a ride with others as it was assumed that sharing a vehicle would be an inherent feature of the service with no option to be the guaranteed lone occupant of a vehicle.
Pick-Up and Drop-Off aggregation builds on this by directing riders to walk to designated locations to be picked up and dropped off instead of waiting at or alighting at the curb directly in front of their origin or destination. The purpose of this is threefold. First, it helps avoid the previously mentioned safety concerns and lack of curb space. Second, if stops are spaced sufficiently apart or there is enough demand in a given area, there could be enough riders boarding and getting off at a single stop to gain some of the functionality of a traditional transit system where riders are grouped together for increased efficiency. Lastly, having users walk to a convenient spot to meet their SAV can avoid the need for the vehicle to pull off the most efficient route for existing riders, such as leaving a major thoroughfare and diverting to a side street where a new rider initiated the pick-up process, and then rejoin that route again. This could lead to time savings and perhaps even pay safety dividends through reducing turn movements, though this second aspect is outside the scope of this analysis.
Finally, geofences were used in the simulations. This restricted SAV service to a smaller region of the Austin area, while still allowing all other modes to serve the entire 6-county Austin area. Gurumurthy et al. (2021) studied four different SAV geofences in the Chicago area, each serving an increasingly larger area and all also including DRS. By focusing on a small slice of the region and excluding sprawling development while still covering a large enough area to provide a balance between trip generators and attractors, fleet efficiency increased. More specifically, SAV eVMT was decreased somewhat by using DRS but decreased even further when combined with a limited geofence. Shared autonomous vehicle idle time did increase with smaller geofences as the vehicles served shorter trips and did not have to spend as long carrying passengers or going to pick them up, but the percentage of VMT while empty decreased by almost half when only operating within the City of Chicago instead of the entire metropolitan region. Therefore, to maximize operational efficiency in the Austin SAV network, an initial geofence focused on the Austin CBD and inner suburbs was chosen, as shown above in Figure 3. This was expanded in later runs to serve a larger area, as described later in the Model Scenarios section.
Model Scenarios
Multiple variables such as fares and fleet size were adjusted to evaluate their impact on the performance of a hypothetical SAV network operating in the Austin region
Pick-Up and Drop-Off Configuration
Whenever a trip begins or ends within 0.25 miles of a PUDO (about 3.5 downtown Austin blocks of distance) the rider is instructed to walk to one of the sites to meet their assigned SAV. Otherwise the SAV serves the passenger exactly at his/her origin or destination address. Therefore, SAV trips can involve either door-to-door service, walking to a PUDO at the start of a trip only, being dropped off at a PUDO and walking a block or two to one’s final destination, or using PUDOs at both ends of a trip. Three PUDO setups were tested: no PUDOs used (so all trips are door to door), one PUDO site for nearly every block of land in the Austin CBD, or PUDOs sited to create 3 x 3 gridded of blocks of land, as shown below in Figure 5. Spacing PUDOS one block (A) vs. three blocks (B) of distance apart in the Austin CBD.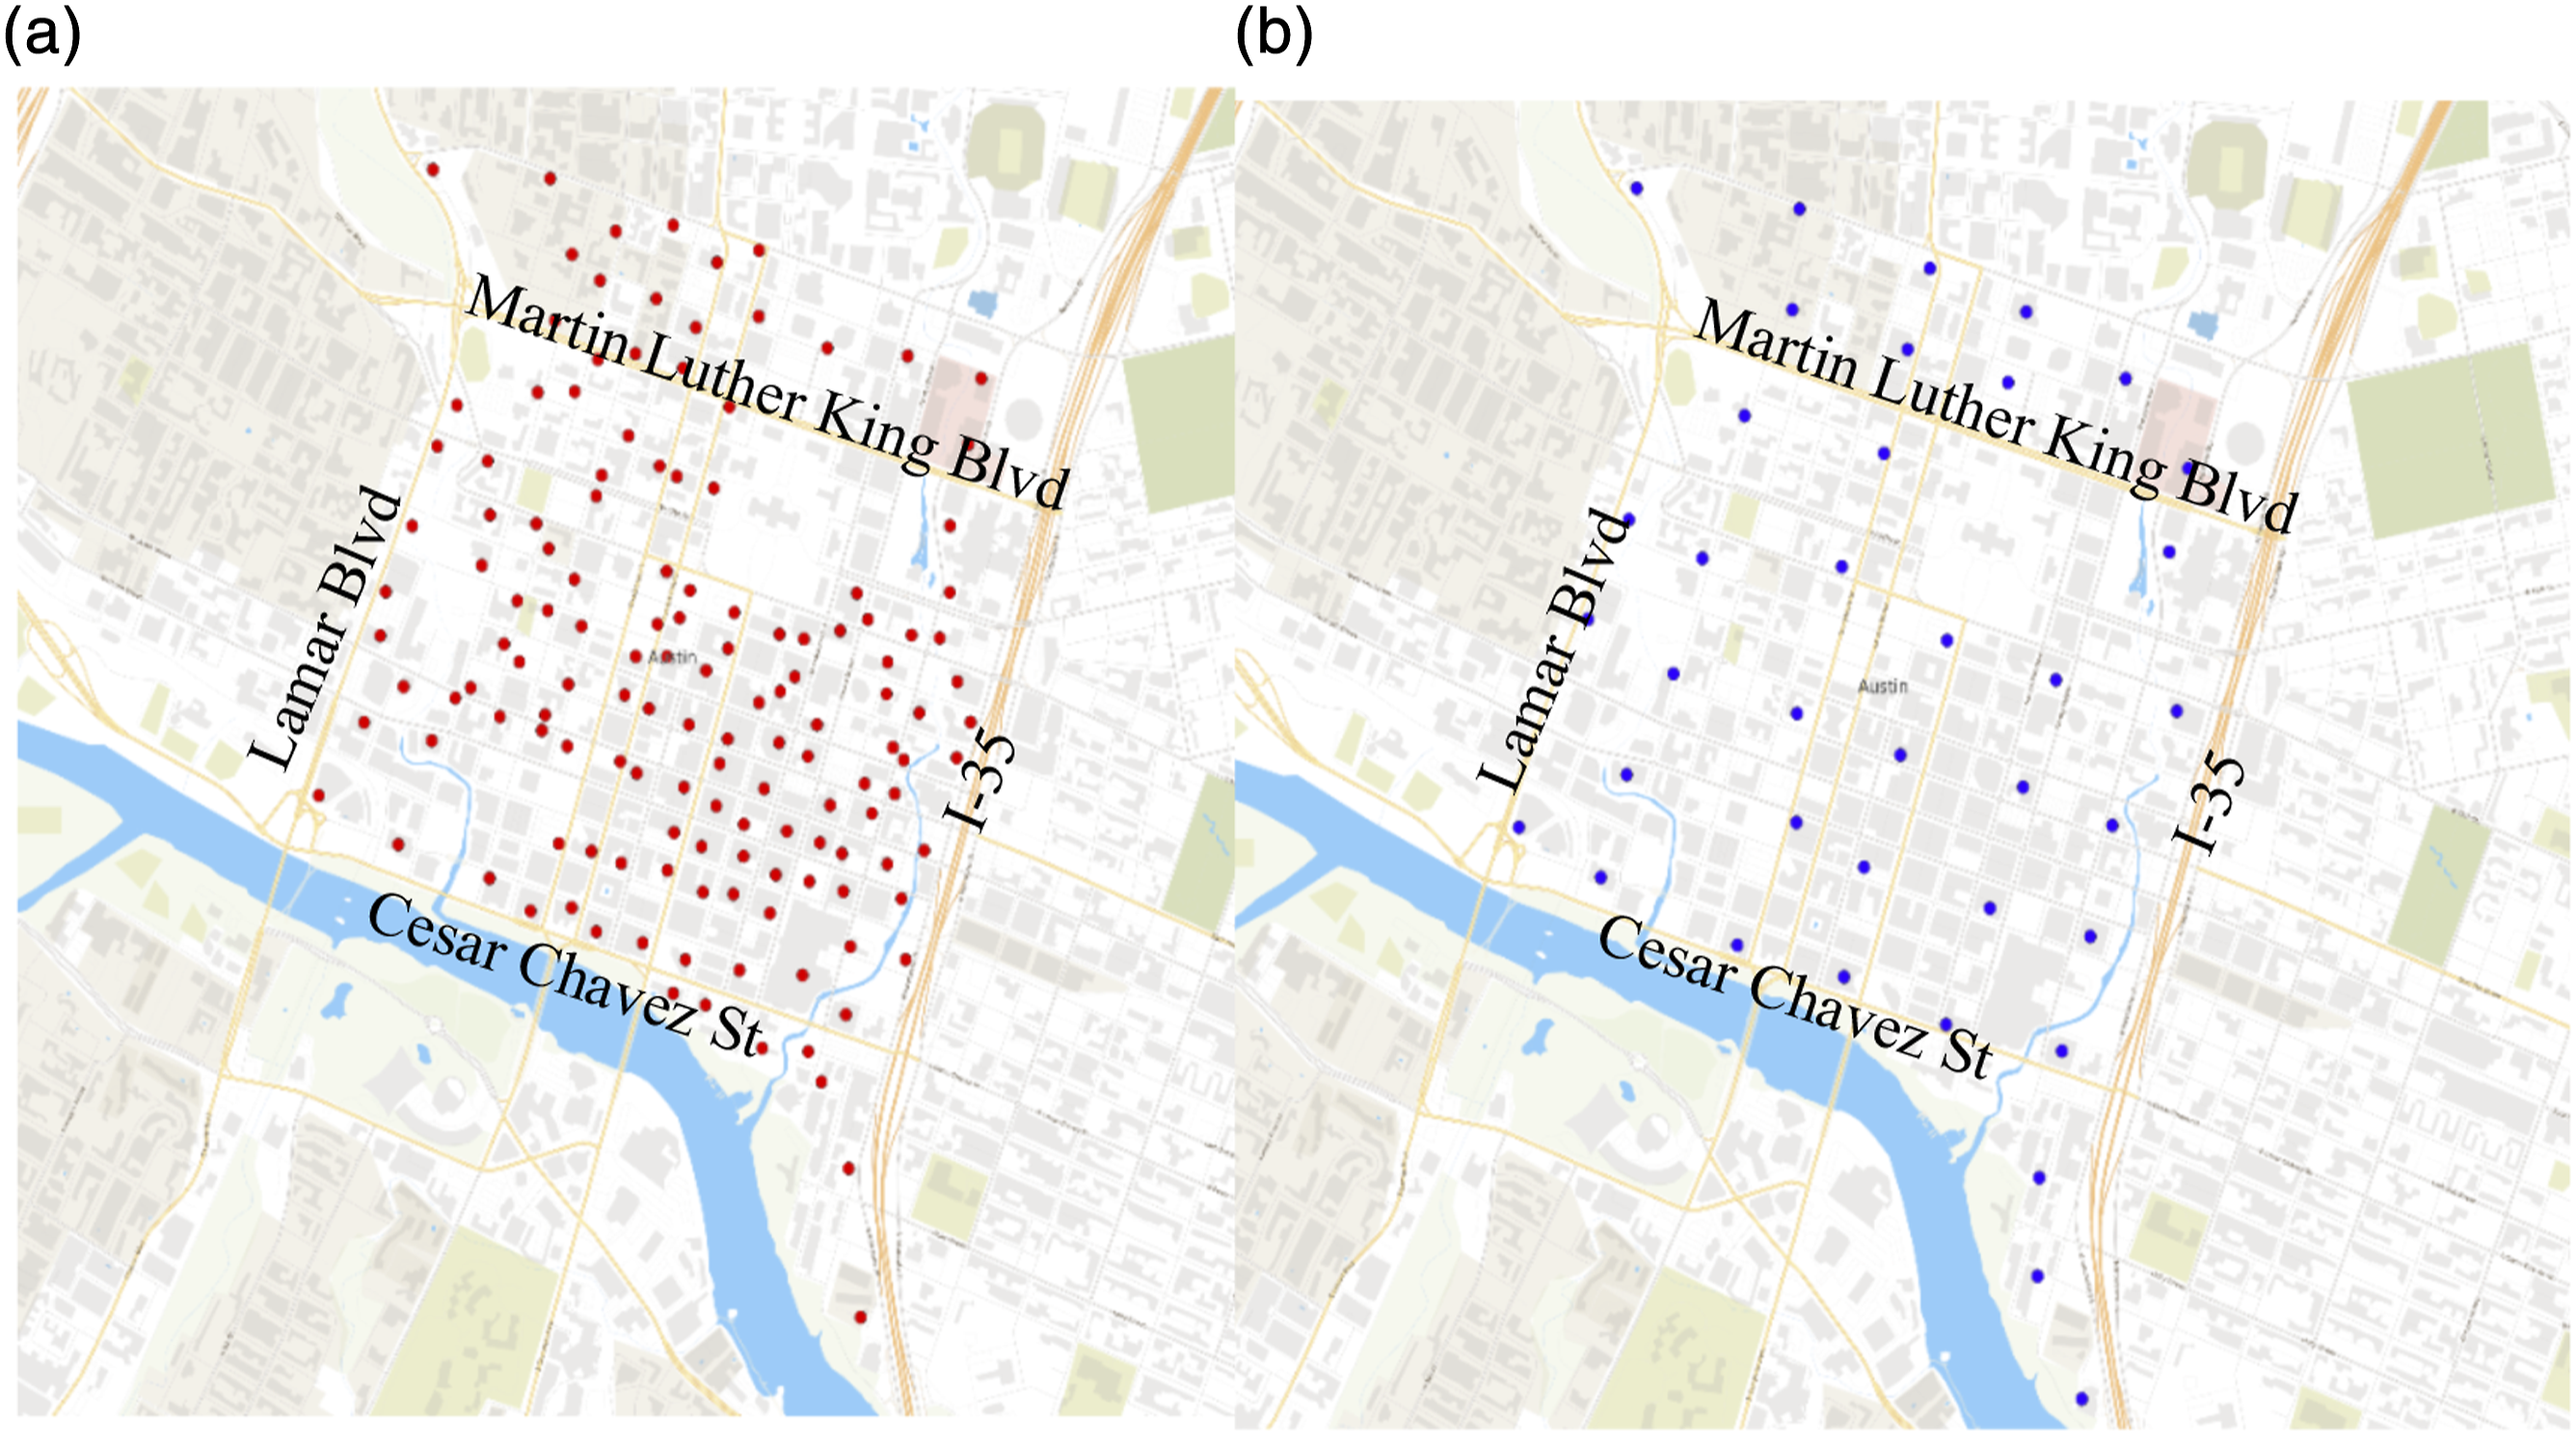
This approach led to 145 PUDO sites in the scenarios where PUDOs are spaced one block of distance apart and just 40 PUDO sites, each three blocks apart. This includes a small number of PUDOs at the Domain Shopping Center (in northwest Austin) and the Austin Bergstrom International Airport (in southeast Austin) – both of which lie far outside the bounds of Figure 5Aa and 5B. As can be seen in Figure 5A, even in the “one-block” spacing there are not PUDOs on every single block of land. This is because in POLARIS PUDOs have to be tied to one of the 39,638 trip-end “locations” (addresses, essentially) in the Austin network, which are places that a trip may begin or end. In some areas there is only a single location per block of land or a group of blocks of land, while in other areas, especially in the CBD, there is a location for every address. Due to data limitations, there are some blocks of land in the CBD that do not contain a location, but since no trips can be made to these blocks of land the absence of PUDOs there does not have any consequences. The maximum walking distance for an agent to reach a PUDO is 1/4 mile (400 m) in the less-dense configuration (Figure 5B) and only 1/12 mile (133 m) when the PUDOs are placed more closely together (Figure 5a), so the average walking distance is expected to be about half (just 200 m and 67 m) of the maximum.
Currently, POLARIS does not model curb occupancy for all vehicles. Therefore, in the scenarios with no PUDOs (door to door service), the SAVs were able to instantly find a place to pull over and make their pick-up or drop-off. In the real world, SAVs must compete with other vehicles for curb areas designated as paid parking, commercial drop-off, and other designations open to SAV use. It can be assumed that the no-PUDO scenario represents a variable parking pricing policy that aims to always leave at least one space vacant on each side of a block of land.
Taxis and private vehicle owners (and, more recently, TNC operators) have been meeting their passengers curbside for decades, sometimes in long queues (at airports, convention centers, and other popular destinations or origins). When demand for curb space exceeds supply, private cars and trucks may seek to double-park, creating serious issues for exiting vehicles and pedestrian safety. This paper extends PUDO sites (by increasing space count) to enable peak demand, as simulated here. Fleet managers can also re-assign passengers to other SAVs, if some SAV callers are late to their rides. Managers can require that users be present before assigning a vehicle, and they can hold SAVs back, away from PUDO sites, if SAV spillbacks emerge. Pick-Up and Drop-Off site management is likely to be far more efficient than private curb management, thanks to connected-vehicle coordination, and single algorithms controlling large fleets (versus hundreds or thousands of independent actors trying to access the curb, without any coordination).
Fleet Size
Various fleet sizes were initially tested without PUDOs enabled, ranging from 400 vehicles to 10,000. Based on the tradeoff between ridership and the percent of time that SAVs sat idle, fleet sizes of 1,000, 2,000, and 4000 SAVs were found to have the best balance between the two and were selected for further investigation with varying PUDO policies and fare prices.
Shared Autonomous Vehicle Fares
Finally, two pricing schemes for the service were implemented in the Central Austin scenarios. First, a 50¢/mile fee, which is competitive or even slightly lower than the average cost per mile to operate a personal vehicle in the United States when all costs of ownership are considered (Bureau of Transportation Statistics, 2019). The purpose of this was to see how many individuals could be enticed to use an SAV instead of their own car if the cost was almost the same. Second, a $1/mile fee, which was hypothesized to reduce ridership but not to reduce revenue per SAV.
Shared Autonomous Vehicle Service Area
While the entire 6-county CAMPO region (shown in blue in Figure 6) was modeled in all scenarios, SAVs only served a subset of the region. One service area for the Austin SAV fleet was created: a Central Austin region shown in orange located within the greater Travis County region, shown in red (Figure 5). This service area was selected due to its high concentrated demand as discussed in the Central Austin, Travis county, and 6-county CAMPO region.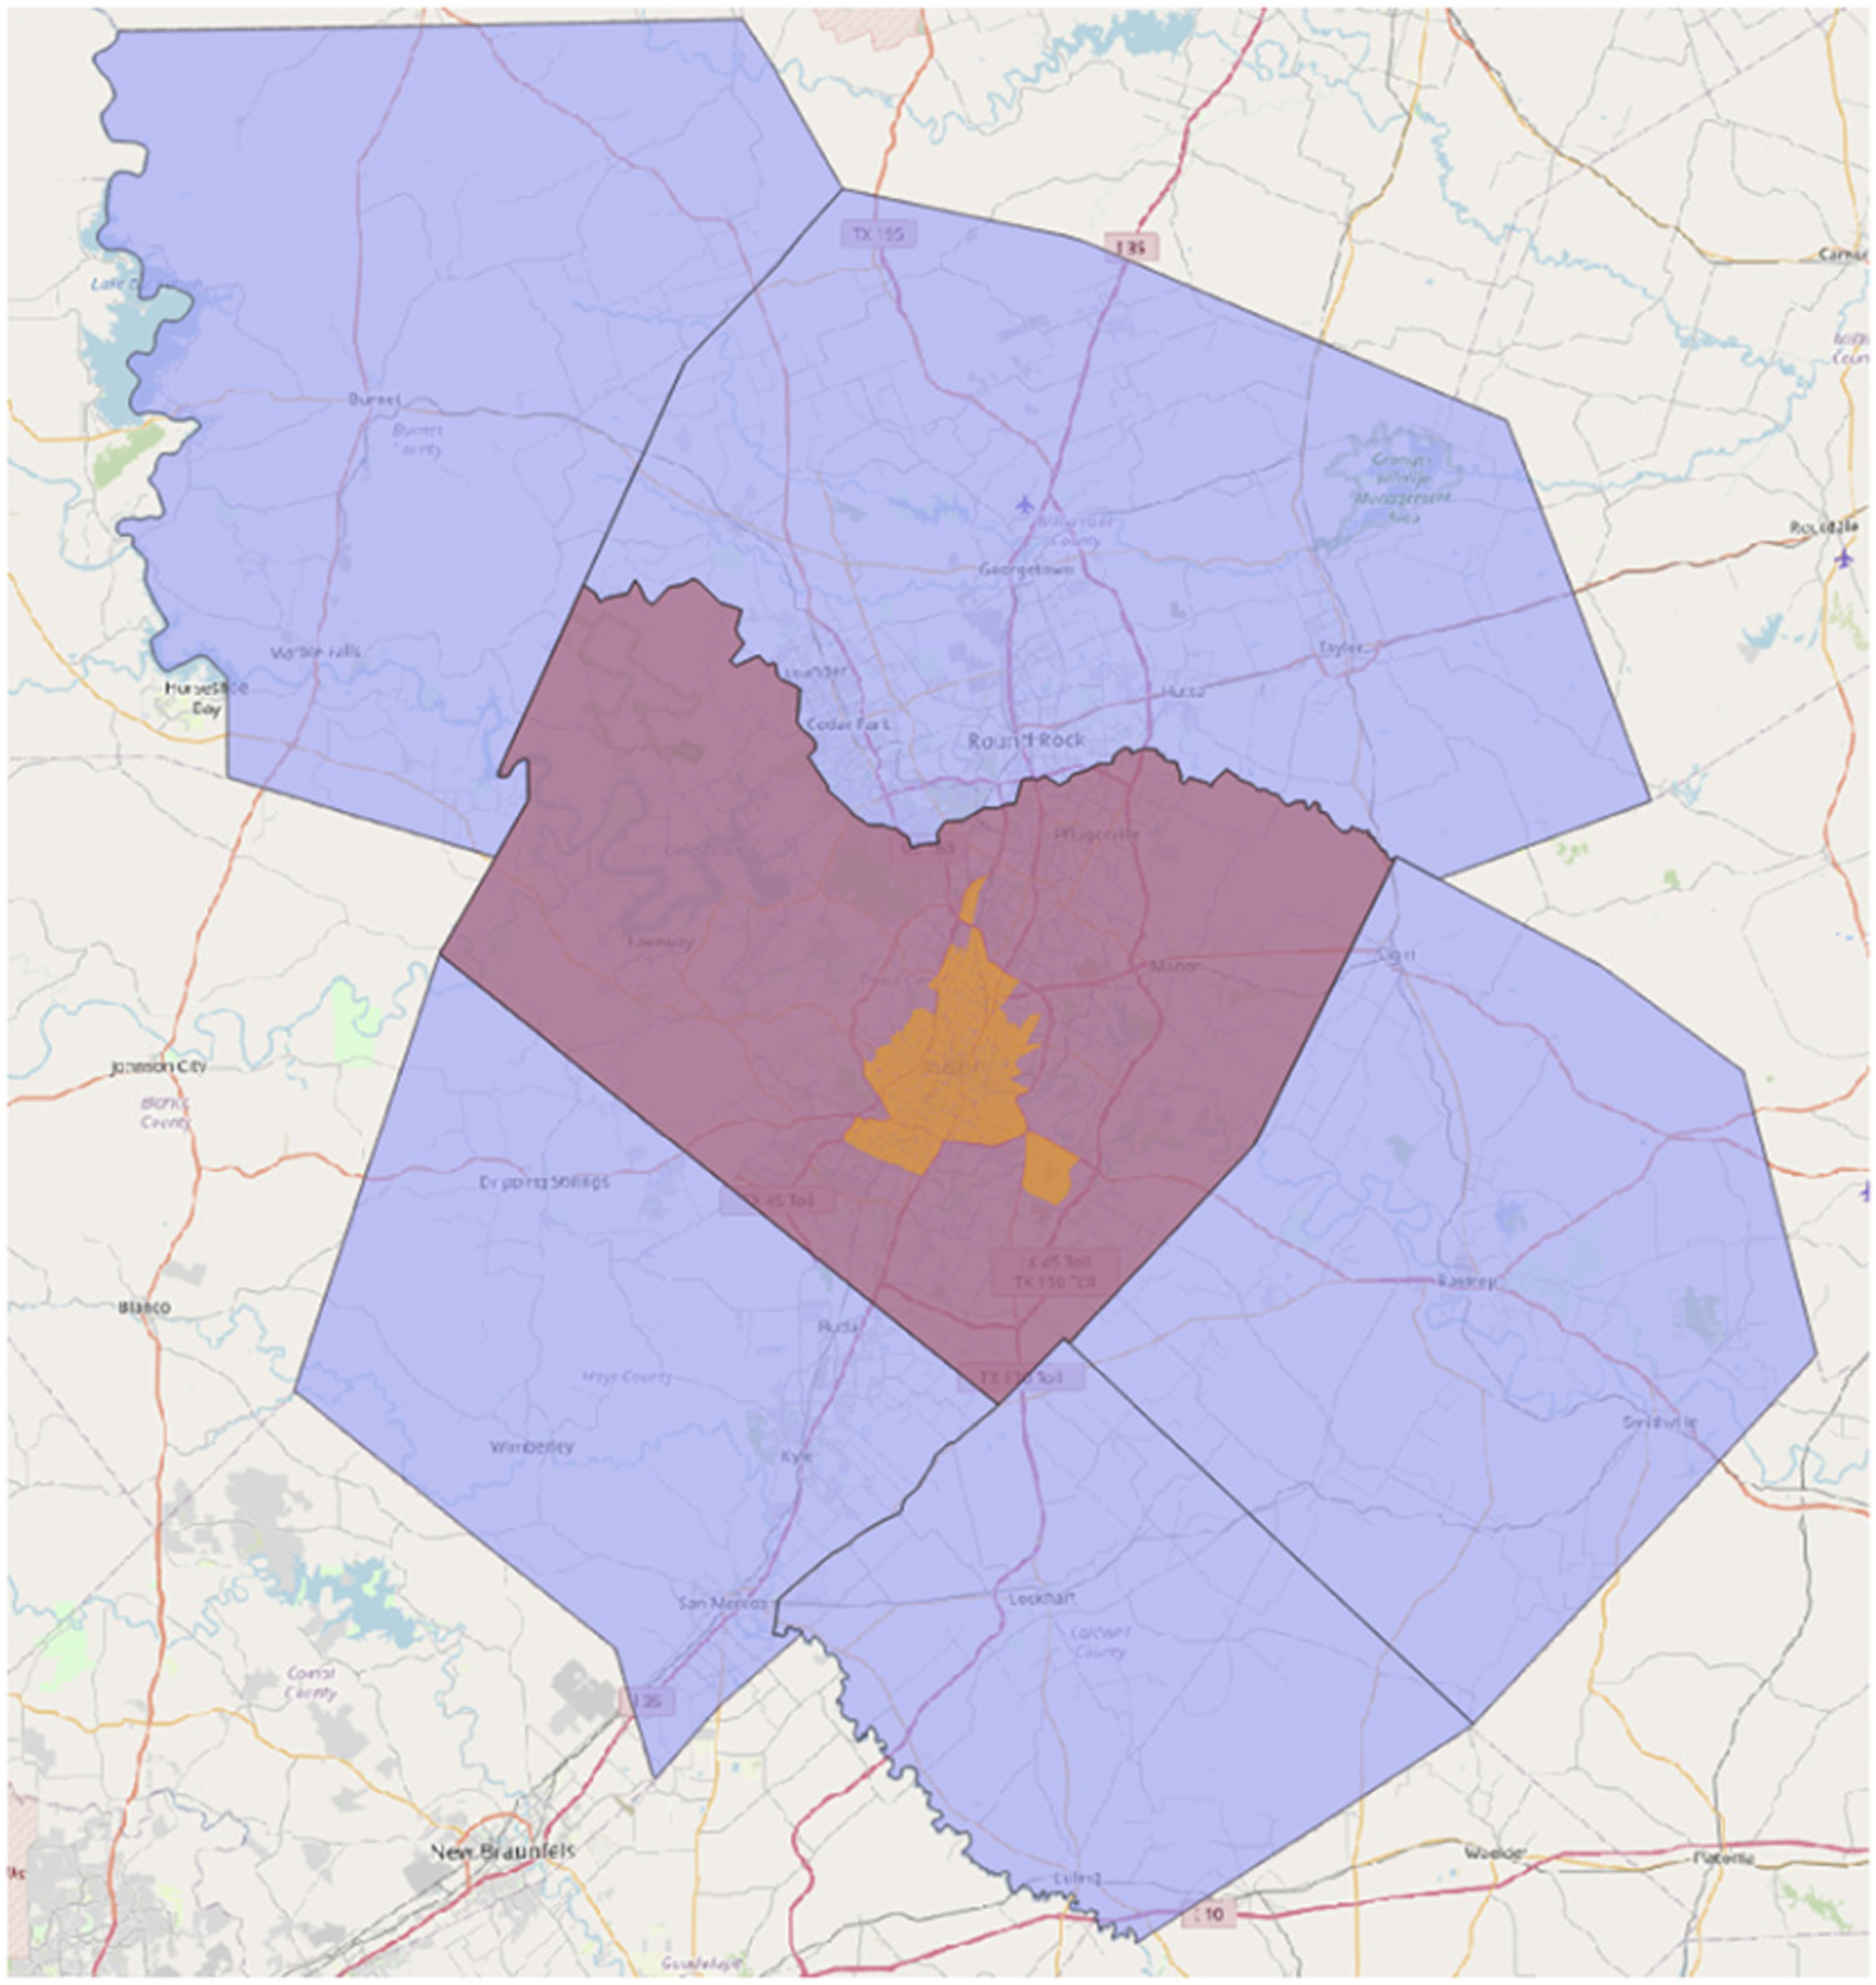
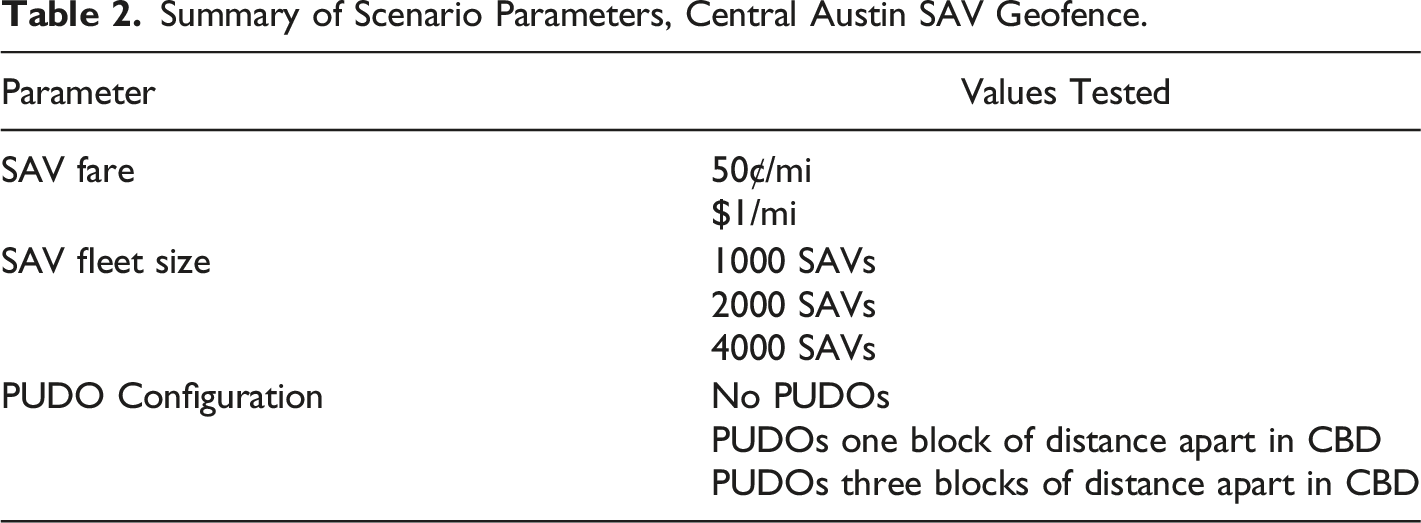
Central Austin SAV Geofence and Scenarios
Summary of Scenario Parameters, Central Austin SAV Geofence.
Results
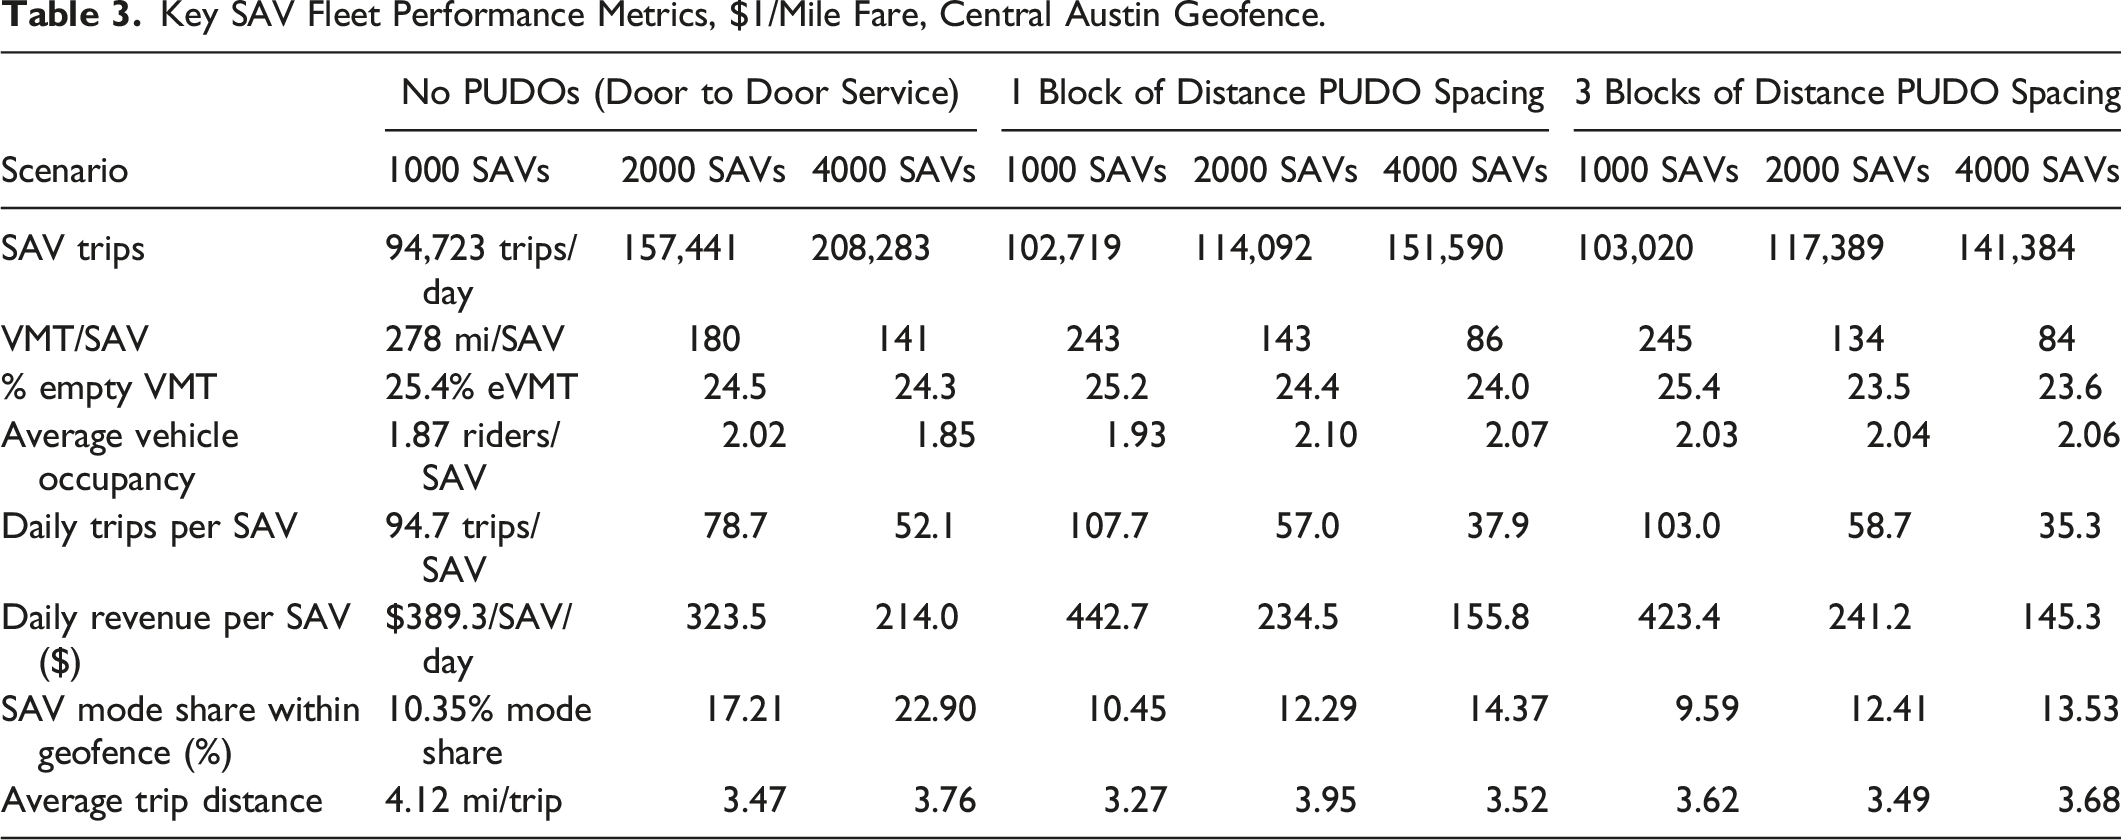
Key SAV Fleet Performance Metrics, $1/Mile Fare, Central Austin Geofence.
Key SAV Fleet Performance Metrics, 50¢/Mile Fare, Central Austin Geofence.
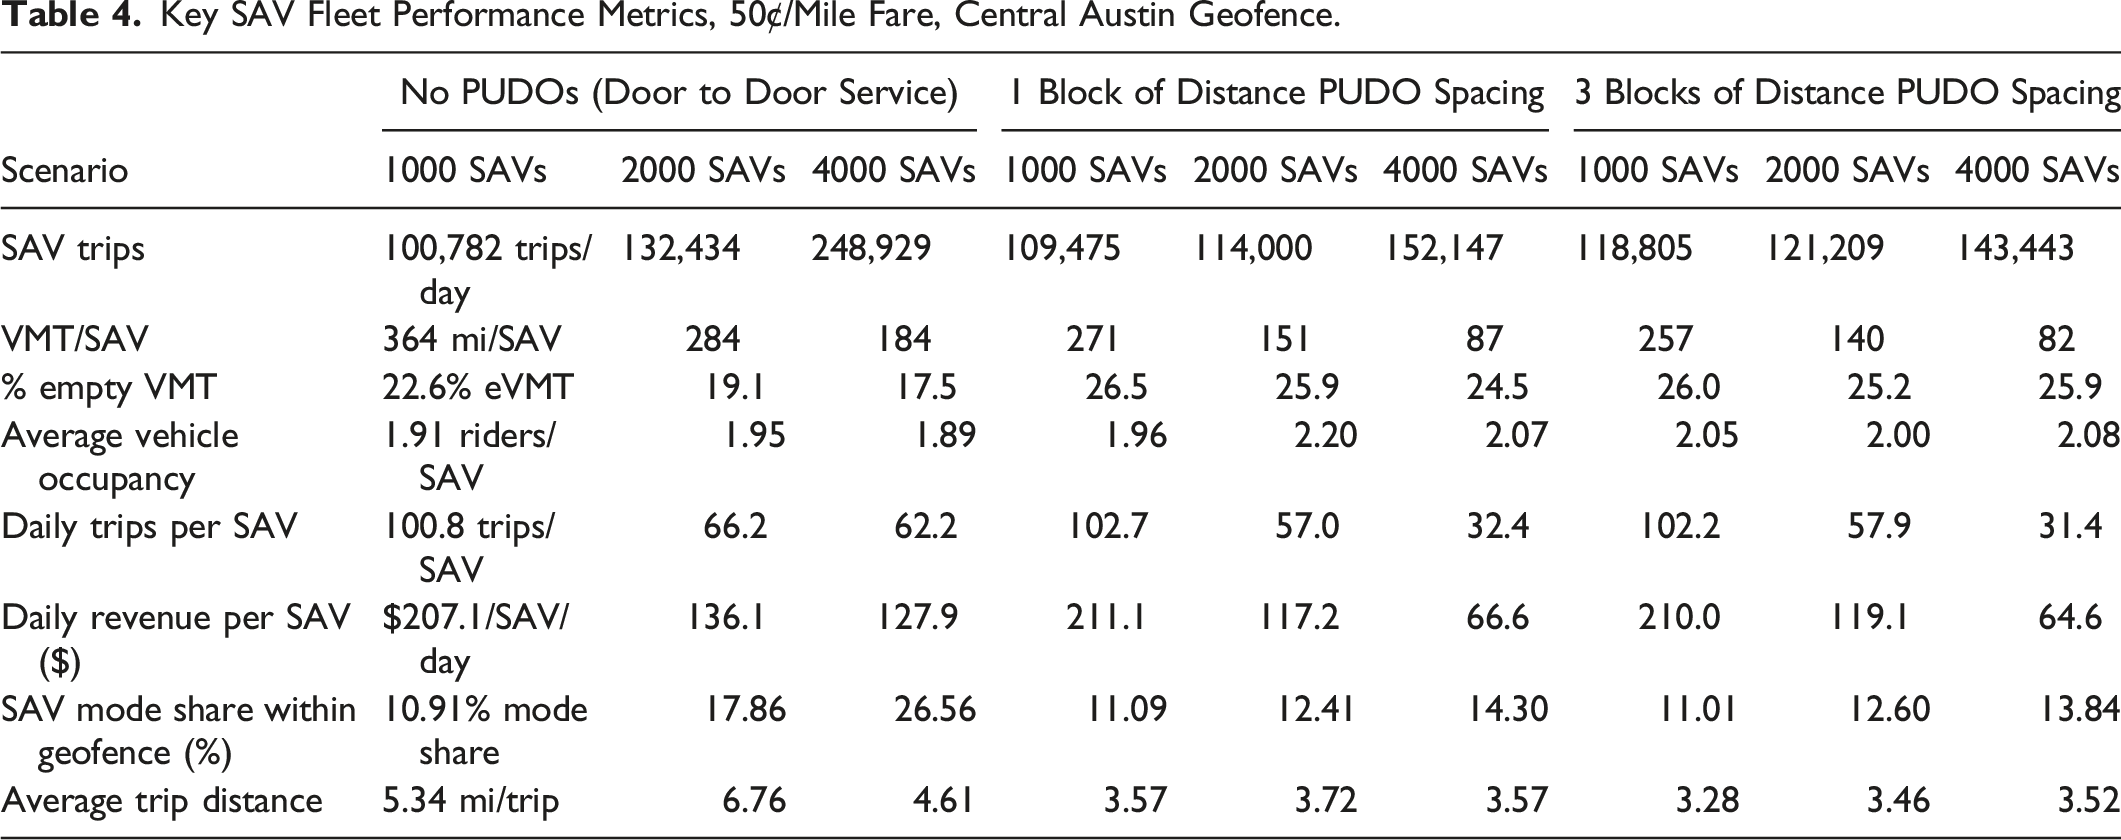
As expected, increasing the fleet size always leads to increased ridership no matter the combination of the SAV fares or PUDO locations. Figure 7 shows the trips per hour for a Central Austin SAV network with no PUDOs, a 50¢ fare, and different SAV fleet sizes (1000, 2000 and 4000), which showed the greatest variation of ridership among the Central Austin scenarios. Weekday SAV trips per hour for varying fleet size for a central Austin geofence, No PUDOs and 50¢ fare.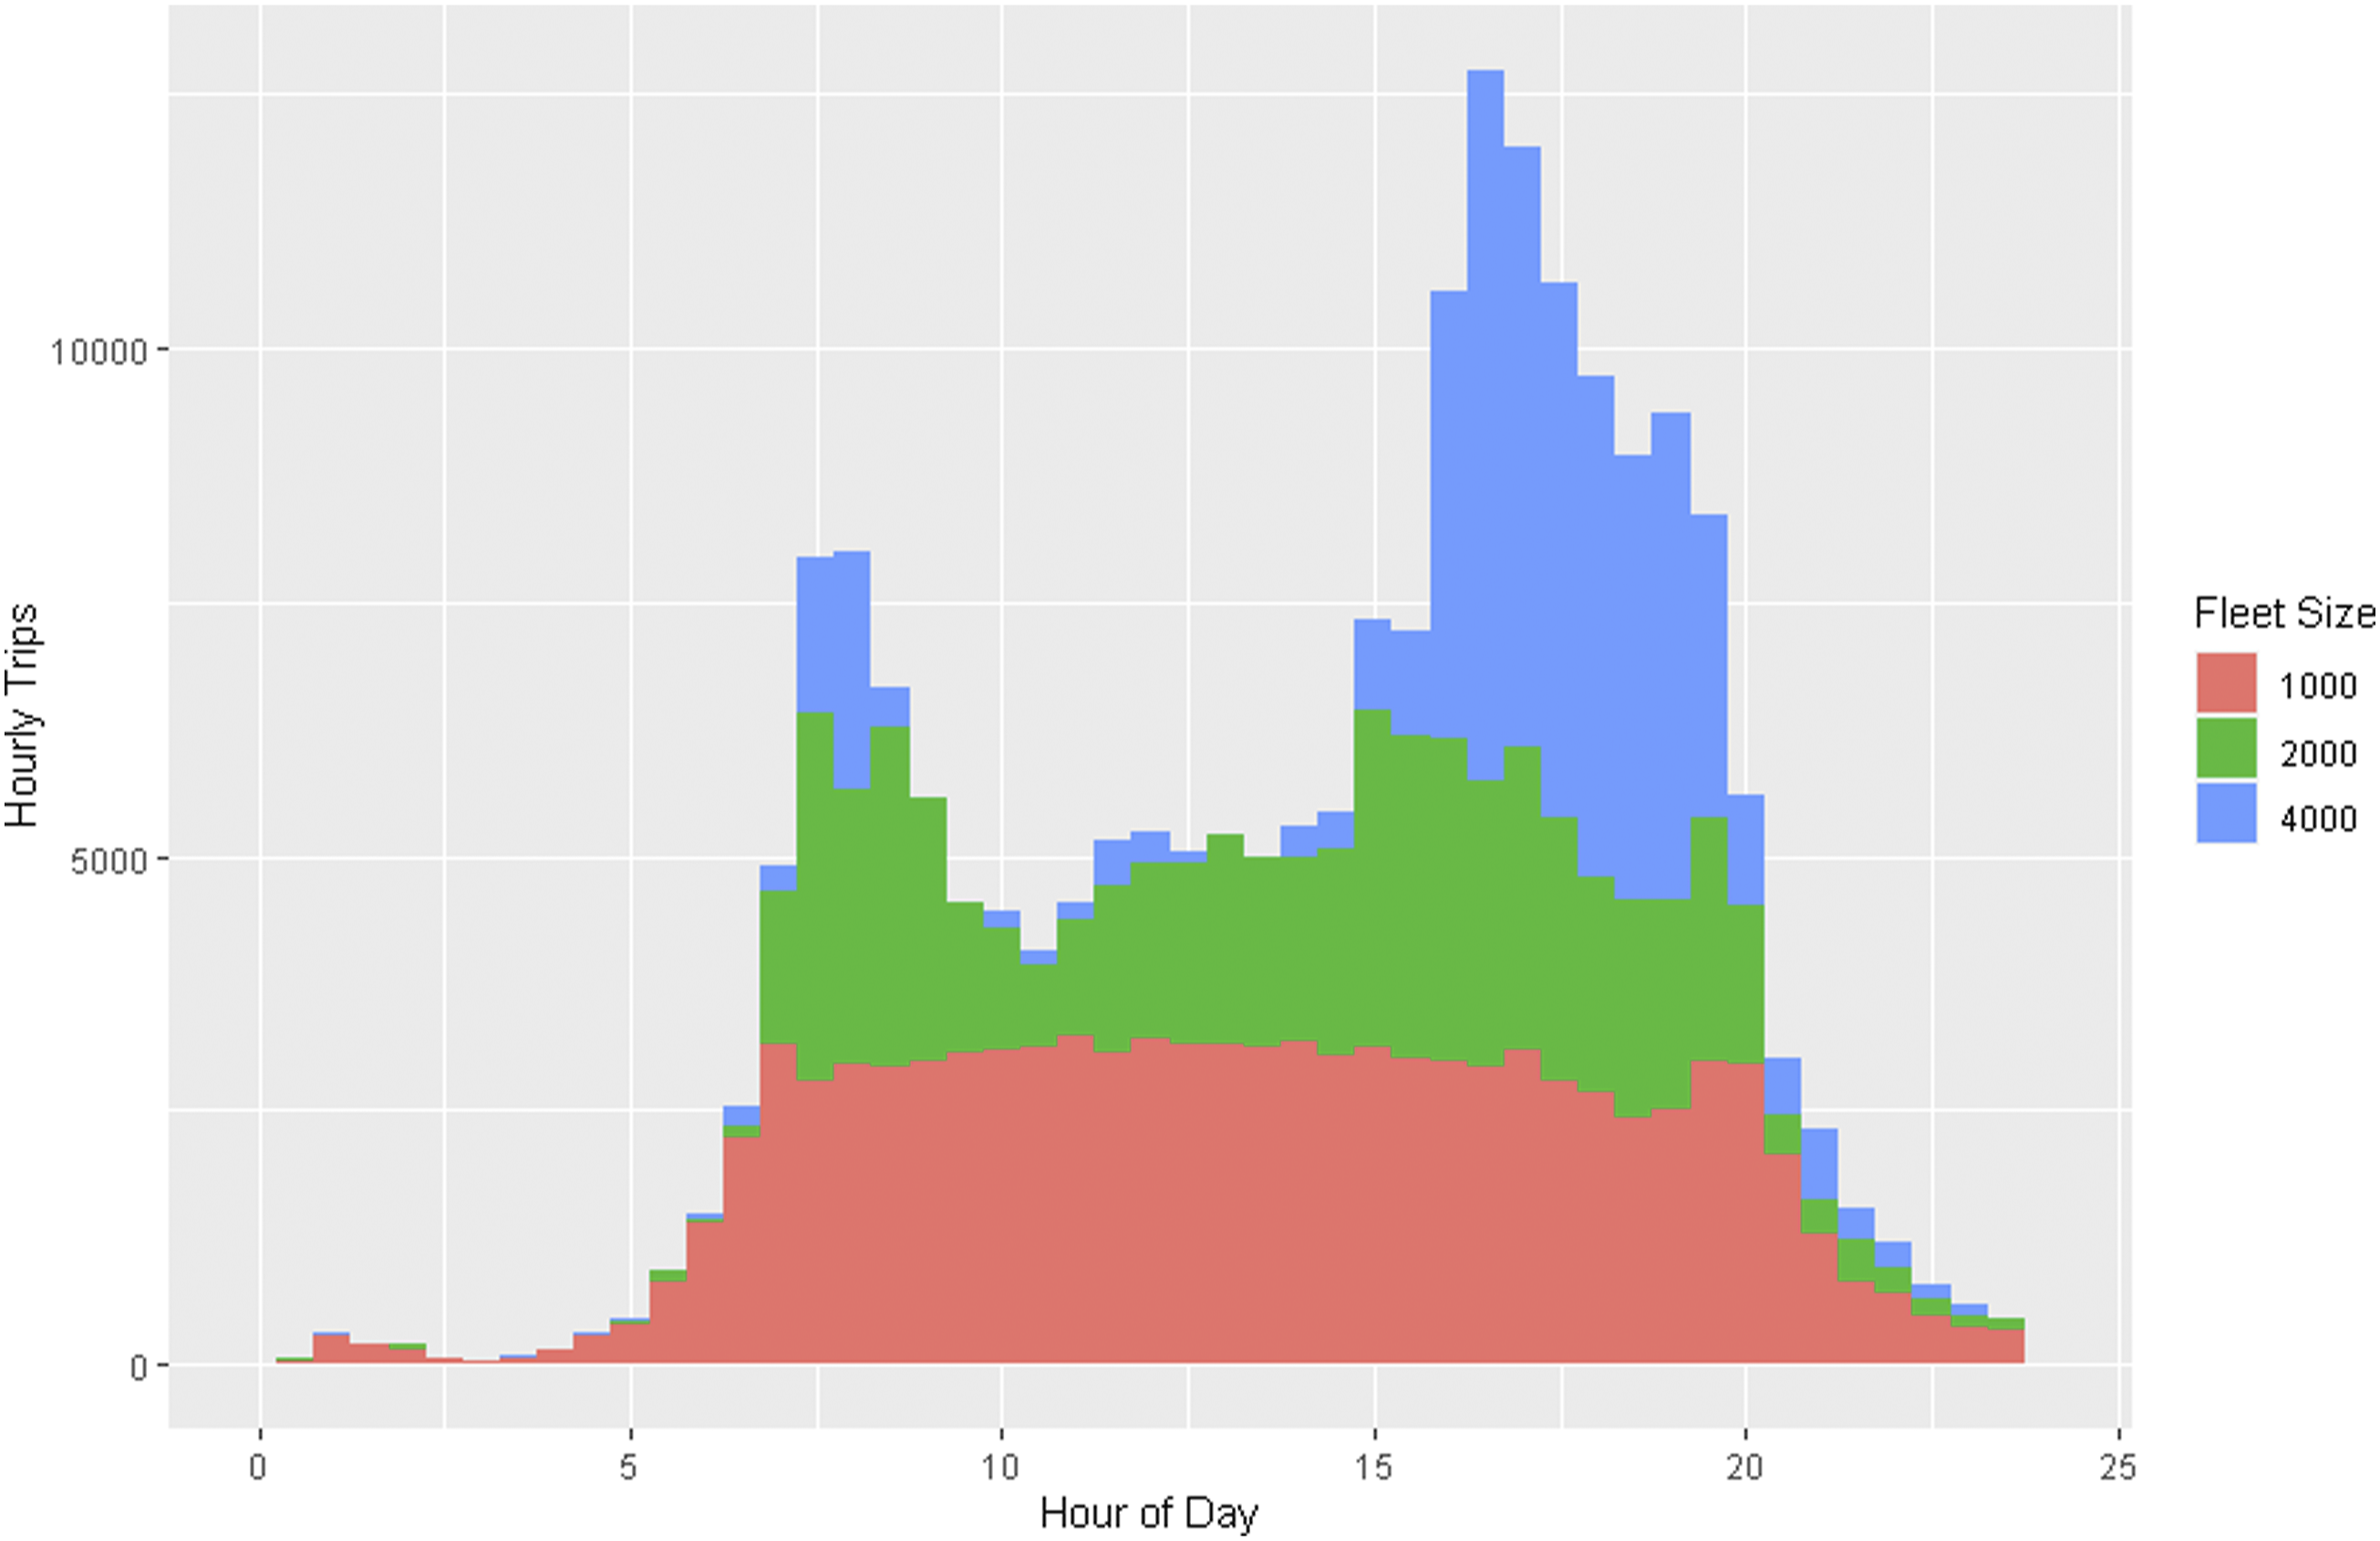
Figure 7 shows that both the 2000-vehicle and 4000-vehicle fleets manage to accommodate demand during the middle of the day, while the 1000-vehicle fleet peaks at about 2500 trips per half hour. The 4000-vehicle fleet is especially able to accommodate additional demand as the PM peak goes on while the smaller fleets are unable to keep up, due to lower SAV and SAV-seat availability and longer wait times discouraging others from choosing the SAV mode, or other means. The exact operating statistics of the SAVs and the Austin city core, such as vehicle occupancy at each hour and delays along CBD links, are interesting factors that should be explored in the future to better explain ridership losses.
Vehicle-miles traveled and eVMT did fall slightly as fleet size rose. More SAVs means easier access/shorter distances between travelers requesting an SAV and the assigned SAV, thereby reducing distances traveled empty. In addition, Tables 3 and 4 suggest how introduction of PUDOs lowered average trip distances, thanks to fewer and shorter detours, as shown in Figure 2. This decline in VMT and eVMT underscores the potential value of ride-sharing/pooling in right-sized (and potentially all electric) SAVs in the battle against climate change, by lowering travel emissions from those wanting mortised door-to-door service.
From Tables 3 and 4, average occupancy (AVO) did not always increase by increasing the fleet size, and there was no general pattern for average vehicle occupancy, which was maintained at about two passengers per SAV during revenue trips. The ridership and subsequently the AVO of a shared mobility service can be affected by several factors: fare price, PUDO location/density, the capacity of vehicles, spatio-temporal distribution of demand, matching algorithm, characteristics of travelers and their willingness to share rides, and incentives provided for sharing rides (e.g., discounts), etc. If occupancy could be increased to approach the SAVs’ 4-passenger capacity, the lower average costs per passenger-mile may enable lower fares and thereby higher demand. However, more ridesharing or “ridesplitting” can lead to longer trip times for users (due to more circuitous routing between more parties’ origins and destinations), so any fare savings versus added travel-time costs is important to appreciate. On the service provider side, optimal design and policies should be implemented to increase ridership and AVO. For example, riders can receive a discount when sharing a ride with two or more people. Alternatively, a service can be localized, minimizing spatio-temporal distribution, reducing detour time and promoting ridesharing. In addition, service providers can utilize matching algorithms that promote ridesharing while optimizing travel time and cost. Looking at Tables 3 and 4, a service with PUDO resulted in higher AVO than the service without PUDO since the existence of PUDO results in ride aggregation promoting ridesharing. From the regional planning perspective, incentives can promote ridesharing and shared mobility services such as designated PUDOs, high-occupancy lanes, discounts for public transit, etc.
Impact of Pricing Analysis
Daily trips per SAV, daily revenue per SAV, and the SAV mode share within the operating region are especially relevant for the commercial or financial feasibility of operating an SAV fleet. Fleet operators must ensure that their investment in SAVs is being put to good use through high vehicle occupancies, since idle vehicles means money going to waste. Using data from Tables 3 and 4, the two pricing models in the Central Austin geofence can be compared.
Daily trips per SAV begin with quite high values for low fleet sizes, about 100 person-trips per day per SAV in the $1/mile fare with 1000 SAVs scenario and 200 per day per SAV in the 50¢/mile pricing and 1000 SAVs scenario. These high use numbers fall to just 30 trips per day per SAV as the fleet size grows (under both fare levels). Shared autonomous vehicle mode share can exceed 25 percent, but it may not be cost effective to operate a larger fleet. The point where marginal costs begin to exceed marginal revenues is an important factor in sizing one’s SAV fleet.
Shared autonomous vehicle fleet owners may seek to maximize profits (when privately maintained), community welfare or ridership (when publicly provided). Cities and regions may elect to subsidize private-fleet operations (for shared rides and/or by those with disabilities, for example) or operate their own fleets in order to increase consumer welfare, helping lower community transportation costs, relieving congestion, and/or lowering parking demand. More travelers select the SAV mode as fares fall here, but per-vehicle revenues are notably higher in the higher-fare settings.
Impact of PUDO Spacing Analysis
When PUDOs were implemented (for the 2000- and 4000-SAV fleet sizes across Austin), a sharp drop in ridership is observed (with PUDOs spaced just one block of distance apart). A lesser demand drop emerges when shifting to inter-PUDO distances of three blocks, as seen in Tables 3 and 4. This shows that in an ideal world where SAVs could always make door-to-door trips, they would achieve a greater mode share and reduce private vehicle traffic. However, for the smallest fleet size of 1000 SAVs, spacing PUDOs three blocks of distance apart actually performed better than running SAVs with no PUDOs. A logical explanation for this is that with vehicles stretched so thin, serving trips grouping riders together at PUDOs helped improve the use of DRS and the overall efficiency of the system.
Distribution of Required Curb Spaces at Each PUDO Site in Central Austin With 4000 SAVs and $1/Mile Fares.
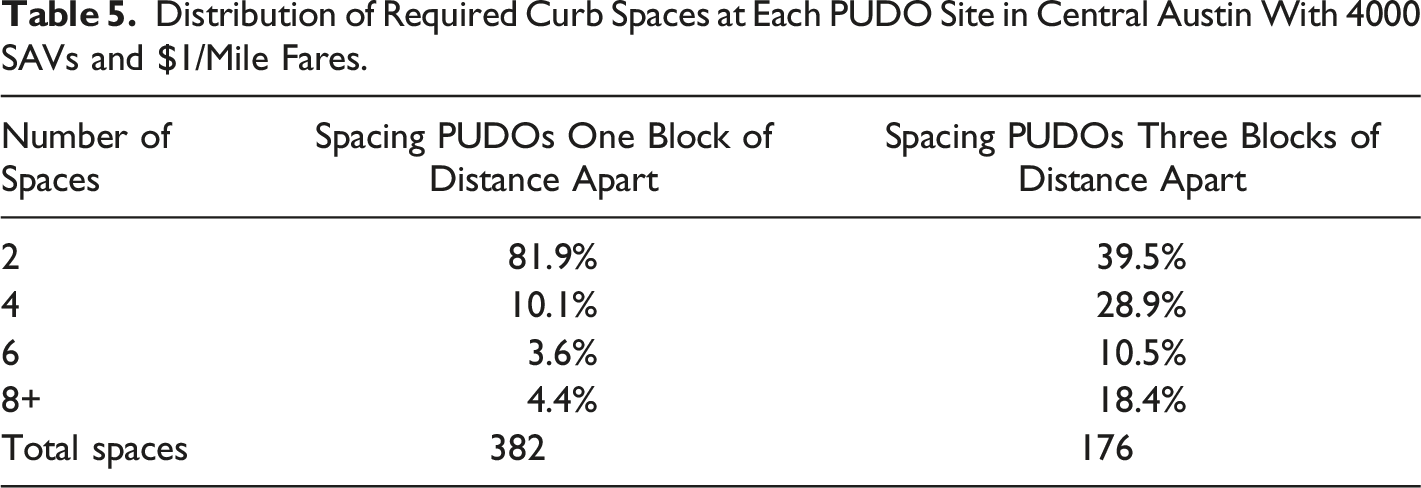
As shown in Table 5, almost 20 percent of PUDO site would need three or more SAV spaces when there is a PUDO on every block of land. This jumps to 60 percent when PUDOs are spaced out to three blocks of distance. The estimate also shows one of the advantages of increased spacing between PUDOs: the total number of spaces needed at peak period falls by 54 percent, from 382 to 176 spaces. There is always a tradeoff between SAV ridership and curb space available for other CBD users. If there is only a PUDO location every three blocks of distance, curb space is freed up on other blocks of land for paid parking, transit, bicycle parking, sidewalk extensions, and other uses.
A possible explanation suggested by Figure 7 is that this is caused by 1000 SAVs not being enough to meet potential demand, 4000 being more than enough for most hours of the day, and 2000 SAVs striking a good balance between the two that also works best with grouping riders into fewer stops, but deeper investigation is required to explain this anomaly. The table also shows that since 92 percent of blocks of land need four or fewer PUDO spaces in the one PUDO (per block of land) scenario, one space could be placed on each side of the block of land to achieve service levels similar to the door-to-door service scenario (where no PUDOs are used).
Conclusions
This paper simulated the effects of various fleet sizes, fares, and PUDO spacing decisions on SAV fleet performance (in serving endogenous demand for rides). As expected, greater fleet sizes accommodate more passengers, especially at peak-demand hours. They also lower %eVMT (by enabling closer SAV assignments to trip calls that emerge) but result in lower revenues per SAV per day. When PUDOs are spaced three blocks of distance apart in the Austin CBD, instead of being placed at every block of land, the total number of curb spaces required for CBD PUDOs fell by almost 40 percent. Greater per-mile pricing also reduced SAV ridership, though per-vehicle revenue rose. Overall, aggregating trip ends lowers wait times for SAV users and total fleet VMT, helping increasing AVOs, reducing network and CBD congestion, and keeping SAV user costs down.
This analysis had some limitations, such as imperfect mode choice and pedestrian walking distance models. POLARIS’ current mode-choice logit model was estimated using a small number of taxi/TNC trips in a recent Austin travel survey, leading to a large alternative-specific constant for the SAV mode and few statistically significant parameters. Due to this, it is difficult to determine a realistic mode share and SAV demand on the network, and some of the results of the simulation may have been due to random noise. In addition, loading and unloading SAVs do not take up any space on the curb. A better simulation of the real world would not allow SAVs to stop at a PUDO occupied by an SAV that is empty or performing pick-up/drop-off, and/or force all empty SAVs to wait outside the CBD on local streets with low curb occupancy. Overall, it is clear that POLARIS provides a powerful modeling framework with many parameters that can be adjusted to appreciate their effects on travel behavior and fleet operations. Future work will involve leveraging this framework to mitigate the limitations expressed above.
As cities evolve and integrate new means of transportation, such as micromobility and SAVs, their curb usage must also evolve. SAVs do require dedicated PUDOs, whether on-street or lay-by, to provide service to customers. The location of the PUDOs for SAVs, the operational speed of the streets, SAV dwell time, congestion level on the streets, the number of spaces available at each PUDO location, parking prices and several other factors affect the smooth operation of SAV services and their subsequent impact on safety and traffic conditions. The optimal solution would be to design infrastructures and set policies for SAVs to make SAVs run efficiently, provide a high level of service, and minimize their impact on traffic. However, modifying infrastructure for SAV PUDO locations is a long-term plan; in the meantime, to safely accommodate these new modes, some space must be reclaimed from existing uses such as paid on-street parking, and some changes in existing policies must be made. When planning an SAV network, the density of PUDO locations may have a significant impact on mode share and the amount of curb space and real estate required for them. Not using dedicated PUDO locations may deliver higher SAV mode shares, but PUDOs will be needed in many congested settings and can be very valuable in facilitating ride-sharing (DRS) inside SAVs. The spacing of PUDO sites affects both SAV ridership and the amount of curb space that must be taken away from other uses. Certain policies should also be implemented in order to minimize the impact on traffic. For example, SAVs should be required to dwell a certain amount of time at each location to prevent congestion. Alternatively, PUDOs should not be placed on busy streets with one or two lanes.
It is worth noting that, while this study focused on the benefits of designated PUDO sittings for SAVs, the same benefits apply to all TNCs, regardless of vehicle automation or private payment. For example, the results showed that designated (PUDOs) can reduce deadheading (empty travel) from drivers circling blocks (as they wait for a traveler to arrive, for example), thereby reducing traffic, emissions, delays, and aggravation for all travelers, which is applicable to both TNCs and SAVs. As a result, it is advised to consider designated PUDO settings when planning human driven TNCs.
Footnotes
Acknowledgments
The authors would like to thank Richard Twumasi-Boakye, Archak Mittal, Andrea Broaddus and James Fishelson at Ford Motor Company for their guidance and support in this project. The authors would like to give special thanks to Matthew Dean for assistance with the literature review of this paper, as well as Dorcas Olayoe for compiling the database of off-street garages and parking lots in downtown Austin. In addition, we would like to thank the team at Argonne National Laboratory for continually developing POLARIS, especially Krishna Murthy Gurumurthy for his assistance with coding. Finally, we would like to thank Jade (Maizy) Jeong for her editing and submission support, and anonymous reviewers for their valuable suggestions.
Declaration of Conflicting Interests
The author(s) declared no potential conflicts of interest with respect to the research, authorship, and/or publication of this article.
Funding
The author(s) disclosed receipt of the following financial support for the research, authorship, and/or publication of this article: This research is supported by the Ford Motor Company under the University Research Program (URP), US Department of Energy and the National Science Foundation’s Industry-University Cooperative Research Centers Program.