
Abstract
In the present study, we investigate the convergence of research and development (R&D) expenditure, a relevant factor in competitiveness, across Spanish regions through a club convergence analysis for the period 2000 to 2017. The results show large regional disparities in R&D expenditure in Spain. We have identified four clusters, plus a divergent region: the Basque Country. The results are similar for the two perspectives considered: percentage of GDP and per capita. We discuss these results taking into account the effects of the Great Recession and compare the outcomes with those for a club convergence of regional GDP per capita. Finally, we carry out an ordered logit model to analyse the factors behind the clusters, with human capital and economic openness being significant.
Highlights
We study the convergence of R&D expenditure across Spanish regions. The club convergence analysis shows four clusters plus a divergent region, the Basque Country, denoting heterogeneity in regional R&D in Spain. The results are very similar for R&D expenditure in terms of GDP and per capita, showing robustness of the outcomes in both perspectives. The ordered logit model identifies human capital and economic openness as the main drivers of the formation of clusters. Policy implications and recommendations are discussed.
Introduction
Research and development (R&D) and economic growth have powerful connections both in theoretical models (Aghion and Howitt 1992; Grossman and Helpman 1994; Guellec and Ralle 1991; Lucas 1988; Solow 1956; Romer 1986, 1990) and in empirical studies (Capello and Lenzi 2014; Chapman and Meliciani 2017; Martin et al. 2005; Miguelez and Moreno 2015; Rodríguez-Pose and Crescenzi 2008; Verspagen 2010). In addition, R&D is a relevant factor in competitiveness 1 and on the increase in the current knowledge-based economy. Furthermore, R&D is a key determinant of innovation, 2 an area in which regions encounter the “regional innovation paradox” (Oughton et al. 2002), the contradiction between greater need for innovation in regions lagging behind and their lower capacity to attract public funds for innovation when compared with more advanced regions. Among recent studies empirically covering this paradox, Muscio et al. (2015) analysed European regions, concluding that such a contradiction existed as well as pointing out the advantages of smart specialization strategies 3 when attempting to improve regional innovation systems.
In addition, Moreno Pires et al. (2020) discuss innovation in less developed regions in Europe, identifying critical questions and proposing specific actions to improve innovation policy. 4 Navarro et al. (2009) carry out an interesting analysis of regional innovation systems in the European Union (EU) from 21 variables regarding the ability of a territory to generate and absorb knowledge, and its capacity to transform R&D into innovation and economic growth. They conclude seven types of systems and discuss the results in policy terms. Also Bristow and Healy (2018) study the links between innovation and regional economic resilience. For Europe, they state that regions classified as innovation leaders were significantly more likely to have either resisted the Great Recession or recovered rapidly from it. However, it should be remarked that regional growth is a very complex phenomenon, and despite the great research efforts in recent decades, it still remains partially as a “black box” (Grillitsch et al. 2021). Additionally, Audretsch et al. (2022) argue the link between the literature on radical innovation 5 and regional growth, concluding that it is still an under-researched area.
Furthermore, economic convergence is also closely related to convergence in research and innovation. Archibugi and Pianta (1994) analysed this link for OECD countries, and Mulas-Granados and Sanz (2008), doing the same for the European regions in the period 1990‒2002, concluded that convergence in business R&D led to convergence in innovation, i.e., patents, which led to convergence in income per capita.
Considering the significance and economic implications of R&D expenditure, the benefits of studying its evolution over time in territories through a convergence analysis should be clear. In this framework, we should remember the close links between European, national and regional policies, considering the noted resources offered by several programmes, mainly Horizon 2020 and the later Horizon Europe. In addition, the necessary public-private collaboration and the resources provided by the private sector are still great challenges in some European countries and regions. Considering that under the Europe 2020 Strategy the objective for the EU as a whole was an R&D expenditure of 3% of GDP, and despite this figure not being the result of any economic model but a desirable objective, it seems reasonable to also take that threshold as the objective at the regional level in the EU.
Specifically, we focus on Spain, an interesting case due to the fact that although the country presents a moderate level of R&D expenditure in terms of GDP, 6 there are noticeable differences across regions, ranging from 0.37% to 1.89% in 2017. Regarding the objective of 3% of GDP for R&D expenditure in the EU, it should be noted that Spain established a much more modest goal, 2% for 2020. In addition, Spain is one of the most decentralized countries in the world. 7 Moreover, studying convergence across regions in one country has the advantage of researching within a more uniform legislative framework, instead of across countries analysis.
As in the income convergence context, and generally almost all economic variables, in R&D there is no unequivocal or conclusive a priori result about what is expected from the empirical convergence analysis, due to the multiple determinants of this phenomenon, as is reviewed more specifically in Section 4. The completion of the same steady-state for all territories, the regions of Spain in our case, is difficult to achieve with real data despite the current ease of extending and adopting technology and knowledge, as intensities of R&D depends on several economic and political factors.
One relevant issue in this kind of research is the desirability, or not, of convergence of R&D expenditure across territories, while that convergence is often claimed in other magnitudes as productivity (Sondermann 2014) or GDP per capita, mainly because of their welfare implications. We strongly believe that, given the interrelationships between R&D and growth (Gittleman and Wolff 1995), the elimination of significant gaps in R&D efforts across countries or regions should also be pursued, at least as a policy objective. 8 Interestingly, Rodríguez-Pose and Crescenzi (2008) studied, in a combined manner, three approaches on the impact of innovation on regional economic performance: R&D, spillovers and innovation systems, concluding interactions which shape the innovation capacity of every region, and highlighting the role of proximity –spillovers- for European regions. In another interesting study, Guastella and Timpano (2016) analyzed the relations between knowledge, innovation, agglomeration and regional convergence in the EU, focusing on the motivations for place-based regional intervention. They concluded the study by claiming for reinforcing the specific policy actions in catching-up regions, in favor of a place-based approach to regional policy. Izsak and Radosevic (2017) analysed the EU28 in 2006–2013, concluding that R&D policies have strengthened the divergence between the Northwest and the South. It should be also remarked that evaluation of the recent mission-oriented innovation policy in EU in convergence terms will be interesting in the future. Thus, despite the enormous complexity of the drivers of regional economic growth, innovation included, the analysis of clusters or club convergence in innovation and the potential objective of expanding innovation around all jurisdictions have a prominent value in policy terms.
Therefore, in an empirical framework, the club convergence hypothesis, rather than a full convergence, is more plausible in our context, with regions characterized by different levels of innovative ability and absorptive capacity, as well as different innovation models and diverse growth dynamics. Thus, the research question remains an important issue for empirical studies, beyond the theoretical aspects surrounding the study discussed above. Obtaining different clubs or clusters of territories seems clearly more feasible than a single steady-state. Thus, the identification of the clubs or clusters through our approach of convergence is one of the contributions of this study, as it detects patterns and areas with different innovation efforts, also enabling the determining factors of such clubs which may be useful to inform policies that want to strengthen such clubs or consider the generation of new clusters.
The convergence of R&D expenditure across territories has received little attention in the literature so far. Churchill et al. (2020) studied the convergence of R&D expenditure in OECD countries, concluding that there were differences in the dynamic prior to and after World War II. Barrios et al. (2019) analysed the convergence of innovation activity in European regions between 2002 and 2012, identifying seven convergence clubs for patents as a proxy for innovation activities. For EU countries, Blanco et al. (2020) carried out a convergence analysis of R&D through a club convergence approach, concluding that there had been a bigger clusterization in the business and higher education sectors than in overall expenditure. Altuzarra (2016) investigated the convergence of R&D intensity by means of fractional integration strategy, observing different speeds of convergence among sectors. Finally, Coad (2019) studied the convergence, beta and sigma of R&D intensity among firms per sector in a world sample, pointing out that firms within the same sector do not converge to the same R&D intensity.
The aim of this paper is to analyse the convergence of R&D expenditure in the regions of Spain. We study two perspectives, regarding GDP and per capita terms, and we perform a club convergence analysis in order to determine endogenous groups of regions. As stated above, our main hypothesis is that full sample convergence is rejected and that several clubs arise, with strong effects of the Great Recession on the dynamics of R&D across Spanish regions. The results are compared with those obtained for GDP per capita. In addition, we carry out an ordered logit model to identify the drivers of the clusters.
Our paper contributes to the scarce literature on the convergence and dynamics of R&D expenditure in several ways in an empirical context by: (i) analysing an interesting case such as Spain, a highly decentralized country with relevant differences in R&D across regions, with the extremes of the islands –The Canaries and Balearics-focused on tourist activities and with R&D expenditure under 0.5%, and the richer regions of the Basque Country, Madrid, Catalonia 9 and Navarre; (ii) looking for the factors behind the clusters in contrast to previous literature on R&D convergence, which devoted its efforts solely identifying convergence clubs without investigating the factors behind those clusters; hence, we are combining the club convergence and determinants approaches; and (iii) studying whether the Great Recession has impacted on convergence patterns and, hence altered the clusters, offering an interesting view of the potential effect of the Great Recession on this process.
This paper is organized as follows: The methodology and data are described in Section 2. Section 3 contains the results from the club convergence analysis. Section 4 includes an ordered logit model to determine the factors behind the clusters. Finally, in Section 5 we will present our conclusions.
Methodology and Data
Club Convergence
In order to test for convergence in the panel of Spanish regions, we apply the methodology proposed by Phillips and Sul (2007, 2009), who developed a framework that allows us to test for the convergence hypothesis and, in the case of rejection of it, to estimate convergence clubs that group the R&D expenditure behaviour of the regions of Spain. Although this approach is related to sigma convergence analysis in the sense that it tests for the decline of the indicator over time in the cross-sectional dispersion, the Phillips and Sul proposal has the characteristic of being based on a panel data model with both common and individual specific components formulated as a non-linear time-varying factor model. Additionally, it does not impose any particular assumption concerning the time properties of the variables. As a result, the model represents the behaviour of economies in transition and allows for a broad variety of time paths and individual heterogeneity.
In sum, this approach is based on a nonlinear dynamic factor model with cross-region output dispersion. If output dispersion across regions disappears over time, it can be concluded that there is convergence.
Let us consider a panel data set for a variable y
it
, for i = 1, …, N and t = 1, …, T (where N and T are the number of regions −17‒ and the sample size, respectively). This variable can be decomposed as
In the case of convergence,
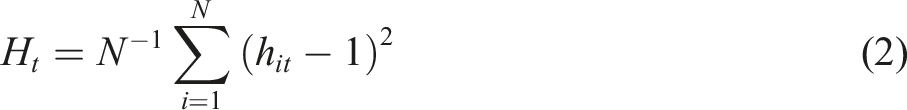
Based on these properties, Phillips and Sul (2007) propose the “log t” convergence test by estimating the following equation with a robust covariance matrix

Convergence is tested with the coefficient γ. Under the null of convergence, the least squares estimator for parameter γ converges in probability to 2α (the scaled speed of convergence), so the null of convergence can be tested through a one-sided t test of the null γ ≥ 0, which is rejected at 5% significance if
Since γ = 2α, the magnitude of γ is also of interest. This way, the procedure allows us to distinguish conditional convergence or convergence in growth rates (
Rejection of the null of convergence for the whole panel does not rule out the possibility of convergence for specific subgroups or clusters. The Phillips and Sul approach allows clubs of convergence to be identified endogenously using a four-step clustering algorithm which is based on the application of the log t regression. Simply put, the steps are: cross section ordering of the regions according to the last observation; core club formation; sieving the regions for club membership, adding one region at a time to the core group; and finally recursion and stopping rule (see Phillips and Sul 2007, 2009).
Additionally, the proposal allows us to merge clubs and the analysis of transitions between adjacent clubs. These procedures are briefly explained in Section 3.
In a second step, to explore the factors behind the formation of the clubs, and bearing in mind that the dependent variable is discretely ordered, we employ an ordered logit model (Mckelvey and Zavoina 1975).
Data
The available data for R&D expenditure across Spanish regions includes total expenditure and, with a shorter time period, expenditure by source of execution or financing, including the public sector, higher education and business and enterprise. Due to the availability of the data, in this paper we consider total expenditure with two approaches: by percentage of GDP and in per capita terms.
Descriptive Statistics.
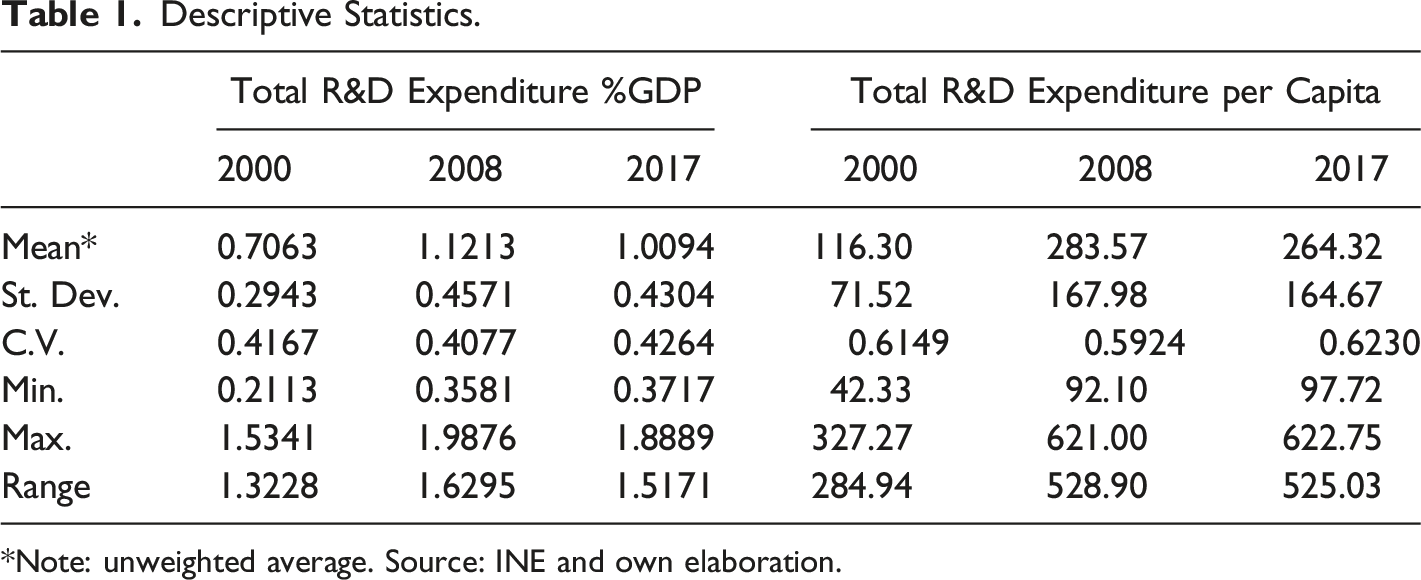
*Note: unweighted average. Source: INE and own elaboration.
Club Convergence Results
Club Convergence for R&D Expenditure
Club convergence results - R&D Expenditure, 2000-2017.
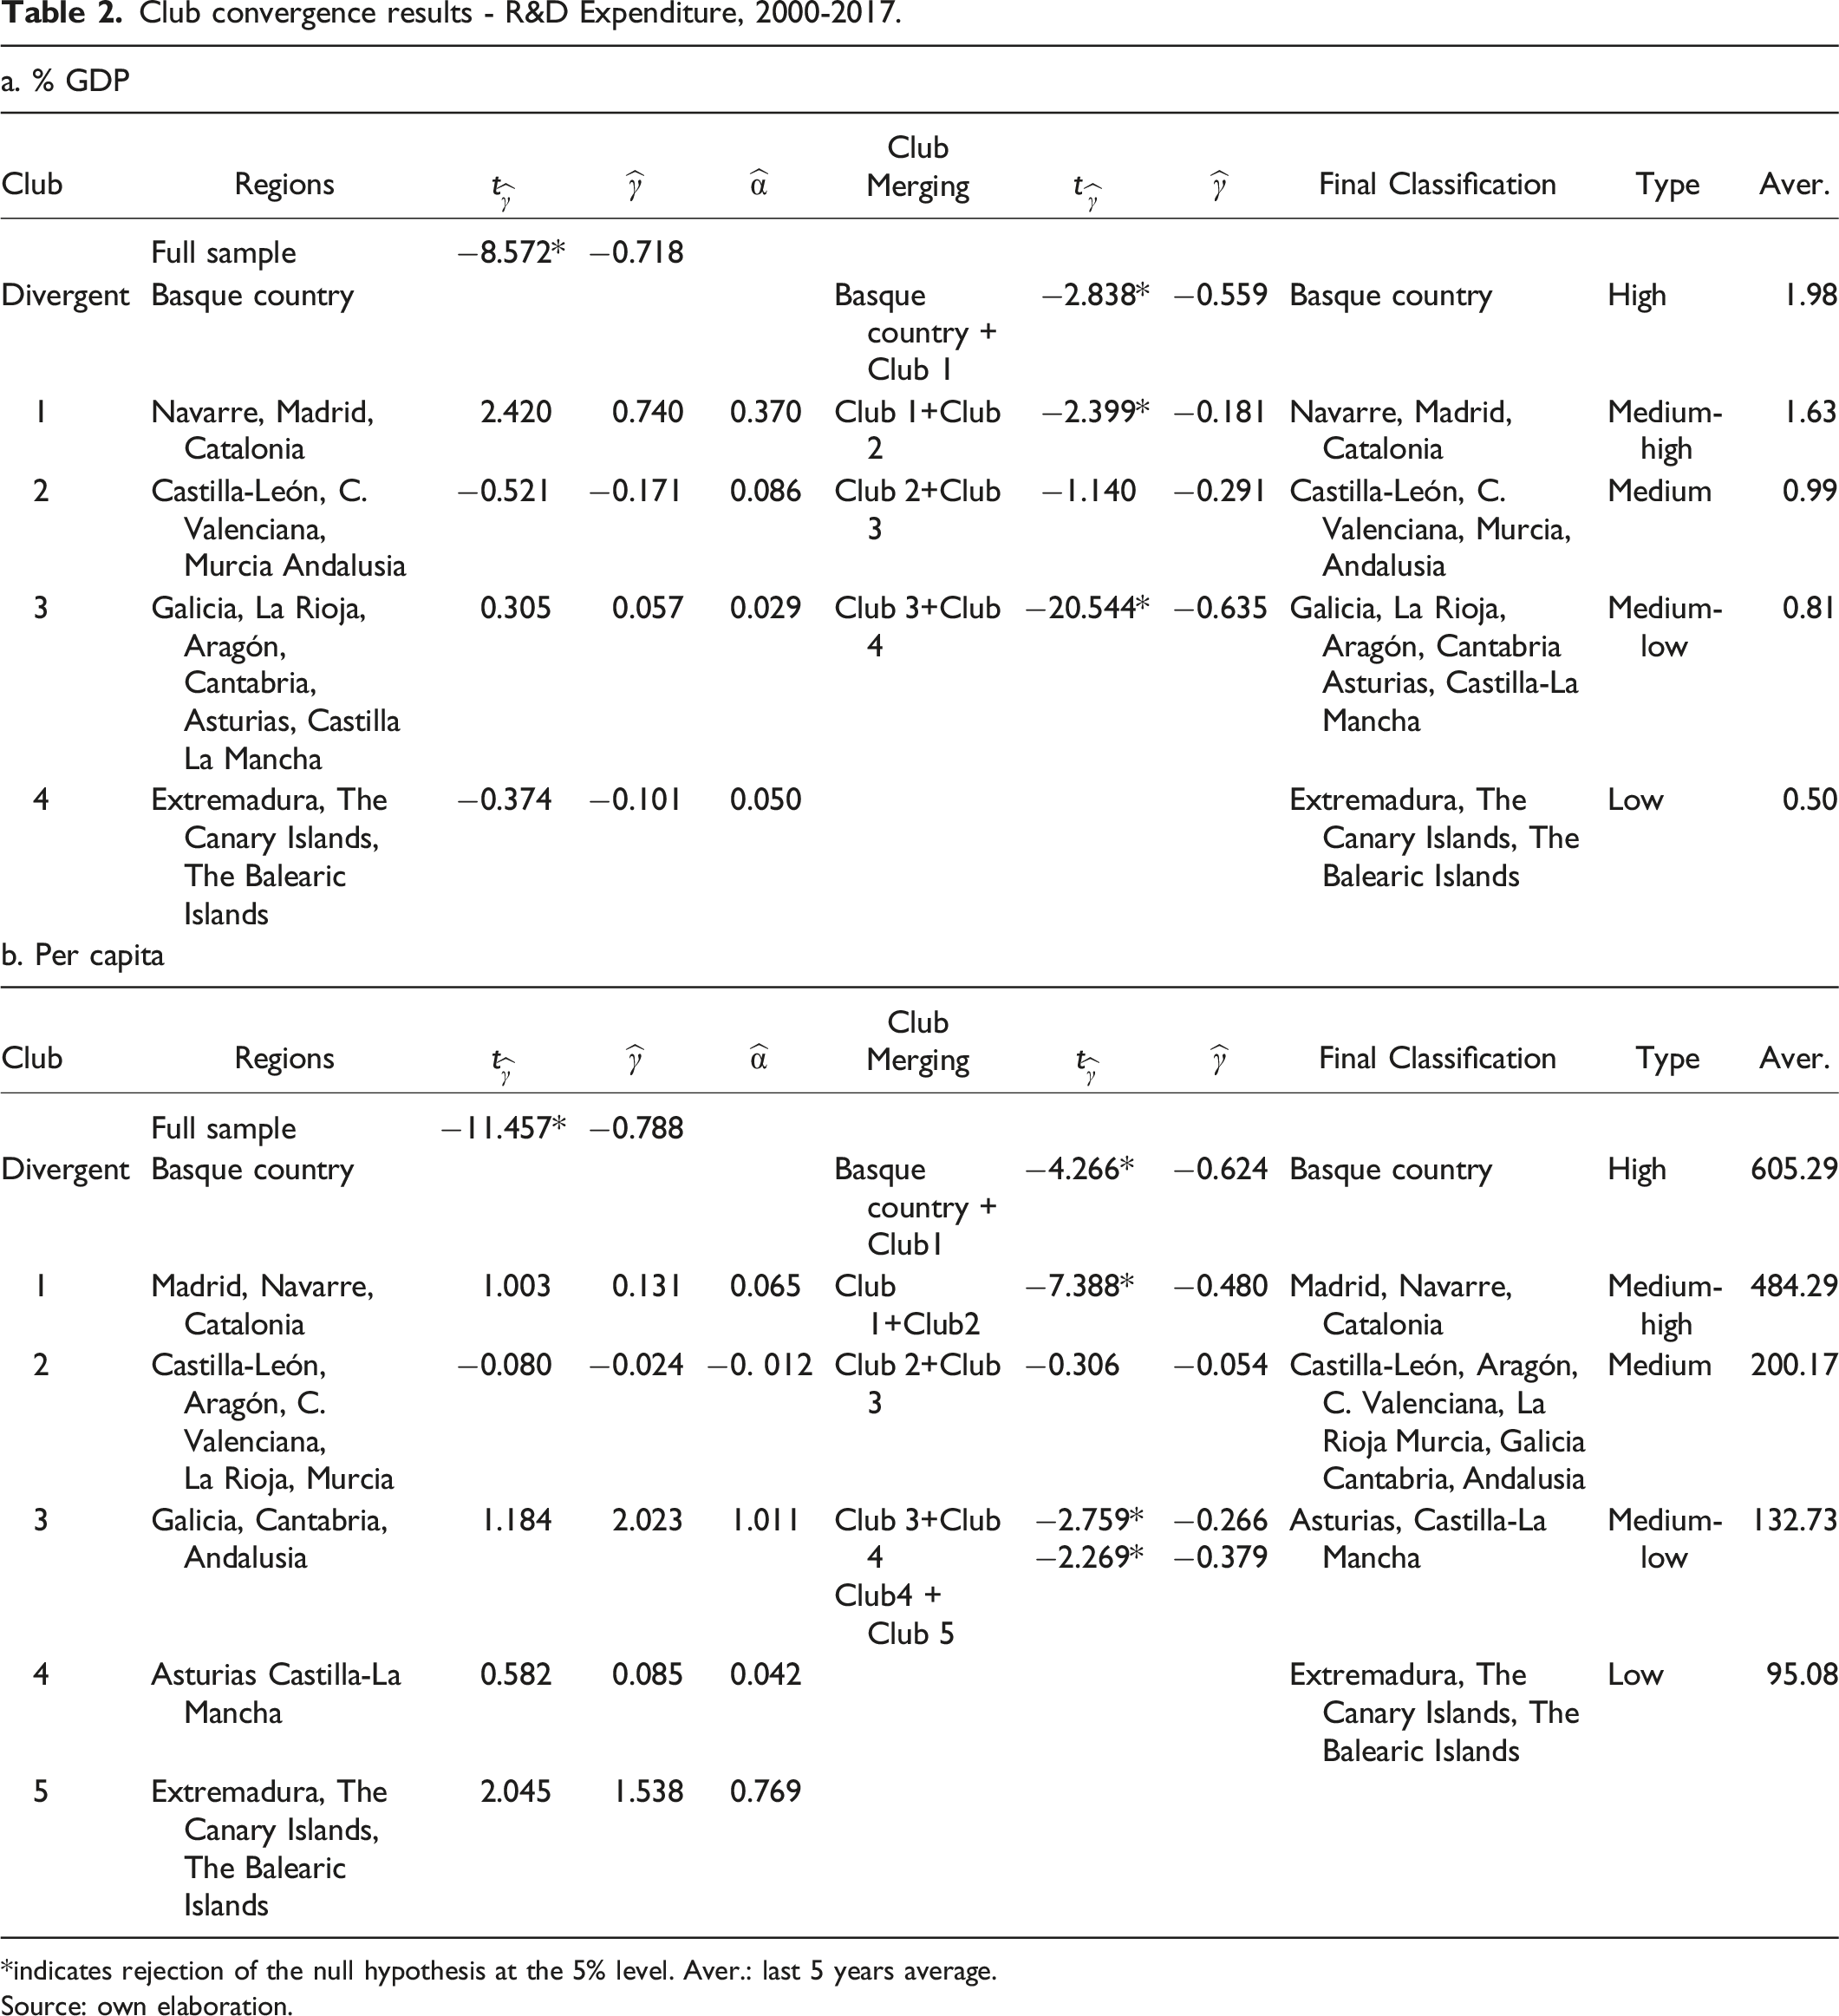
*indicates rejection of the null hypothesis at the 5% level. Aver.: last 5 years average.
Source: own elaboration.
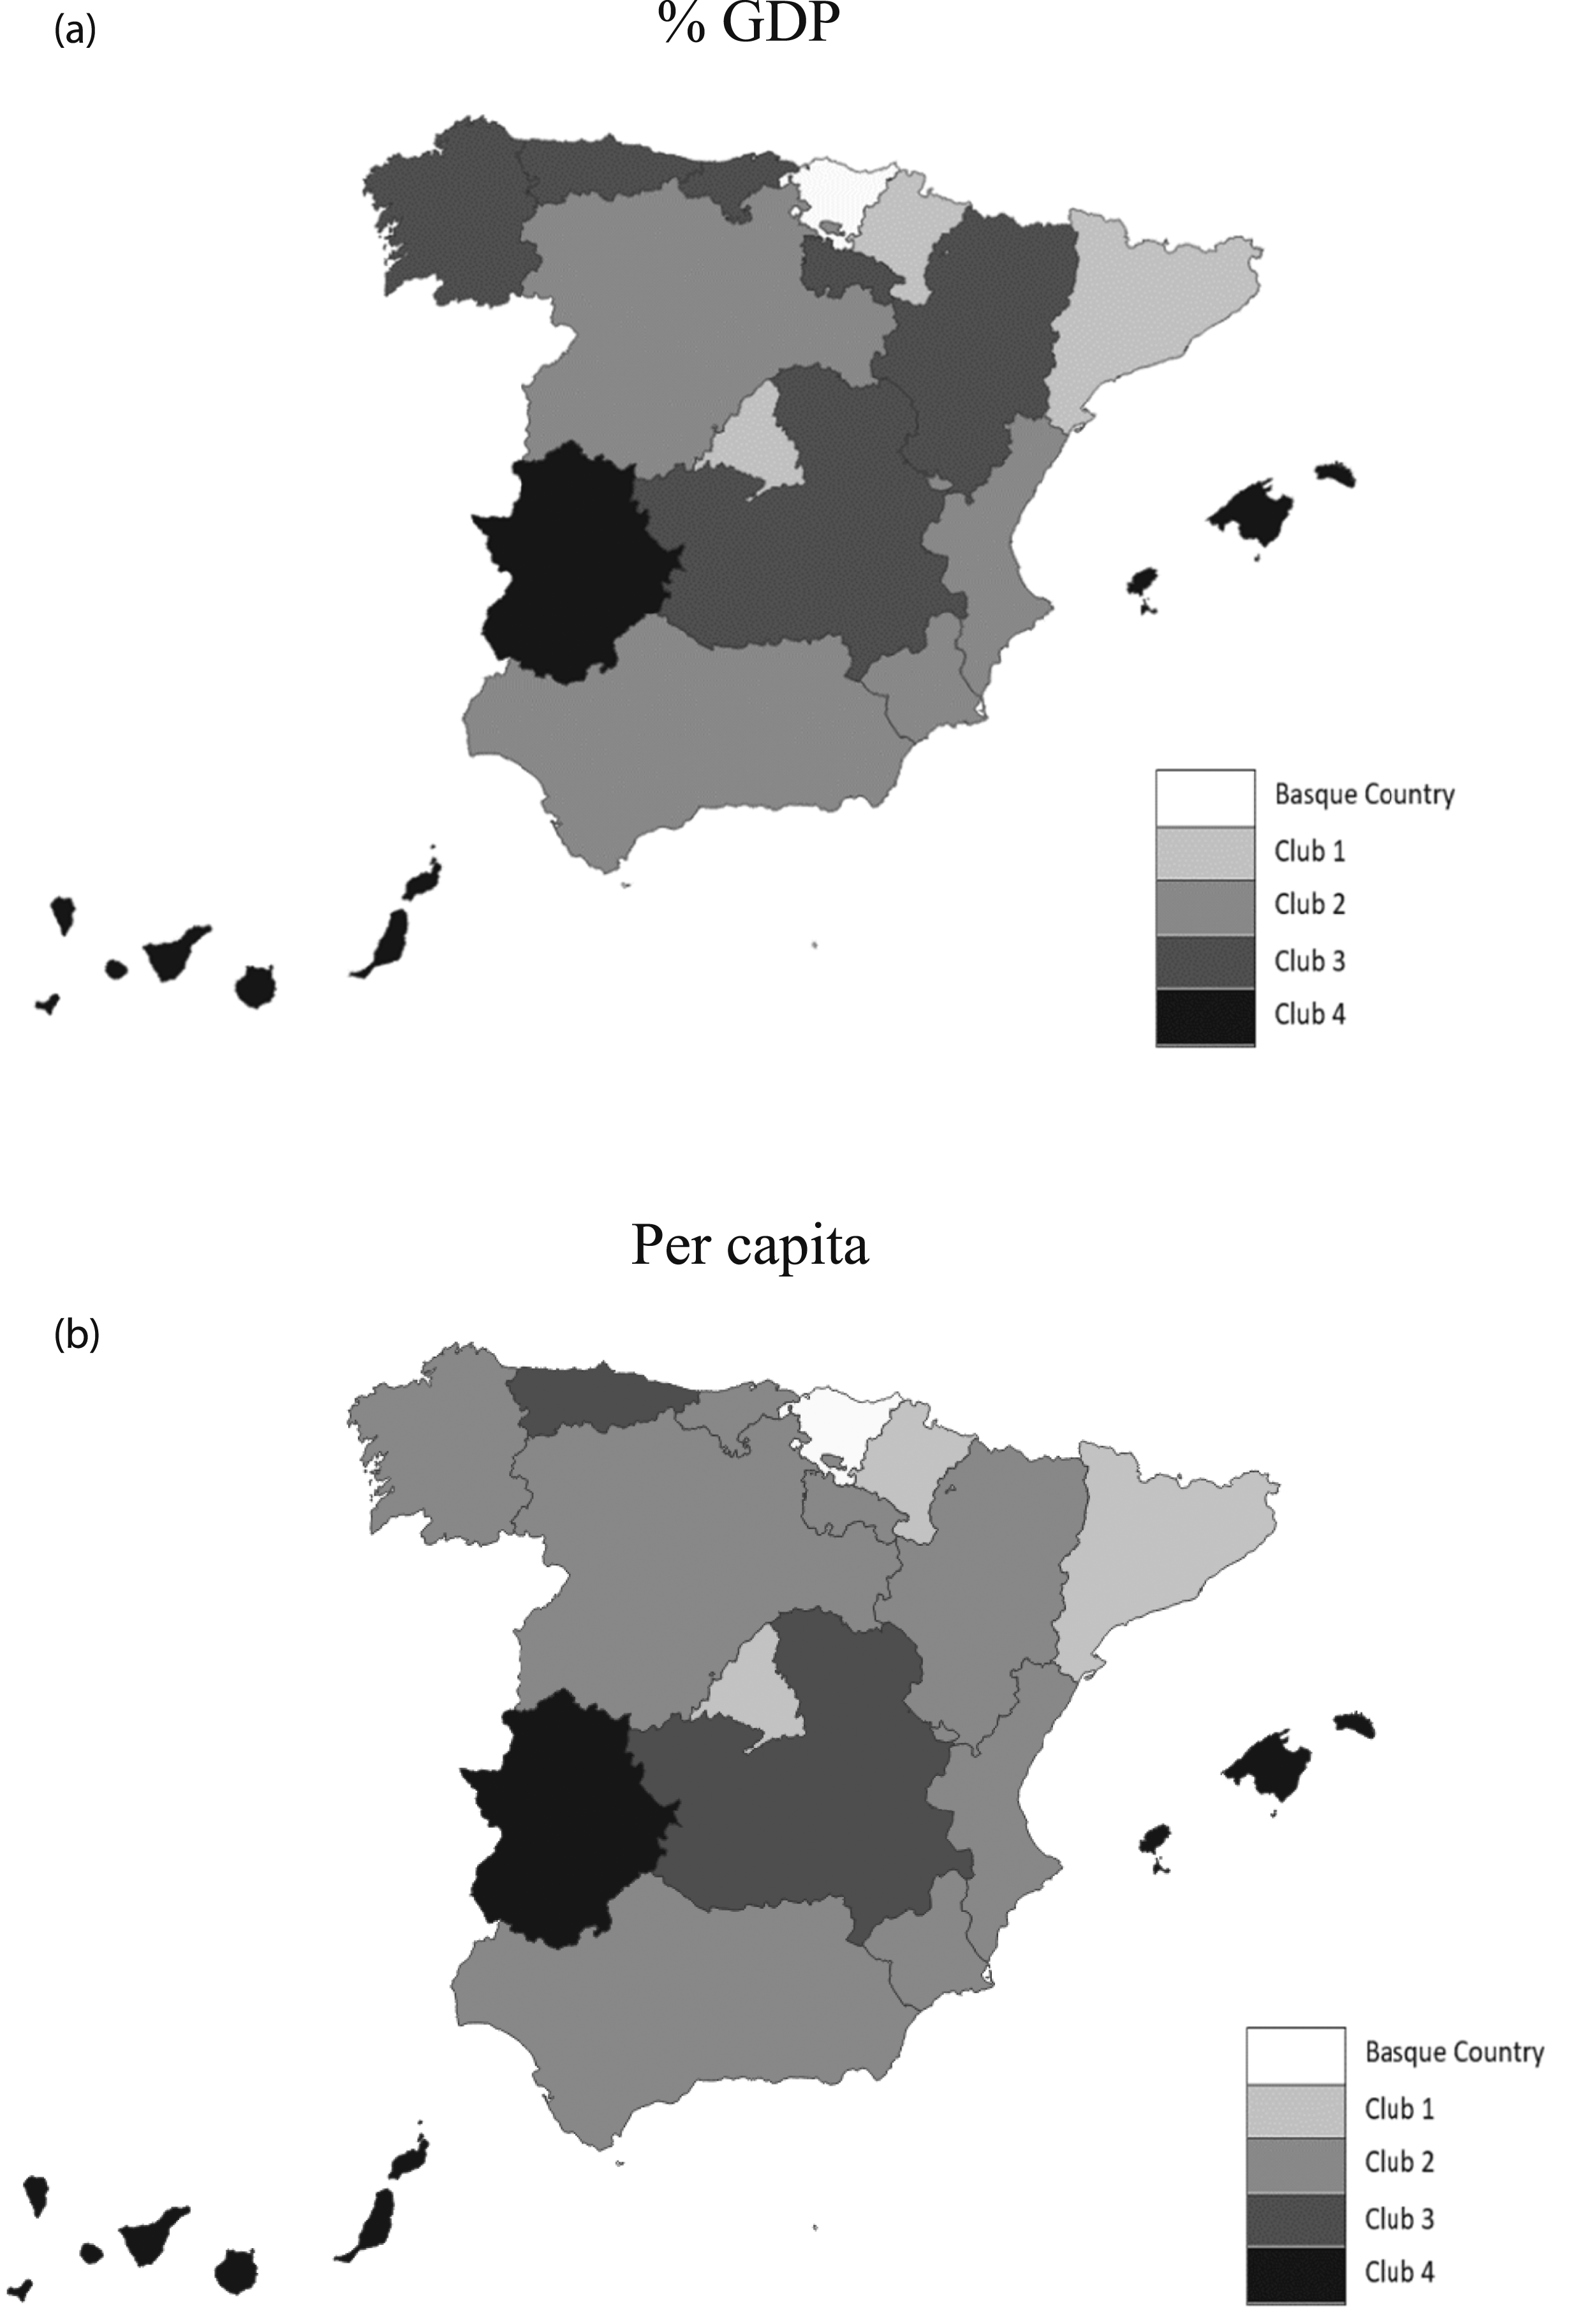
Club convergence results - research and development expenditure, 2000-2017. a. % GDP. b. Per capita. Source: own elaboration
The initial algorithm tends to over-estimate the number of clubs, so Phillips and Sul (2009) propose merging the starting groups into larger clubs by using the log t convergence test. Results after merging appear in the last columns of Table 2. In the case of percentage of GDP, Clubs 2 and 3 could have been merged, but we opted to consider each separately due to the weak convergence club (with diverging behaviour due to the negative Transition curves - research and development expenditure, 2000-2017. a. % GDP. b. Per capita. Source: own elaboration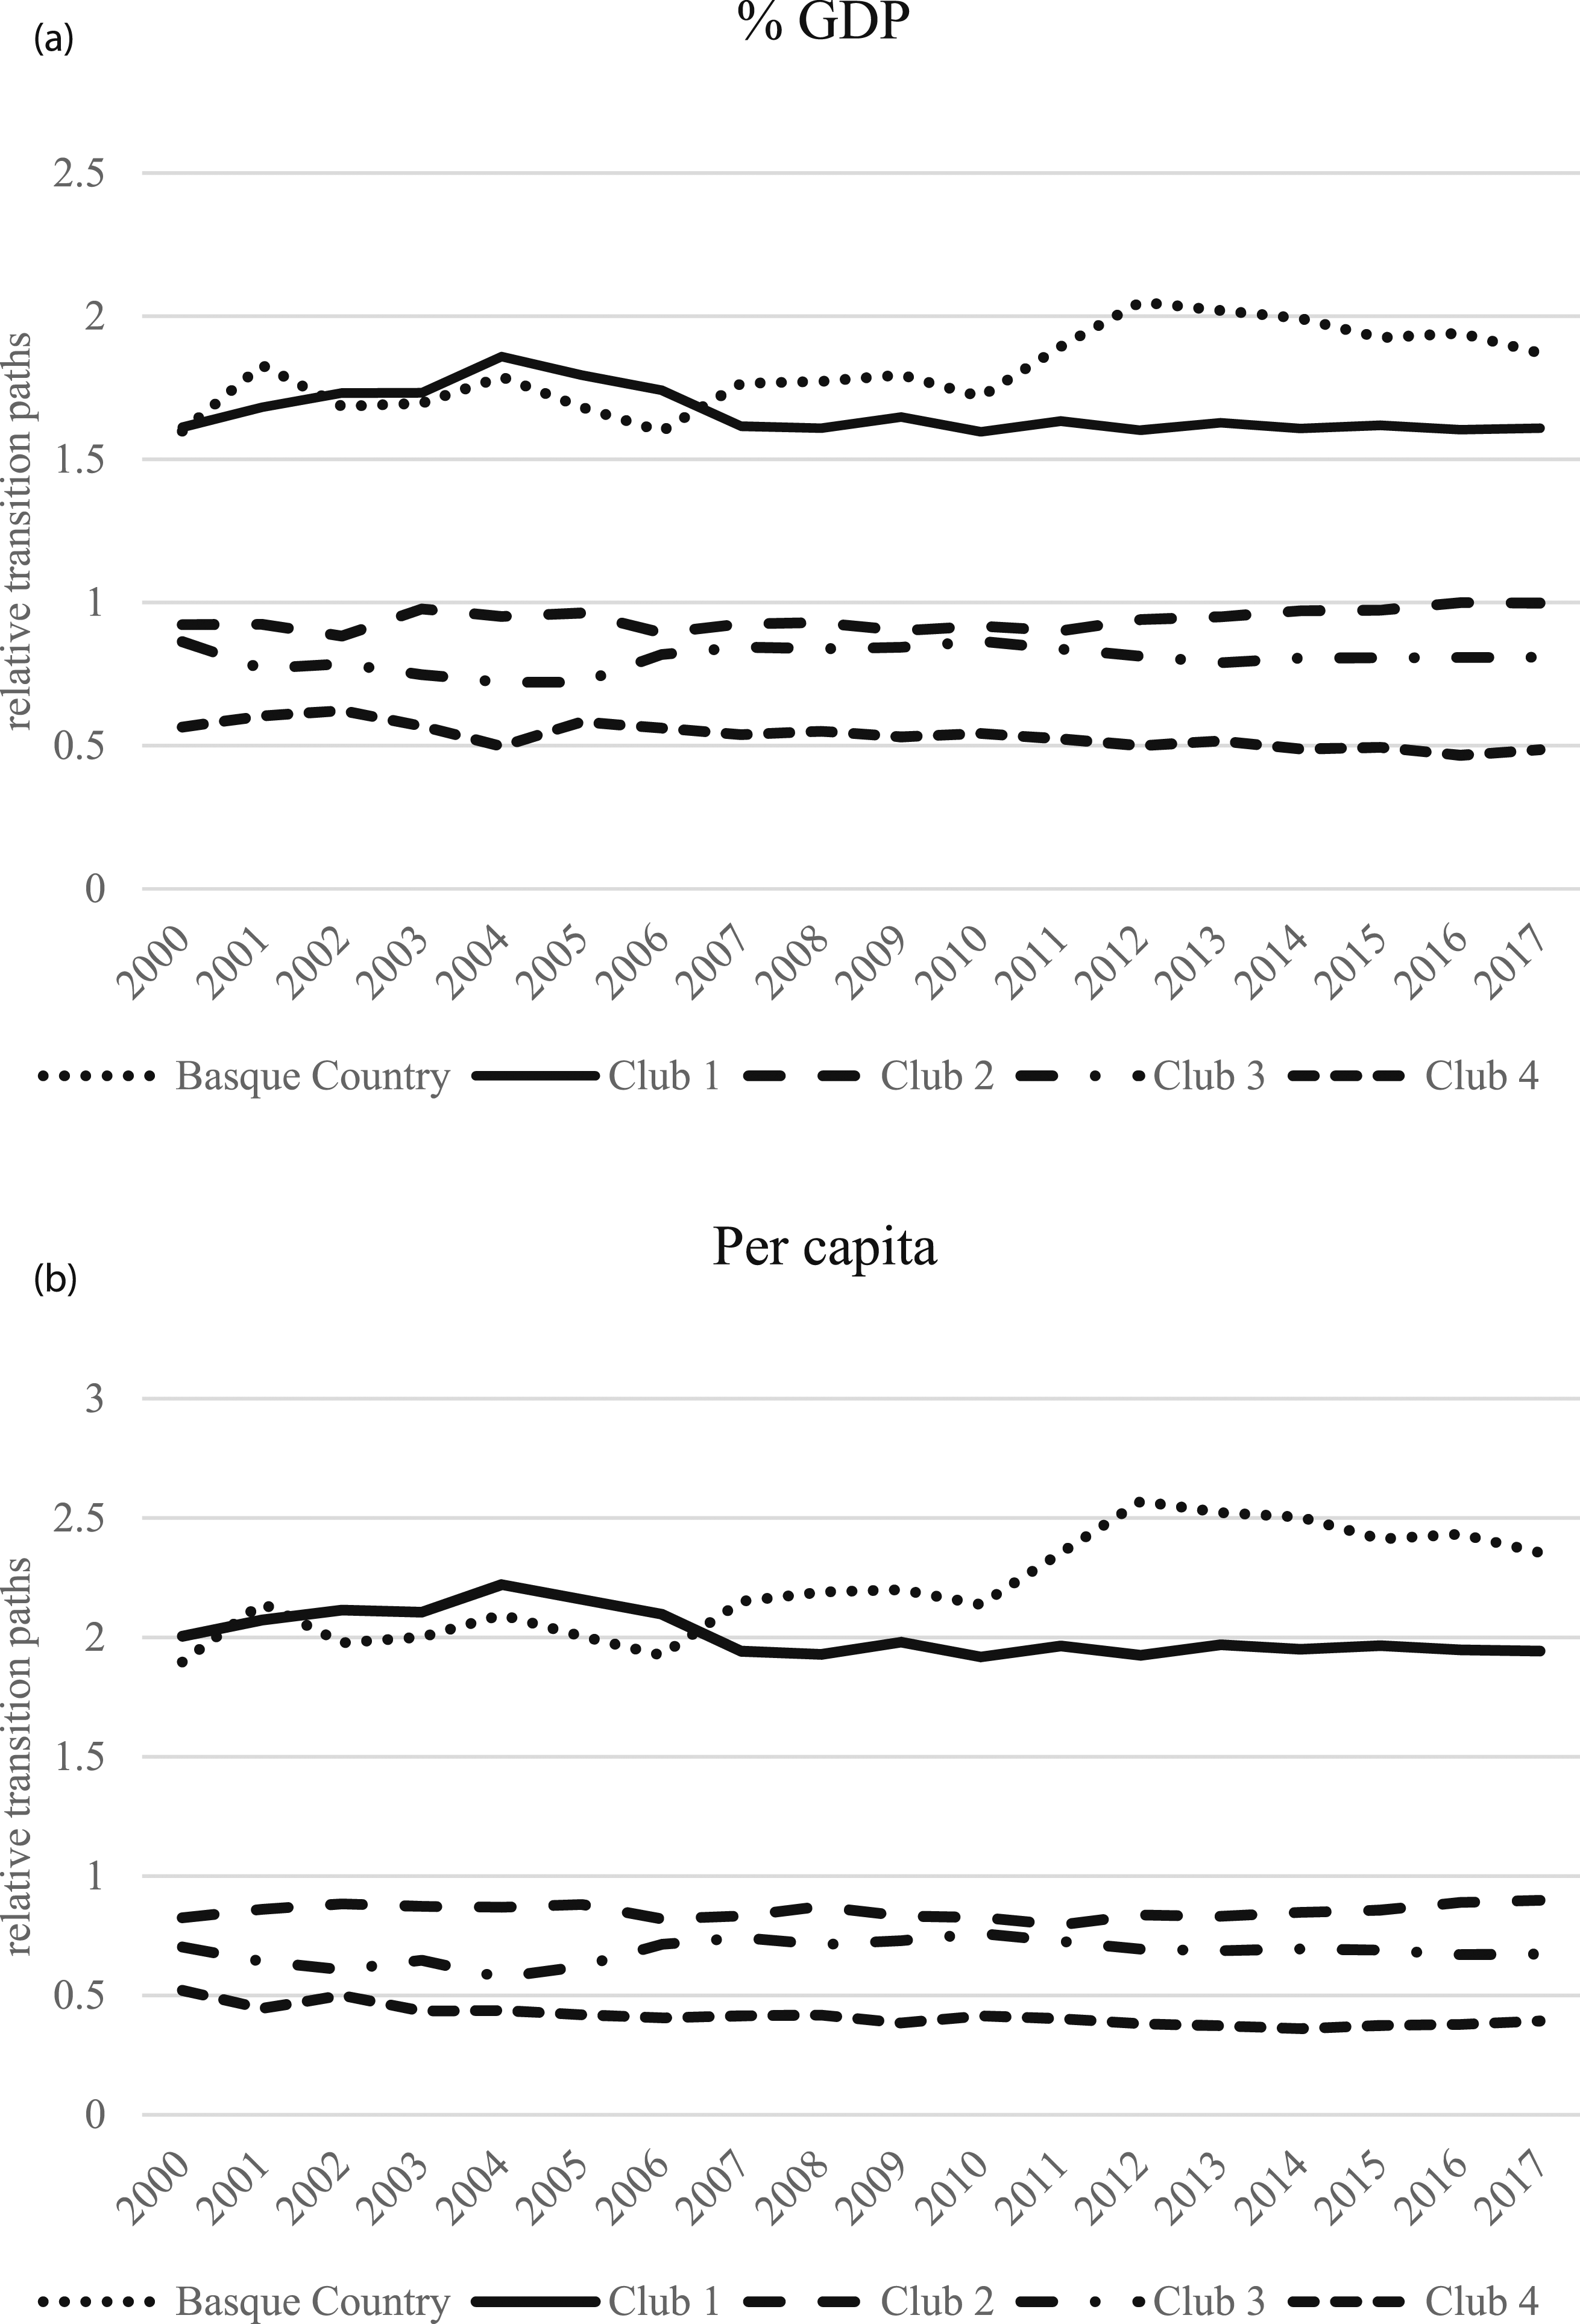
Although there are similarities between both perspectives (percentage of GDP and in per capita terms), namely in the formation of the four clubs, 13 the fact that the Basque Country is divergent from the remaining regions, and that Club 1 and Club 4 are formed by the same regions (Navarre, Madrid and Catalonia; and Extremadura, the Canaries and the Balearic Islands, respectively), we can also observe differences between them. Club 2 is more numerous in the per capita perspective. At any rate, the robustness of the club composition for the extreme clusters (of higher and lower expenditure) seems clear, whatever the perspective considered (% GDP or per capita). Another relevant outcome is that there is no convergence at level or in absolute terms in any of the groups obtained, but relative convergence.
Testing for Transitions Between Clubs - R&D Expenditure, 2000-2017.
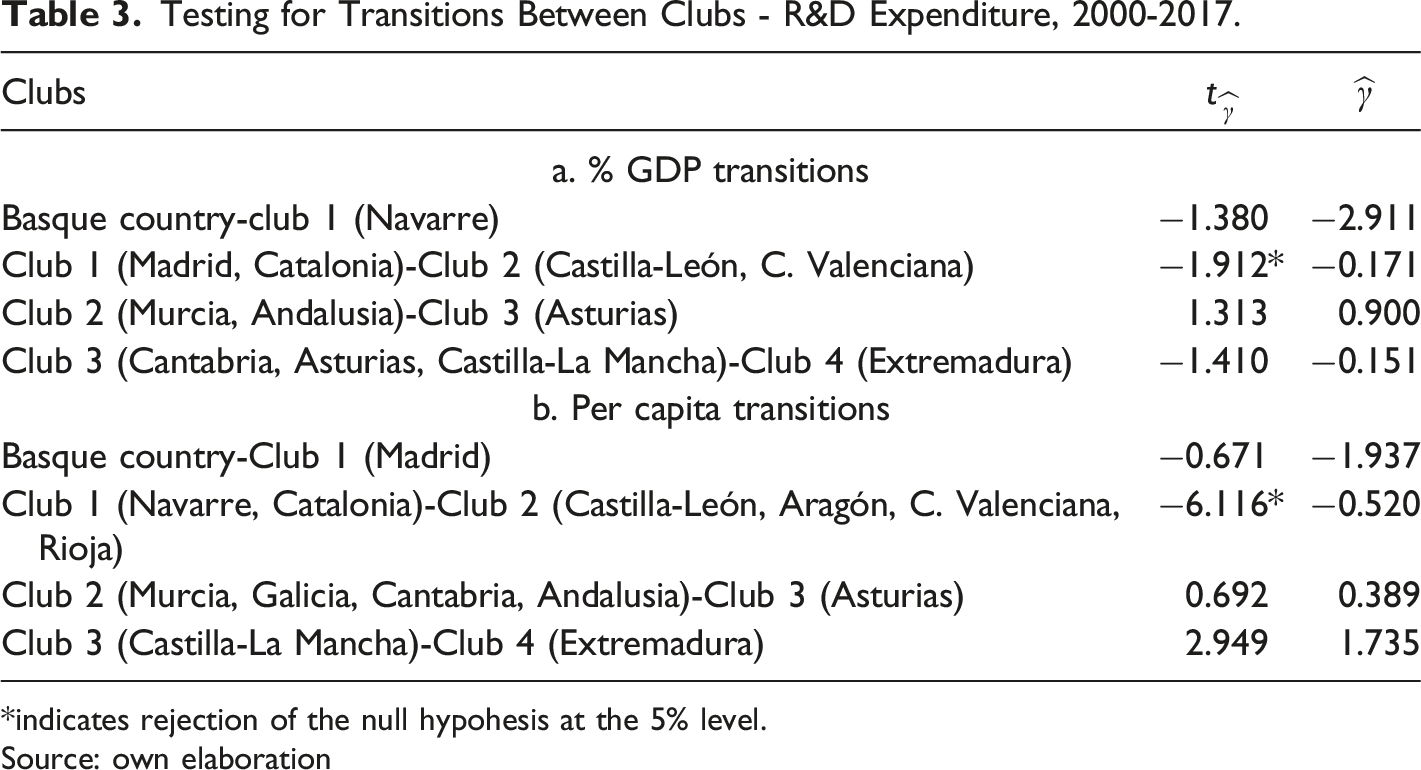
*indicates rejection of the null hypohesis at the 5% level.
Source: own elaboration
Figure 3 represents the averages from the clubs attained in the analysis. In this latter figure, we observe different patterns before and after the Great Recession.
14
For example, Club 1 presented higher average expenditure than the divergent region, the Basque Country, but after the economic crisis this region was clearly above Club 1, showing the efforts of R&D agents in the Basque Country despite the crisis, maintaining R&D expenditure at around 2% of GDP. In addition, we must also take into account the fact that the Basque Country, along with Navarre, has a different regional financing system, the so-called “foral” system, which allows them to contribute to the state to a lesser extent than other rich regions, namely Madrid and Catalonia, which are involved in the common financing system. This entails greater solidarity with poorer territories. It should also be noted that the differences between Clubs 2 and 4 expanded during the growth phase and remained wide after the Great Recession started in 2008. Average values of clubs - research and development expenditure, 2000-2017. a. % GDP. b. Per capita. Source: own elaboration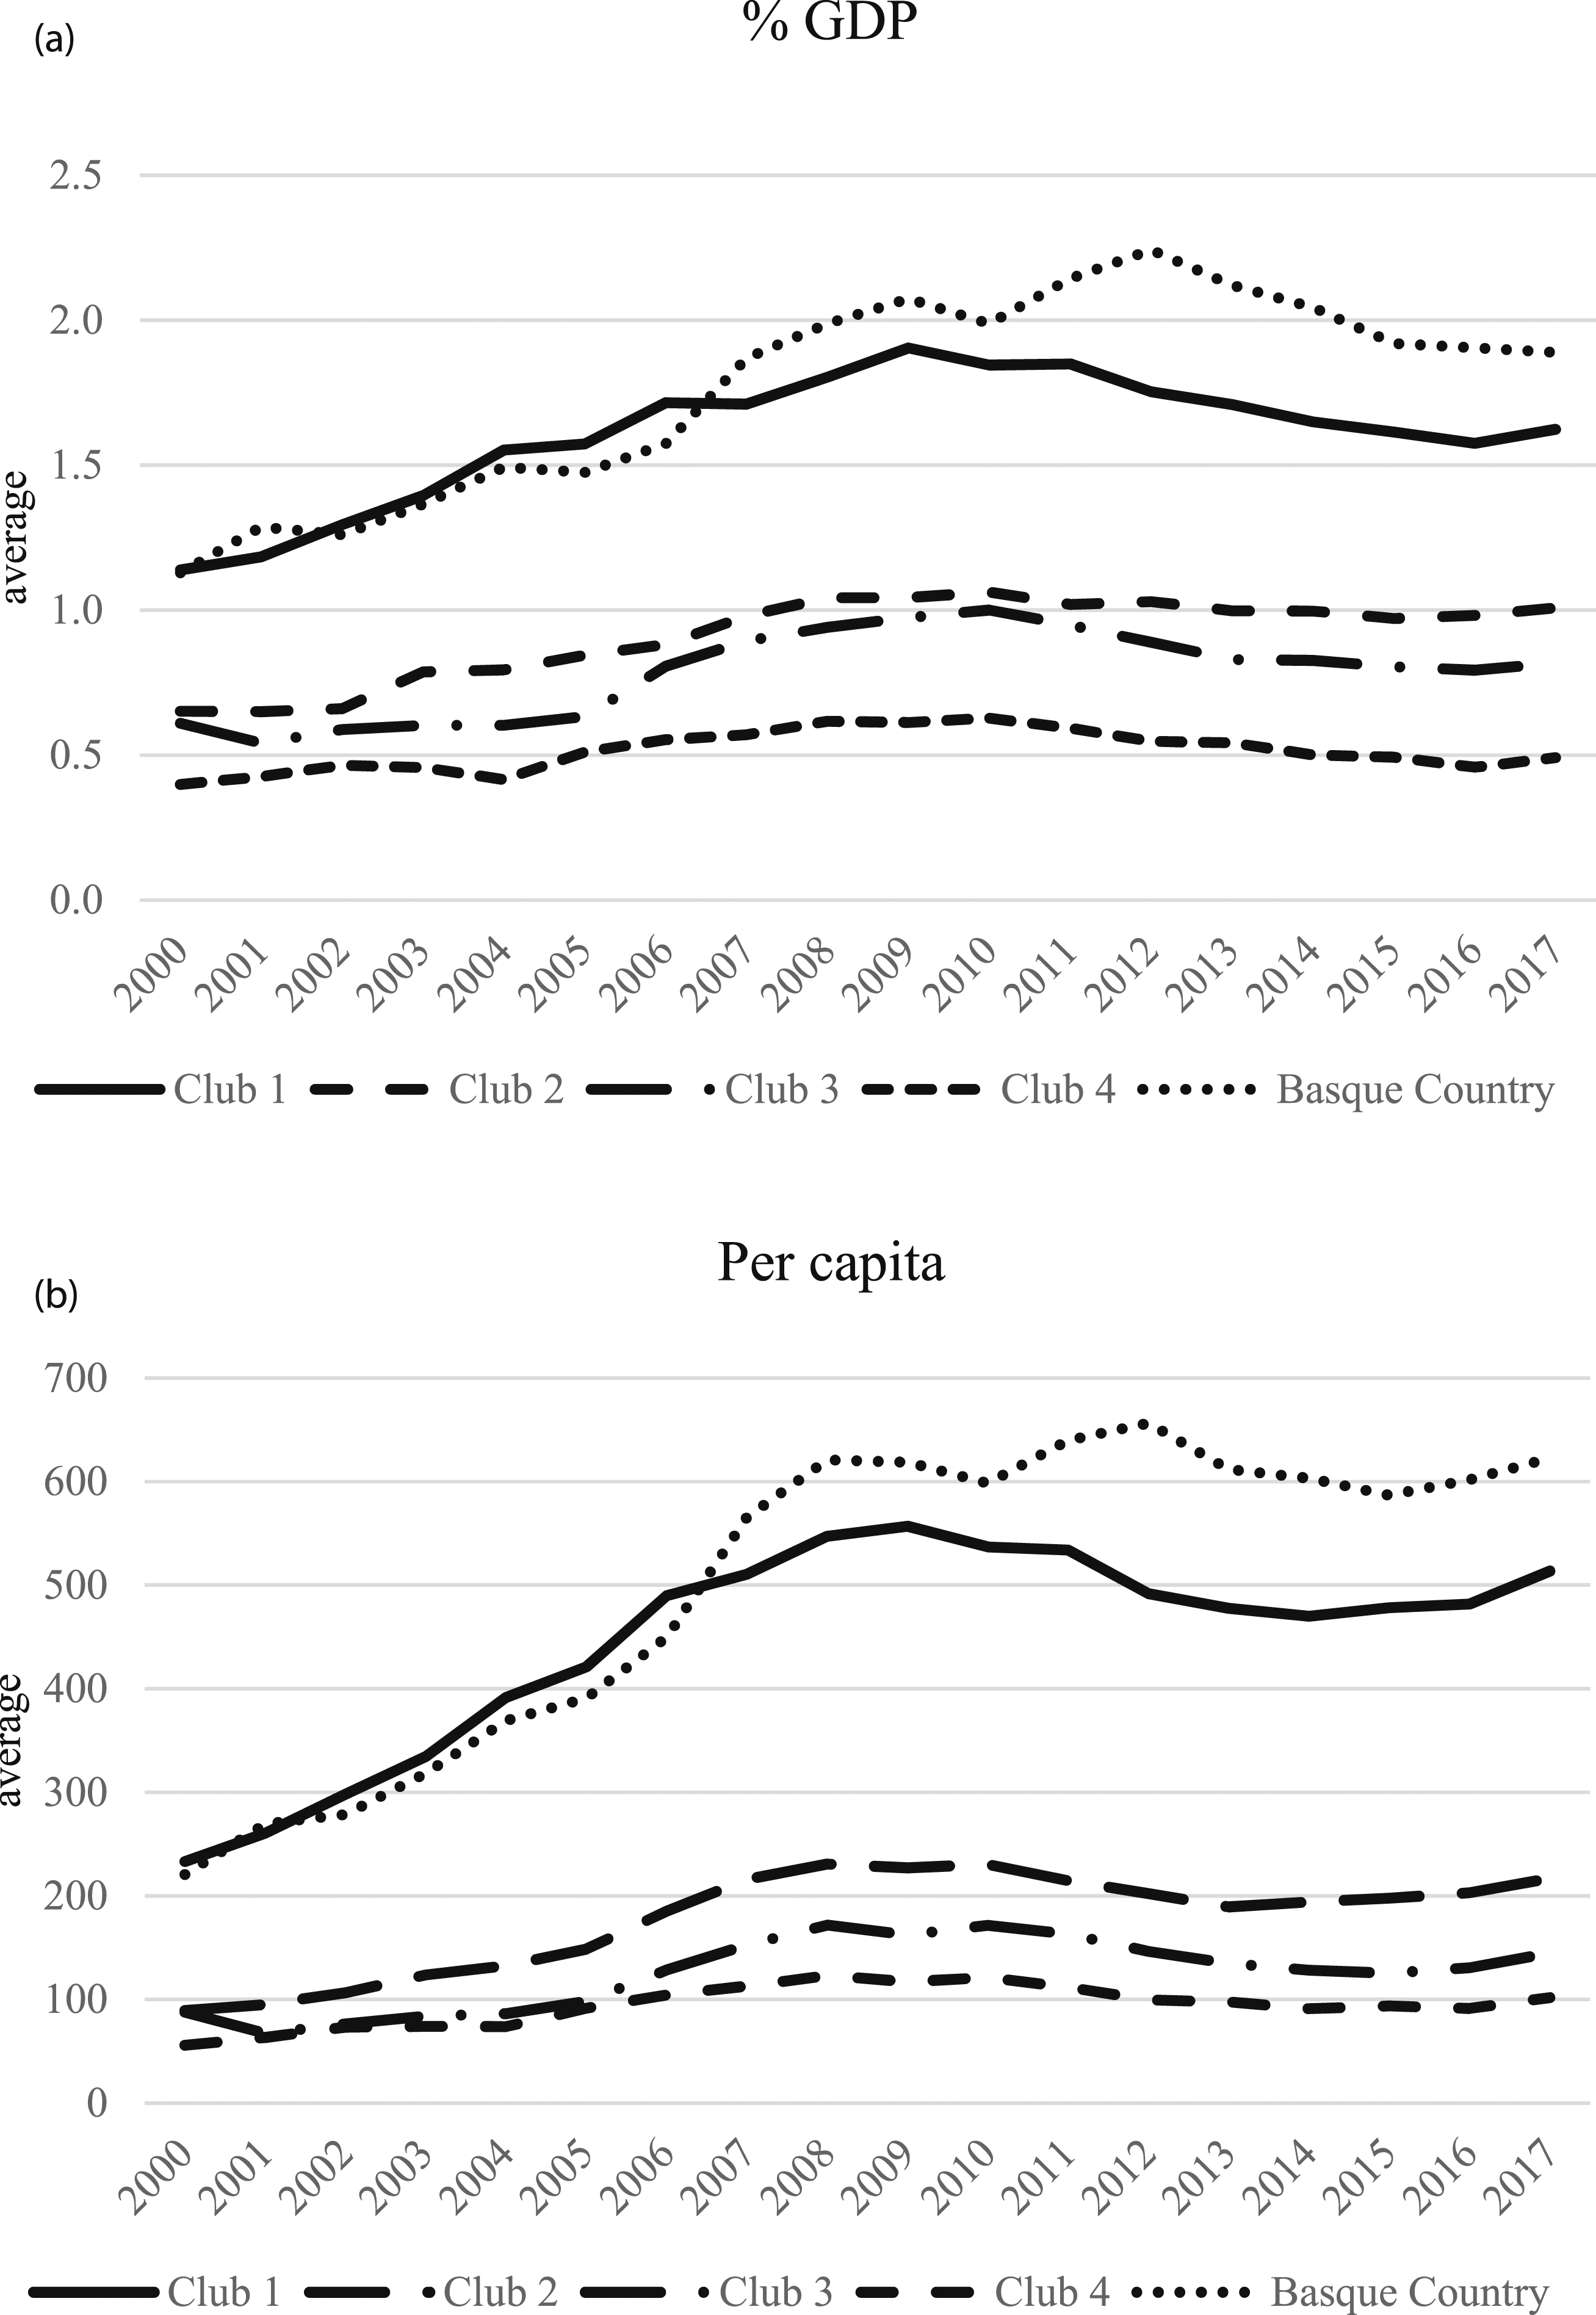
To get further insights into the dynamics of R&D expenditure convergence among the regions of Spain along time, and following Arcabic et al. (2021), we use a rolling window estimation of the log t regression. In order to analyse the robustness and sensitivity of the results we use different window sizes: 8, 10, 12 and 14 years. The initial year is 2000; so, for a window size of 8 years, the sample is rolling for the periods 2000-2007; 2001-2008 etc.
15
. Figure 4 reports the plots of the time-varying coefficients of the log t regression with both perspectives. The estimated coefficients are negative and statistically significant for all the periods under consideration, indicating a clear divergence. After a start with coefficients increasing to zero, the coefficients fall sharply, before gradually recovering in the final period.
16
This could indicate a worsening in the divergence process across time, which has been somewhat mitigated in recent years. Rolling window estimate of the log t coefficient. All regions. a. % GDP. b. Per capita. Source: own elaboration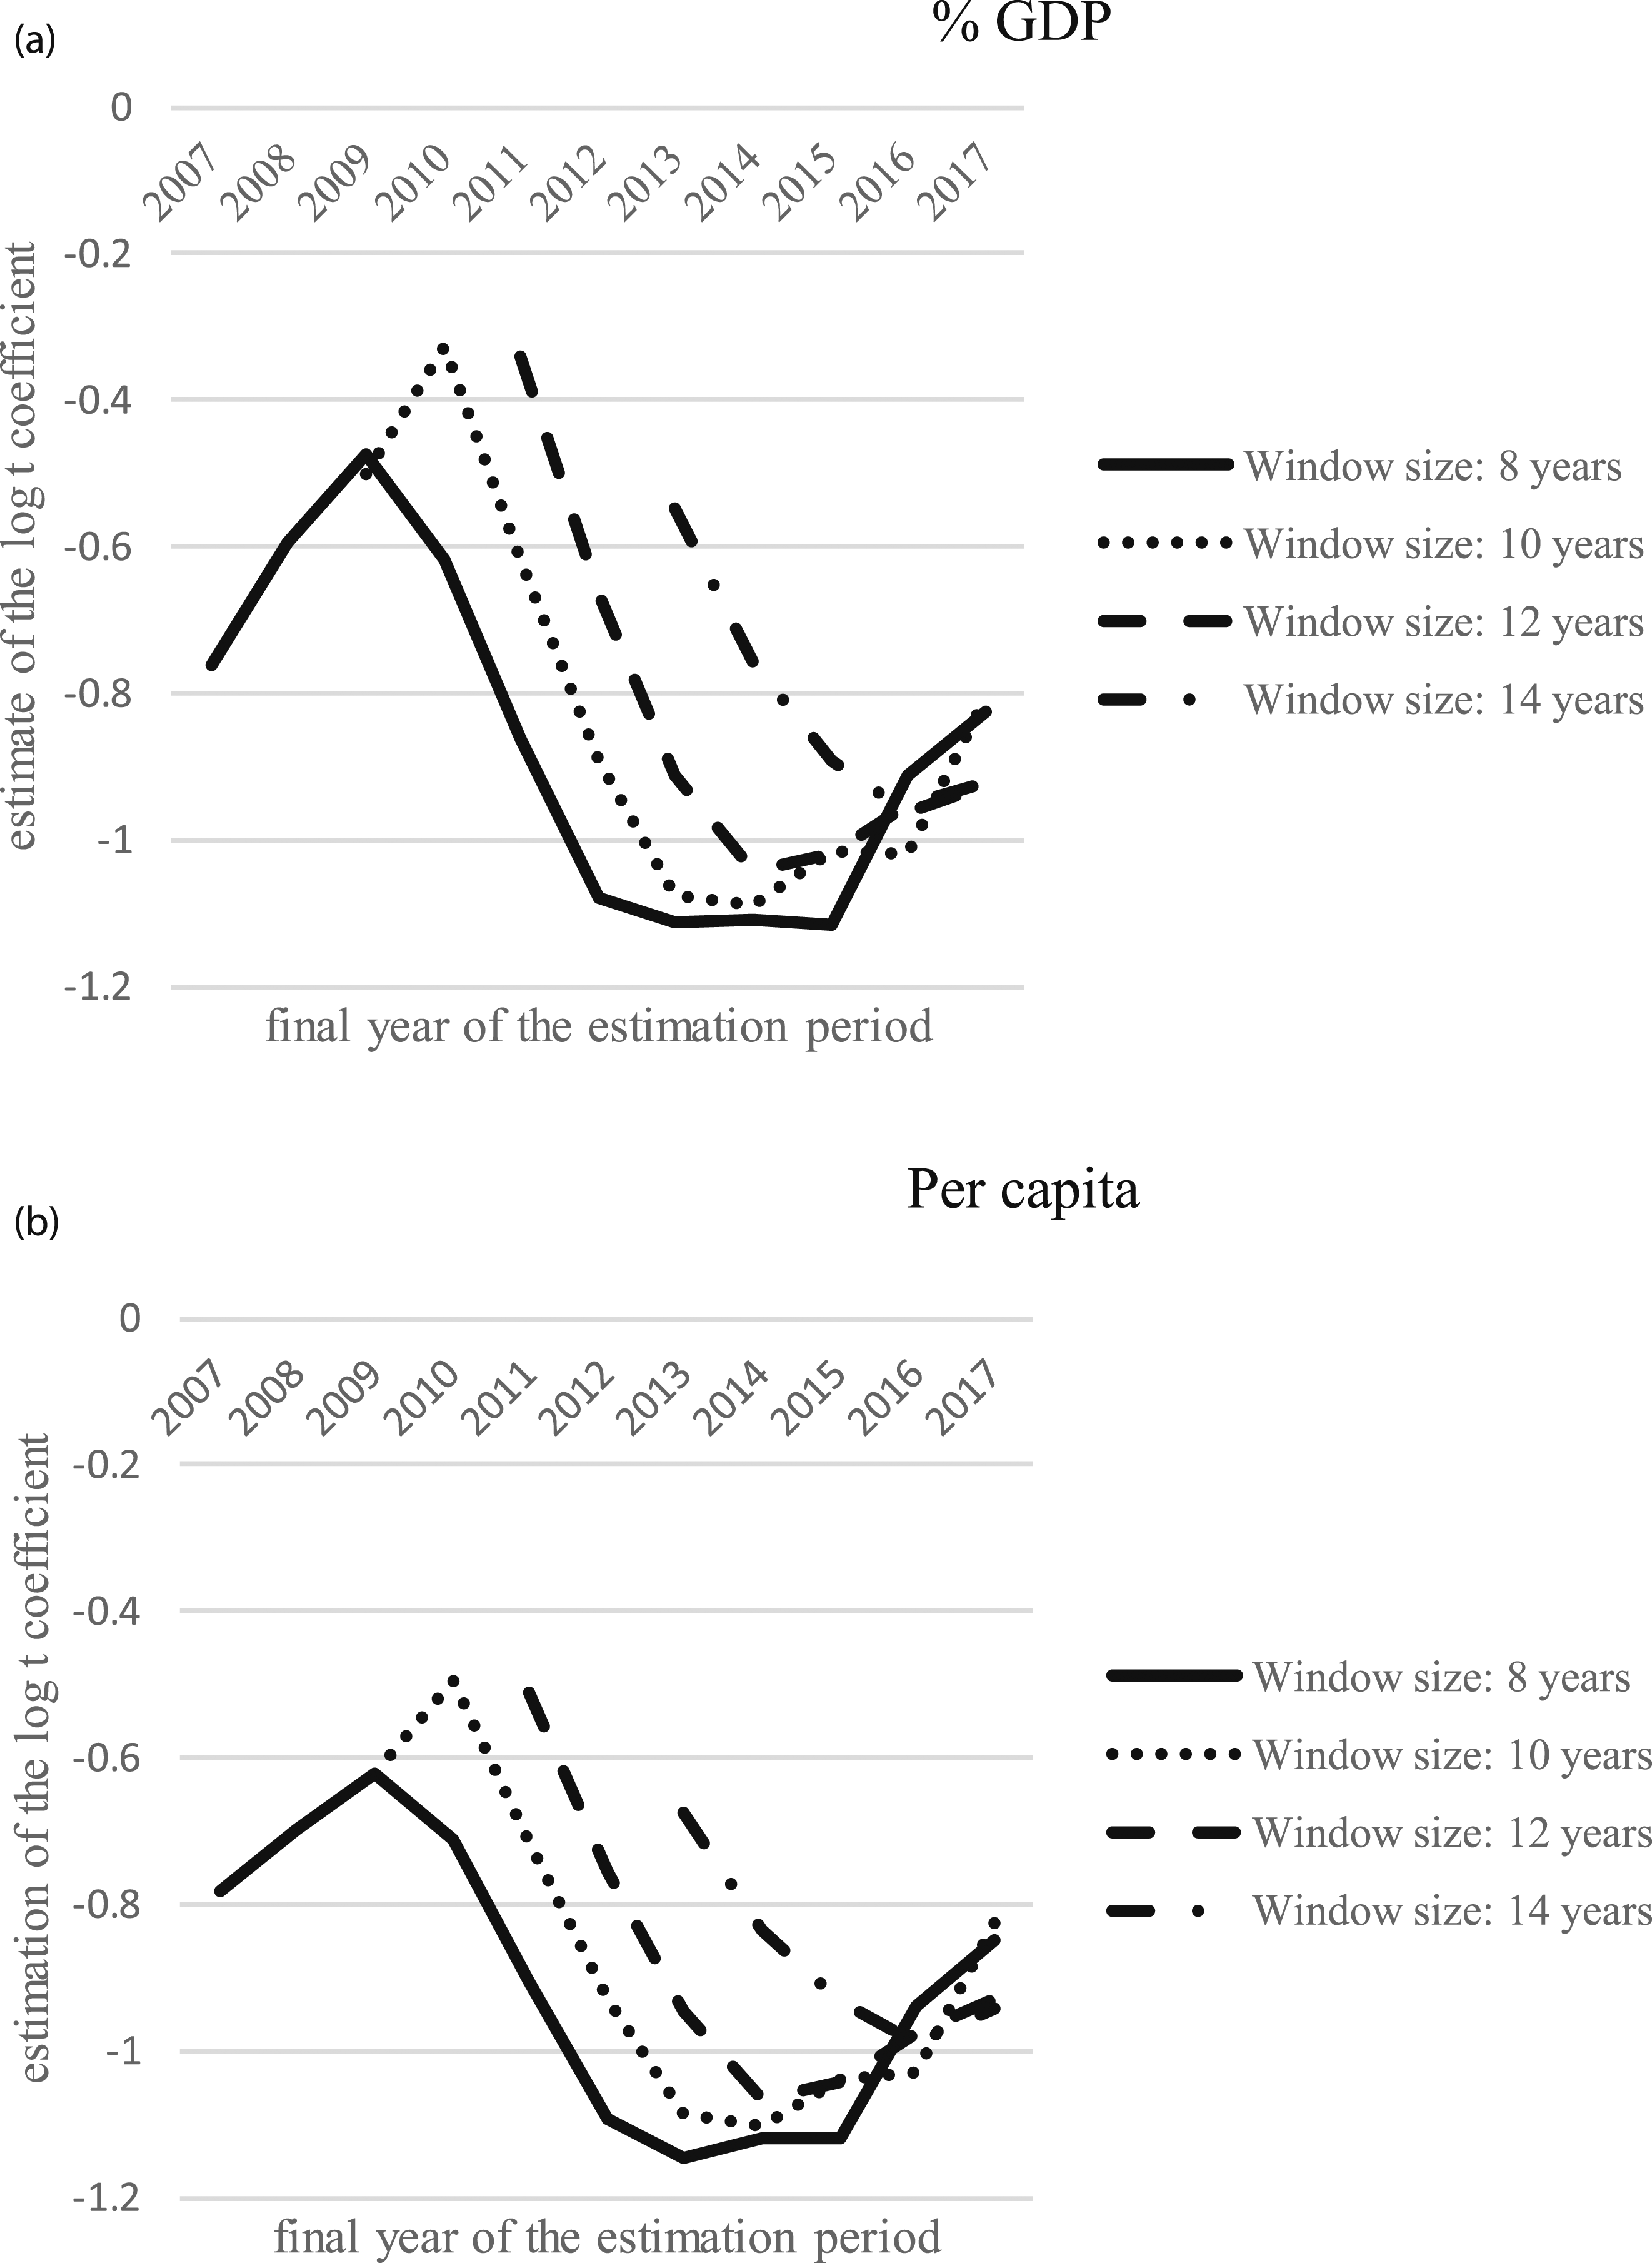
Regarding this worsening in the divergence process, a possible cause could be the Great Recession. Therefore, we now study how this crisis could alter the convergence process among the regions of Spain.
In order to analyse how the Great Recession
17
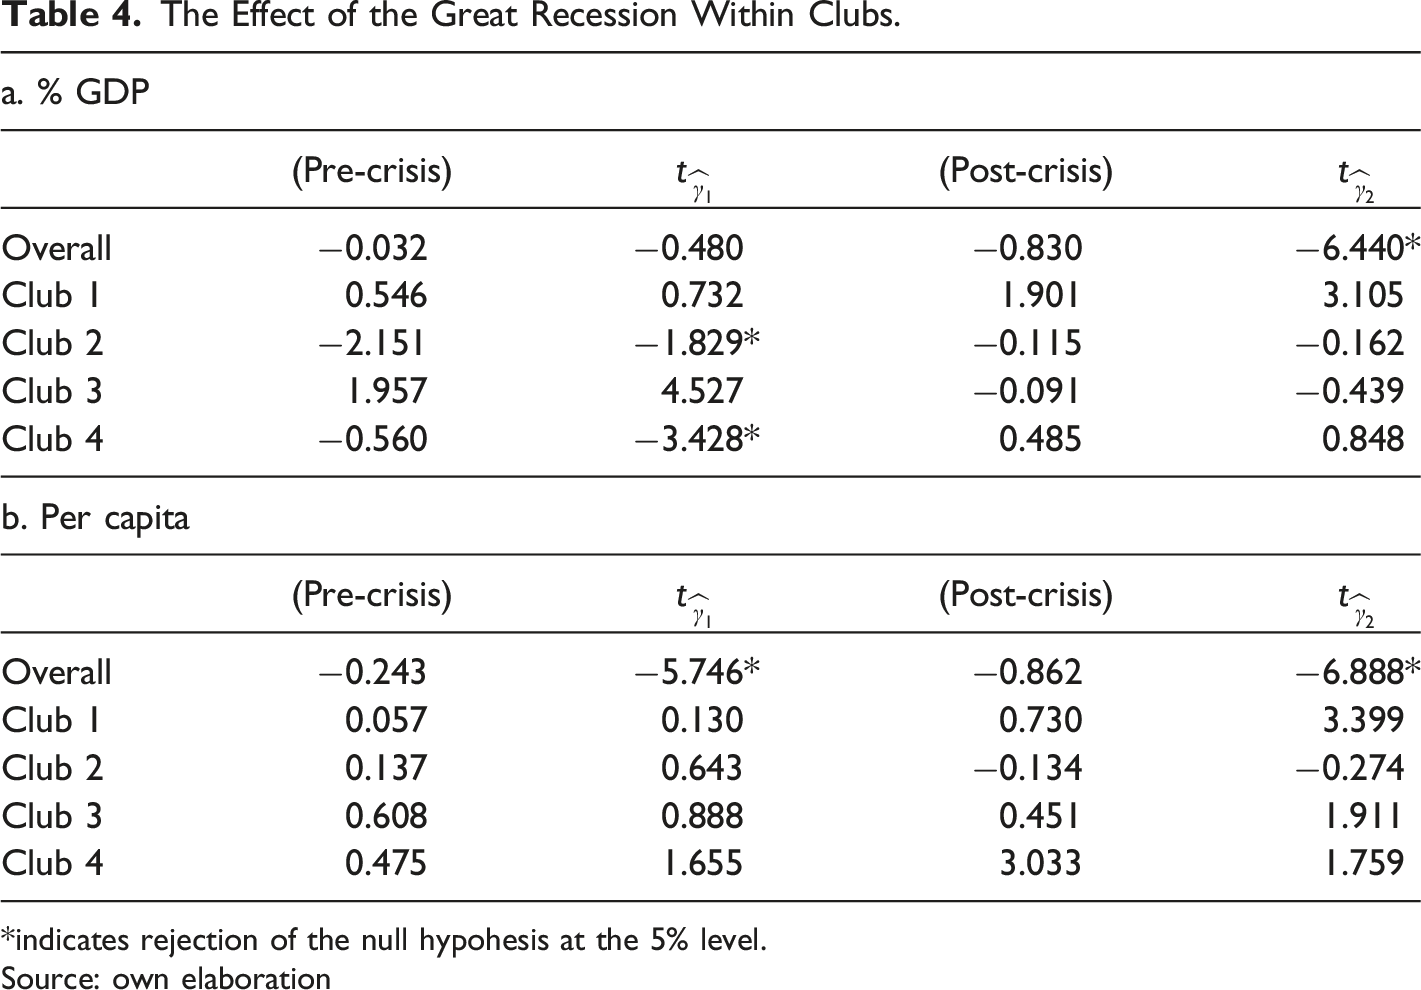
could have affected the magnitude of convergence within each club, we follow the study carried out by Mazzola and Pizzuto (2020), who investigated the impact of the Great Recession on the per capita GDP convergence process across regions and countries of Europe. Thus, we estimate an augmented version of the log t regression model in order to study how the speed of convergence has changed before and after the crisis, which took place in 2008


The Effect of the Great Recession Within Clubs.
*indicates rejection of the null hypohesis at the 5% level.
Source: own elaboration
At the level of clubs, when percentage of GDP is considered, an improvement in the temporal evolution of the speed of convergence is detected in all the clubs, with the exception of Club 3. From the per capita perspective, the same behaviour is observed for the extreme clusters: Clubs 1 and 4. This conclusion is reinforced by Figure 5, which plots the time-varying coefficients of the log t regression for a window size of 10 years for the different clubs and using both perspectives: % GDP and per capita. Rolling window estimate of the log t coefficient. All the regions and clubs. a. % GDP. b. Per capita. Source: own elaboration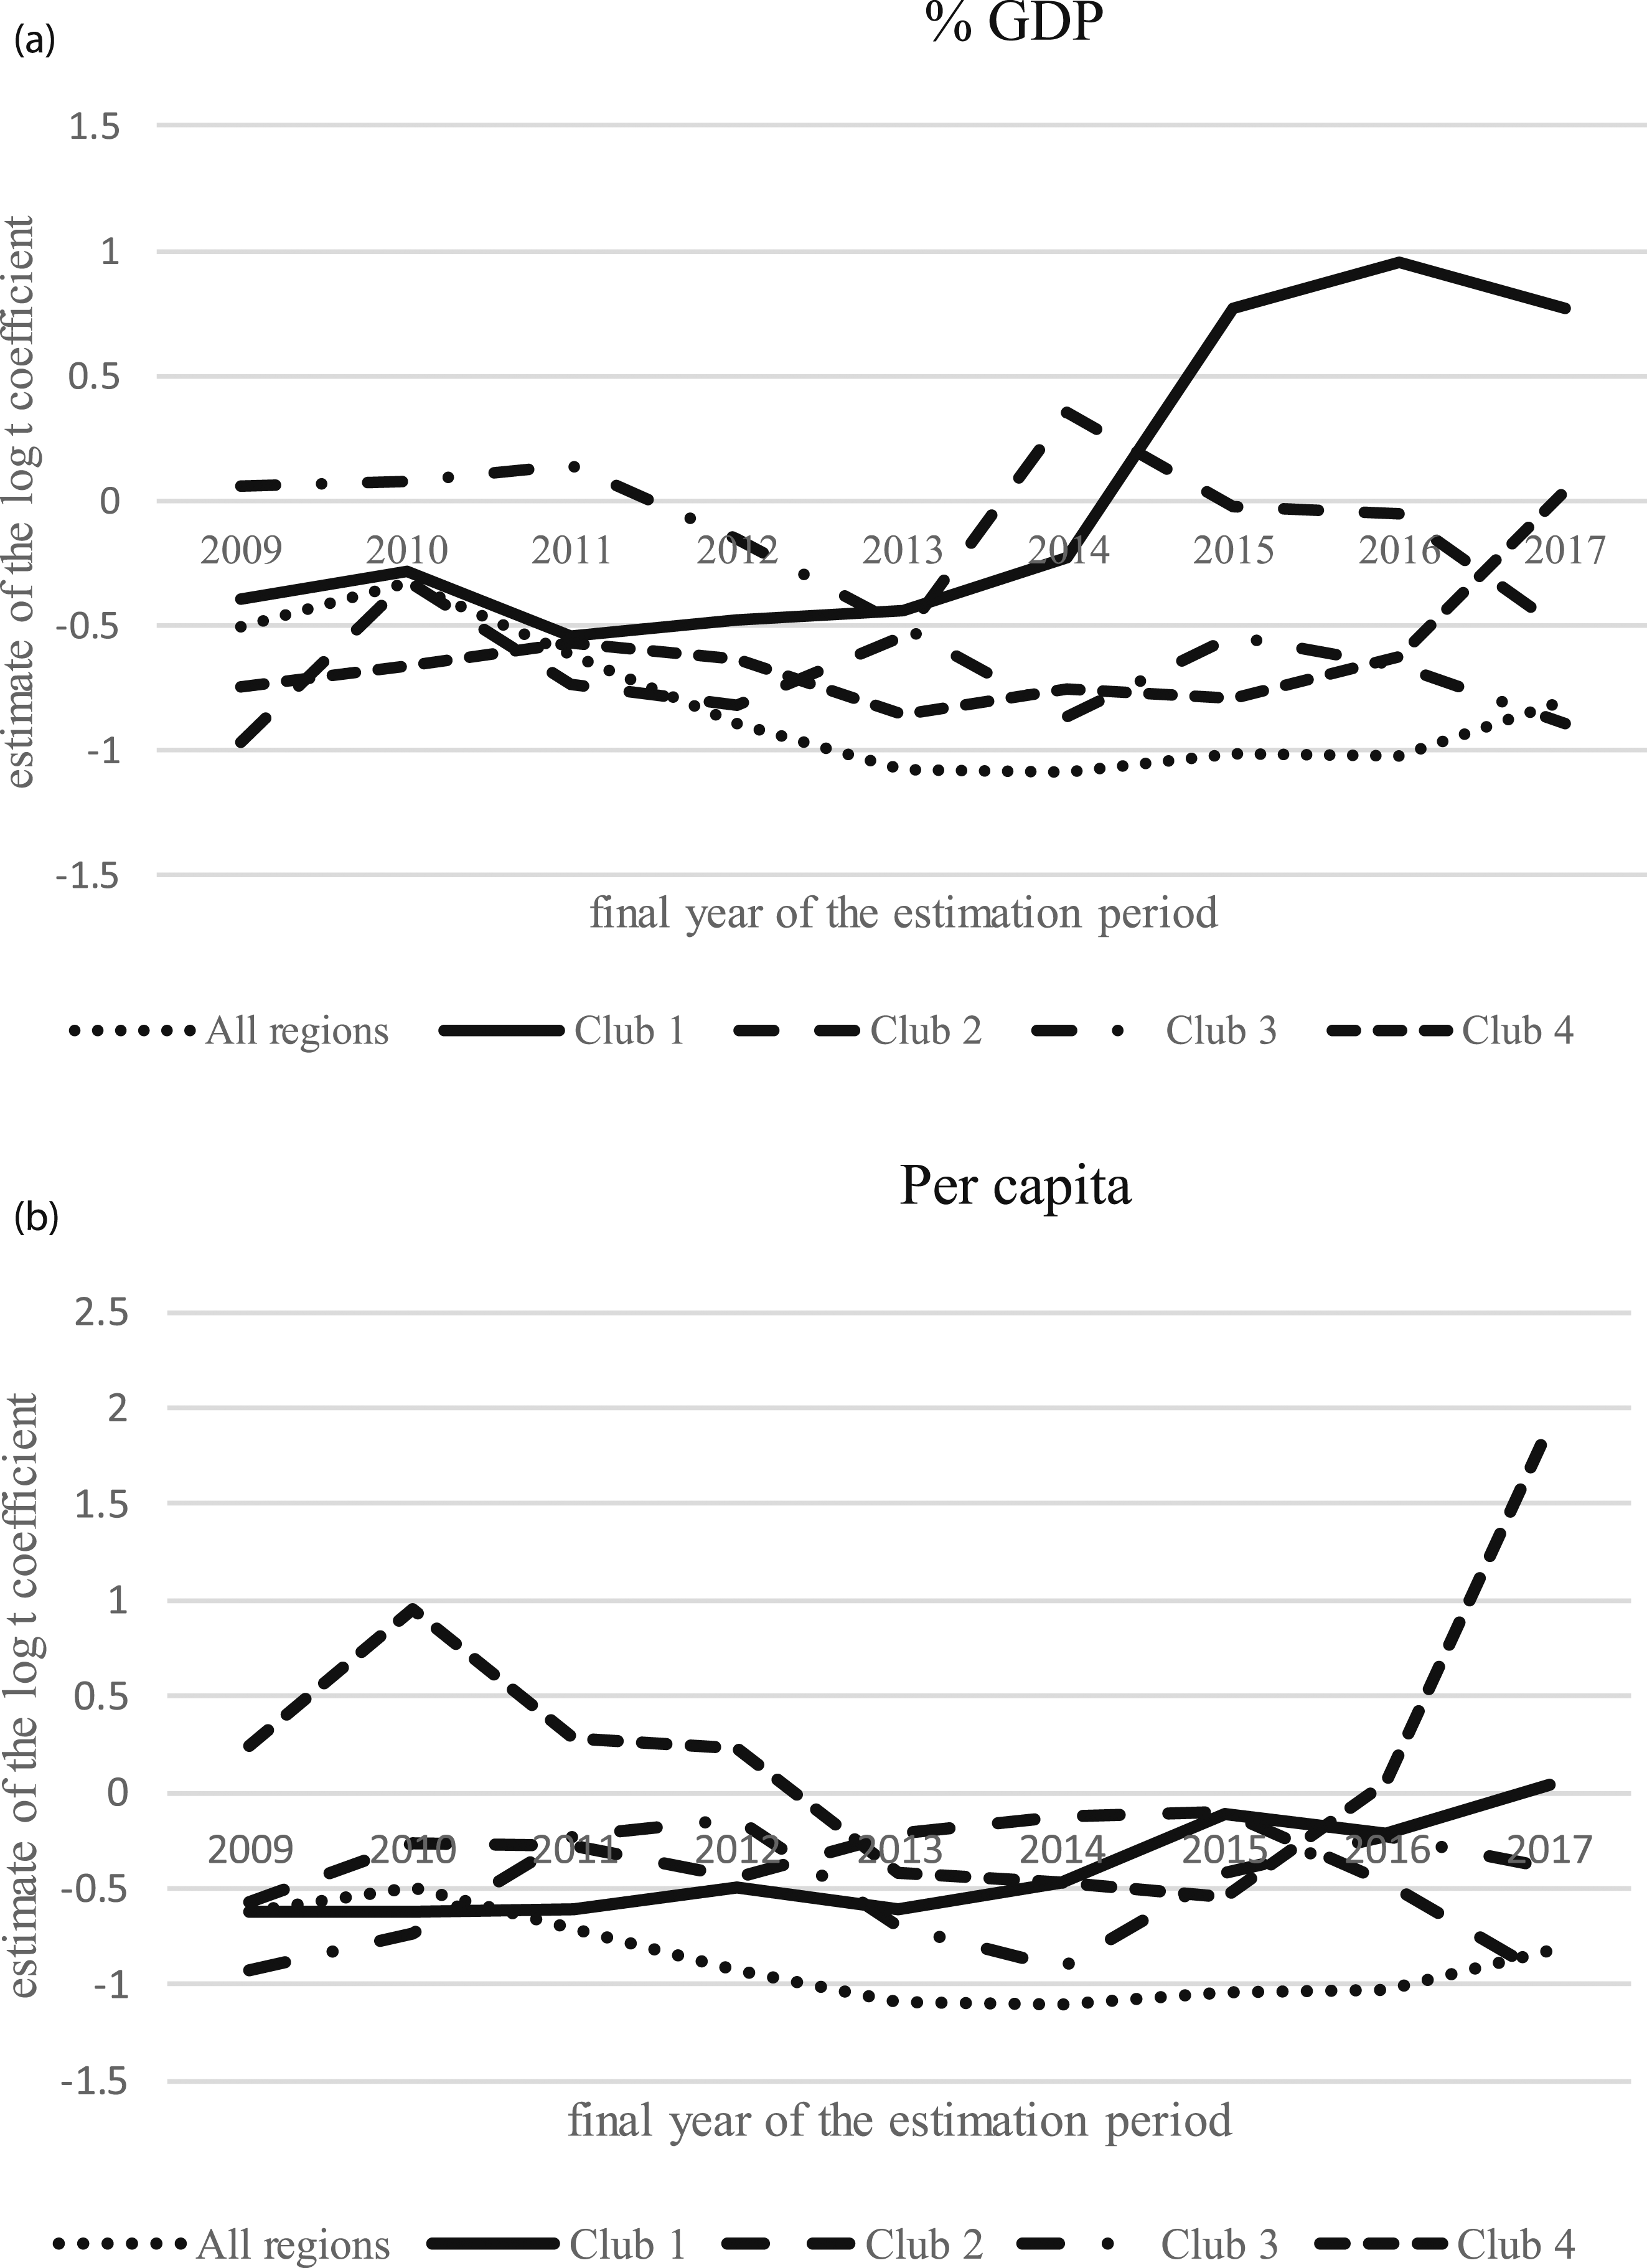
To sum up, we coincide with Mazzola and Pizzuto’s (2020) conclusion for per capita GDP convergence: the Great Recession increased the disparities of R&D expenditure among clubs, but at the same time reinforced the process of convergence within clubs (in our study, specifically, within the extreme clubs).
The evolution of the economic crisis clearly reflects the weakness of regional efforts in regard to R&D during a crisis, despite the European funds received by the different regions of Spain during this period. It should be taken into account that the economic crisis increased the need for other public expenditure, such as social security, with greater restrictions imposed on R&D expenditure by regional governments. Additionally, R&D expenditure by the business enterprise sector experienced a significant drop during the crisis, with expenditure in 2017 being below that registered in 2008. It should also be noted that in Spain, the Interterritorial Compensation Fund (FCI in Spanish) 19 , which has been in place since the 1980s, has the goal of reducing disparities between Spanish regions. However, the resources devoted to this fund have diminished notably in the last few years, amounting to only 0.04% of GDP in the country today. This FCI could be revised by focusing mainly on R&D and intangibles.
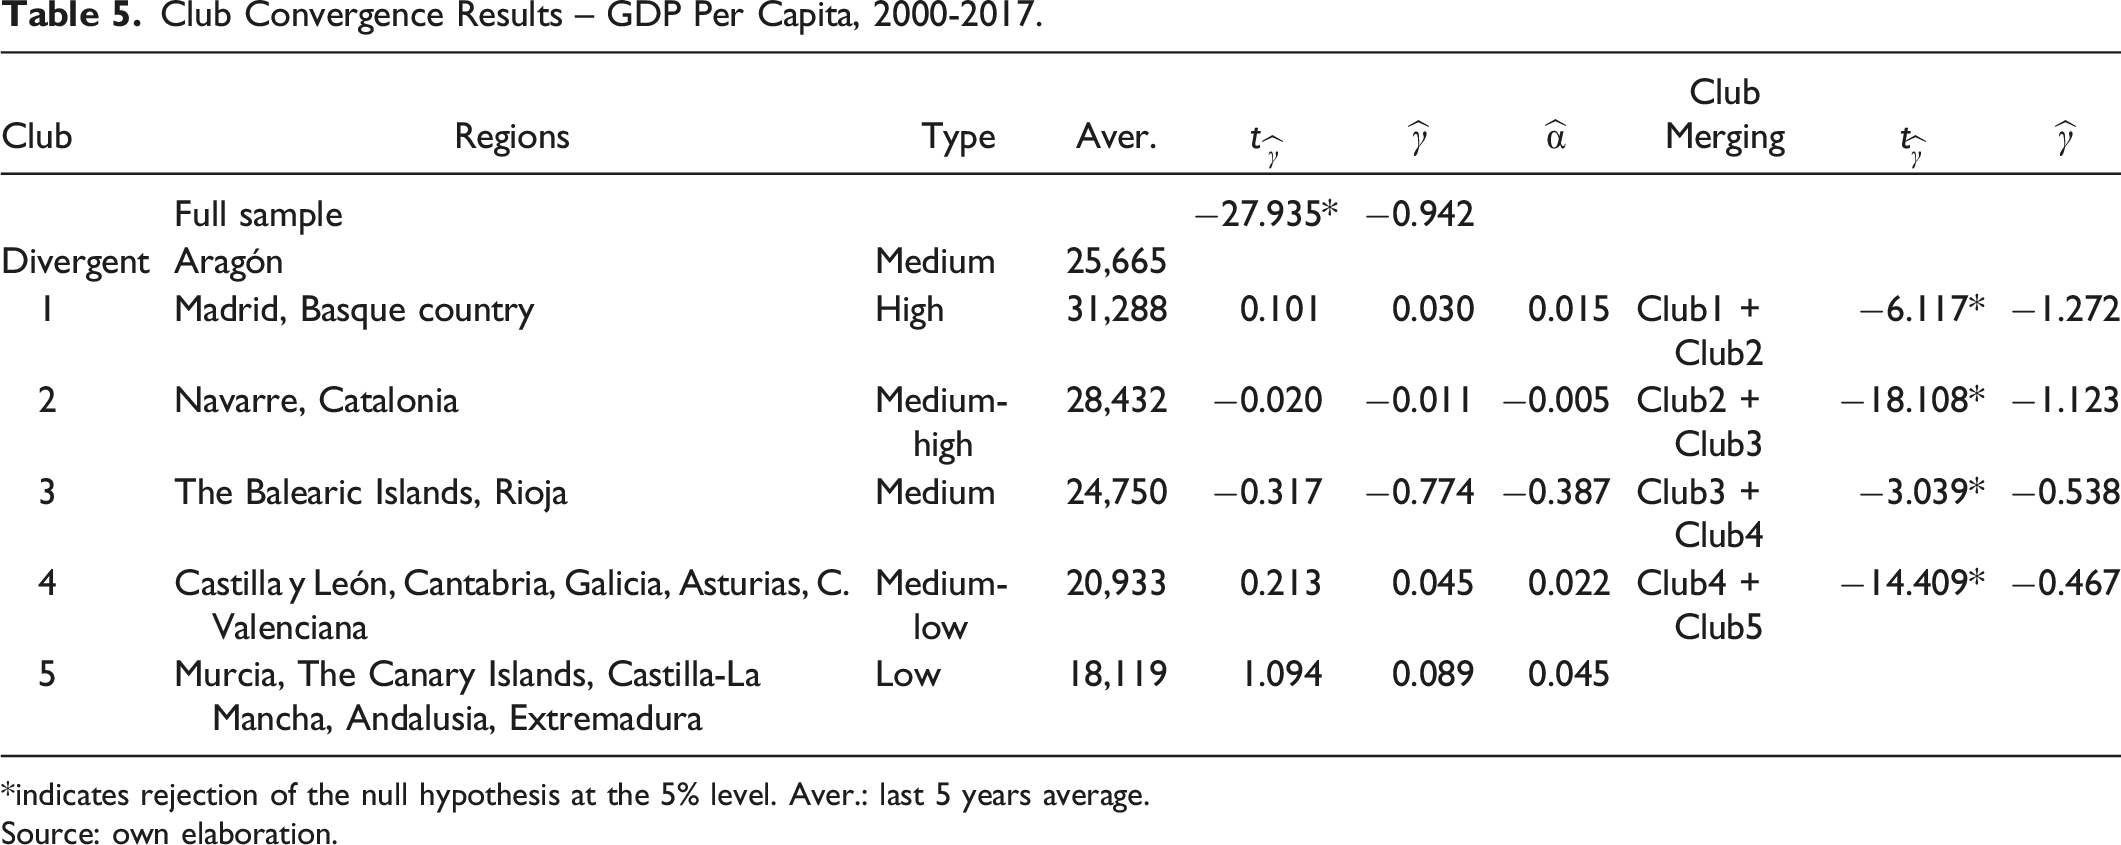
Club Convergence for GDP Per Capita
Club Convergence Results – GDP Per Capita, 2000-2017.
*indicates rejection of the null hypothesis at the 5% level. Aver.: last 5 years average.
Source: own elaboration.
We note similarities with the R&D convergence results, with Madrid, the Basque Country, Navarre and Catalonia in the first two clubs, and on the other hand, the Canary Islands and Extremadura in the last club. With regard to the differences between the two club convergence exercises, it should be noted that the Balearic Islands, with an average GDP per capita, is in the last club in R&D expenditure, due to the considerable impact of tourism on the economy, a non-R&D-intensive sector.
Factors Influencing the Convergence Clubs
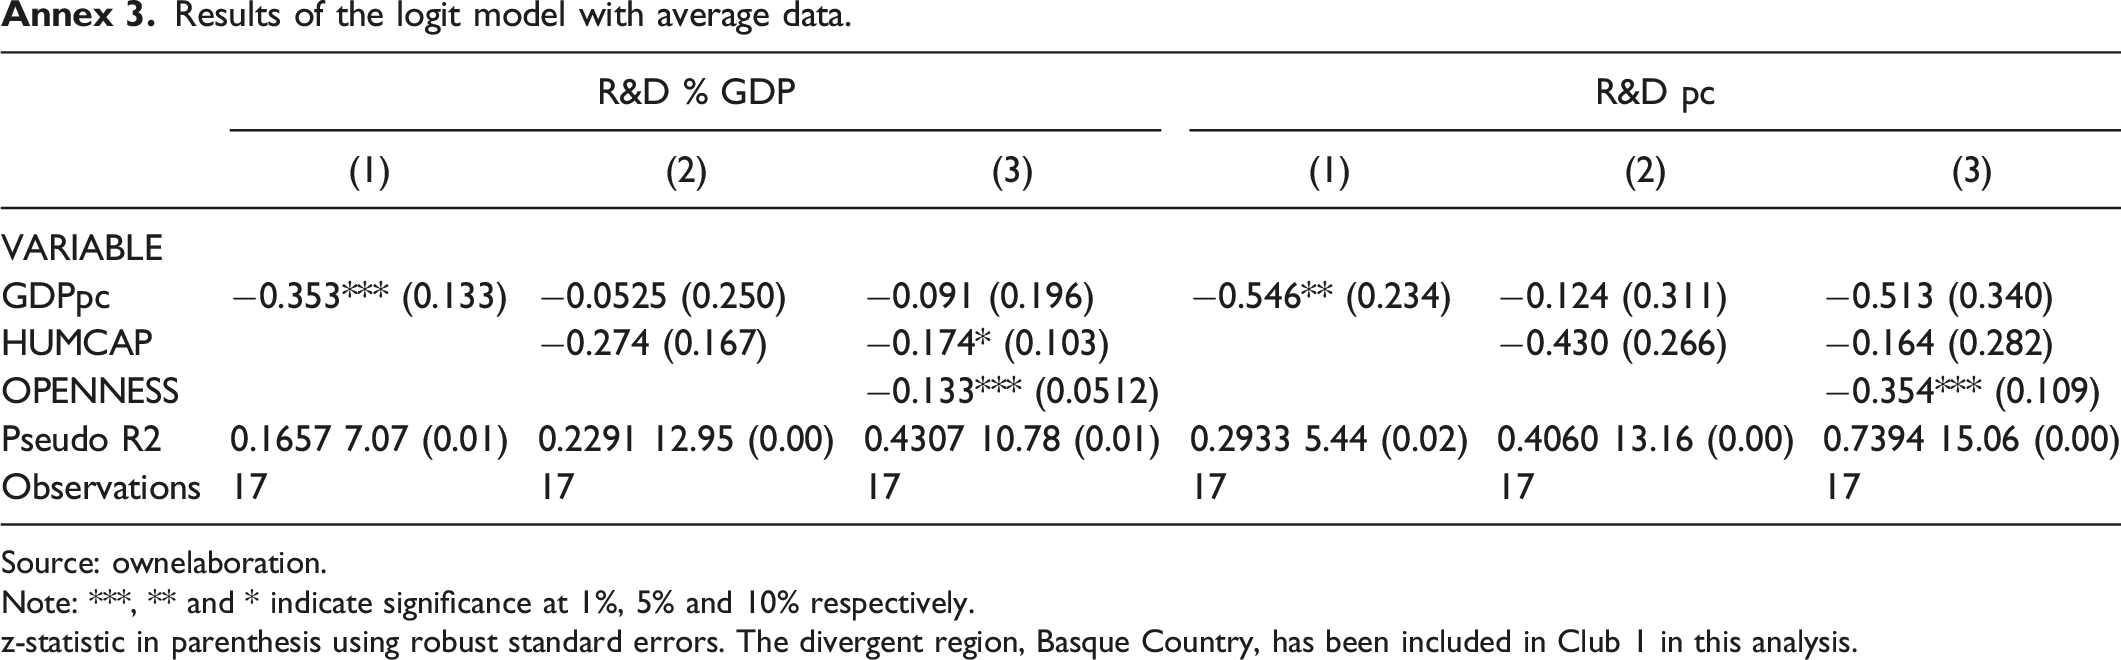
Having performed the club convergence analysis, we now explore the potential factors behind the clusters obtained for R&D expenditure. These factors have been addressed in several papers, such as Bebczuk (2002), Falk (2006), Wang (2010), Becker (2013) and Alam et al. (2019). As stated above, taking into account the fact that the dependent variable is discretely ordered, we employ an ordered logit model (Mckelvey and Zavoina 1975). Taking the club (1, 2, three and 4) as dependent variable, we consider explanatory variables like GDPpc, human capital and economic openness to be classic indicators in this literature. It is worth noting that the degrees of freedom using Spanish regions are quite limited and, consequently, a reduced number of factors can be considered at the same time, limiting the conclusions attained in this analysis. GDPpc: GDP per capita (in thousands of euros; source: Instituto Nacional de Estadística –INE-). A positive relationship with R&D expenditure should be expected. This prediction can be explained by the high elasticity of per capita R&D expenditure with respect to per capita income (for example, Braconier (2000) concluded estimations between 1.81 and 2.93 for OECD countries), or bigger incentives to invest in R&D related to the size of the economy. HUMCAP: human capital, defined as the percentage of the population with tertiary education (source: INE). The expected relationship is also positive, as human capital is one of the major sources of long-term growth in theoretical models. It should also be noted that R&D activity is usually intensive in human capital. OPENNESS: the degree of economic openness, measured as the total of exports and imports as a percentage of GDP (source: INE). We expect a positive relationship as well. The degree of economic openness is related to competitiveness in international markets and hence, to innovation capacity and R&D effort.
Regarding the signs of the estimates and the relationships, it should be noted that as the clubs (1–4) represent high (1) and low (4) R&D expenditure regions, a negative sign in the estimated coefficient is associated with a positive relationship, and viceversa.
Club Convergence Results and Ranking of Regions and Clubs for Factors (2000).
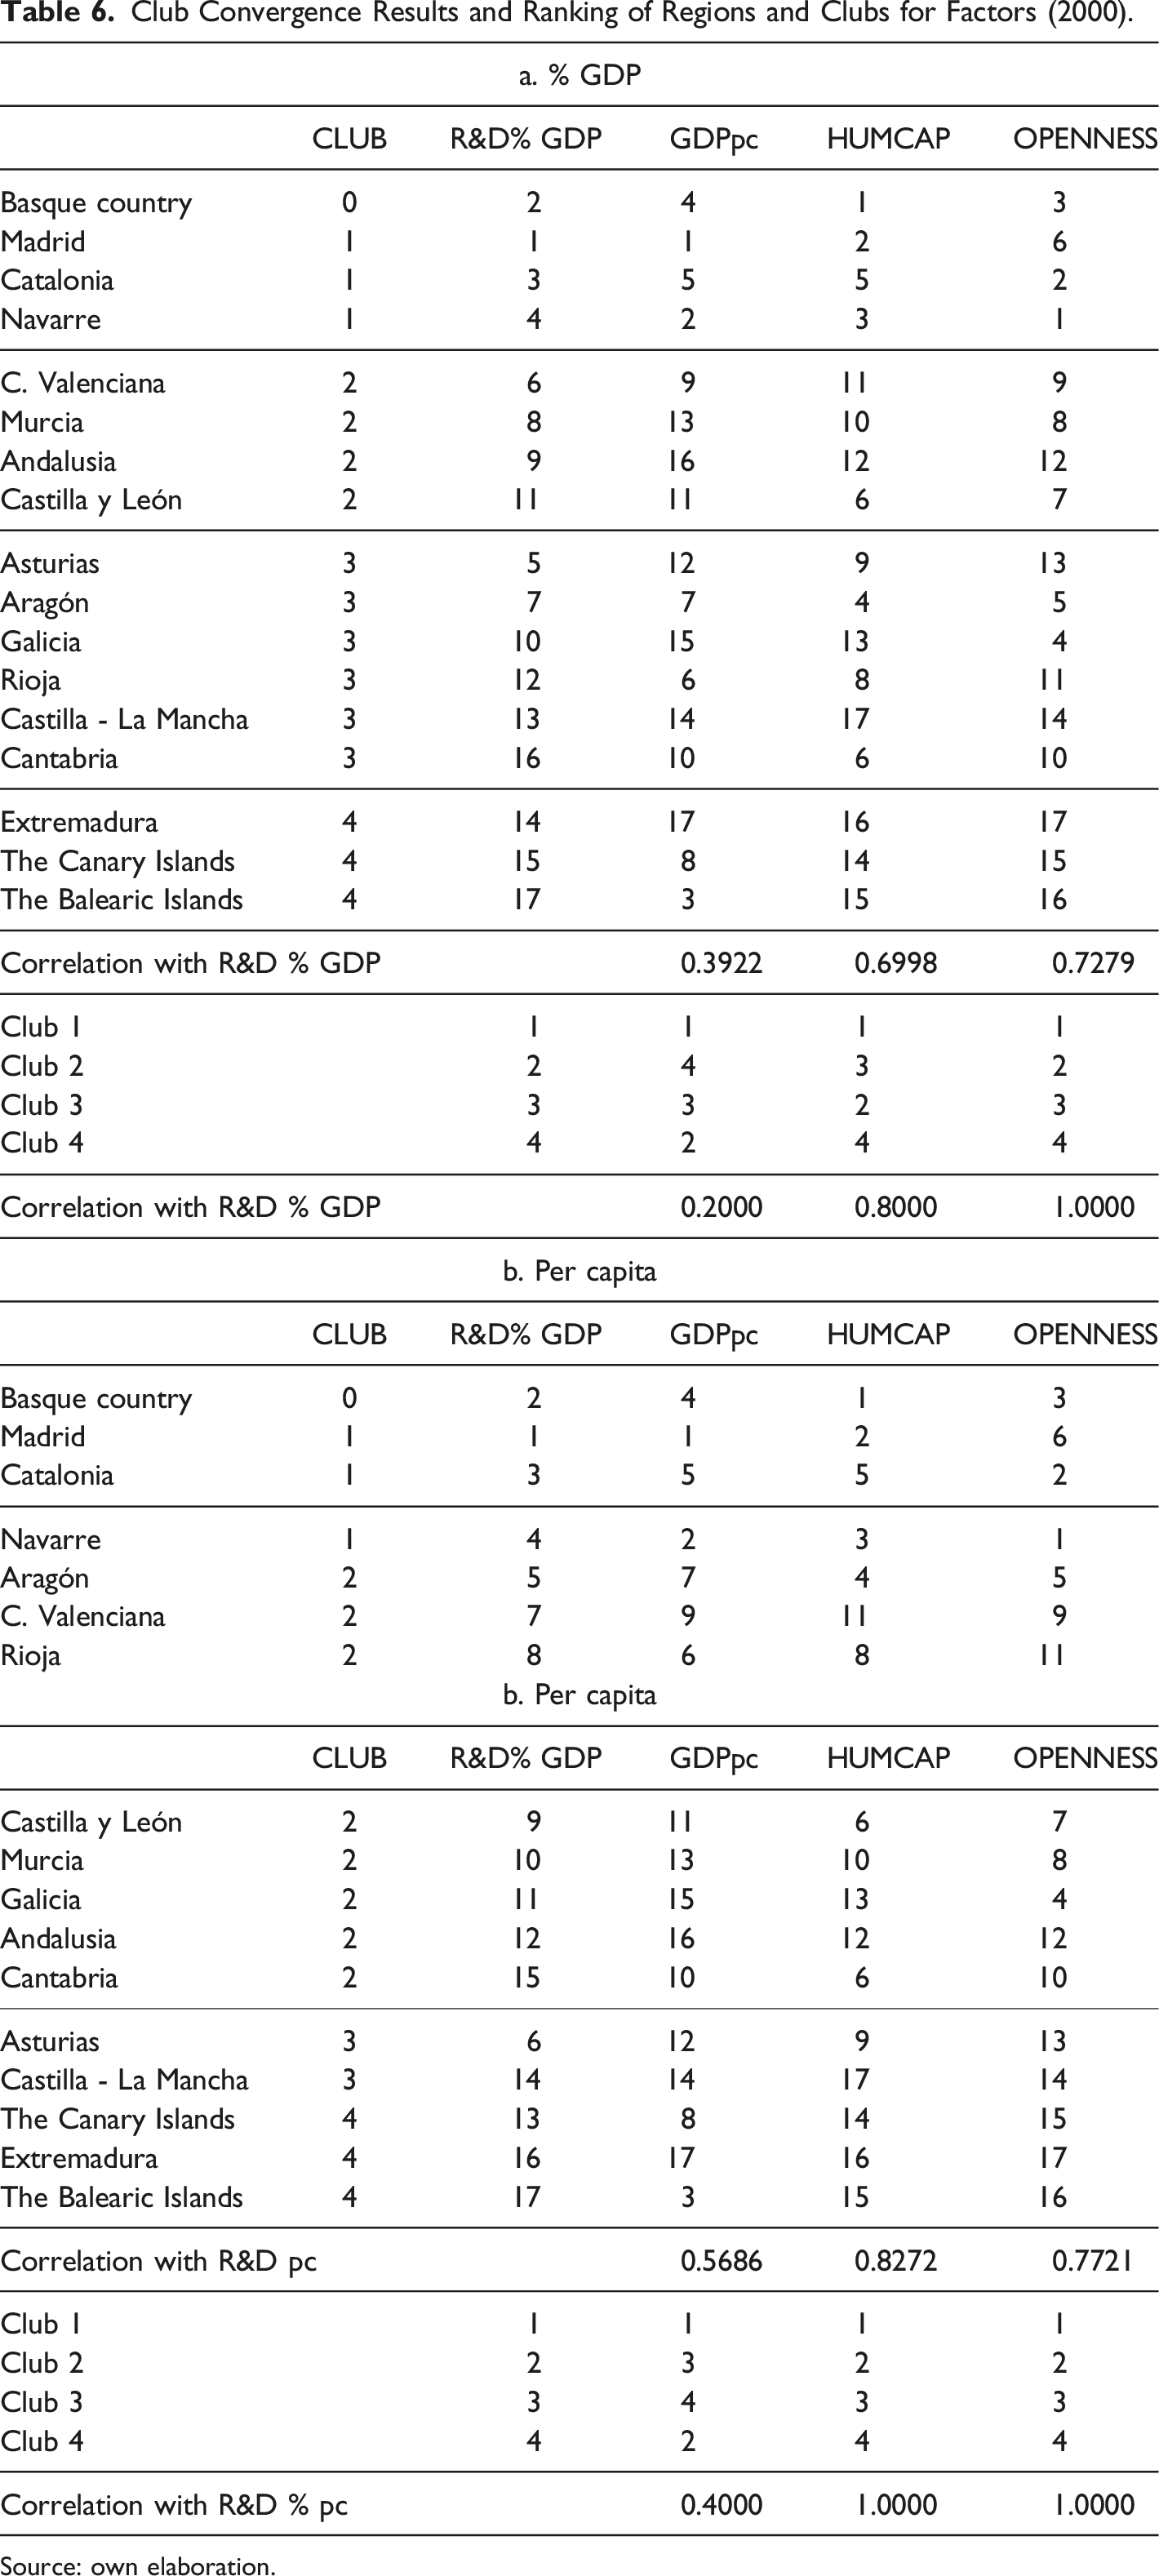
Source: own elaboration.
Ordered Logit Model results.
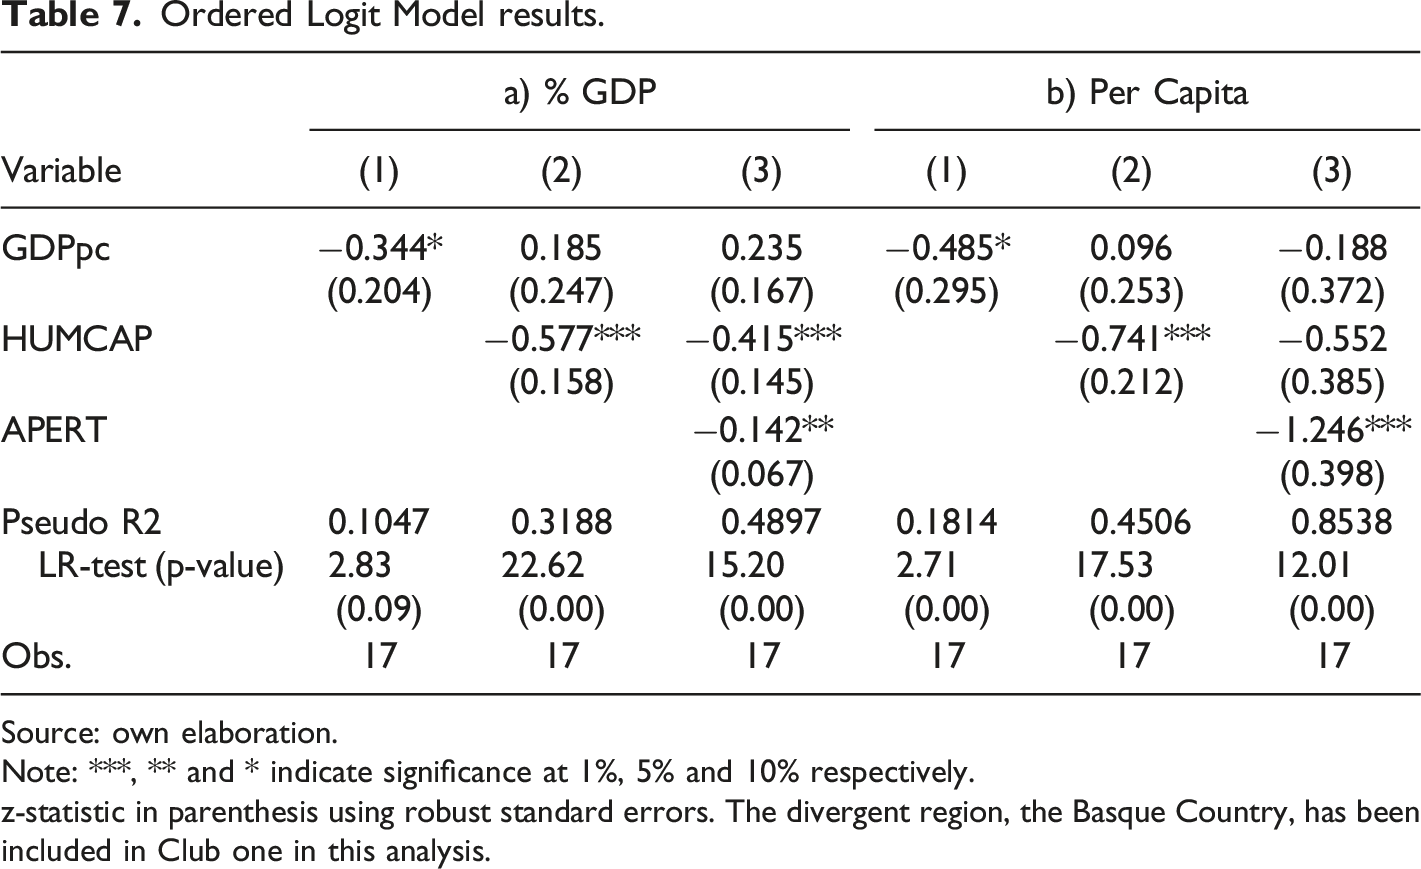
Source: own elaboration.
Note: ***, ** and * indicate significance at 1%, 5% and 10% respectively.
z-statistic in parenthesis using robust standard errors. The divergent region, the Basque Country, has been included in Club one in this analysis.
We are aware of the endogeneity issues in the logit estimation. This issue has been treated in previous literature using dynamic panel methods (e.g., Cutrini 2019) or considering the explanatory variables for the initial values of the period. The first strategy is not feasible in this case due to data scarcity, so we follow the second. In addition to this, we apply the control function approach to test the existence of endogeneity and the results show that an endogeneity issue does not seem to exist.
In the complete model, the signs obtained are in line with those which we had expected and discussed previously. However, the GDP pc is not statistically significant in the end, while human capital (but only in the GDPpc perspective) and economic openness are statistically significant with the negative sign, meaning that regions with higher human capital and openness tend to converge into clubs with high R&D expenditure. These results highlight the relevance of education and international trade in R&D intensity.
Concluding Remarks
Research and development and economic growth have powerful connections both in theoretical models and in empirical studies. In addition, R&D is a relevant factor in competitiveness and a key determinant of innovation.
In this paper, we empirically study the convergence of R&D expenditure among the regions of Spain through a club convergence approach. The results obtained for total R&D expenditure both as a percentage of GDP and in per capita terms (although there are some differences) coincide in rejecting the overall convergence hypothesis as well as detecting four clubs, with the divergent case of the Basque Country. In addition, there is no evidence of absolute convergence (convergence in levels) in any cluster. The results show large disparities among regional R&D expenditure in Spain, a country with a moderate R&D expenditure in the EU context. We complete the analysis with a club convergence study for GDP per capita, which shows many similarities with those achieved for R&D expenditure, and, hence, certain common trends between the two variables.
We also perform an ordered logit model to explore the possible factors behind the clubs, including following the literature on this topic, GDPpc, human capital and economic openness. The results indicate that GDPpc is not statistically significant in the end. On the other hand, human capital and economic openness are significant with a negative sign, meaning that regions with higher human capital and openness tend to converge into clubs with high R&D expenditure.
In policymaking terms, with our results identifying great disparities in R&D across regions and taking into account the benefits from that investment, we recommend a revision of the Interterritorial Compensation Fund, established in Spain precisely to reduce the disparities between regions in the 1980s. The introduction of R&D and intangibles, directed toward less innovative regions, would have a strong impact on R&D convergence and hence economic convergence. Furthermore, the fact that three out of the four clubs are below 1% of GDP in R&D expenditure terms illustrates the gap with the leading regions of Spain (The Basque Country, Madrid, Navarre and Catalonia, which are also leaders in the Spanish regional talent map by COTEC-Ivie 2021) and also with the European average, which has an impact on economic convergence. Along with the current objective of reaching 2% of GDP for the country as a whole, we also recommend agreeing on regional targets in a state-region collaborative framework.
In addition, the results derived from the analysis of the economic crisis reflect the weakness of the regional efforts in R&D in the face of the crisis, despite the European funds received by the different regions of Spain during this period. For this reason, R&D and innovation policies should be reconsidered with a view to increasing resources and narrowing the gaps in the regional data, due to their effects on competitiveness and economic growth. Based on all these considerations, we recommend the creation of a Regional Development Committee in Spain, similar to the current Council for Fiscal and Financial Policy, to properly coordinate regional and cohesion measures, with a focus on R&D and innovation policies among others. Finally, it should also be remarked that the availability of data with a more disaggregated scale, at the local level, would be of great interest in policy terms but, unfortunately, they do not exist in the Spanish case. The elaboration of R&D statistics at the municipal level, at least for the main jurisdictions, is a challenge for the Spanish statistical system.
As regards future research, we suggest, at least, four areas of focus. First, this analysis can be extended from total expenditure to disaggregated expenditure by source of execution or financing, namely public sector, higher education and business and enterprise, as Blanco et al. (2020) did for the EU. Second, regarding the Fund mentioned above, it is necessary to make a reform proposal to position the fund at the centre of Spanish cohesion policy. Third, it would be helpful to study the consequences of Brexit on the European budget and hence the funds devoted to R&D and cohesion in the European Union and their effects on territories. And finally, the new European Funds, namely Next Generation EU, 23 with 750 billion euros for the 2021‒2026 period, are expected to have a major impact on R&D across countries and regions and analysis of them would also be interesting in the future.
Footnotes
Acknowledgments
We are clearly indebted to the Editor and referees for useful comments and suggestions.
Declaration of Conflicting Interests
The author(s) declared no potential conflicts of interest with respect to the research, authorship, and/or publication of this article.
Funding
The author(s) disclosed receipt of the following financial support for the research, authorship, and/or publication of this article: Authors gratefully acknowledge funding by Instituto de Estudios Fiscales (Spanish Ministry of Public Finance) by FUO-110-19 and Spanish Ministry of Science and Innovation (PID2020-115183RB-C21 by MCIN/ AEI//10.13039/501100011033).
Notes
Annexes
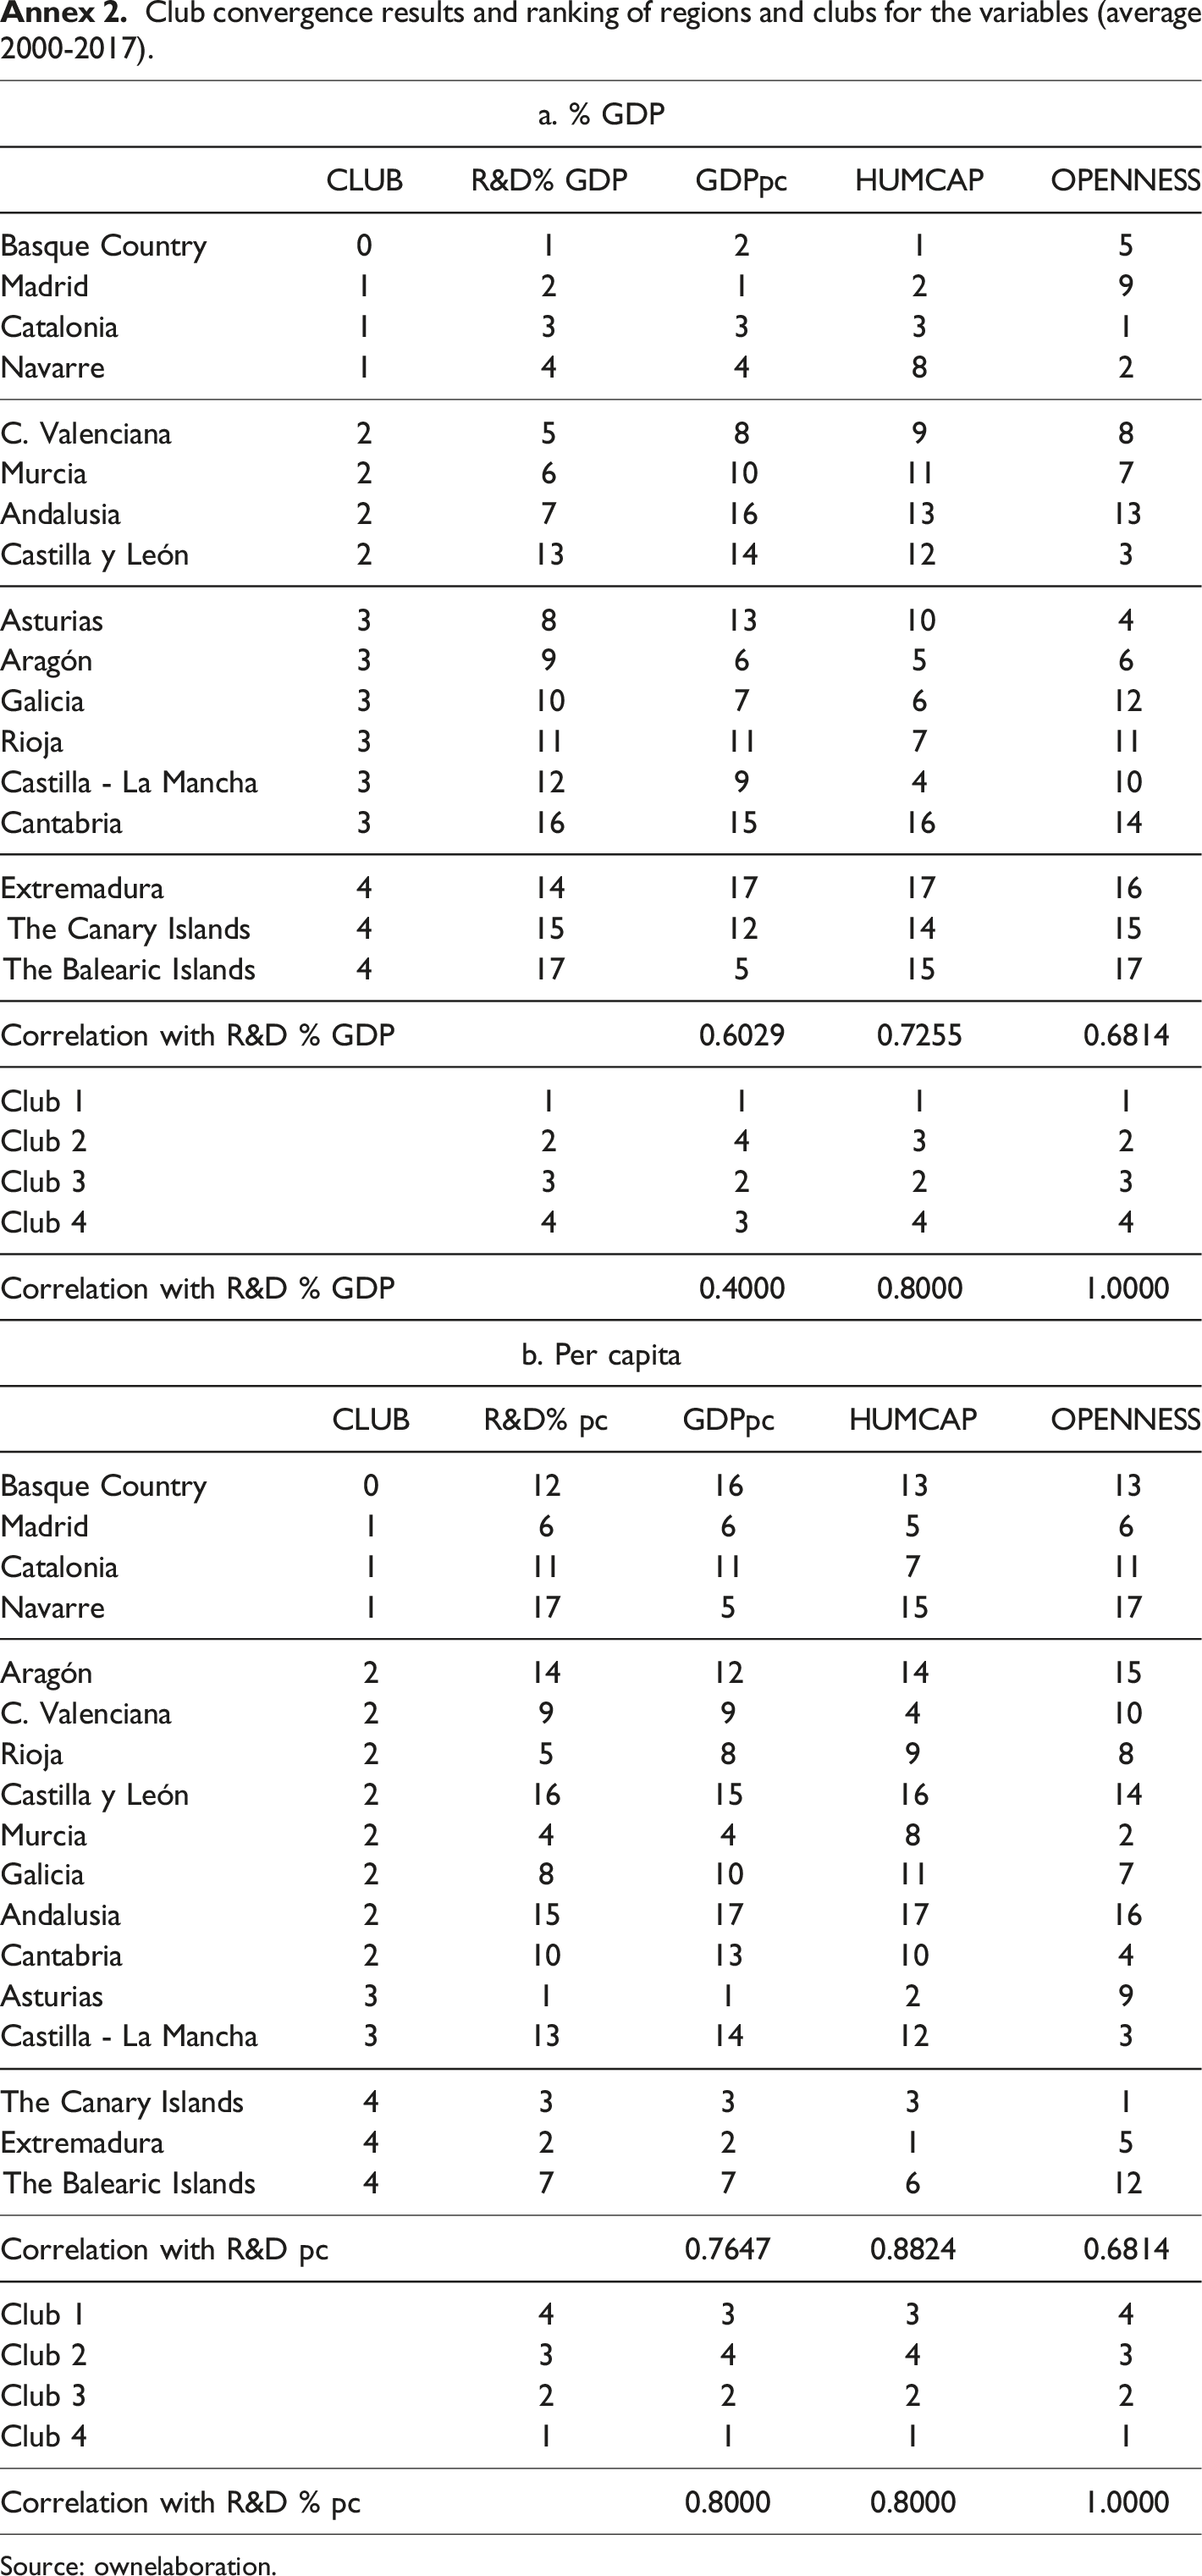
Regional data. Figure A.1. Evolution of the R&D expenditure by regions, 2000-2017. A.1.a. % GDP, A.1.b. Per capita. Source: own elaboration from INE. Note: presented by clubs and with the same scale to improve visualization. Club convergence results and ranking of regions and clubs for the variables (average 2000-2017). Source: ownelaboration. Results of the logit model with average data. Source: ownelaboration. Note: ***, ** and * indicate significance at 1%, 5% and 10% respectively. z-statistic in parenthesis using robust standard errors. The divergent region, Basque Country, has been included in Club 1 in this analysis.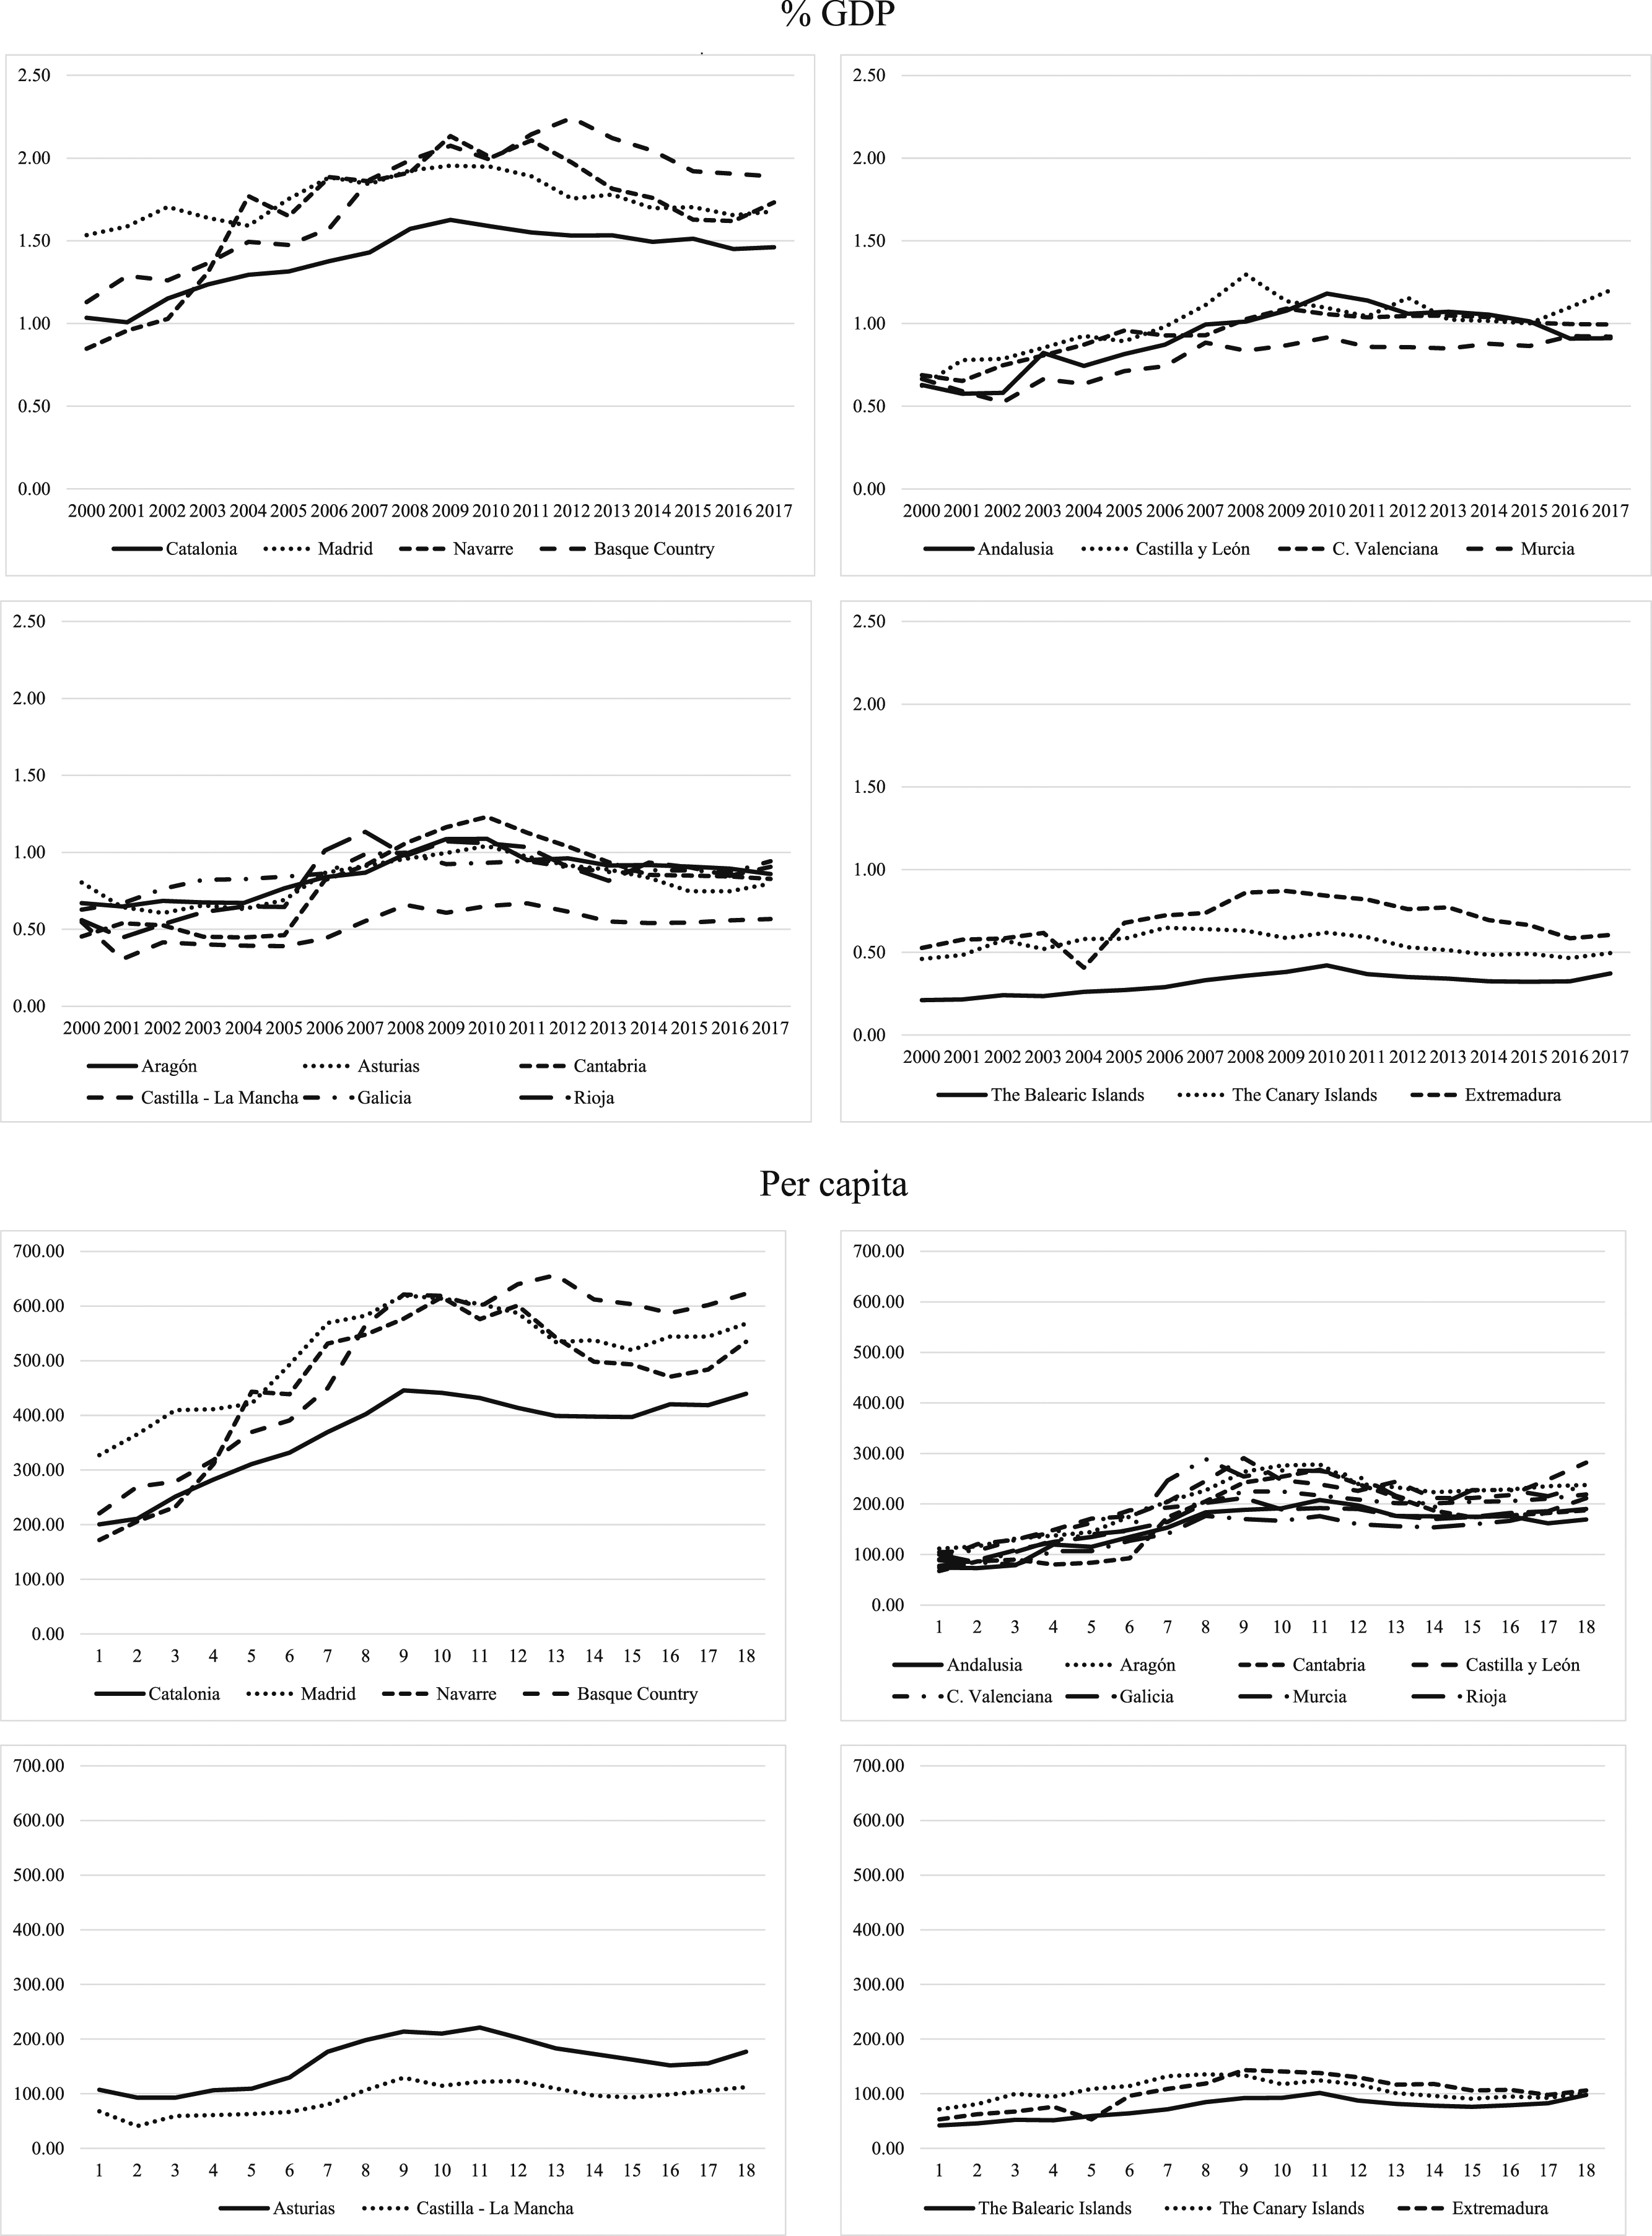
a. % GDP
CLUB
R&D% GDP
GDPpc
HUMCAP
OPENNESS
Basque Country
0
1
2
1
5
Madrid
1
2
1
2
9
Catalonia
1
3
3
3
1
Navarre
1
4
4
8
2
C. Valenciana
2
5
8
9
8
Murcia
2
6
10
11
7
Andalusia
2
7
16
13
13
Castilla y León
2
13
14
12
3
Asturias
3
8
13
10
4
Aragón
3
9
6
5
6
Galicia
3
10
7
6
12
Rioja
3
11
11
7
11
Castilla - La Mancha
3
12
9
4
10
Cantabria
3
16
15
16
14
Extremadura
4
14
17
17
16
The Canary Islands
4
15
12
14
15
The Balearic Islands
4
17
5
15
17
Correlation with R&D % GDP
0.6029
0.7255
0.6814
Club 1
1
1
1
1
Club 2
2
4
3
2
Club 3
3
2
2
3
Club 4
4
3
4
4
Correlation with R&D % GDP
0.4000
0.8000
1.0000
b. Per capita
CLUB
R&D% pc
GDPpc
HUMCAP
OPENNESS
Basque Country
0
12
16
13
13
Madrid
1
6
6
5
6
Catalonia
1
11
11
7
11
Navarre
1
17
5
15
17
Aragón
2
14
12
14
15
C. Valenciana
2
9
9
4
10
Rioja
2
5
8
9
8
Castilla y León
2
16
15
16
14
Murcia
2
4
4
8
2
Galicia
2
8
10
11
7
Andalusia
2
15
17
17
16
Cantabria
2
10
13
10
4
Asturias
3
1
1
2
9
Castilla - La Mancha
3
13
14
12
3
The Canary Islands
4
3
3
3
1
Extremadura
4
2
2
1
5
The Balearic Islands
4
7
7
6
12
Correlation with R&D pc
0.7647
0.8824
0.6814
Club 1
4
3
3
4
Club 2
3
4
4
3
Club 3
2
2
2
2
Club 4
1
1
1
1
Correlation with R&D % pc
0.8000
0.8000
1.0000
R&D % GDP
R&D pc
(1)
(2)
(3)
(1)
(2)
(3)
VARIABLE
GDPpc
−0.353*** (0.133)
−0.0525 (0.250)
−0.091 (0.196)
−0.546** (0.234)
−0.124 (0.311)
−0.513 (0.340)
HUMCAP
−0.274 (0.167)
−0.174* (0.103)
−0.430 (0.266)
−0.164 (0.282)
OPENNESS
−0.133*** (0.0512)
−0.354*** (0.109)
Pseudo R2
0.1657 7.07 (0.01)
0.2291 12.95 (0.00)
0.4307 10.78 (0.01)
0.2933 5.44 (0.02)
0.4060 13.16 (0.00)
0.7394 15.06 (0.00)
Observations
17
17
17
17
17
17