
Abstract
Much of the work concerning economic dynamism has focused on its aggregate-level implications, while there have been rising concerns about business displacement at the community or neighborhood level. In this article, we analyze this important (restructuring) process using detailed establishment-level business information and explore how it manifests itself across space within the Los Angeles—Long Beach—Santa Ana, CA Urbanized Area. We also investigate the association between business churning and neighborhood-level housing vacancy rates to understand the implications of dramatic changes in the business landscape. We find that housing vacancies are more likely to increase in urban neighborhoods with a higher establishment death rate, while the creation of new businesses can mitigate the association to some extent. We also detect substantial variation across decades not only in the spatial distribution of business churning but also in its association with housing vacancy rates, suggesting the evolving nature of business dynamics and their implications.
Introduction
Over the last two decades, increasing attention has been paid to the ways in which our economy can affect the quality of our life via housing markets. The huge economic turbulence during the 2008 global financial crisis motivated researchers to tackle the connections by examining dramatic changes that happened to those who lost their homes as well as areas with a large number of foreclosures (see e.g., Williams et al. 2014; Wang 2020; Zhang and McCord 2014). Many studies have examined the hardship that the directly affected families/households went through and the enormous impacts on their well-being and child development (see e.g., Allen 2011; Kalil 2013). Other studies have explored the persisting, or even widening, disparities and the consequences for more vulnerable groups during the turbulent period of time (see e.g., Baker et al. 2016; Geelhoedt et al. 2021; Rugh and Massey 2010).
While the economy rebounded from the financial crisis in the 2010s, economic uncertainties have remained high in many countries, and this is particularly apparent in the midst of the ongoing COVID-19 pandemic. Traditional industries have been increasingly replaced by newly emerging platforms and service providers which are often operated globally and equipped with advanced digital technologies (see e.g., Ayouba et al. 2020; Ferreri and Sanyal 2018; Zervas et al. 2017). This rapid economic restructuring process, combined with other forces, has led to a high degree of churning in the business landscape – i.e., economic transformation that takes place in a dramatic fashion beyond the rate that is captured by the net change in the total number of business establishments or employment. The economic turbulence can further affect urban housing markets and the quality of life, although its impacts may not necessarily be the same as what it caused during the earlier crisis.
It should be stressed that there have been rising concerns about dramatic changes in the business landscape at the community or neighborhood level. Rapid business turnovers are viewed as a potential threat to profits for commercial property owners and as a cause of difficulties in sales tax revenue forecasting from the standpoint of local governments. In addition, community activists and resident groups worry about the displacement of long-standing businesses rooted in their community, deterioration of social capital, and neighborhood instability. These issues have increasingly been covered by media in recent years often with the tag of gentrification (see e.g., Helmore 2017; Miller 2017), and retail gentrification – a shift in both socio-cultural and physical environments with new retailers “offer[ing] goods and services that cater to newcomers, charge prices that correspond to professional incomes, and create cultural symbols and spaces that tend to attract newcomers but alienate longtime residents” (Sullivan and Shaw 2011, 414) – is particularly threatening to some economic and racial groups.
However, there has been a dearth of systematic research into these concerns and the way in which business churning processes are related to urban neighborhood change. Much of the work concerning rapid economic (or industrial) restructuring processes has focused on its aggregate-level macroeconomic implications. Little is known about micro-level dynamics of business churning and its neighborhood-level consequences. To fill this gap in the literature, we posit a hypothesis that economic fluctuations can deteriorate neighborhood stability and test this hypothesis through an empirical analysis of the census tract-level housing vacancy rates in the Los Angeles—Long Beach—Santa Ana, CA Urbanized Area. In doing so, we quantify the spatially-varying degree of business churning by analyzing both births and deaths of individual business establishments and investigate the relationship between business churning and housing vacancy rates to better understand how economic dynamics can affect neighborhoods. Our results show that business churning significantly varies across neighborhoods and that a higher establishment death rate is associated with an increase in housing vacancies, while the creation of new businesses can mitigate the association to some extent. Furthermore, we detect notable variation across decades – the spatial distribution of churning and its association with housing vacancies in year 2010 appear different from those in year 2000 – which we interpret as evidence of the nonstationary nature of business dynamics and their implications.
The remainder of this article is organized as follows. The next section provides a brief review of existing research on business churning. The section Study Area and Data explains our study area, variables, and data, while the methodology used for our empirical investigation of business churning and its neighborhood implications is described in the section Methods. The section Exploratory Analysis Results presents our exploratory analysis results which describe the complex, evolving spatial distribution of business churning in the study region, and the section Multivariate Regression Results presents spatial regression results, revealing how business churning is associated with neighborhood stability. The last section concludes with a summary and discussion of our major findings.
Business Churning and Its Complex Implications
Business churning is quite prevalent in the U.S. and many other nations, although variations do exist. For instance, according to the US Census Business Dynamics Statistics, over 650,000 new establishments were created in the nation, while nearly 600,000 businesses ceased their operations in year 2019. Furthermore, in that year, more than 10 million jobs were created by existing businesses at the same time that approximately nine million jobs were eliminated, suggesting that net change figures do not enable us to capture the full extent of underlying dynamics.
Some of these changes are visible when they take place through a massive construction or redevelopment project as illustrated in Figure 1A. A large proportion of the changes in the business landscape, however, are not equally noticeable because they are not accompanied by physical changes. Furthermore, these changes do not necessarily result in a significant change in industrial structure and thus are not fully captured by conventional aggregated statistics widely used in previous research. It is quite common that a business establishment in one sector is replaced by another business in the same industry, and such replacement often occurs even in vibrant areas as shown in Figure 1B. Business churning – more or less visible.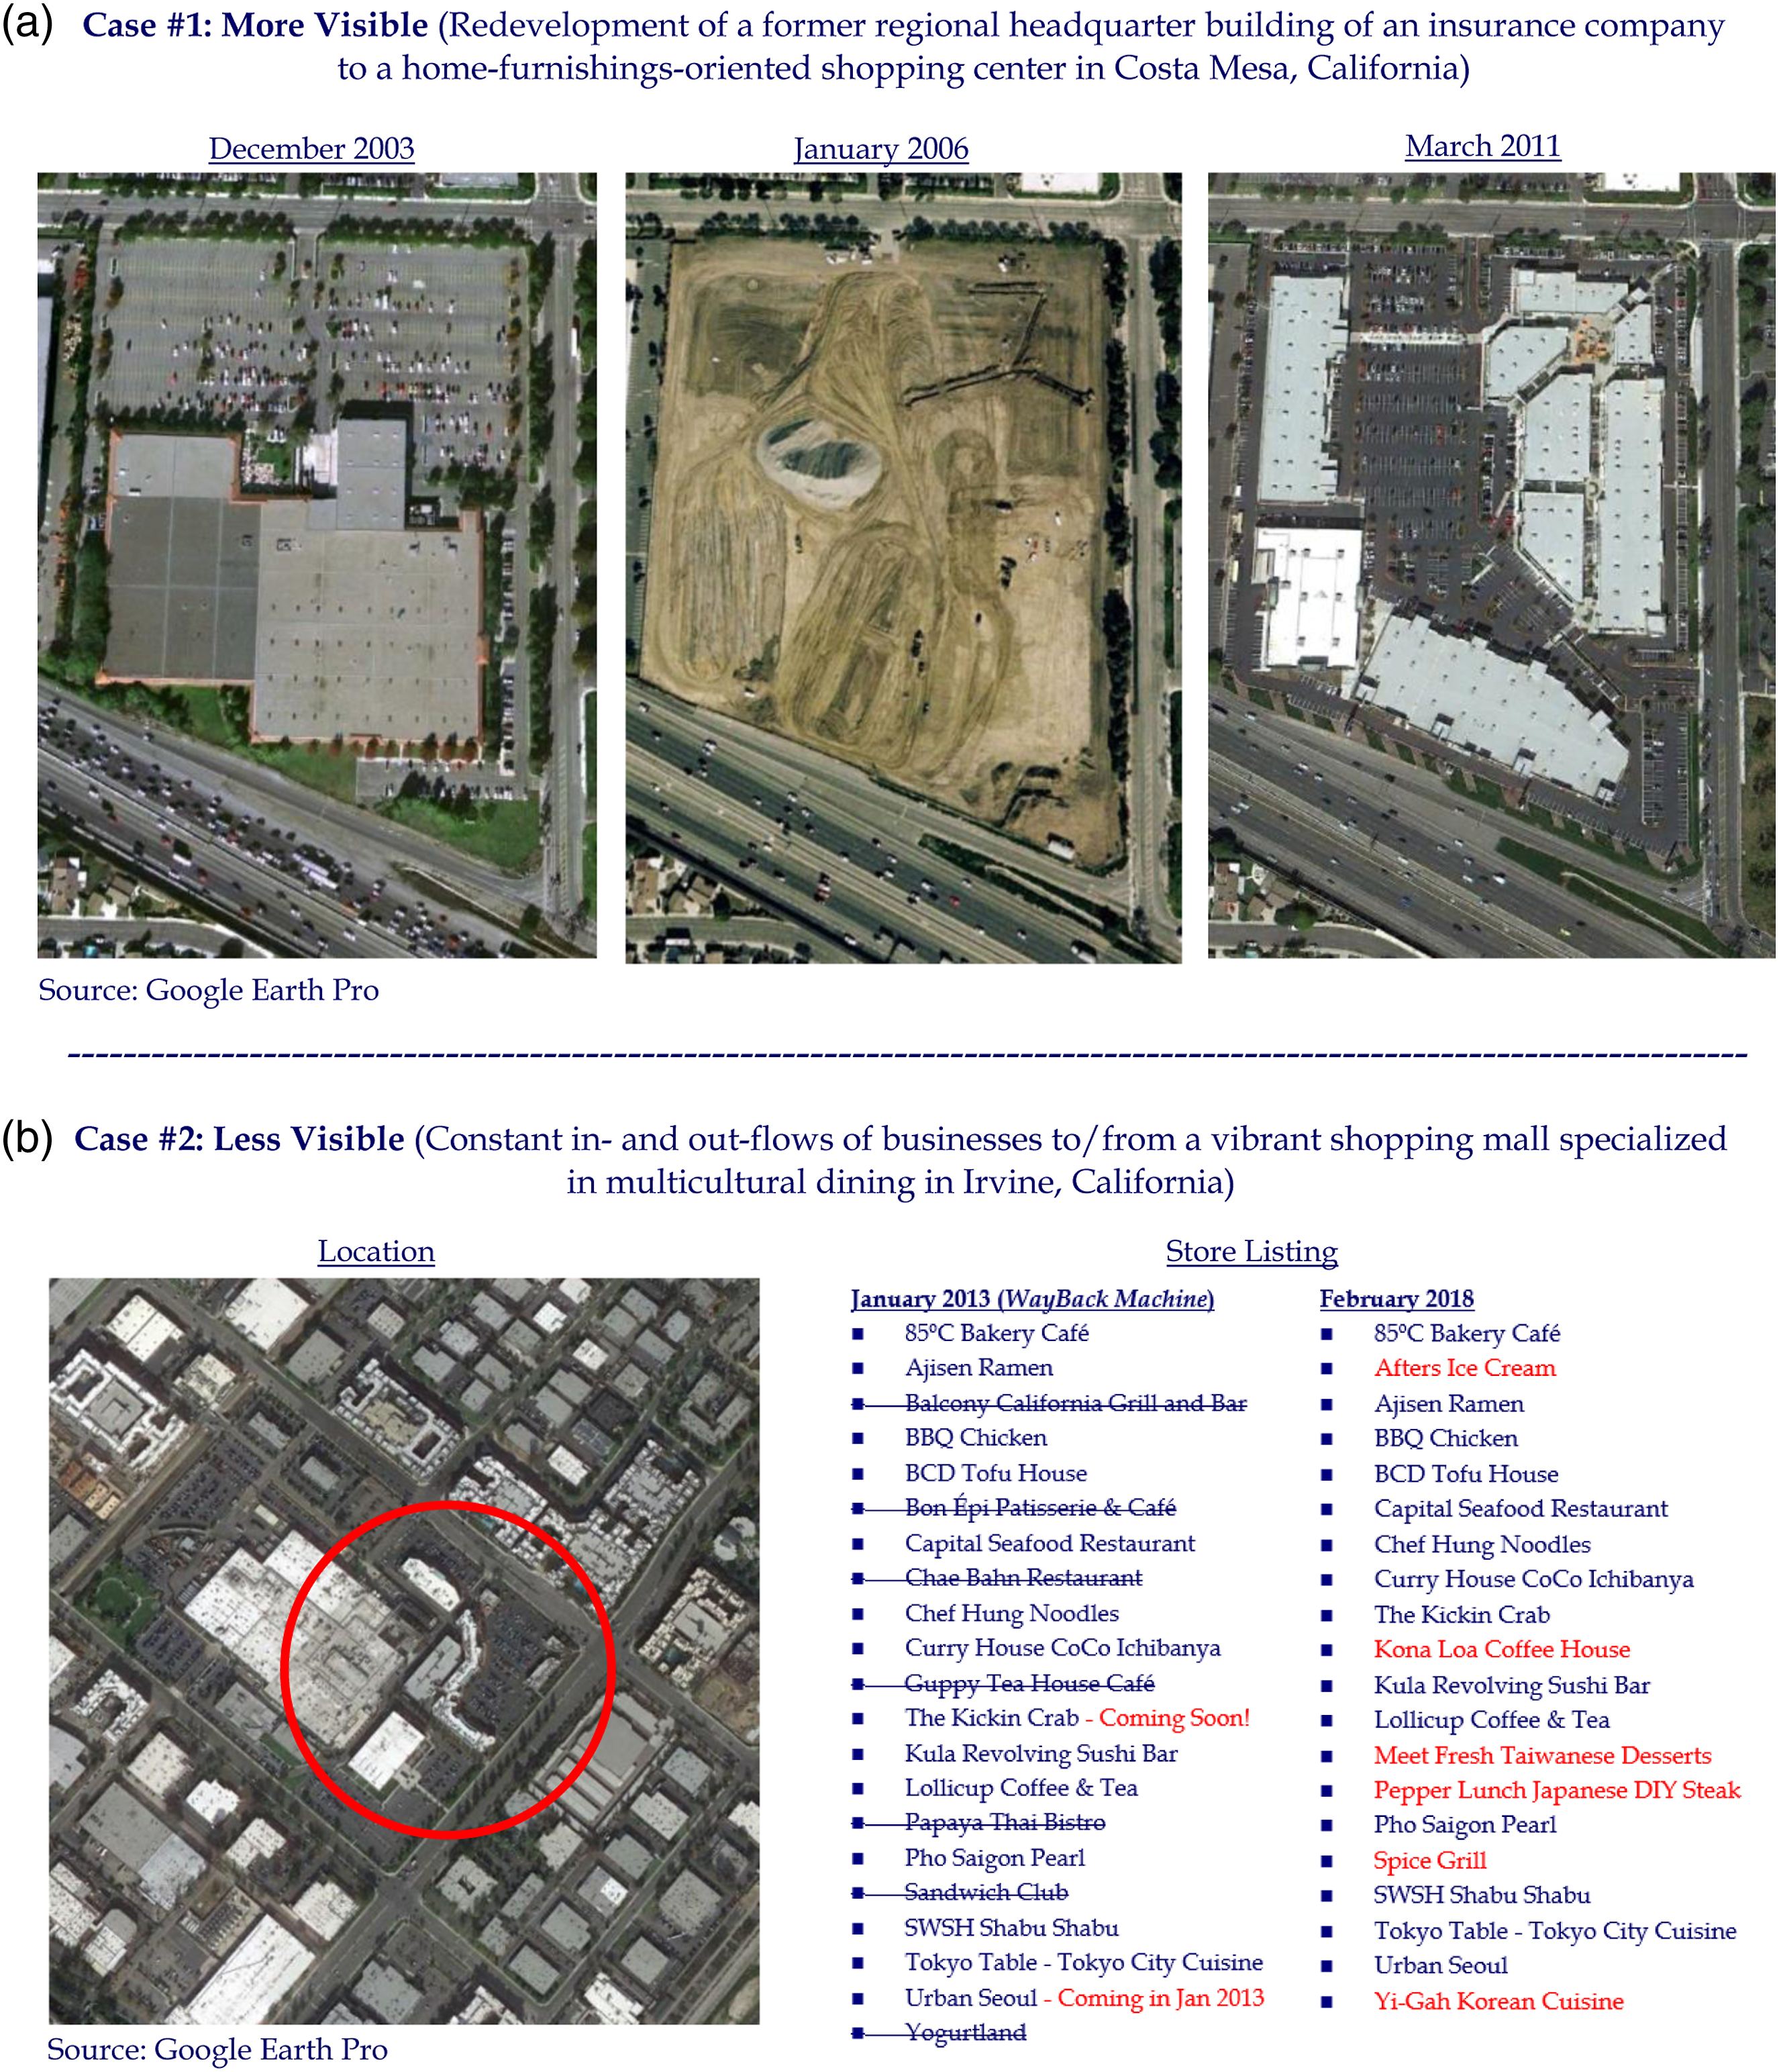
A growing number of studies have investigated the nature and extent of this churning process, while the literature has long tended to focus on net change figures in dealing with local or regional economies. For instance, Davis and Haltiwanger (1991) provided an early attempt to measure business churning at the establishment level with a focus on the US manufacturing sector from 1972 to 1986. Using a longitudinal data set that enabled them to analyze the creation and destruction of jobs and the rate at which jobs were reallocated within the manufacturing sector, the authors found that on average, the sector’s gross job creation and destruction rates were approximately 9.2 and 11.3 percent per year, respectively. These high rates of job creation and destruction indicated that job reallocations took place rapidly. Moreover, the authors reported that (1) a larger proportion of job creation and destruction persisted at least 1 year; (2) job destruction tended to be highly concentrated; and (3) there was a considerable degree of heterogeneity across employers that underlay job reallocation dynamics.
Burgess et al. (2000) also studied the churning process using an employer-level panel dataset. They found that in nonmanufacturing sectors, the quarterly churning rate was approximately 19 percent, whereas that of manufacturing was around 11 percent. In addition, churning flows were found to account for a large proportion of the entire worker flows and somewhat dominate labor market dynamics. According to the authors, however, the relationship between job and worker flows is dynamic in nature and appears to be complex. In another study, Burgess et al. (2001) investigated the employer-level churning dynamics to understand whether firms tended to grow by increasing hires or reducing separations. They reported that “all firms [including both declining and growing firms] almost all the time are simultaneously hiring and experiencing separations. Or, put differently, churning is a ubiquitous feature of the labour market” (Burgess et al. 2001, 12). But again, the detailed relationship between hires and separations varied by employer and, more broadly, by industry.
Some recent studies have also attempted to examine the implications of business churning. For example, using longitudinal quarterly unemployment insurance data from West Virginia, Spletzer (2000) provided an empirical investigation of how births and deaths of business establishments could contribute to job creation/destruction and net employment growth and reported that establishment births/deaths accounted for a non-trivial proportion of the total number of new or eliminated jobs. More specifically, results indicated that nearly 19 percent of quarterly job creation and destruction (and over 50 percent of triennial job creation and destruction) could be explained by the churning process, namely establishment births and deaths in the economy. Moreover, he found that the job creation attributable to establishment births and deaths largely varied across industries.
Davis et al. (2008) viewed churning as a process of economic restructuring needed for productivity growth. Other economists have also regarded it as a shift toward a more efficient allocation of labor in an economic system. For instance, in Lazear and Spletzer (2012), churning was described as labor movement to higher valued uses. Using the Job Openings and Labor Turnover Survey microdata, they estimated how much a recession-induced decrease in churning would cost, due to the slower upward movement of labor, finding substantial cost, “about two-fifths of a percentage point of GDP annually throughout the three-and-one-half year period since the beginning of the recession” (Lazear and Spletzer 2012, 1). It has also been contended that a high turnover rate does not necessarily affect workers’ well-being adversely because job insecurity or uncertainty can be compensated by a wage increase, the so-called compensating wage differentials (see e.g., Böckerman et al. 2011).
However, while increasing attention has been directed to business churning as discussed above, existing research tended to focus on the implications for aggregate-level economic growth or labor markets with one notable exception: Meltzer and Capperis (2017) providing an investigation of neighborhood-level retail churning in New York City. Little is known about the detailed spatial characteristics of this important restructuring process, in part due to the limited data availability. Furthermore, it has remained unanswered how business churning can affect the area (neighborhood) where it occurs.
One could imagine some immediate consequences that are likely to take place in the form of economic changes (e.g., employment increases or decreases), but churning can have much broader impacts on the workings of urban neighborhoods. Rapid job turnovers can lead to a significant increase in residential mobility (Kim 2014). Studies on whether jobs follow people or people follow jobs have also suggested that economic restructuring can have large implications for residential dynamics, while the connection may depend on various factors (see e.g., Hoogstra et al. 2017; Kim and Hewings 2013; Mulligan et al. 1999). This is why there have been rising concerns about reduced sense of community or increased neighborhood instability associated with business churning, as briefly mentioned in the introduction.
In reality, such (potential) consequences of rapid churning can be realized in the form of housing vacancies. Vacancies – an important indicator of neighborhood (in)stability – often occur as an outcome of residential turnovers. Whereas residential turnovers most commonly result in new residents moving into the unit—and thus not a vacancy— the turnovers that occur in neighborhoods in transition or decline can lead to an increase in vacancies. Thus, although influenced by multiple factors, housing vacancies can also be indicative of the trajectory of neighborhood change, particularly urban neighborhood decline or abandonment (see e.g., Accordino and Johnson 2000; Bentley et al. 2016; Morckel 2014).
It is important to note that housing vacancies can further reinforce a certain pattern of neighborhood change. There is a large literature looking at the negative consequences of vacancies for urban neighborhoods. One body of research – building on social disorganization theory (Shaw and McKay 1942) – has shown that vacancy rates are related to increased crime levels in the neighborhood (see e.g., Boessen and Hipp 2015; Cui and Walsh 2015; Hipp, et al. 2017). In some circumstances, vacant units create opportunities for people to gather informally, which can result in activity that other neighborhood residents find objectionable, and such a sign of disorder can give residents a sense that there is little cohesion in the neighborhood and that therefore the neighborhood lacks the collective efficacy to address problems in the neighborhood, such as crime. Besides an increase in crime, this can also raise the likelihood of residential mobility out of the neighborhood, mobility thoughts, and further abandonment or vacancy increases (see e.g., Hipp 2010; Lee et al. 1994).
Vacancies may also be related to revitalizing neighborhoods. Whereas neighborhoods that are fully gentrifying typically are experiencing falling vacancy rates, numerous studies have shown that neighborhoods with more vacancies are more likely to subsequently experience gentrification (Hwang and Sampson 2014; Hwang 2016; Lee and Newman 2021). Likewise, studies have found that majority black neighborhoods that gentrify tend to have higher vacancy rates (Hwang and Ding 2020; Rucks-Ahidiana 2020). It may also be that in the earliest stages of gentrification, housing is purchased and may sit empty for a period of time as renovation is occurring. All of this indicates that vacancies play an important role in the transformation of neighborhoods.
Given the importance of vacancies for bringing about various sources of change in neighborhoods as well as representing neighborhood (in)stability, we examine how business churning might be associated with neighborhood-level housing vacancy rates. By doing so, this study attempts to provide useful insights into the profound implications of business churning processes, while leaving to future research how this churning may have additional consequences for neighborhoods via other variables. In the following sections, we measure the varying degree of churning within a large urbanized area and analyze how it is associated with housing vacancy rates.
Study Area and Data
In this study, we focus on the Los Angeles—Long Beach—Santa Ana, CA Urbanized Area. With over 12 million residents, the study region is the second largest urbanized area in the US (after the New York—Newark, NY—NJ—CT Urbanized Area) and contains 2704 census tracts having their centroids falling in the urbanized area boundaries. While most of the census tracts are in Los Angeles County, the region also covers parts of Orange and San Bernardino counties. This area (or the Southern California metropolitan region, more broadly) is also known for its polycentric spatial structure, having a number of distinct employment centers (see e.g., Giuliano and Small 1991; Kane et al. 2018).
Dependent Variable
For this large, urbanized area, we constructed a census tract-level dataset using multiple sources of information for two points in time: 2000 and 2010. The outcome measure used as a proxy of neighborhood stability in this study’s multivariate regression was housing vacancy rates. As explained in the previous section, housing vacancies can be ascribed in part to residential mobility and household relocations which are here hypothesized to be triggered by rapid business churning processes. This measure has also been known to be a useful indicator of urban neighborhood decline or abandonment.
Another key advantage of using this variable is the availability of reliable data at a small-area level. In the U.S., housing vacancies have been thoroughly investigated through the decennial census. Alternative measures of neighborhood stability, such as residential mobility, cannot be perfectly operationalized at the same disaggregated level due to limited data availability. While the Census data products reveal what percentage of people residing in a neighborhood move their place of residence for a certain period of time (based on a smaller sample size), they do not provide detailed information about where these movers came from. Moreover, due to the replacement of the decennial census (long form) by the American Community Survey, it is difficult to develop such alternative measures in a consistent fashion for both pre- and post-2000 periods.
Business Churning and Other Explanatory Variables
We utilized the ReferenceUSA longitudinal business dataset (Infogroup 2015) which provided a range of detailed information about individual business establishments in the U.S., including the size, location, and industry codes, beginning in 1997. The business establishment street addresses were geocoded to generate spatially-explicit point data which enabled us to capture the annual rise and fall of various types of business establishments with high spatial precision. The geocoded data points were assembled based on census tract boundaries (Census 2010 definitions) for our investigation of neighborhood-level churning processes.
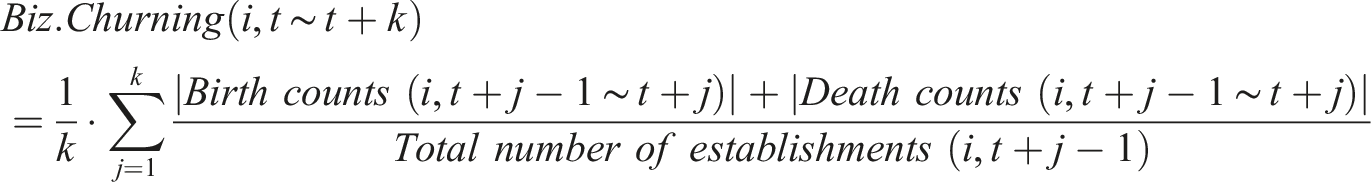
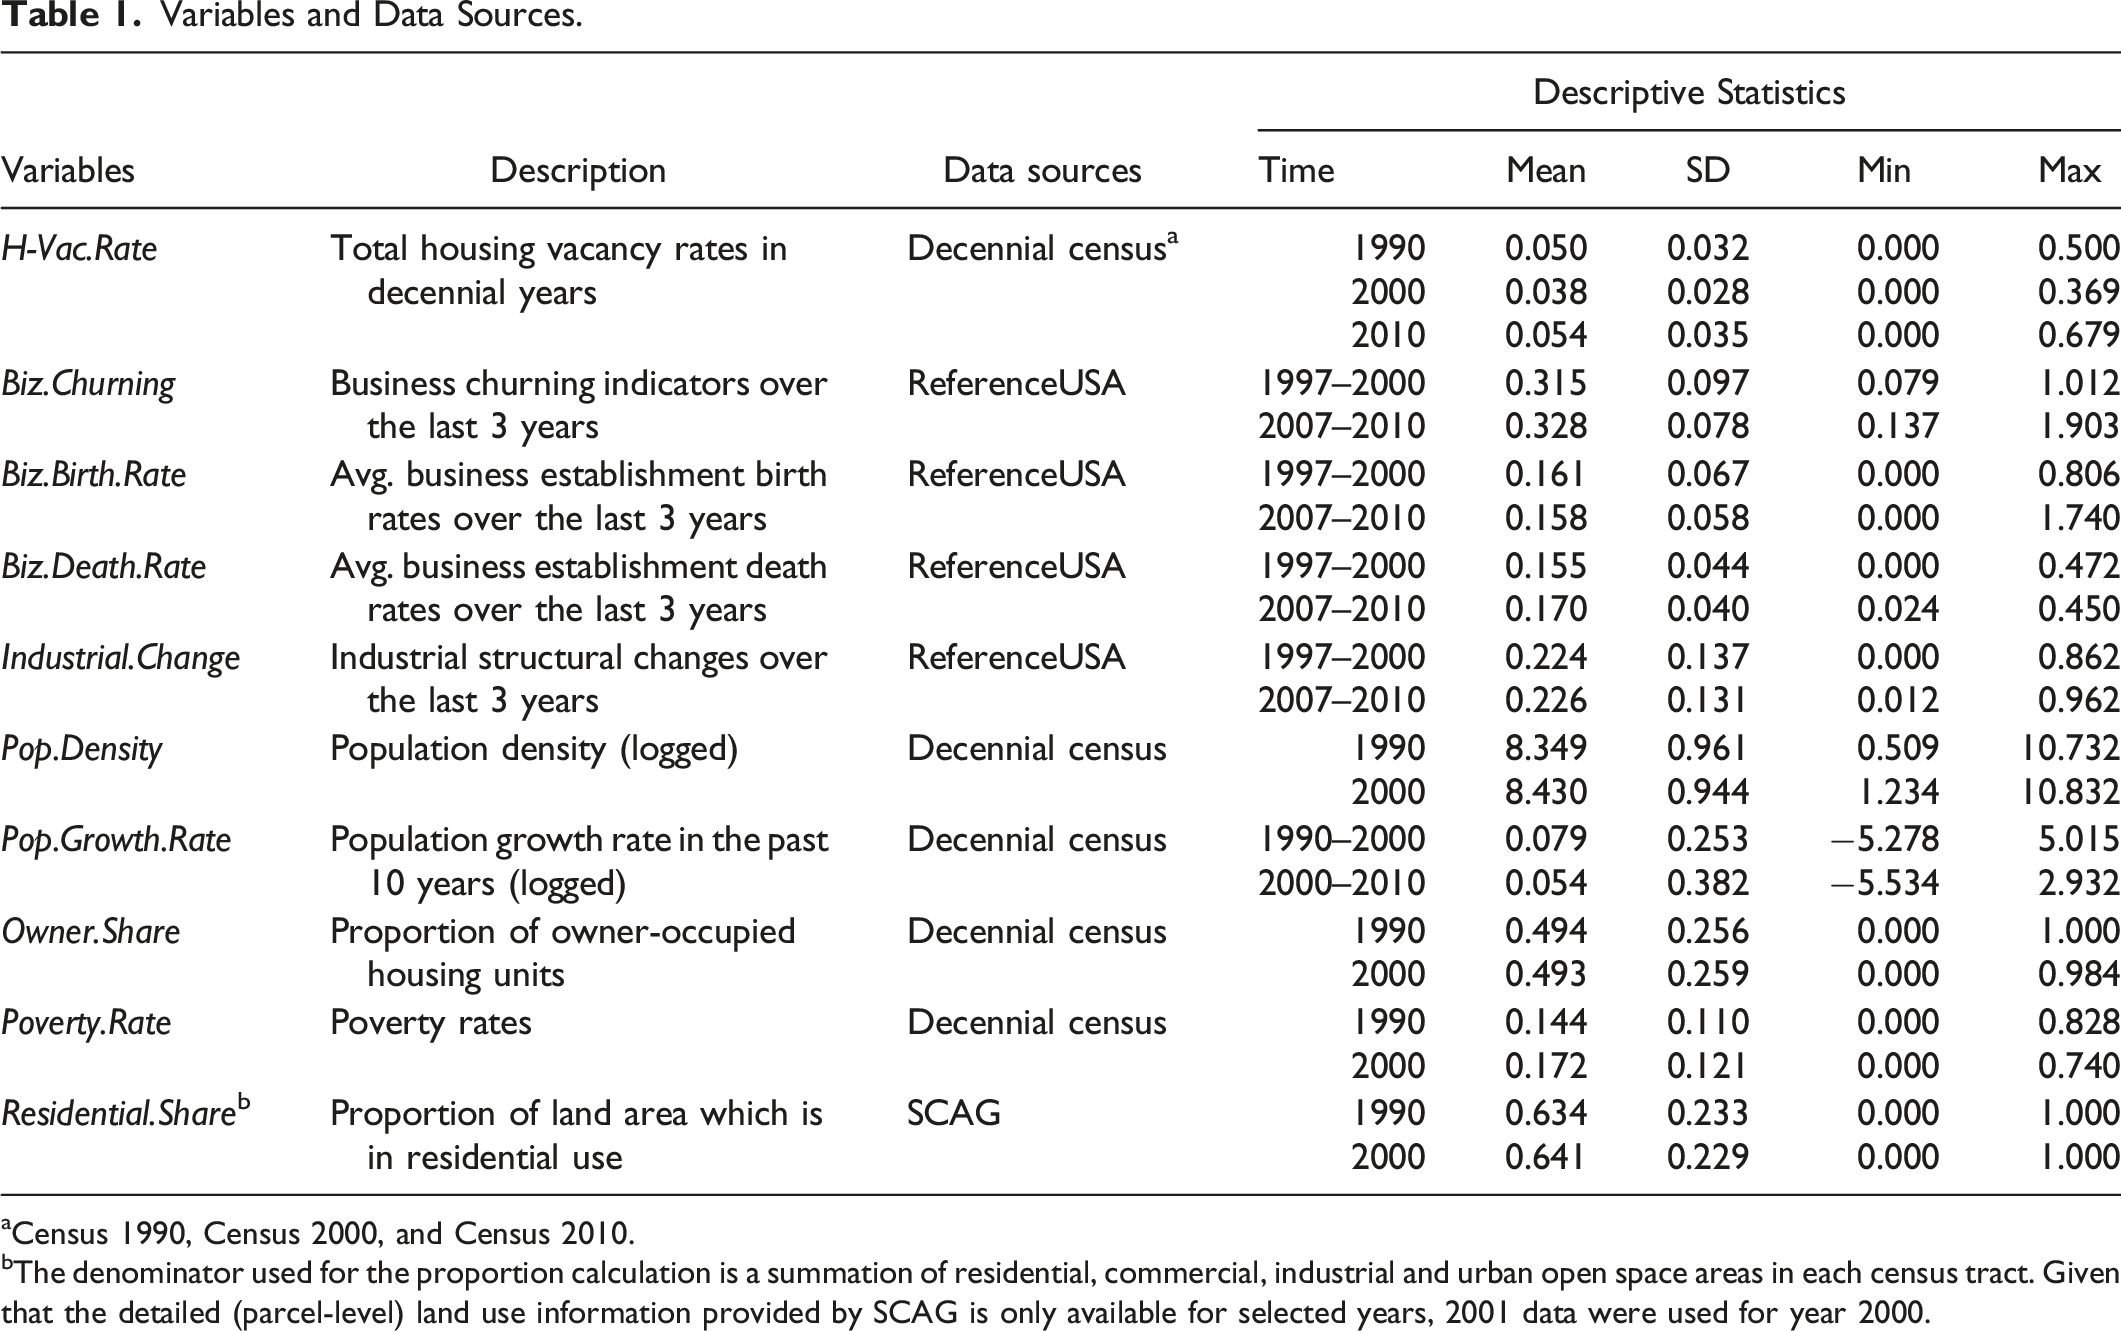
Using the business establishment data, we quantified the degree of tract-level business churning by employing two sets of metrics. Our first measure of churning (Biz.Churning) indicates the extent to which business establishments were created or eliminated in a neighborhood over a certain period of time (specifically, a 3-year period prior to the end of the decade – 1997–2000 for 2000 and 2007–2010 for 2010– in this study). In other words, it took into account both establishment births and deaths as done in some recent studies, such as Meltzer and Capperis (2017). This metric was computed for each neighborhood (denoted by i) by calculating the average of yearly churning between year t and t + k (e.g., 1997 and 2000), as shown below.
This index can be decomposed into establishment birth rates (Biz.Birth.Rate) and death rates (Biz.Death.Rate) in the neighborhood, and we tested an alternative multivariate regression model by replacing Biz.Churning with Biz.Birth.Rate and Biz.Death.Rate in order to assess whether one of these two elements of churning might have a stronger impact on housing vacancy rates.
Business churning can take place across industrial sectors, but some neighborhoods may exhibit a high level of churning due to rapid establishment turnovers within a single sector (e.g., replacement of one retailer by another retail store). To discern the difference between these two situations, we employed another churning indicator (Industrial.Change) which represents the degree of employment reallocation that takes place across 2-digit NAICS (North American Industry Classification System) sectors. This approach has been used in some (aggregate-level) studies in the literature focusing on the concept of industrial churning to measure the extent to which job opportunities moved from one sector to another (see e.g., Duranton 2007; Findeisen and Suedekum 2008). Here, using the employment counts for individual establishments in the ReferenceUSA data, we constructed the metric as follows (where

Industrial.Change gave us a value between 0 (no change in the neighborhood’s industrial structure in terms of employment distribution across sectors) and 1 (a neighborhood loses all employment in the sectors with jobs in year t and gains employment exclusively in other sectors between t and t + k).
In addition, we used decennial Census data to capture varying neighborhood characteristics that were found to be associated with housing vacancy rates in existing studies. Among others, we considered the proportion of owner-occupied housing units, since there is likely to be a significant gap between homeowners and renters in their residential mobility and housing vacancy rates (see e.g., Bentley et al. 2016; Dow 2011; Newman et al. 2016; Quigley and Weinberg 1977). Poverty and population growth rates were also taken into account to control for their effects on vacancy rates (see e.g., Immergluck 2016; Wang and Immergluck 2019). These variables were constructed for 1990 (or 1990–2000 for population growth rates) for the models explaining the level of vacancies in 2000, and in 2000 (or 2000–2010 for population growth rates) for the models explaining housing vacancies in 2010 to avoid endogeneity issues. We also took advantage of the detailed land use information provided by the Southern California Association of Governments (SCAG) to create a measure of the proportion of residential area in each neighborhood.
Variables and Data Sources.
aCensus 1990, Census 2000, and Census 2010.
bThe denominator used for the proportion calculation is a summation of residential, commercial, industrial and urban open space areas in each census tract. Given that the detailed (parcel-level) land use information provided by SCAG is only available for selected years, 2001 data were used for year 2000.
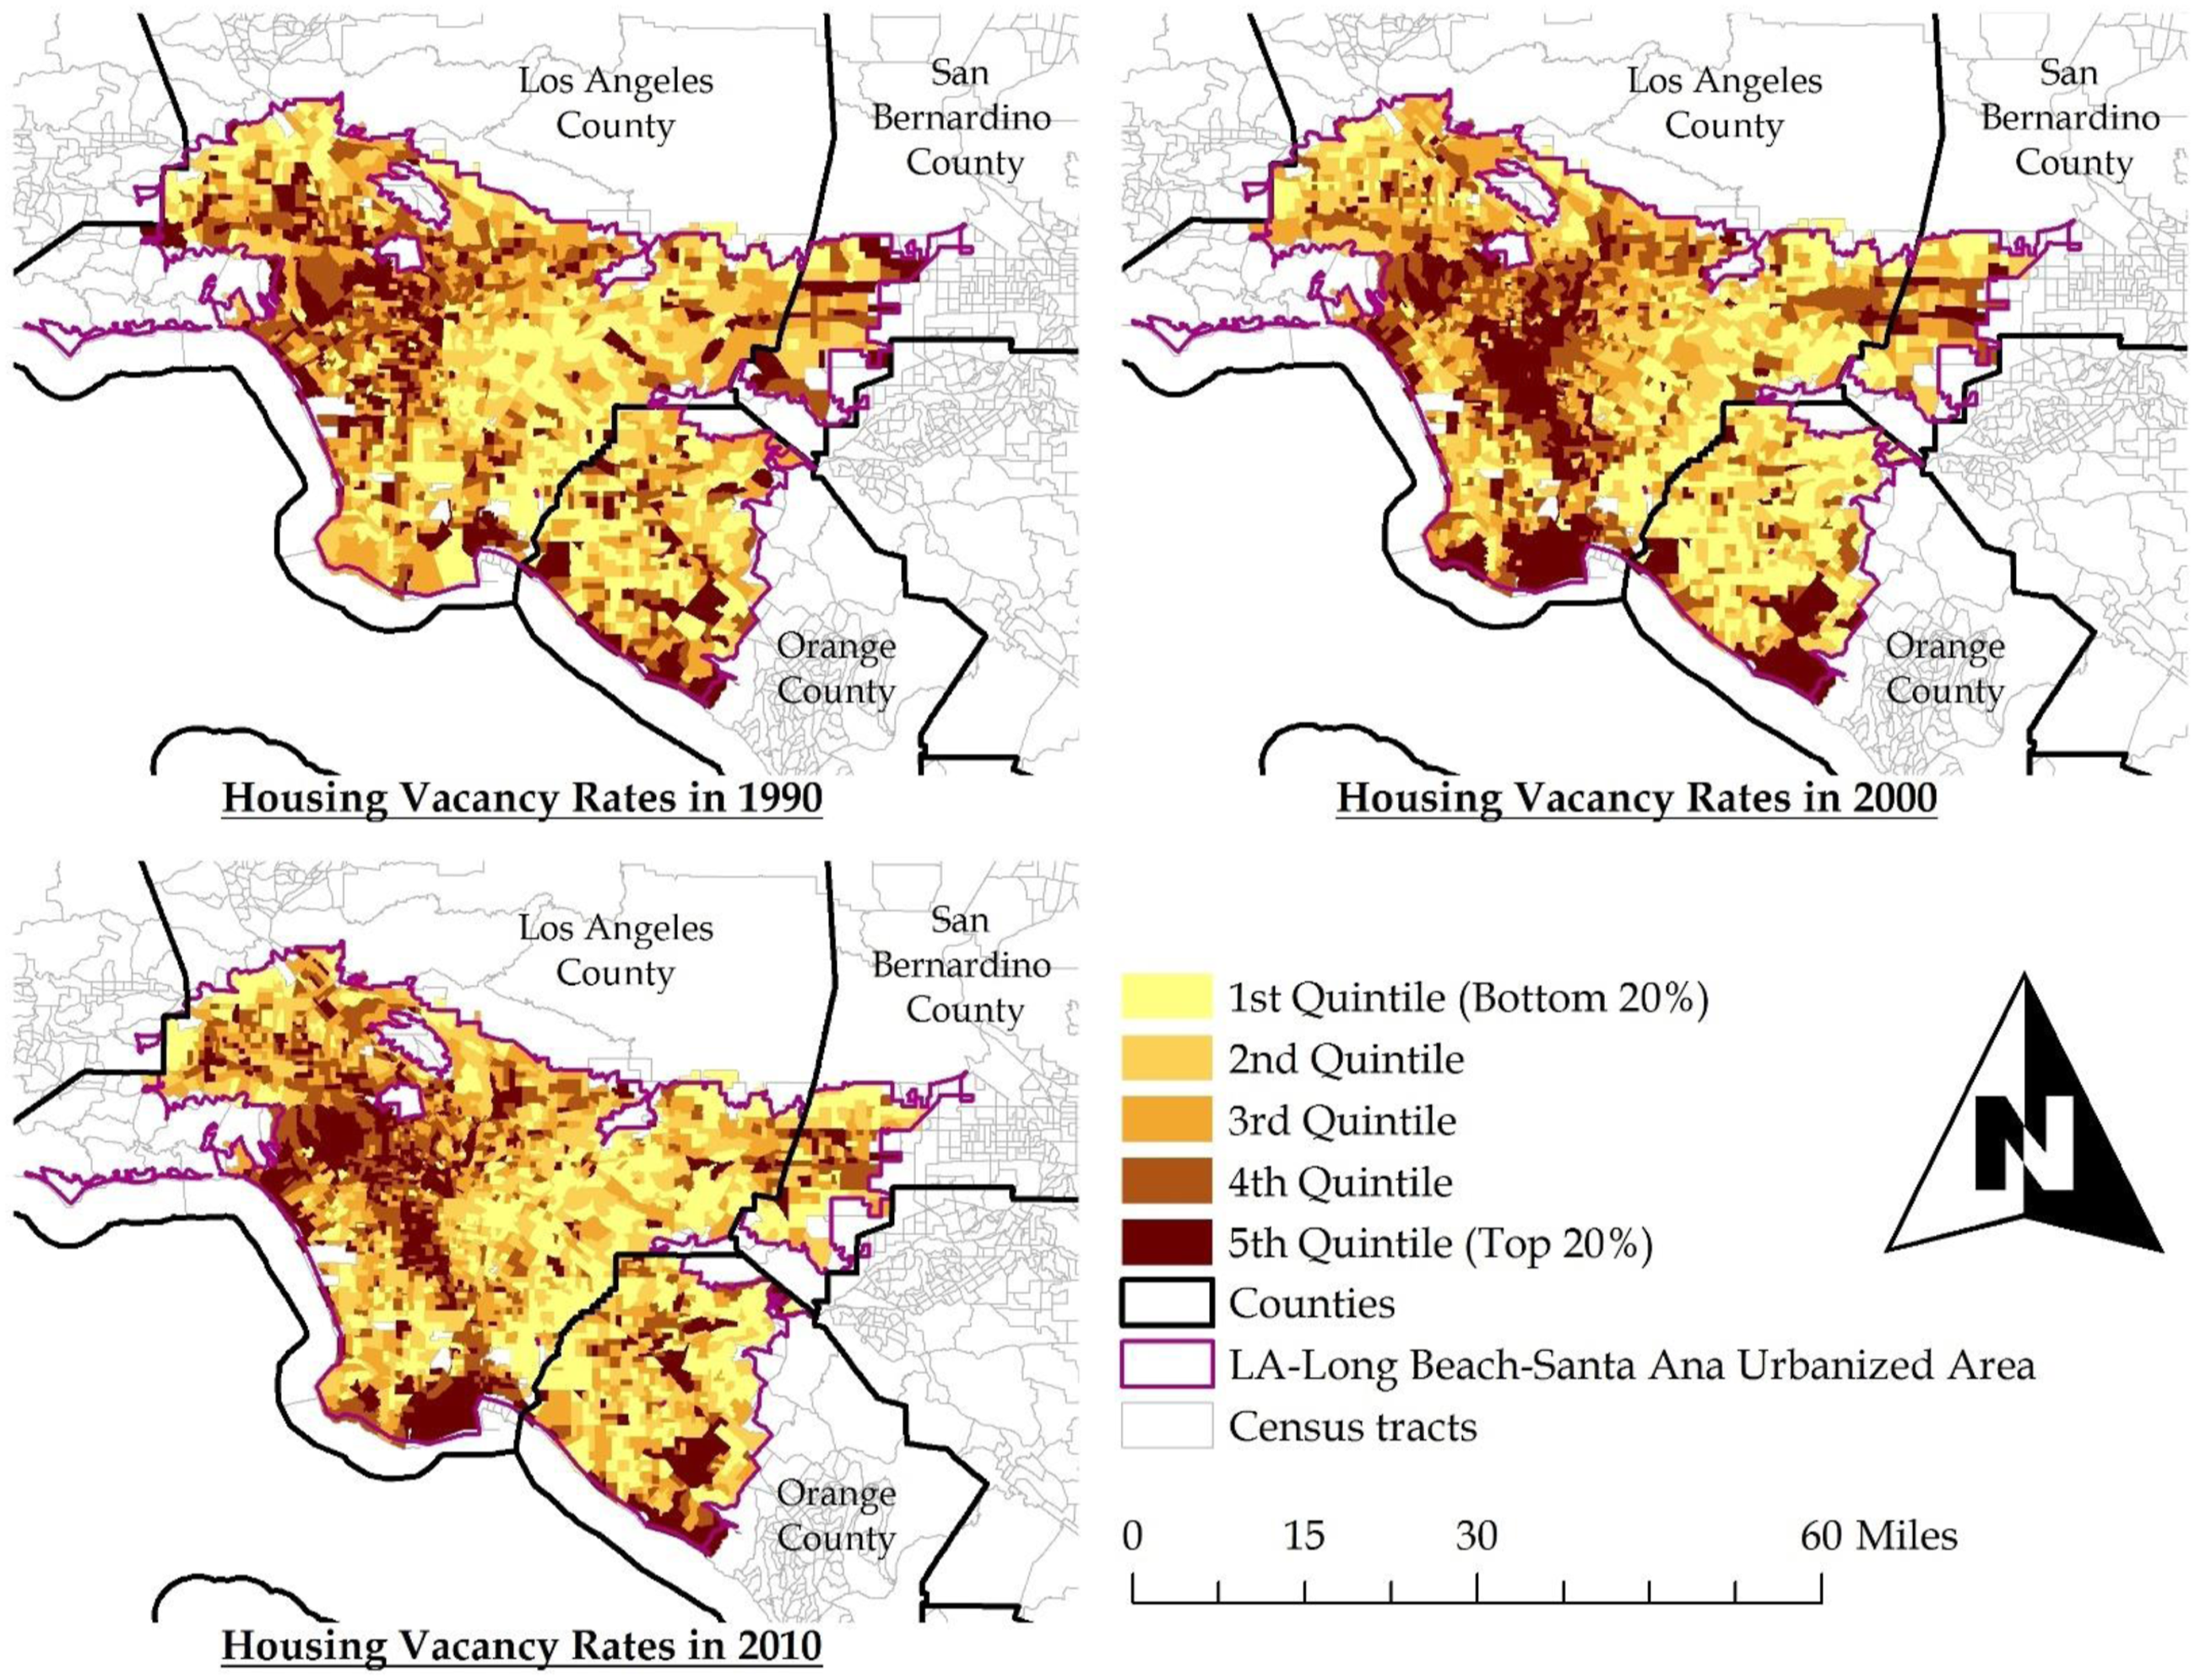
Spatial distribution of housing vacancy rates.
Methods
To explore our research questions, we carried out two sets of analyses. First, we conducted a set of exploratory analyses to examine the spatial patterning of business churning and its change over time. More specifically, for each tract, we identified its relative position in terms of the degree of business churning (e.g., top 20 percent, …, bottom 20 percent) in 1997–2000 and that in 2007–2010. We then investigated to what extent high-churning tracts (top 20 percent) in the late 1990s continued to show a similarly high level of churning (remained in the top 20 percent) in 2007–2010. We further analyzed whether this probability (and the probabilities of transition from one quintile to another) was associated with the level of churning in adjacent tracts. These exploratory analyses intended to reveal the detailed neighborhood-level patterns of business churning in 1997–2000 and 2007–2010 that allowed for comparing these distributions over time and thus understanding the temporal dynamics of the spatial distribution.
Then, we conducted multivariate regression analyses in which our outcome variable was housing vacancy rates at the end of each decade. In these analyses, we attempted to control for the level of various measures at the beginning of the decade to isolate the effect of business churning on neighborhood-level housing vacancy rates. In this part of our study, an important methodological challenge is the spatial dependence involved in housing vacancies and its association with business dynamics. Tract-level housing vacancy rates, similar to many other socio-economic processes at this geographical scale, tend to be spatially autocorrelated. Furthermore, the vacancy rate in one census tract can impact vacancies in nearby census tracts.
Therefore, we used spatial regression models to examine how business churning might be associated with vacancies. Specifically, as shown below, we employed spatially lagged explanatory variables (SLX), spatial Durbin model (SDM), and spatial Durbin error model (SDEM) specifications (LeSage and Pace 2009). SDM and SDEM imply the presence of global and local spatial spillovers, respectively (LeSage 2014), and “other specifications such as the [well-known] spatial autoregressive (SAR) and spatial error (SEM) are subsumed by these two” (LeSage 2015, 298).


We estimated these models for years 2000 and 2010, respectively, with a (queen) contiguity-based spatial weight matrix. 1 In doing so, we used two model specifications: (i) with Biz.Churning and Industrial.Change and (ii) with Biz.Birth.Rate, Biz.Death.Rate, and Industrial.Change, capturing the varying degree of business churning across neighborhoods. The second specification, in which Biz.Churning was decomposed into establishment births and deaths, enabled us to see which side of the business dynamics would matter most, whereas the first specification was expected to reveal to what extent the overall increase or decrease in business churning would affect housing vacancies.
Exploratory Analysis Results
Business churning does not exist evenly across Southern California’s urban landscape. Nor is it stable over time periods. Figure 3 indicates far different spatial patterning in churning during 1997–2000 versus 2007–2010. In the earlier period, high values of churning were localized in South Orange County, the Palos Verdes Peninsula, the San Bernardino County part of the study area (Figure 3A). During 2007–2010, while some South Orange County tracts still showed fairly high churning values, the areas surrounding downtown Los Angeles and the nearby south-central area experienced the most churning (Figure 3B). Spatial distribution of business churning.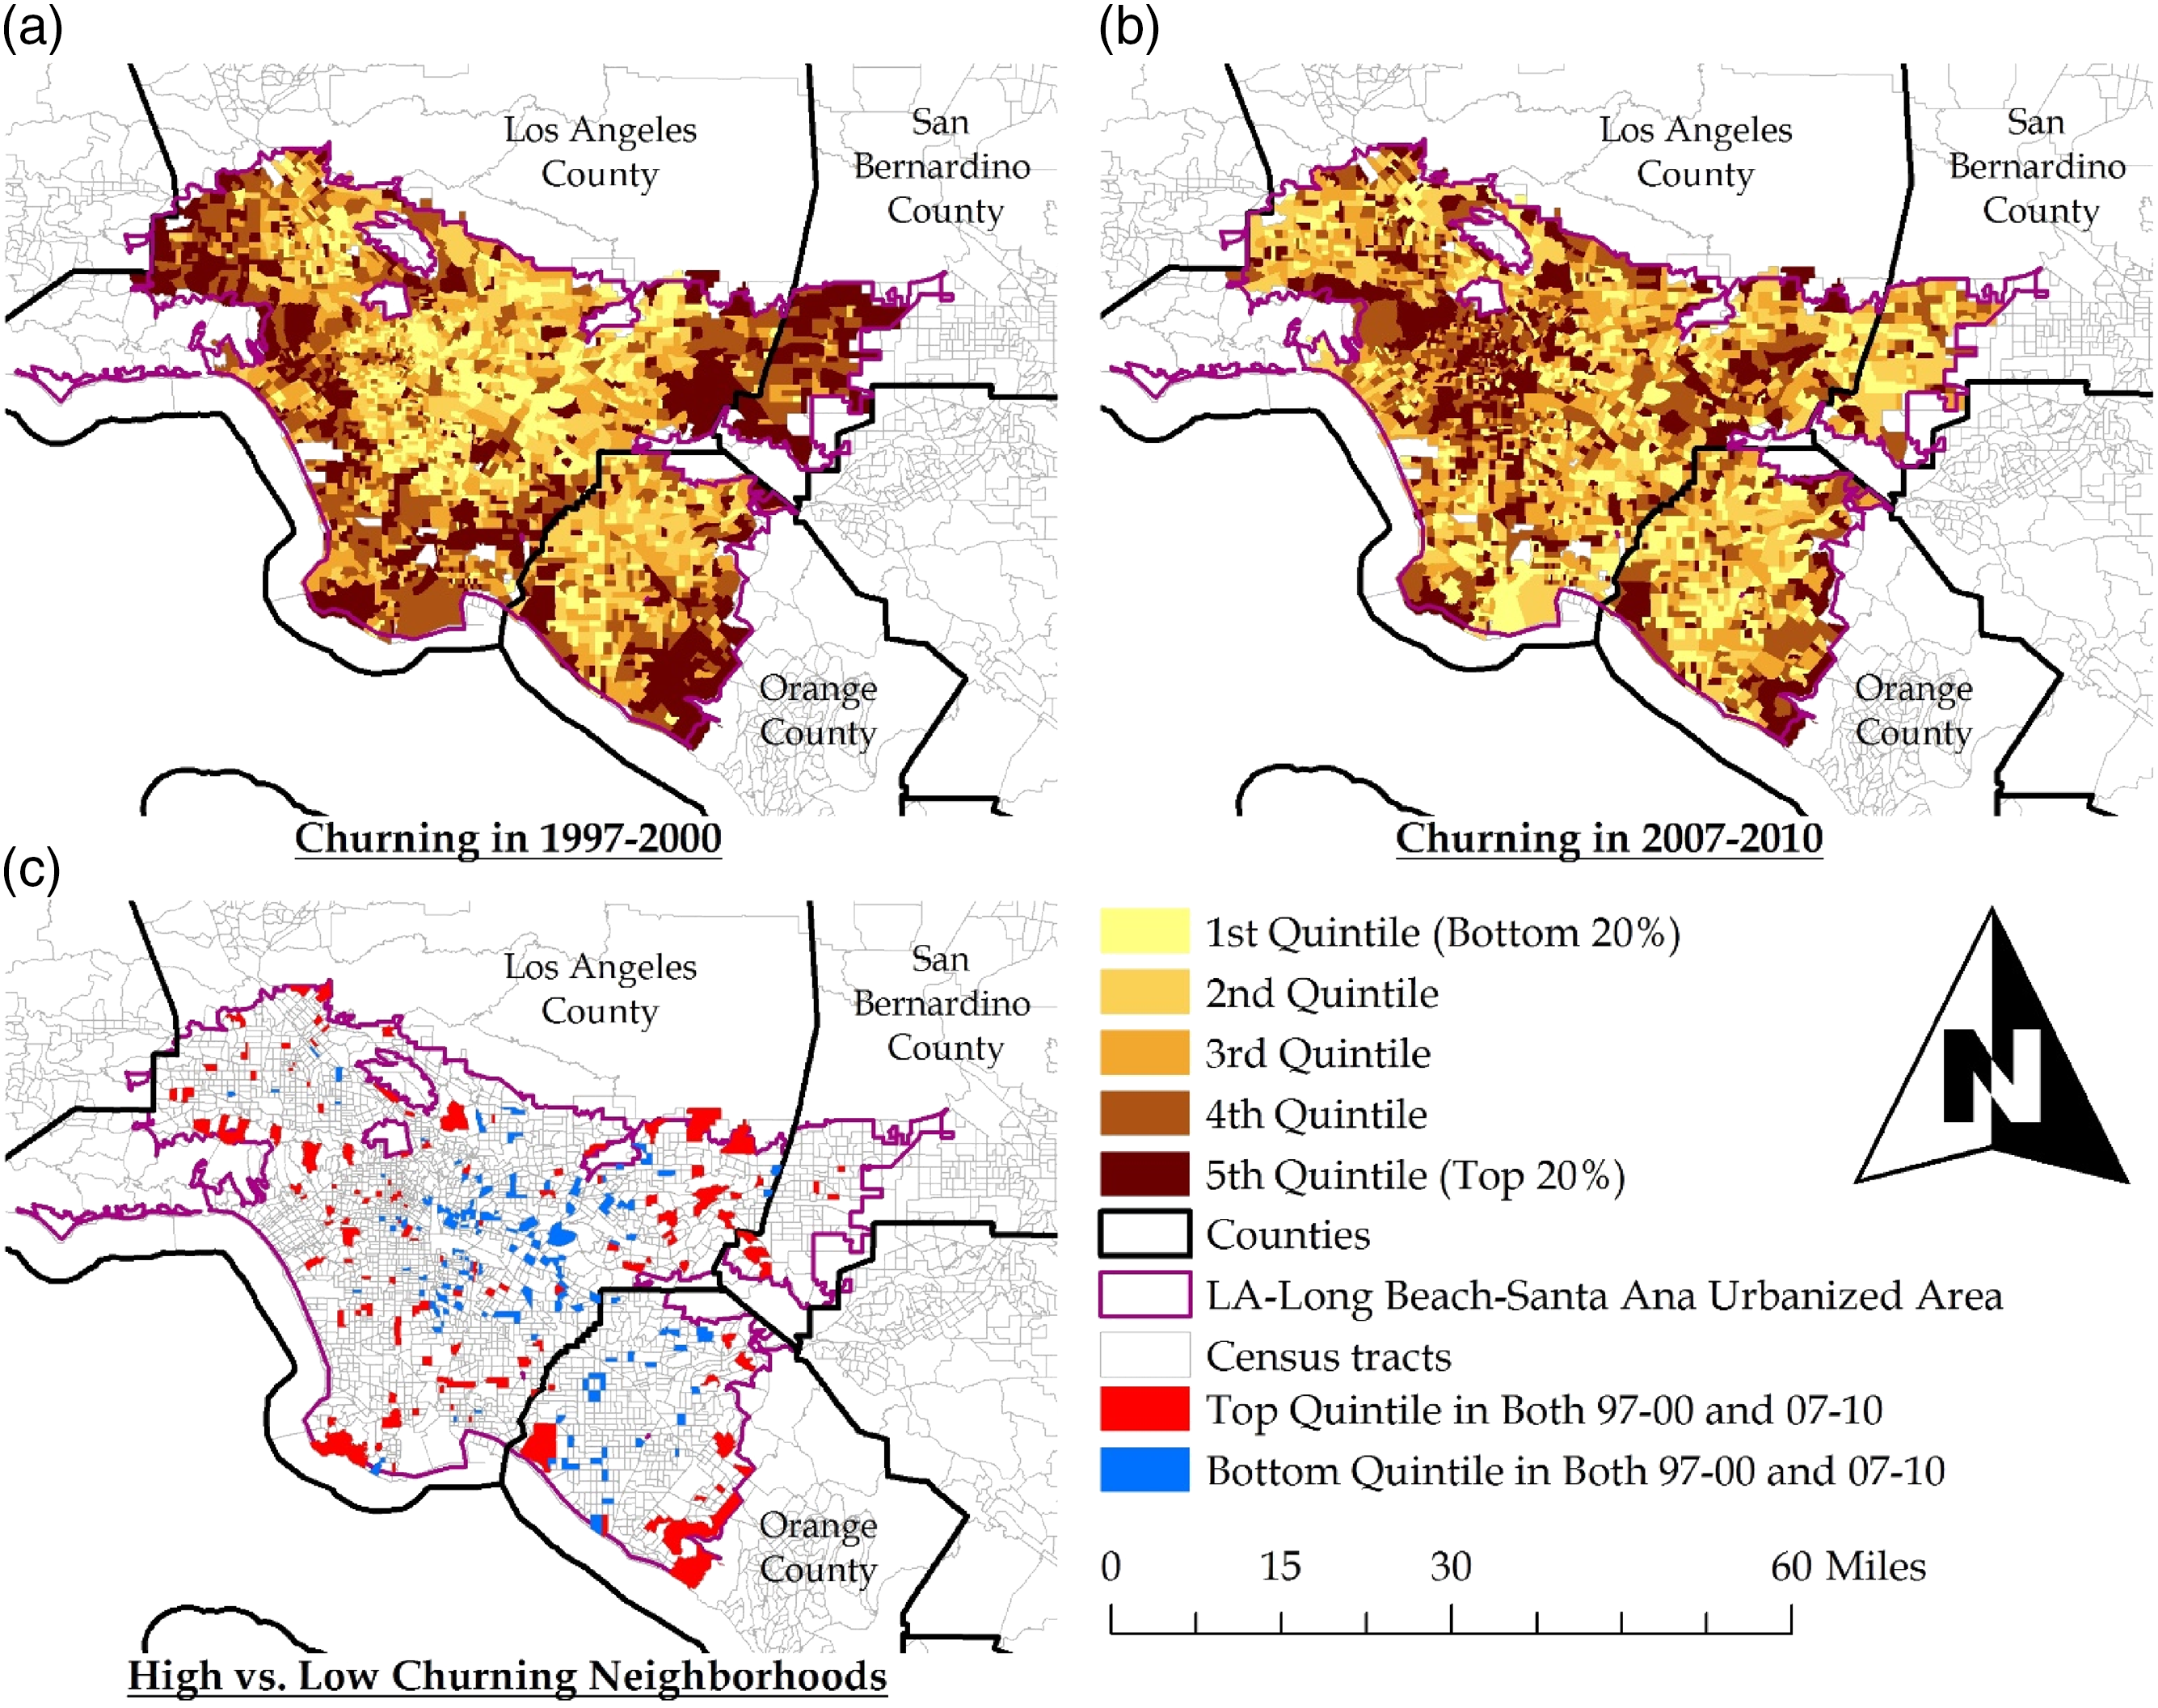
Neighborhood-Level Churning Dynamics – Transition From 1997–2000 to 2007–2010.
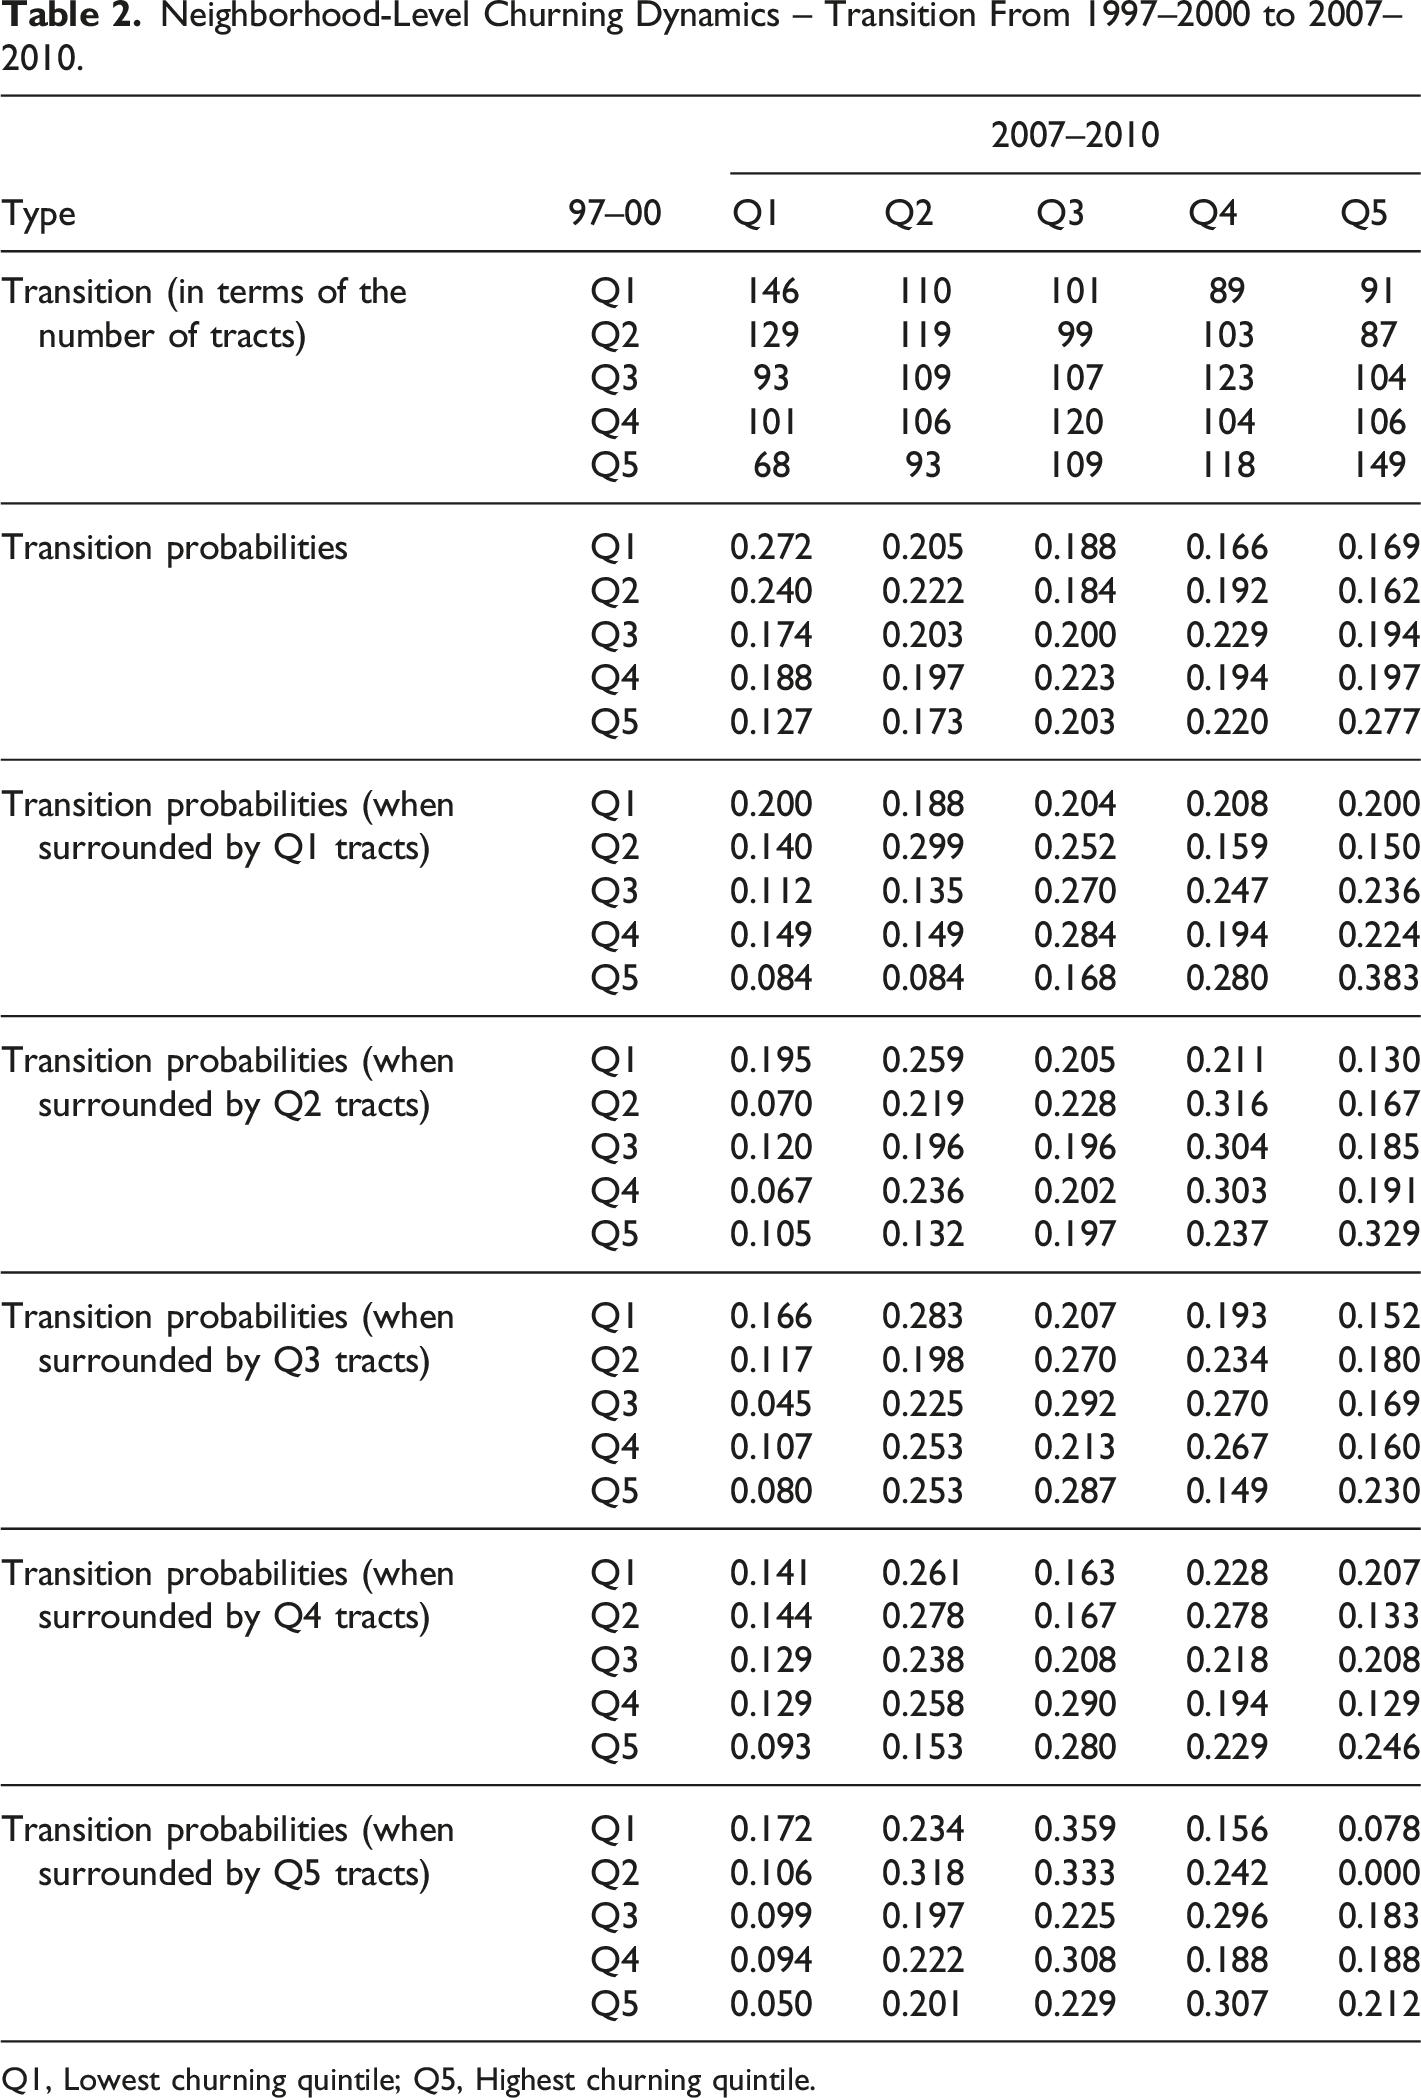
Q1, Lowest churning quintile; Q5, Highest churning quintile.
The probability of experiencing similar levels of churning between time points can also be considered spatially. The bottom part of Table 2 breaks down transition probabilities based on the spatial lag of churning using queen contiguity to identify neighbors. Overall, patterns do not appear to differ dramatically based on the spatial lag of churning. However, the process of remaining a high churn tract appears to be dependent on neighbors. We noted earlier that a tract in the top-churning quintile (Q5) in 1997–2000 had a 27.7 percent chance of remaining high-churning in 2007–2010. However, this probability increases to 38.3 percent if the tract is surrounded by low-churn (Q1) tracts, and it decreases to 21.2 percent if the tract’s neighbors are high-churn (Q5). In other words, persistently high churning is more likely to take place near low-churning neighborhoods. In our study region, this might happen due to the dispersion of entertainment and shopping districts. Many of these areas, showing persistently high churning, are often surrounded by stable neighborhoods without much churning. A chi-square test can be used to evaluate a null hypothesis of random transitions and suggests that only the low-churning neighbor (
Multivariate Regression Results
Model Estimation Results – Year 2000.
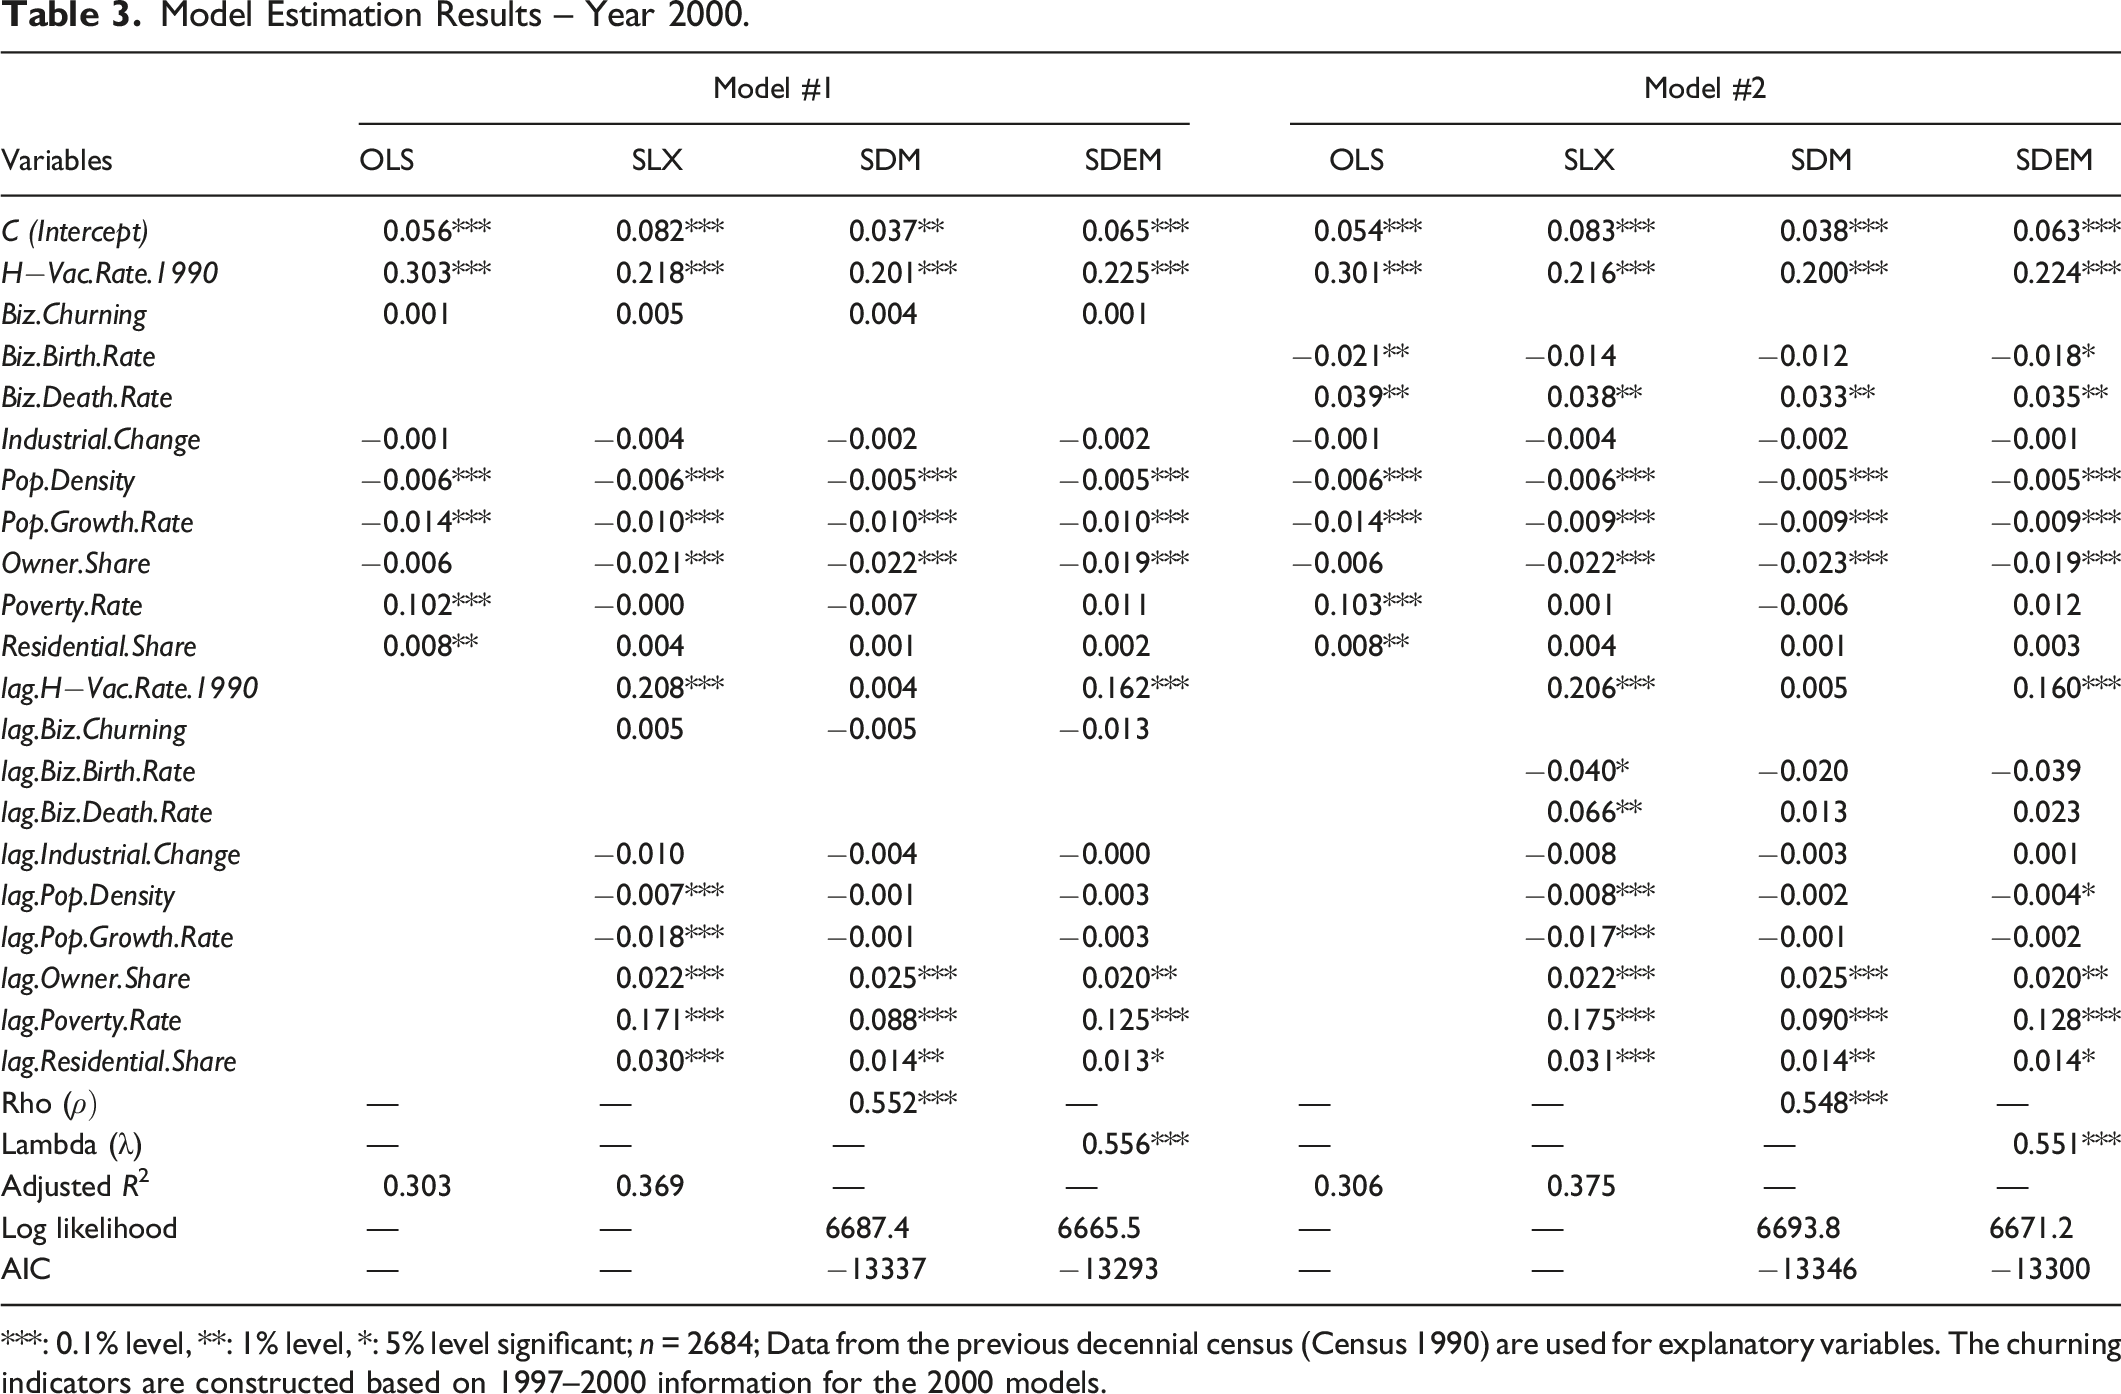
***: 0.1% level, **: 1% level, *: 5% level significant; n = 2684; Data from the previous decennial census (Census 1990) are used for explanatory variables. The churning indicators are constructed based on 1997–2000 information for the 2000 models.
As shown in the table, the results from our analysis of 2000 housing vacancies with Biz.Churning and Industrial.Change show no significant impacts of these two churning indicators on housing vacancy rates in 2000. Instead, the vacancy rate at the beginning of the decade (H-Vac.Rate in 1990) explains a large proportion of the variation in the dependent variable. This is unsurprising as it shows the relative stasis in vacancy rates in neighborhoods across the decade. The positive, significant spatial autoregressive parameter (
When we decompose Biz.Churning into births (Biz.Birth.Rate) and deaths (Biz.Death.Rate), we observe an interesting pattern in the estimates showing that establishment births and deaths have opposite effects on neighborhood-level housing vacancies. More specifically, our SDM estimation results suggest that establishment deaths are highly associated with an increase in vacancies, and the magnitude of this association (+0.033, significant at the 1 percent level, z-value = 2.997) was larger than that of establishment births (−0.012, significant at the 10 percent level, z-value = −1.722). In other words, the same level of new businesses creation would not fully offset the vacancy increase associated with the loss of existing business establishments. The gap still exists, even if the comparison is made in terms of the magnitude of standardized coefficients.
For a more precise interpretation of the regression coefficients from SDM, one needs to consider both direct and indirect effects that occur due to the spatial spillovers and feedbacks involved. 2 The calculation shows that the total effect of Biz.Death.Rate on the dependent variable is approximately +0.102 about two-thirds of which can be viewed as an indirect effect. This magnitude implies that a one standard deviation increase in the neighborhood business death rate is associated with a 0.16 standard deviation increase in the housing vacancy rate in the study region.
Model Estimation Results – Year 2010.
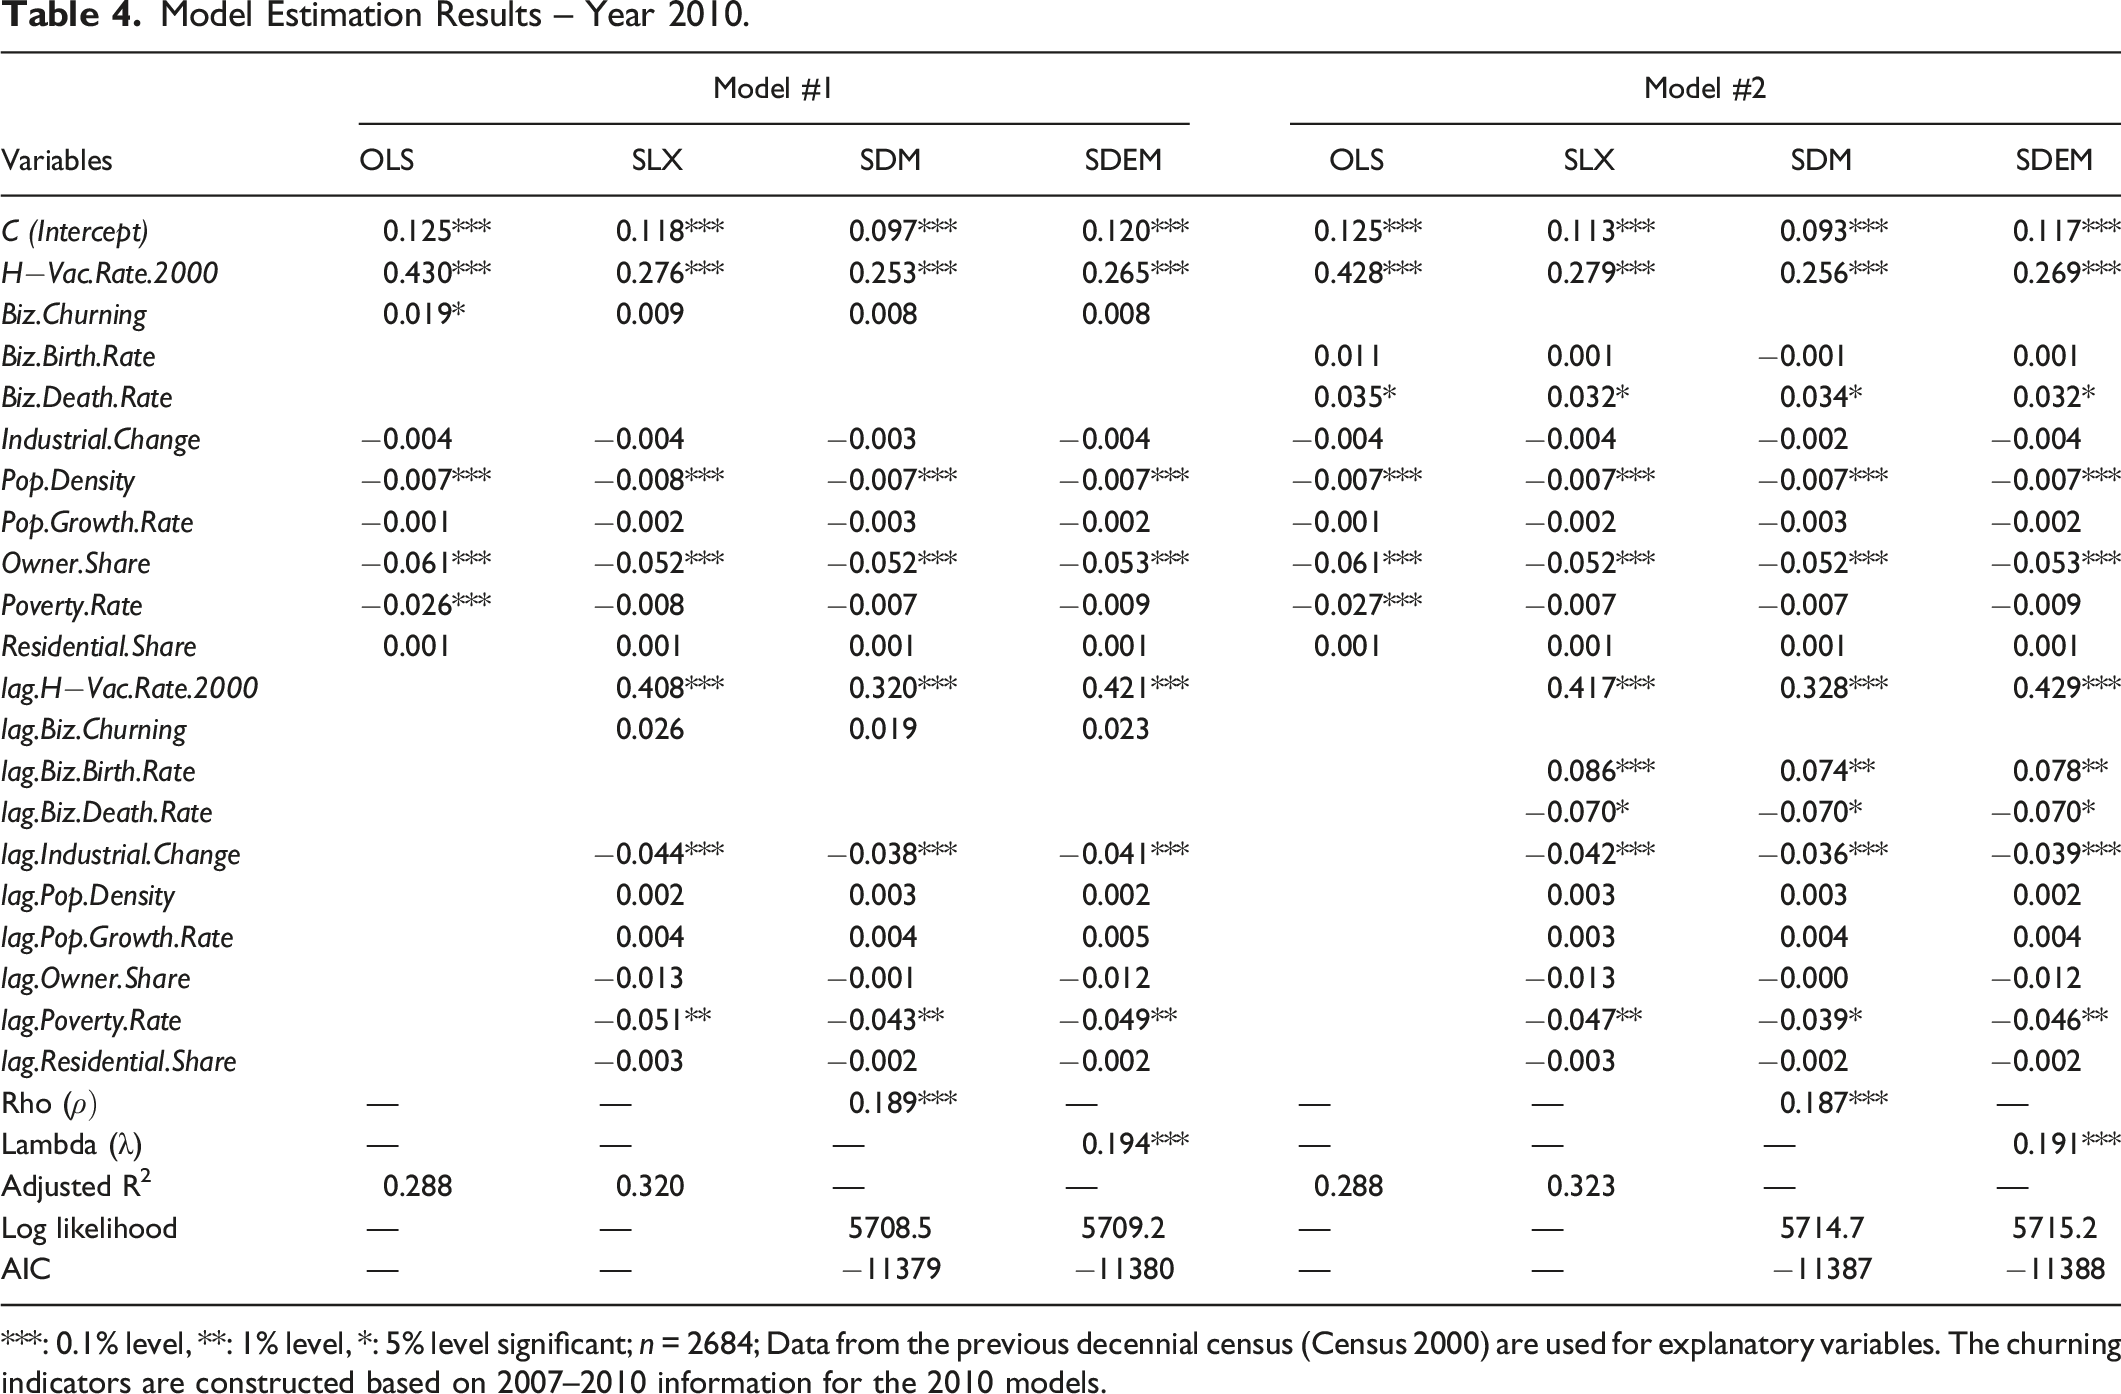
***: 0.1% level, **: 1% level, *: 5% level significant; n = 2684; Data from the previous decennial census (Census 2000) are used for explanatory variables. The churning indicators are constructed based on 2007–2010 information for the 2010 models.
Similar to the 2000 model results, housing vacancy rates in 2010 are found to be negatively associated with Owner.Share and Pop.Density. Pop.Growth.Rate, however, no longer shows a strong negative association with housing vacancies, whereas its coefficient was statistically significant in 2000. This finding may be attributable to the differences between 2000 and 2010 housing market conditions, although further investigation beyond the scope of this study would be required to determine what drives it. The latter (i.e., Year 2010) represents an unusual situation where the local housing market was not fully recovered from the crisis of 2008. In such circumstances, population growth rates in the past 10 years could not act as a good predictor of housing vacancy rates at the tract level. The magnitude of the spatial autoregressive parameter, which is found to be much smaller in 2010 than it was in 2000, also seems to suggest that the local housing market does not always work in the same way. Furthermore, unlike the 2000 model, the performance of SDM is not noticeably better than that of SDEM in explaining 2010 housing vacancy rates.
Summary and Discussion
While business churning has large implications for the way our neighborhoods function and evolve over time, little attention has been paid to sub-county level business dynamism and its association with neighborhood attributes. This study quantified the degree of business churning using geocoded establishment-level business information and explored how it manifested itself across census tracts in the Los Angeles—Long Beach—Santa Ana, CA Urbanized Area. Furthermore, it employed spatial regression models to examine the ways in which business churning and neighborhood stability (measured as housing vacancy rates) were associated with each other in 2000 and 2010.
Our examination of neighborhood-level business births and deaths showed substantial variation in business churning across neighborhoods. The areas near large universities consistently exhibited a higher level of churning, compared with other neighborhoods in the region. However, fewer than 30 percent of the highest churning tracts by quintile remained in that group from 1997–2000 to 2007–2010. Similar instability over time was seen at other levels, suggesting that the neighborhood-level churning process can be either stable, cyclical, or erratic: over the entire region, persistence is not a universal pattern. In addition, we found some limited evidence that persistently high churning is more likely to occur when low-churning neighborhoods were adjacent. This seems to imply the existence of distinctive areas of high turnover in communities that are more stable.
Our multivariate regression also demonstrated that the implications of business churning for neighborhood stability might be much more complex than typically assumed. The spatial regression results did not simply indicate a positive relationship between housing vacancy rates and business churning measured in the form of Biz.Churning or Industrial.Change. Rather, it appears that a more complete perspective on that relationship necessitates separate consideration of the (countervailing) effects of business births and deaths.
Overall, a higher establishment death rate was found to be associated with an increase in housing vacancies, while the creation of new establishments could mitigate the association to some extent. Again, however, the relationship between neighborhood-level business dynamics and housing vacancy rates does not appear to be temporally stable. As reported in the previous section, we detected somewhat dissimilar patterns of the relationship from our 2000 and 2010 vacancy models. Since the first decade of the 21st century is unique with a housing boom and collapse that resulted in the great recession, these differences may not be surprising. Nonetheless, given this shift in dynamics and the spatial non-stationarity detected, these findings deserve more attention, suggesting that the labor–housing market linkages are likely to be context-specific and that the way business dynamics influence our neighborhoods may have changed and continue to do so in the future.
Admittedly, the present study is not without limitations. Our spatial regression analyses used business churning in the previous 3 years as a predictor of housing vacancy rates in 2000 or 2010, but one could question why the causality should run only in that direction. Business churning and neighborhood stability may interact with each other in a complicated, bidirectional fashion, although a rigorous investigation of such reciprocal interactions is beyond the scope of this research. Future research should be devoted to uncovering the detailed mechanisms by which changes in the business landscape impact neighborhood stability and induce further changes in business dynamics. In doing so, future studies may explore ways to capture neighborhood stability more precisely rather than using housing vacancy rates which, although useful, do not always enable one to distinguish neighborhood decline from other pathways of neighborhood transformation. While we examined shifts across industries overall, isolating specific key industries that serve or employ local populations – or are consumer-facing in nature – might help future researchers to better understand the mechanisms of this relationship. Given our findings using a single definition of neighborhoods – census tracts – it would also be useful to explore these processes based on spatiotemporal scale sensitivities to assess how broad these effects indeed are. Furthermore, researchers are encouraged to use other measurement strategies for understanding the implications of turbulent business dynamics for neighborhoods more completely.
Footnotes
Declaration of Conflicting Interests
The author(s) declared no potential conflicts of interest with respect to the research, authorship, and/or publication of this article.
Funding
The author(s) disclosed receipt of the following financial support for the research, authorship, and/or publication of this article: This work was supported in part by the Metropolitan Futures Initiative at the University of California, Irvine.