
Abstract
A multi-scale suitability analysis using big data (4.7 million suitability scores) is presented across a large spatial extent (1.076 million km2) to identify potential locations for new home-improvement retail stores. Suitability scores were generated for individual property parcels using criteria weights derived from surveyed retail-industry experts. To increase capacity for site selection, distributions of suitability scores were generated at census dissemination areas (populations 500-700; n = 19,963) and census metropolitan and agglomeration areas (core populations >10,000; n = 43). Analogues among metropolitan and agglomeration areas were generated and spatial clustering was used to identify groups of highly-suitable parcels within urban areas. Lastly, individual parcels can be interrogated for overall suitability or individual criteria scores. Our approach combines retail methods typically used in isolation (e.g. location quotient, Huff’s model, network analysis) and demonstrates how a simple survey can be used to weight criteria. Results show that survey respondents were in general agreement and that top-line revenues were more critical to perceived location success than development and operational costs. Analysis of suitability scores found analogues and clusters of census metropolitan areas that coincide with store sales as well as clusters of highly suitable parcels predominantly located around major highways. In addition to identifying challenges and solutions to the presented research, we also describe future research directions that extend the presented static analysis to include processes like store closure and openings, competition, and land use change through the use of agent-based modelling.
Keywords
Introduction
The use of suitability analysis for retail site selection has been a common approach for decades (e.g. Hernández, Bennison, and Cornelius 1998). The application of a geographic information systems (GIS) to visualize, manage, and manipulate different geographic data types in one integrated approach has fostered the use of suitability analysis for site selection problems with applications in land use, public planning (e.g. Brown and Reed 2009), and retail (e.g. Roig-Tierno et al. 2013), among other domains. However, within GIS applications of suitability analyses for retail site selection, applications are typically geographically constrained (e.g. Sadler 2016, Parry et al. 2018, Reigadinha et al. 2017) and results are derived from potential sites identified a priori.
The availability of big data has provided increased capacity to conduct suitability analysis across very large spatial extents, which should be common. Whilecomputational limitations to site selection have been overcome by high-performance computing hardware (e.g. parallel computing, Lancinskas and Zilinskas 2012) and general-purpose graphic processing units (GPGPUs), synthesizing and communicating results from the use of big data for decision-makers remains a challenge. One approach to overcome this challenge involves analysing data at multiple scales with specific results at each scale further refining the site selection process.
We present a multi-scale approach to suitability analysis that calculates suitability scores for big data (4.7 million property parcels) across a large spatial extent (1.076 million km2). Suitability scores were generated using criteria selected in collaboration with retail industry experts and the relative weighting of those criteria were derived from a survey conducted by those experts and a modified Delphi approach. Suitability scores were aggregated within 43 census metropolitan (comprising more than 100,000 people) and agglomeration (core population greater than 10,000) areas to identify site selection opportunities within a broad context (Figure 1; hereafter we refer to census metropolitan and agglomeration areas collectively as CMAs). At this scale, analogues (e.g. Clarkson, Clarke-Hill, and Robinson 1996; Hernandez and Bennison 2000; Clarke, Mackaness, and Ball 2003; Reynolds and Wood 2010; Versa 2019) were derived, using pair-wise comparisons and k-means cluster analysis, which are expected to provide similar retail site-selection opportunities. Conceptual outline of suitability analysis.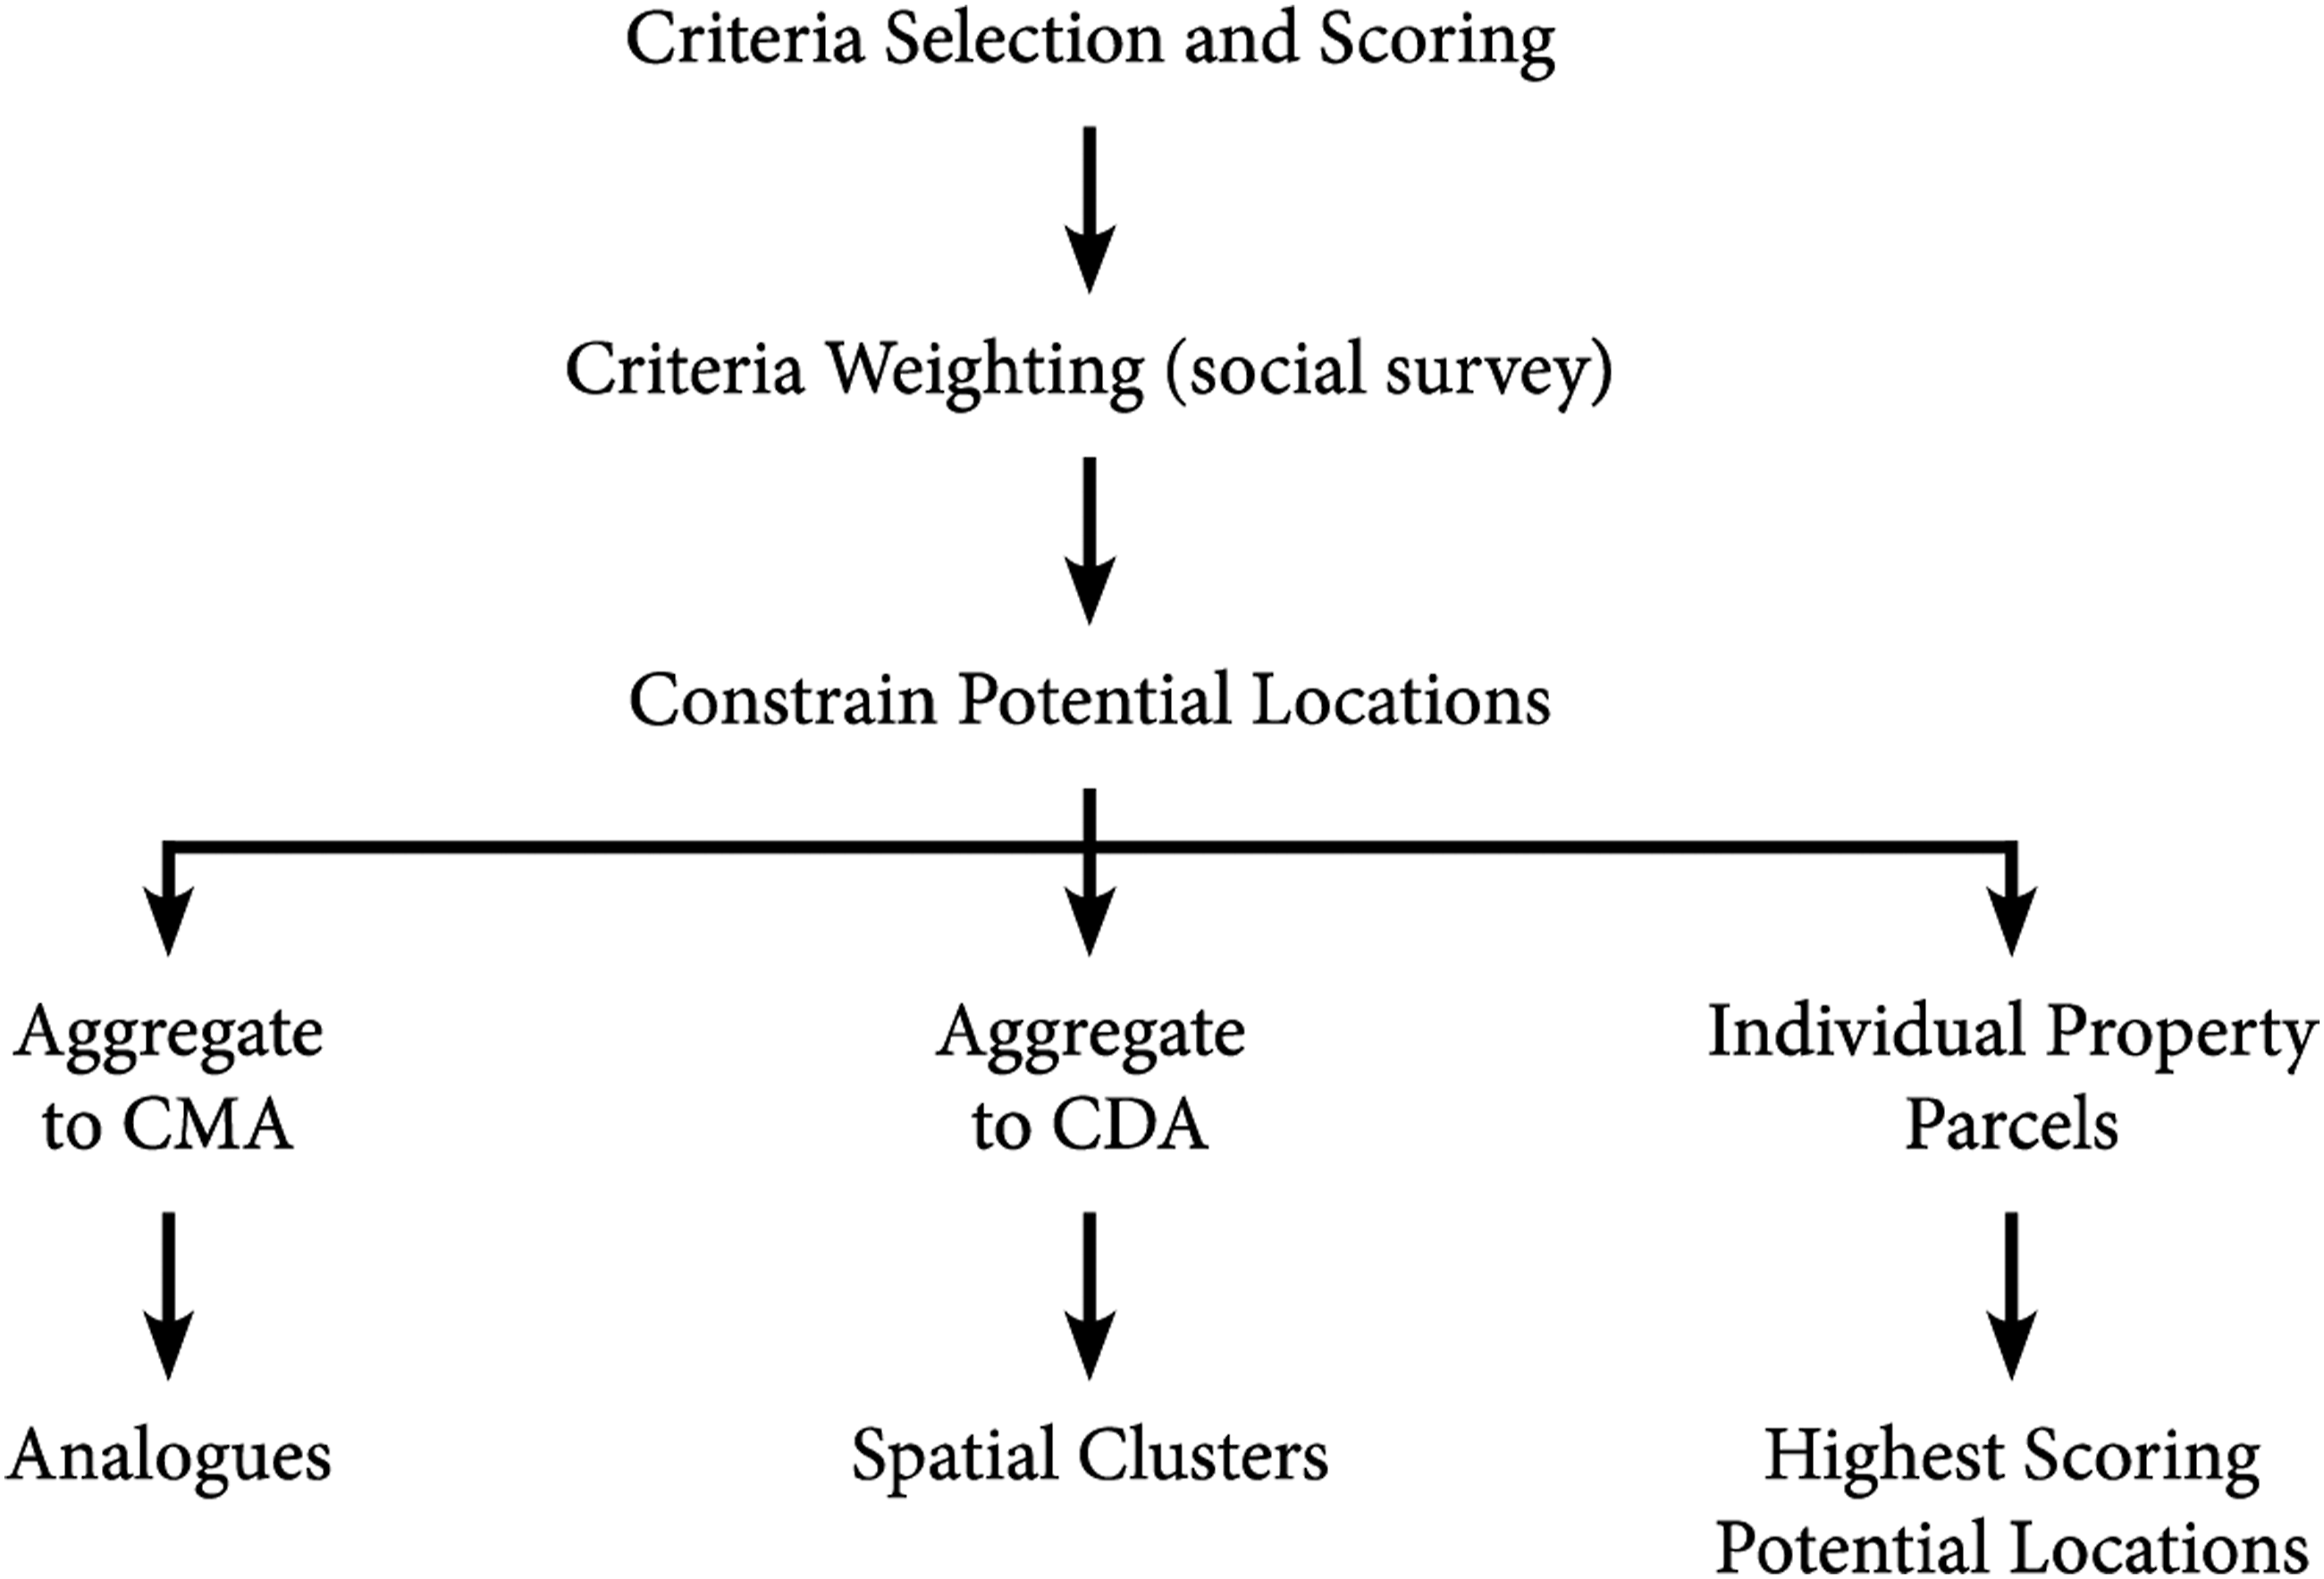
Following the generation of analogues, suitability scores were aggregated from parcels to census dissemination areas (each comprising 500-700 people), which are the “smallest standard geographic area for which all census data are disseminated” in Canada (Statistics Canada 2011b, 114). At this scale, a spatial cluster analysis of the top 90th percentile suitability scores was conducted to identify smaller regions with multiple opportunities for site-selection. Lastly, while it is possible to identify the highest scoring potential retail locations, collaborating industry experts preferred the identification of areas of high suitability and the ability to move between Census metropolitan area (CMA), Census dissemination area (CDA), and parcel scales to explore the data and identify areas with high suitability that aligned with their experiential knowledge.
We demonstrate how a simple social survey, comprising one question, can be used to weight suitability analysis criteria selected in collaboration with industry experts. Criteria include approaches typically used in isolation (e.g. location quotient, Huff’s model, network analysis) to generate suitability scores. While pair-wise comparisons and k-means clustering are well established, our use is novel in that we apply them to the distribution of suitability scores of individual parcels within the geographic region of a CMA. Through this process and our analysis of spatial clustering at the CDA, we are able to determine: What are the most important site-selection criteria to a multi-national retail company? What is the spatial distribution of suitability scores across the province of Ontario and are there differences between CMAs in northern and southern parts of the province? Are there CMAs that offer similar distributions of suitable sites (i.e. analogues)? Where are there clusters of highly suitable areas (CDAs) that offer multiple local opportunities for retail site selection?
Methods
Study Area
Located in the centre of Canada, the province of Ontario is home to 13.6 million people (38.3%) (Figure 2, Statistics Canada 2014a), with 88.7% of the 2011 population living inside census metropolitan areas or census agglomerations such as Ottawa-Gatineau, Toronto, Hamilton, and Kitchener-Cambridge-Waterloo. Ontario comprises the largest economy in Canada with a gross domestic product of $695 billion (CDN; Statistics Canada 2014b). Although the 2008 economic crisis slowed economic growth in Ontario, the province presents an opportunity for home improvement retail development. Within the Ontario market, housing starts in 2013 (approximately 60,000), which are a significant driver of gross domestic product, were below the 2008-2012 average (approximately 64,000, IHS Global Insight 2013). As of 2012, the professional and consumer market of home improvement products was estimated at $15.5 billion and is expected to increase to $18.8 billion by 2017 (IHS Global Insight 2013). Given that demand for home improvement products has continued to grow, despite fluctuations in general economic conditions, the identification of suitable sites for home improvement retail stores are of significant interest to retailers operating in that sector. Census metropolitan areas (CMAs) and census agglomeration areas in Ontario rendered by 2011 population. Inset (lower left) illustrates portion of Ontario, Canada, represented.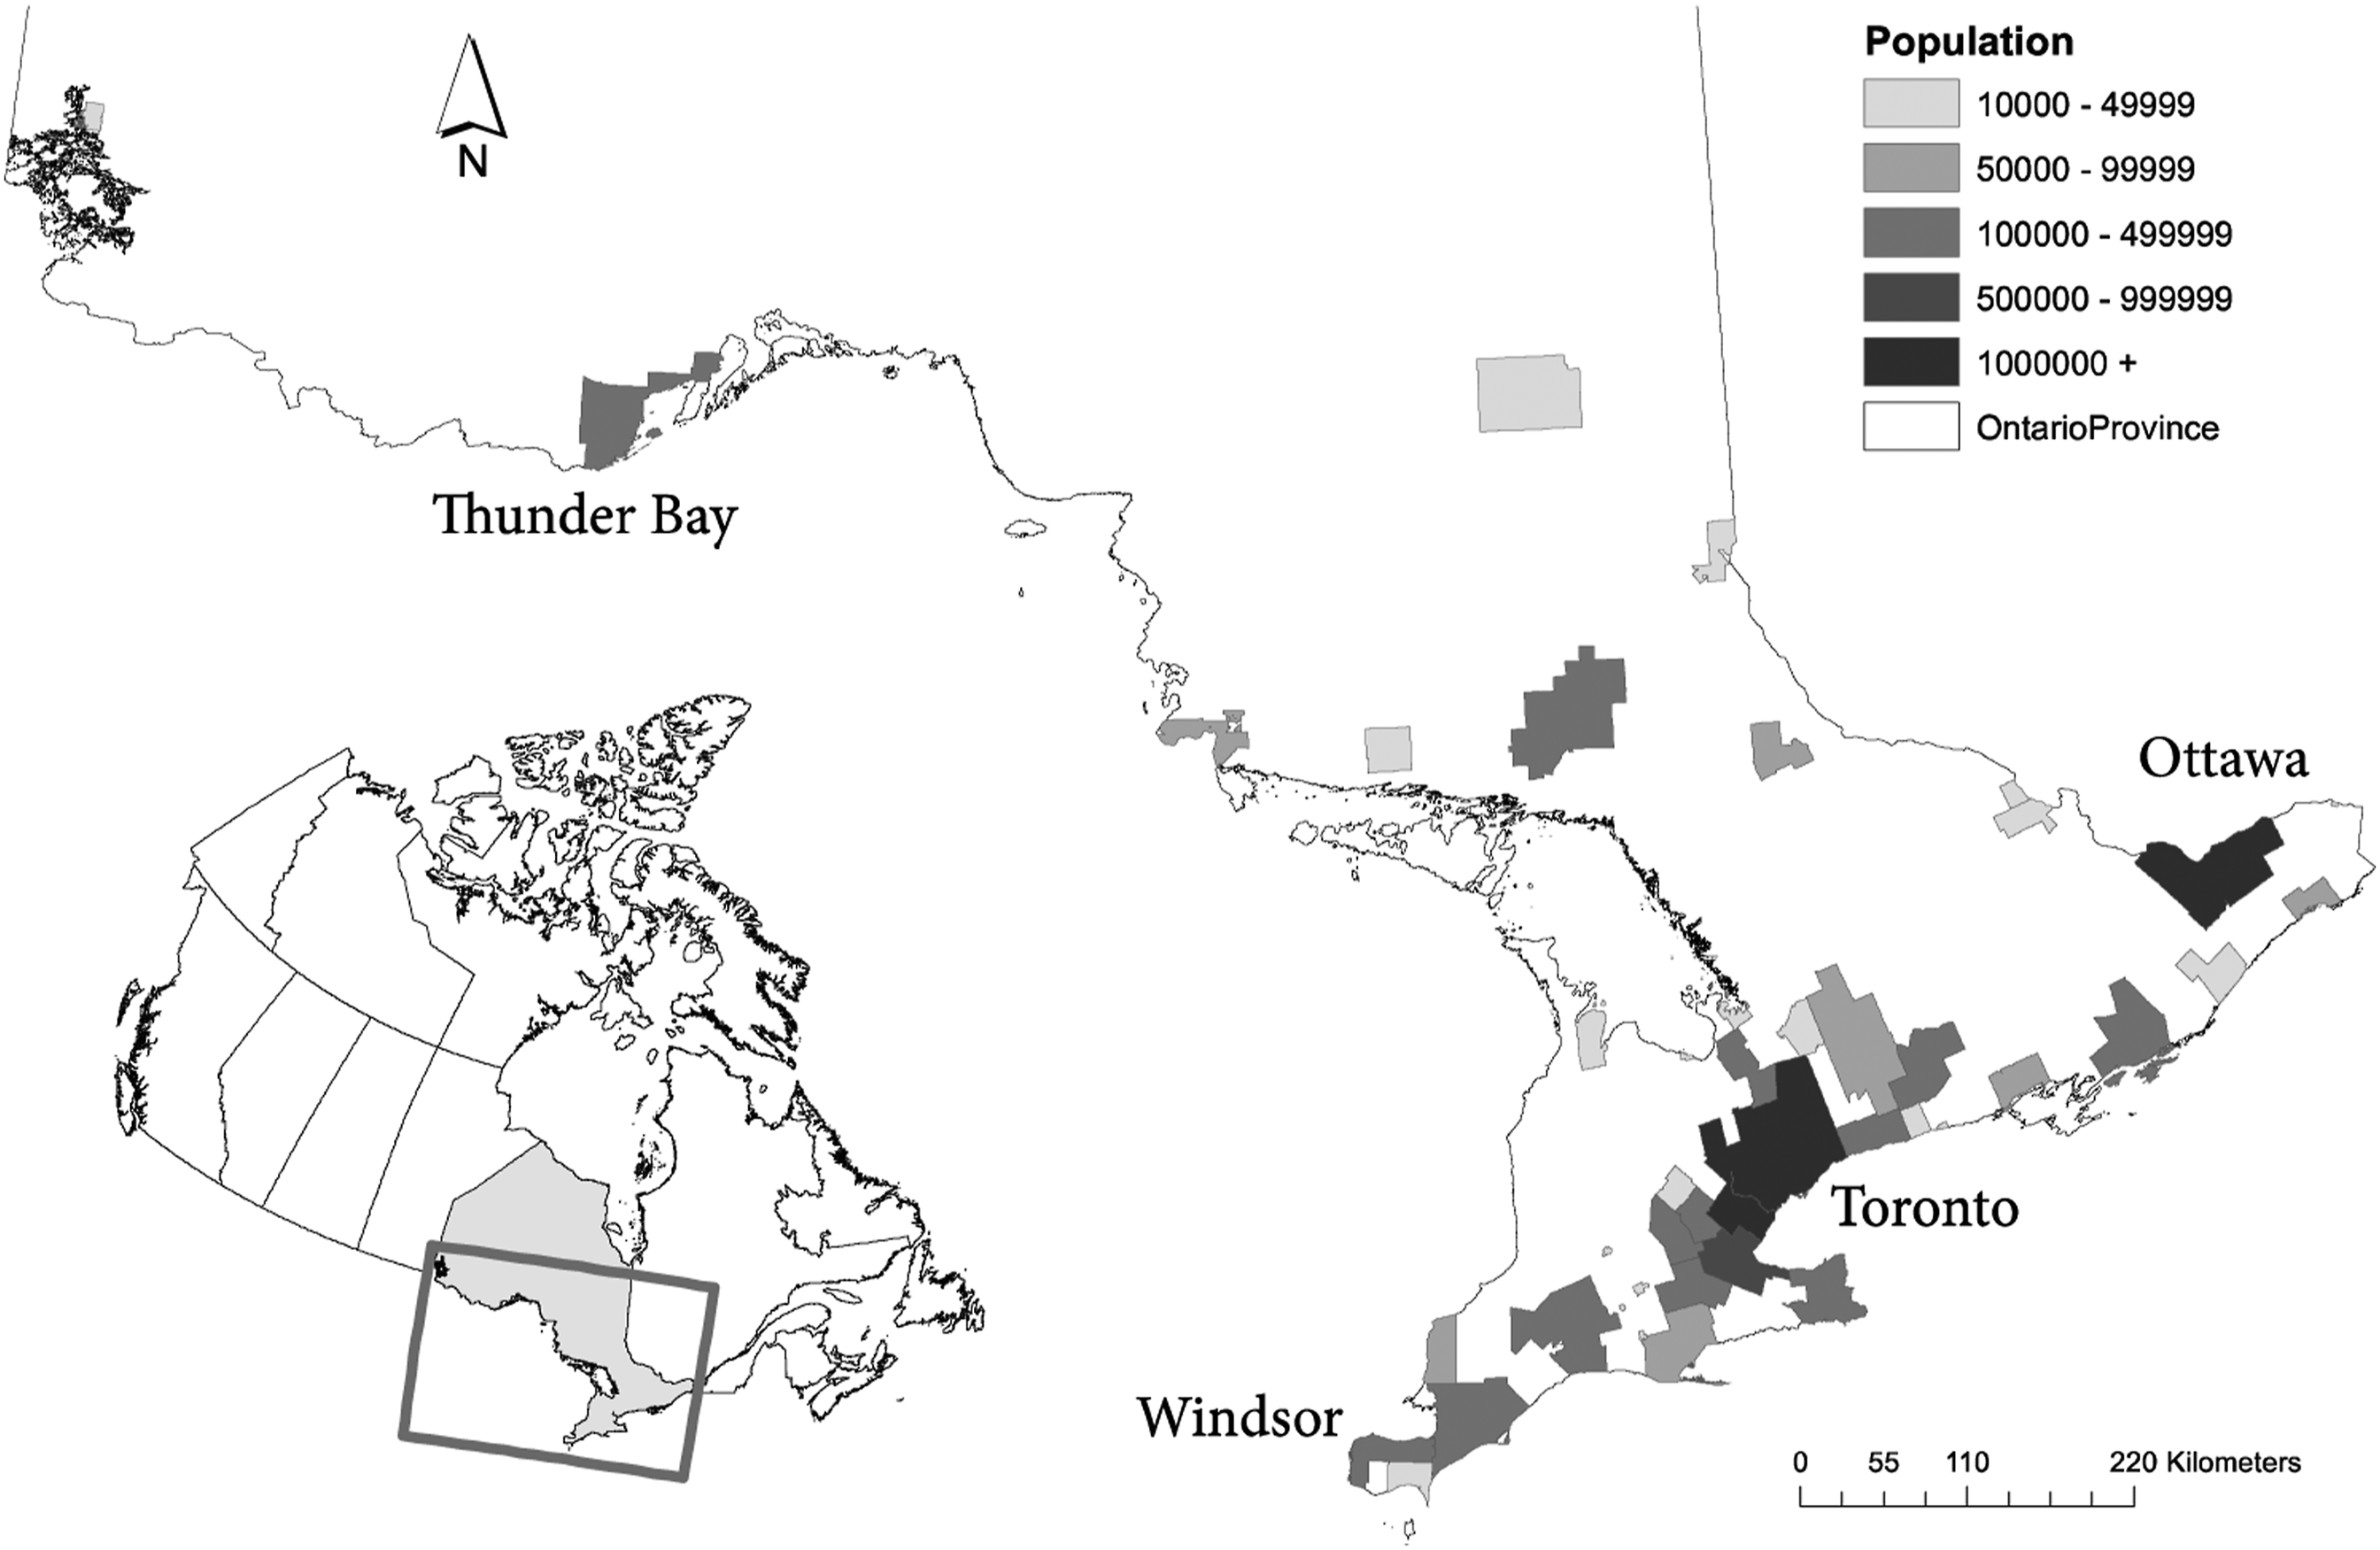
Overview of Suitability Analysis
Our analysis derives a suitability score from multiple criteria for 4.7 million individual ownership parcels across the province of Ontario. We conceptually categorised criteria as affecting either the site or situational characteristics of a potential retail location (i.e. property parcel). Site criteria describe the characteristics found along or within the boundary of an individual property parcel, while situational criteria describe characteristics of the neighbourhood around the property parcel or the parcel’s position relative to geographic features beyond the parcel boundary. Suitability criteria for each potential location were selected using literature (e.g. Jankowski 1995; McGoldrick 2002; Zentes, Morschett, and Schramm-Klein 2012; Roig-Tierno et al. 2013) and in collaboration with retail industry experts (a senior vice-president, and a collection of his/her directors, managers, and analysts) from a multi-national home improvement retail company.
Once the criteria were calculated for all parcels, criteria values were normalized for comparison and weighting. A survey distributed to our retail industry experts was used to calculate criteria weights, which describe the relative importance of each criterion to all others in the calculation of site suitability scores. Criteria were then combined using an additive and weighted linear combination approach to derive a suitability score. Finally, constraints were applied to eliminate parcels unavailable for retail development.
Although constraints are typically applied before the calculation and normalisation of criteria values (e.g. Jankowski 1995; Malczewski 2004; Chang, Parvathinathan, and Breeden 2008), we applied constraints at the end of the suitability analysis process. This decision has implications for the computational performance, cost, and flexibility of the suitability analysis. While the computational overhead is significantly higher when constraints are applied at the end of the process, doing so enables decision-makers to change the assumptions about constraints and determine parcel availability without repeating the suitability analysis on a subset of newly available parcels. The ability for real-time interaction and exploration of results and constraints scenarios is essential for industry collaboration, buy-in, and use of results. Results are synthesized in an interactive web-based site-selection decision-support system (not discussed in this paper). As part of this system, and because we apply constraints at the end of the process, unavailable sites can be interrogated by users to gain a better understanding of the context and criteria scores in the local neighbourhood.
To describe the distribution of suitable parcels in each of the 43 CMAs in Ontario, we use the following six summary statistics: the count of suitable parcels, the mean suitability score, the range of suitability scores, the standard deviation in suitability scores, skewness, and the average suitability score among parcels in the 90th percentile. Collectively these statistics describe the distribution of suitability scores for an individual CMA that enables the comparison of distributions among CMAs.
Criteria Selection
The relevance of site criteria to parcel suitability can be tied to the cost of development (e.g. parcel slope and earthwork) or constraints on site availability for development (e.g. parcel area). However, the influence of site costs is relative to the size of the retail company and their store revenue generation. Therefore, site criteria such as property parcel cost may be inhibiting for non-chain or independent retailers and not for large international companies. In our investigation, parcel costs were somewhat irrelevant (assuming fair market value), and instead we found that large retail companies were more concerned with situational criteria that affect operational costs, marketing (e.g. visibility), and top-line revenue generation (e.g. potential consumer expenditures).
Using the literature to generate discussion of potential criteria (Jankowski, 1995; McGoldrick, 2002; Roig-Tierno et al., 2013; Zentes et al. 2012), we collaborated with a team of home-improvement industry retail experts from a multi-national home-improvement company to derive a set of nine criteria. Among these nine, only one was associated with site conditions (maximum slope) while the remaining eight were associated with a location’s situation: traffic visibility, highway accessibility, distance to distribution centre, market representation, density of competing chain stores in trade area, density of retail stores in trade area, potential expenditures, and competitive expenditures. All other site characteristics contributed to the application of 14 constraints (e.g. parcel area, proportion of parcel in forest cover).
Data
Criteria scores were calculated using a GIS and other spatial analysis tools. 1 Data were acquired from a variety of government and private sources. Provincial road data (Ontario Road Network 2013) and 2010 annual average daily traffic (AADT) were acquired from the Ontario Ministry of Transportation. Land cover (Southern Ontario Land Resource Information System [SOLRIS], 25 m resolution) and 2008 elevation data (10 m resolution) were acquired from Ontario Ministry of Natural Resources. Geographic census and Canadian Business Patterns data were obtained from Statistics Canada (2011a). Ownership parcel data were acquired from TeraNet Inc. (2010). Retail store locations were manually digitized and validated as described in Balulescu (2015) and Caradima (2015).
In addition to data used for calculating criteria scores, proprietary data were acquired from a multi-national home-improvement retail company representing a substantial share of the Canadian market. These data comprised total annual sales for a subset of stores (n = 23) within the province of Ontario, which were used qualitatively to compare CMA analogues and confirm that stores with higher sales corresponded to locations with higher suitability scores.
Development of Criteria
Maximum Slope
To estimate site suitability as affected by parcel topography and the cost of grading for a retail development, the maximum slope was calculated for each parcel using a digital elevation model (DEM) with a resolution of 10 m. Lower slope values represented higher suitability.
Traffic Visibility
Retailers often locate stores along major arterials and roadways with high traffic volumes to increase visibility and accessibility (Reimers and Clulow 2004). Traffic was assumed to have visibility up to the middleground of a landscape, which occurs at approximately 805 m from a viewing point (USDA 1974, 1995). Parcels were scored based on their distance from major highways and traffic volume as follows:
As the distance of parcel
Highway Accessibility
For retail operations, a site located nearer to a highway ramp or distribution warehouse is more economical for logistical access (Jakubicek and Woudsma, 2011). More importantly, the time required to travel to a store affects the likelihood of patronage since consumers are more likely to patronize a store if they can reach it in less time (Huff 1966; Suárez-Vega and Santos-penate 2011). Highway accessibility was measured using official speed limits and the Ontario Road Network to establish the shortest network-based travel time from a potential parcel to a highway ramp. Parcels with shorter travel times to highway access points had higher suitability scores (all other conditions being equal).
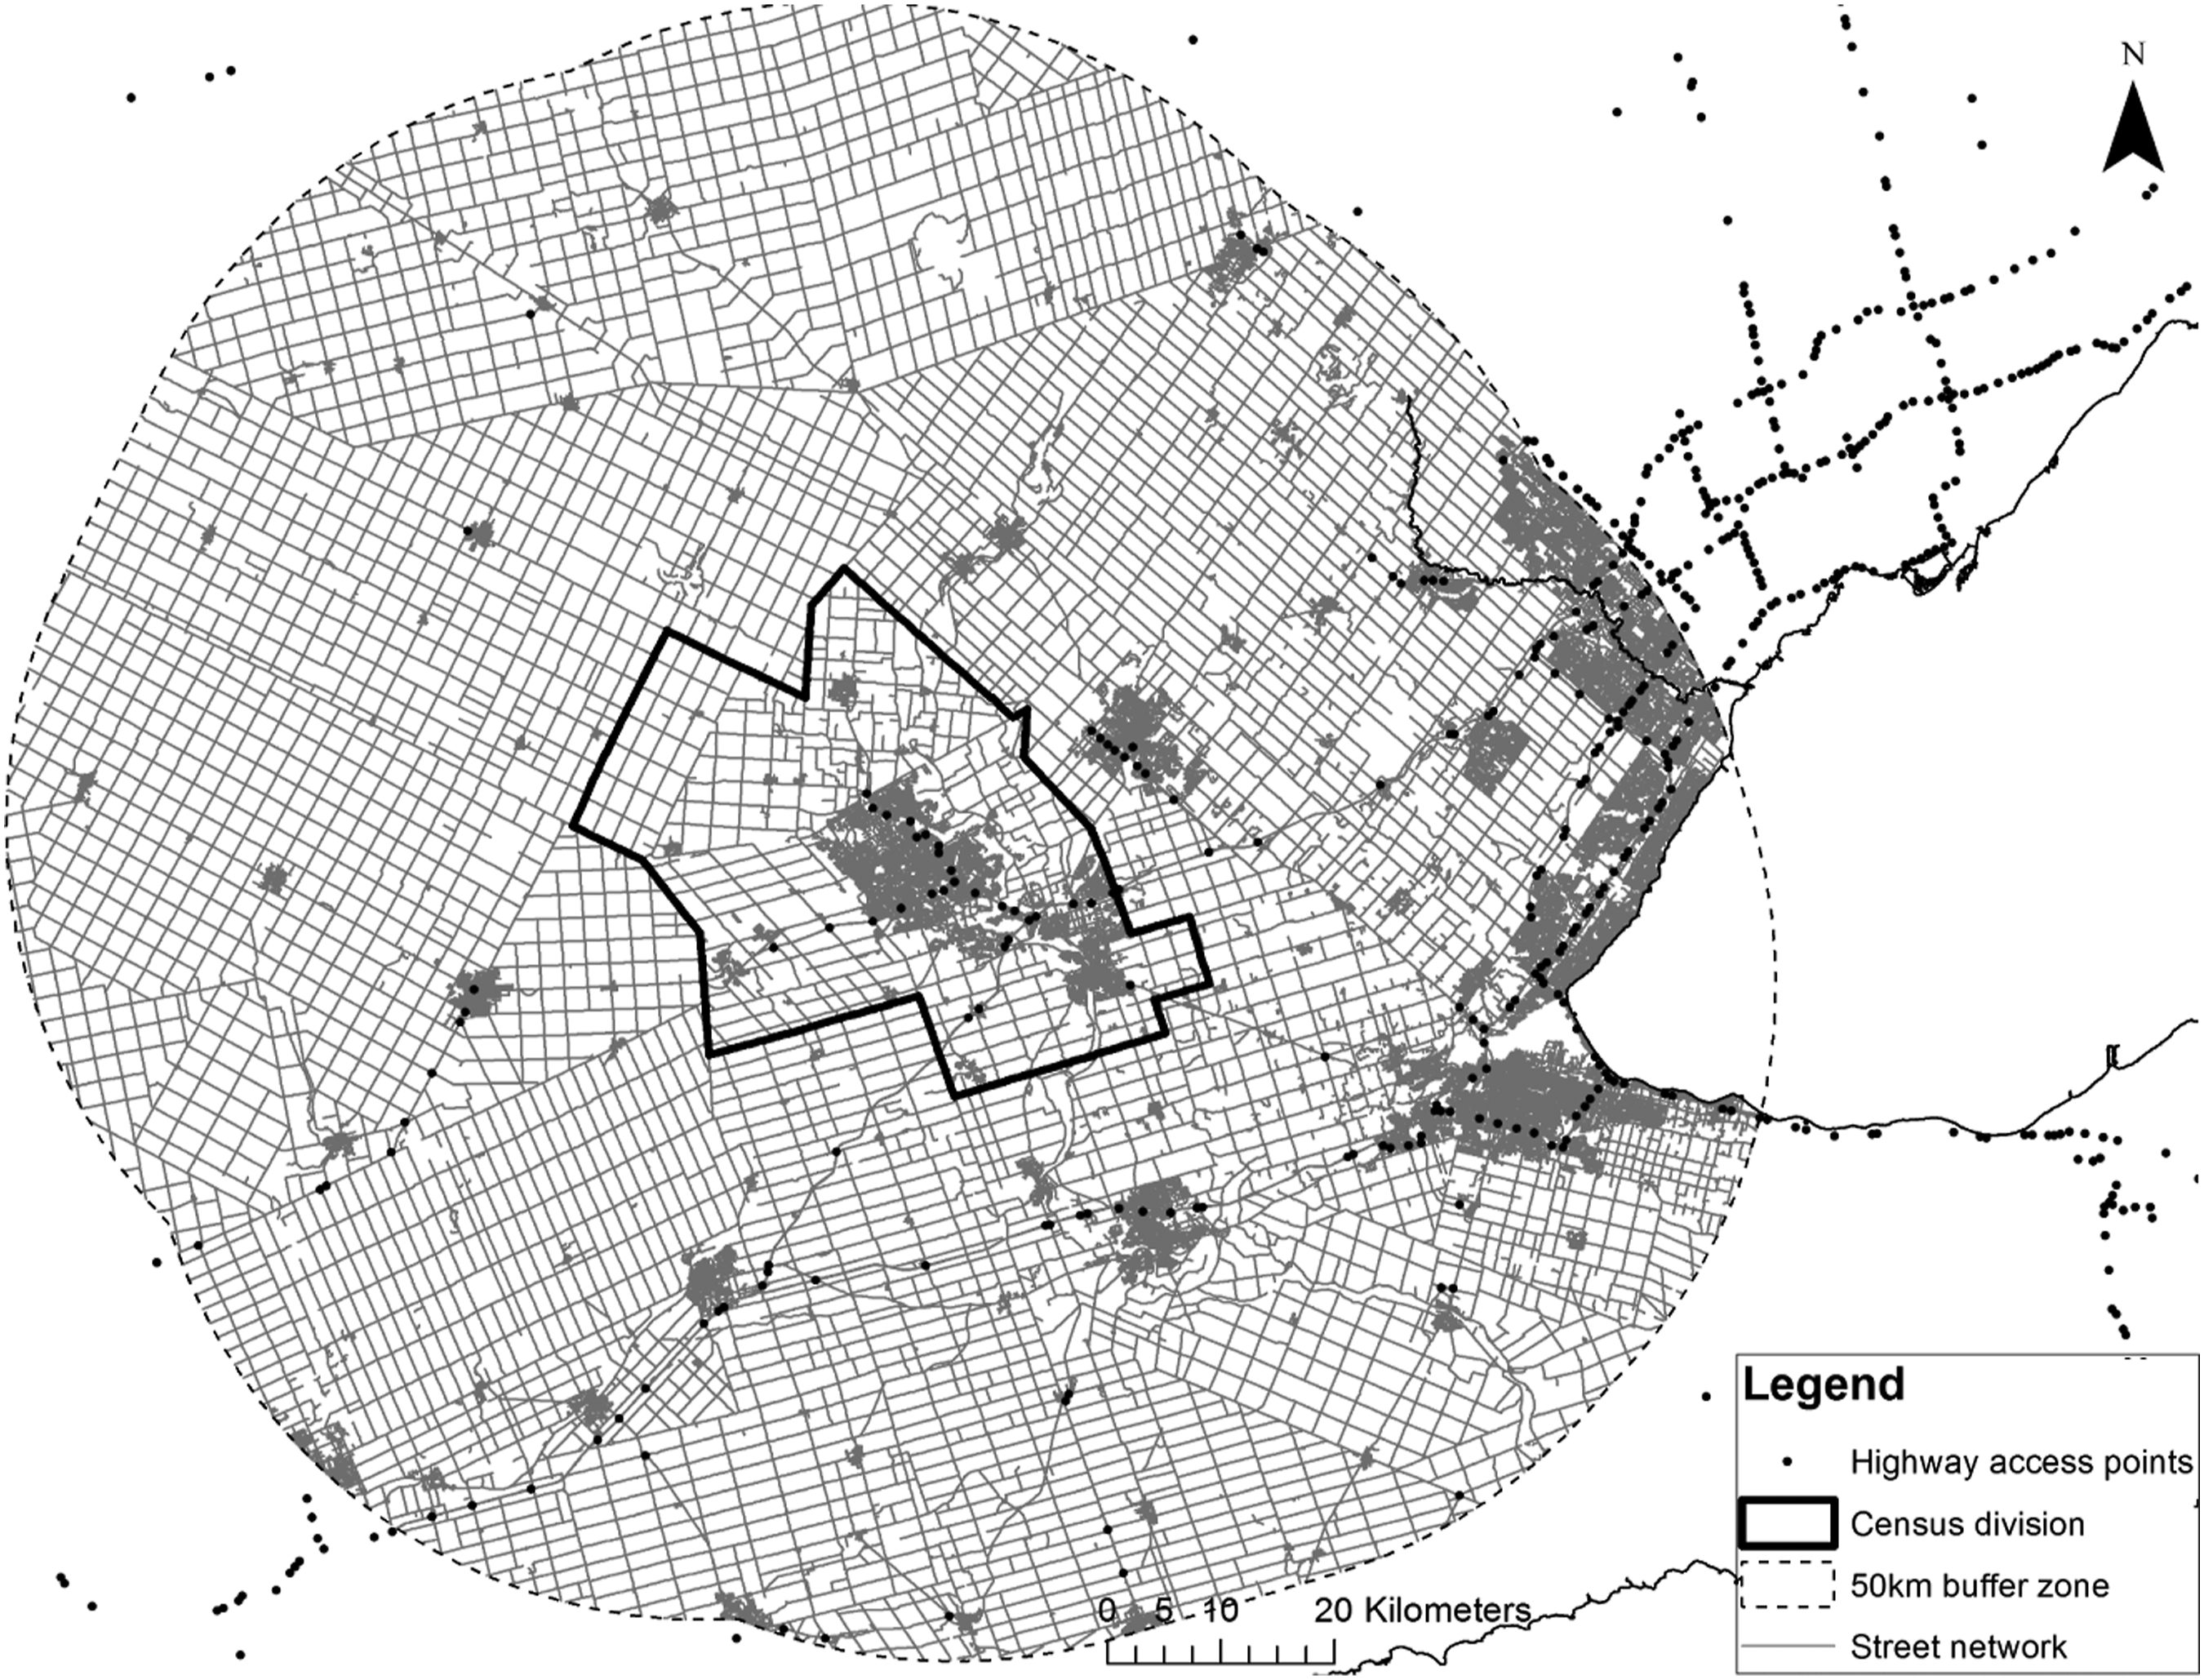
The Ontario Road Network contains 7,017 individual highway ramps; however, often many ramps serve a single highway intersection or can be found located distant from highways in urban areas where two roads merge (Figure 3). To simplify the spatial representation of highway ramps, ramps greater than 200 m from highways were removed and highway ramps were clustered to a single point located at the centroid of all points within a 200 m distance tolerance of the cluster. Results yielded 1,130 highway access points, each representing a cluster of highway ramps. Calculation of the network distance from each property parcel to the nearest of these highway access points required partitioning parcel data by census division (CD), establishing a 50 km buffer zone to reduce the size of the street network and avoid edge effects, and then iterating through the 49 CDs for Ontario (Figure 4).
2
Highway ramps (marked ‘x’) formed clusters of ramps along highway intersections and are combined to highway access points (black points). Merge or bypass ramps distant from highways were removed (circled black points). The spatial selection and representation of the network analysis for calculating shortest network routes from parcels to highway access points.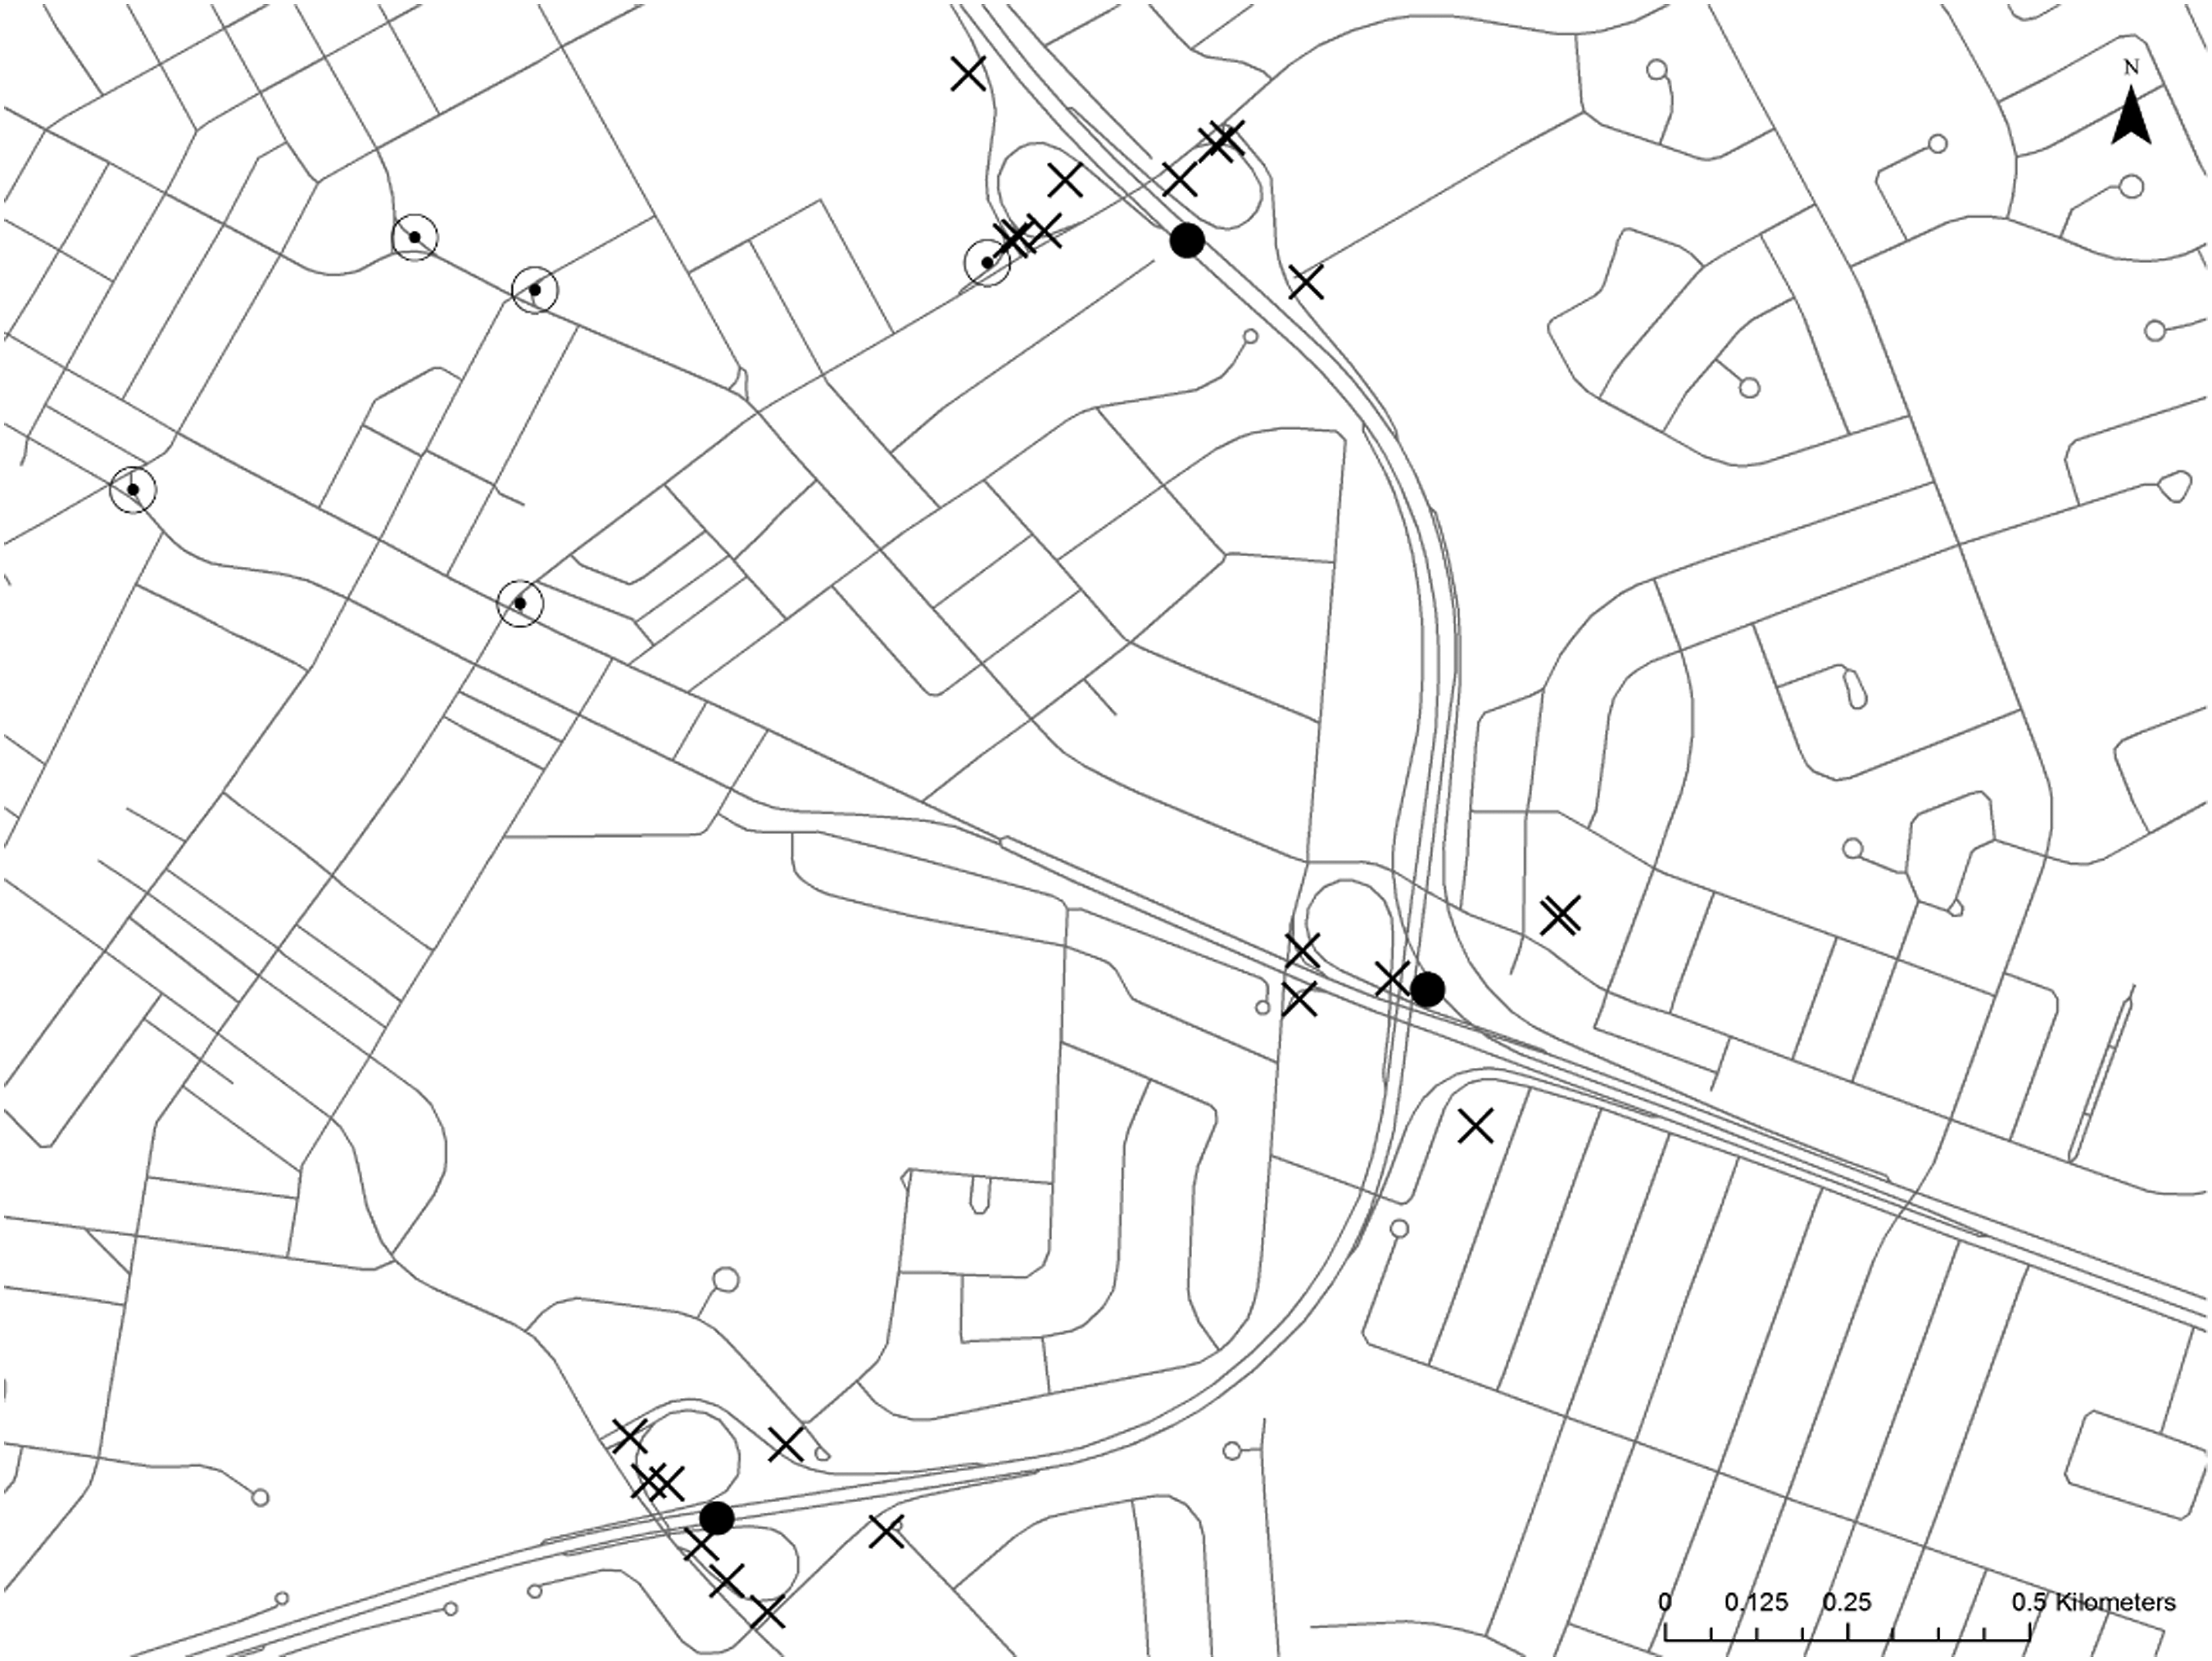
Distance to Distribution Center
The shortest network distance (km) of a potential site to a distribution centre provided a measurement of the logistical cost of servicing a potential store location. This distance was calculated from every potential site in Ontario to the distribution centre using Dijkstra’s (1959) algorithm with no preference for major roadways. Potential sites that were closer to the distribution centre had higher suitability scores.
Trade Area Characteristics
In retail, stores draw commerce from a geographic zone known as a service or trade area (Zentes, Morschett, and Schramm 2012). Retailers often delineate and analyse trade areas based on a number of market and demographic statistics, and describe potential store locations relative to their trade area statistics (Kumar and Karande 2000; Cisneros 2015). In particular, site suitability may be inferred from the trade area using a variety of metrics, such as the market representation of their products, the expenditures that may potentially be allocated to a potential store, as well as the density of competitor and other retail stores within the trade area (Zentes, Morschett, and Schramm 2012). The trade area characteristics of a potential site therefore have a key role in describing situational criteria influencing potential site suitability.
When representing a trade area through a street network rather than Euclidean space (e.g. Drezner, Drezner, and Salhi 2002), a key factor in delineating a trade area for a store is the maximum network cost. The maximum network cost represents the highest network-based movement cost that consumers are assumed to travel to a potential store location and delineates the spatial extent of the trade area. We used travel time as the unit of network cost and set the maximum travel time to 19 minutes, which was the mean network travel time of Ontario consumers to 23 big-box home improvement retail stores in Ontario (unpublished proprietary business data). In developing all trade areas based on a 19-minute travel time, we make the assumption that the trade areas are representative of all consumer behaviours across the study area.
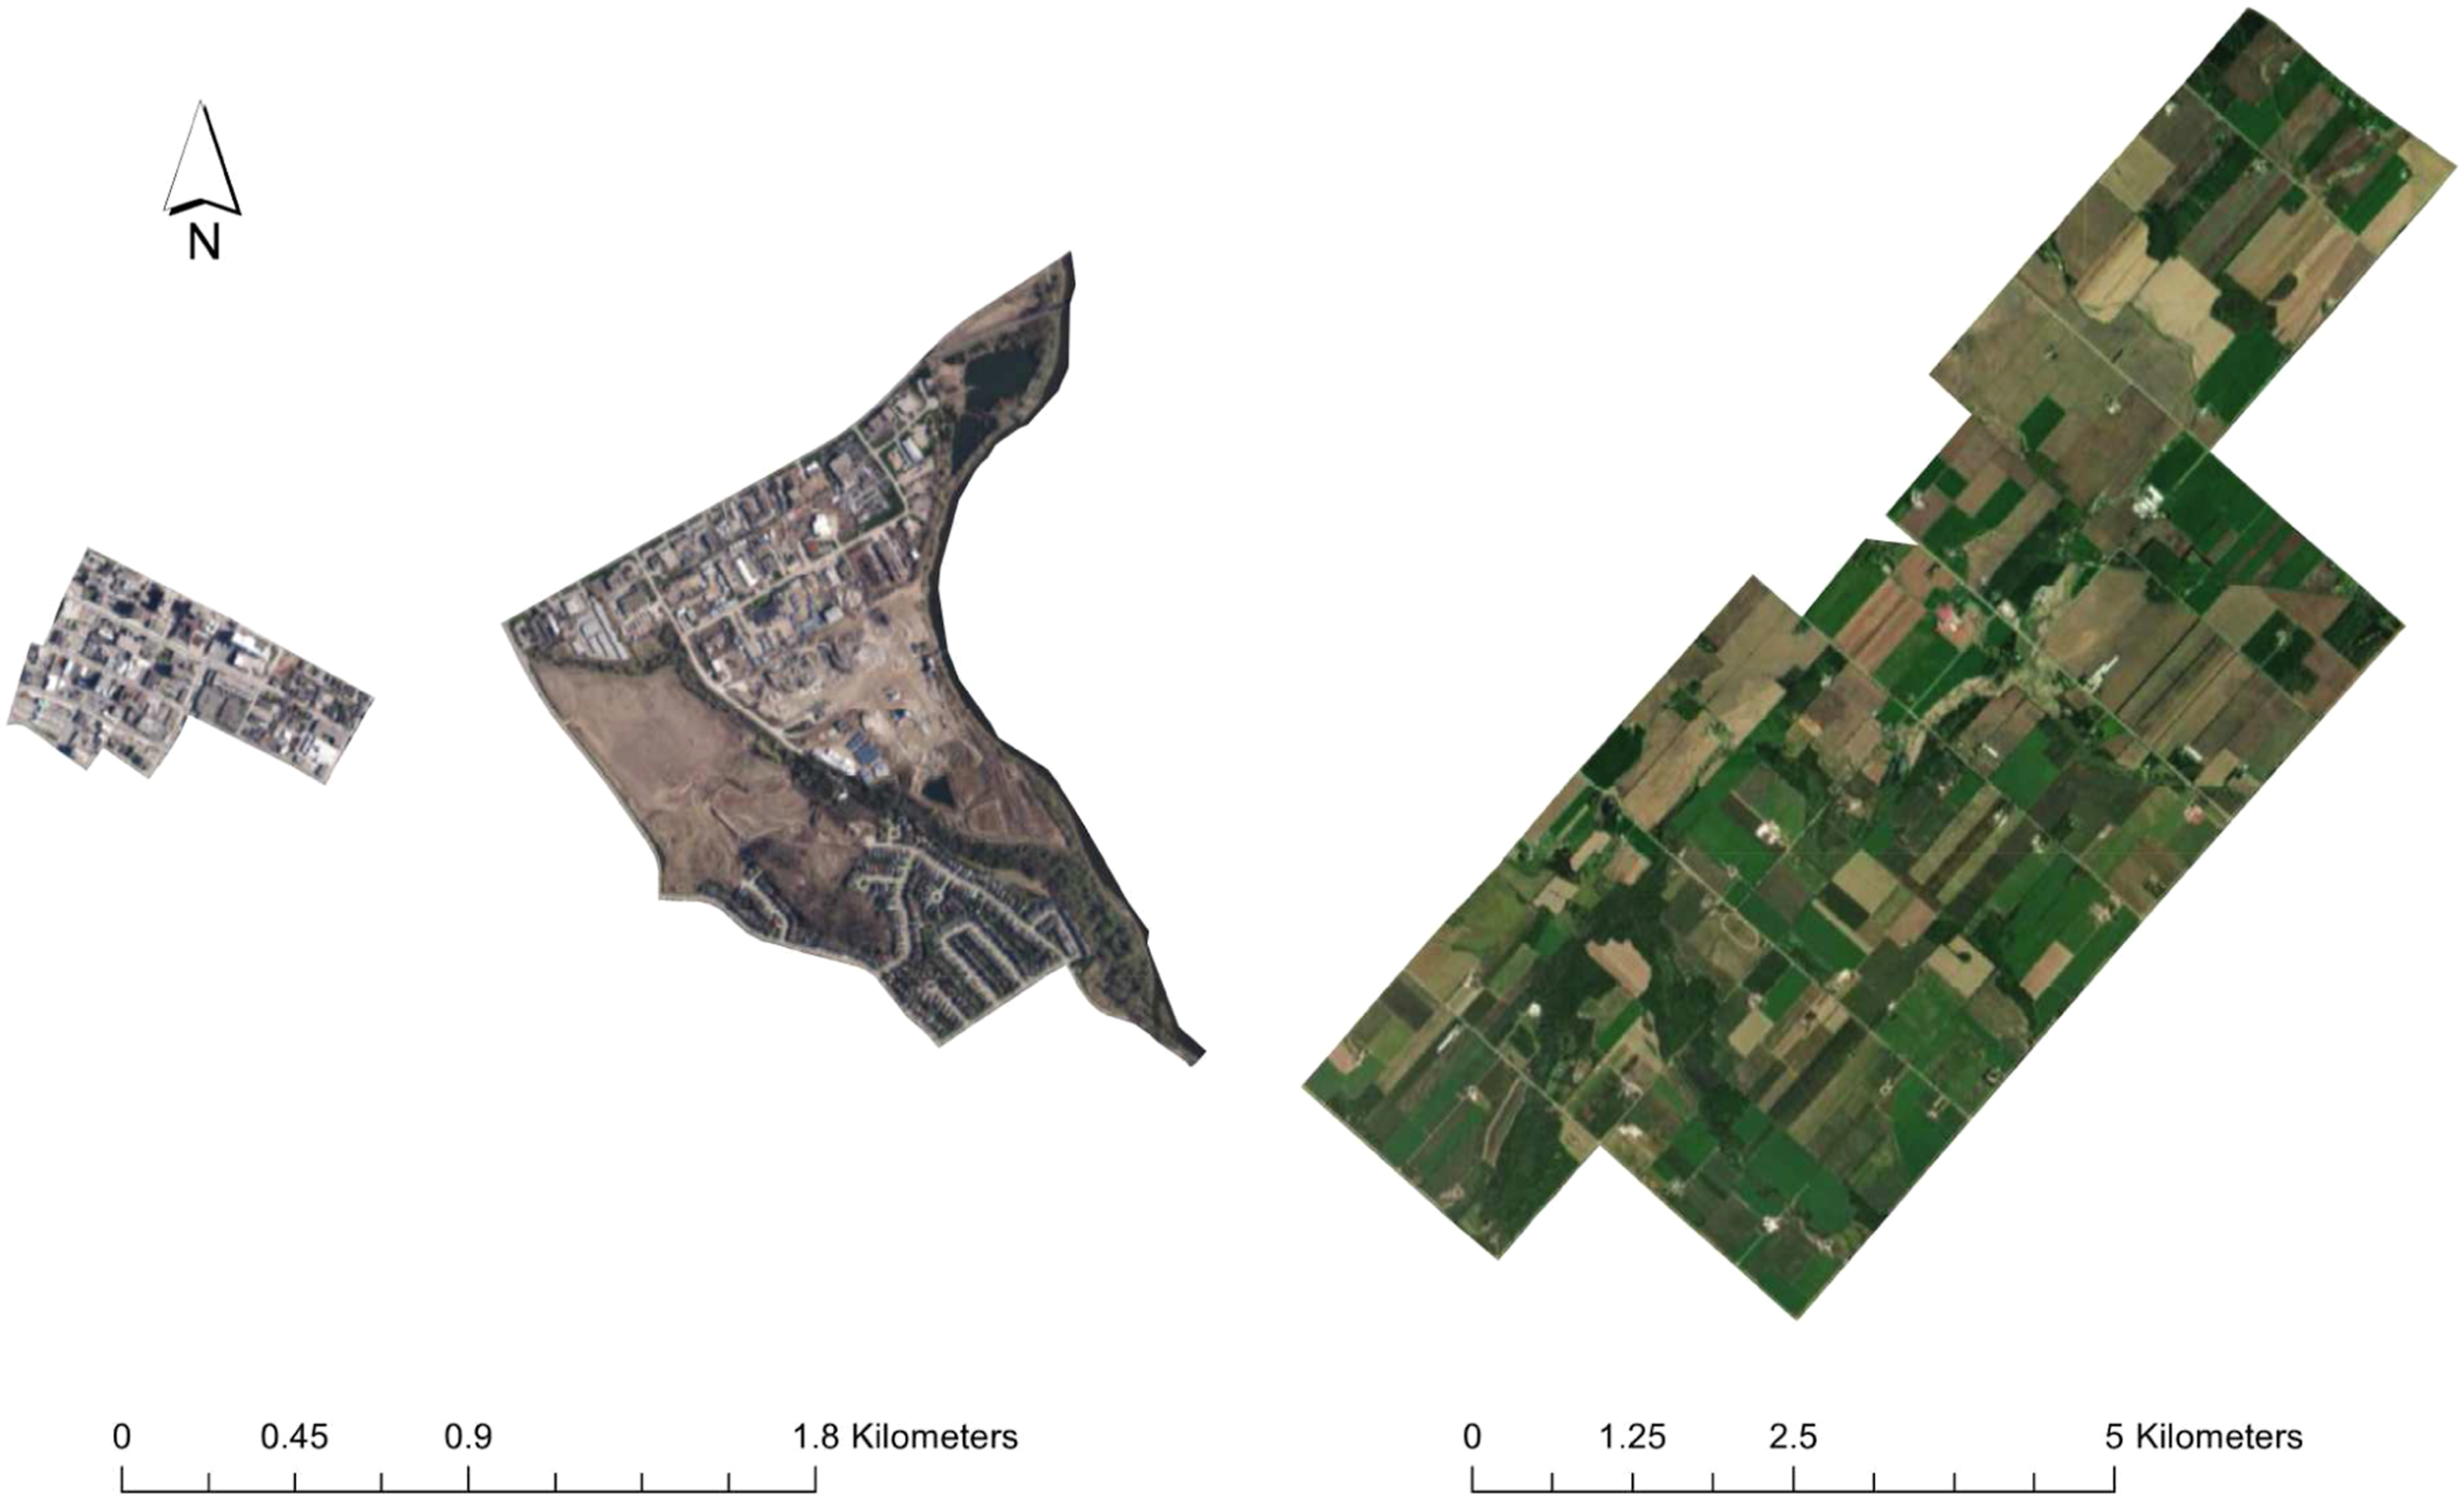
Developing trade areas for all 4.7 million parcels in Ontario was too computationally intensive. Instead, we generalised the approach by generating 19-minute trade areas from the centroid of each of the 19,964 census dissemination areas (CDA) in Ontario (Figure 5), and applied results to each parcel within the CDA. Generalising based on the CDA is likely to introduce error for highly rural locations that have a low population and high CDA area and will have minimal effect on highly urban CDAs that have a small area (Figure 6). We did not quantify this error in aggregation as it would require a complete computation of 4.7 million parcels since the error will be a function of the relative distance between CDA centroid and parcel centroids within and a function of the weighting applied to routing related criteria. Example of a trade area generated from a CDA centroid in Waterloo Region. Examples of different census dissemination area (CDA) sizes with urban CDAs being smaller (left), urban-rural fringe CDAs being larger (centre), and rural CDAs occupying large tracts of land. Note the difference in scale among the CDAs shown.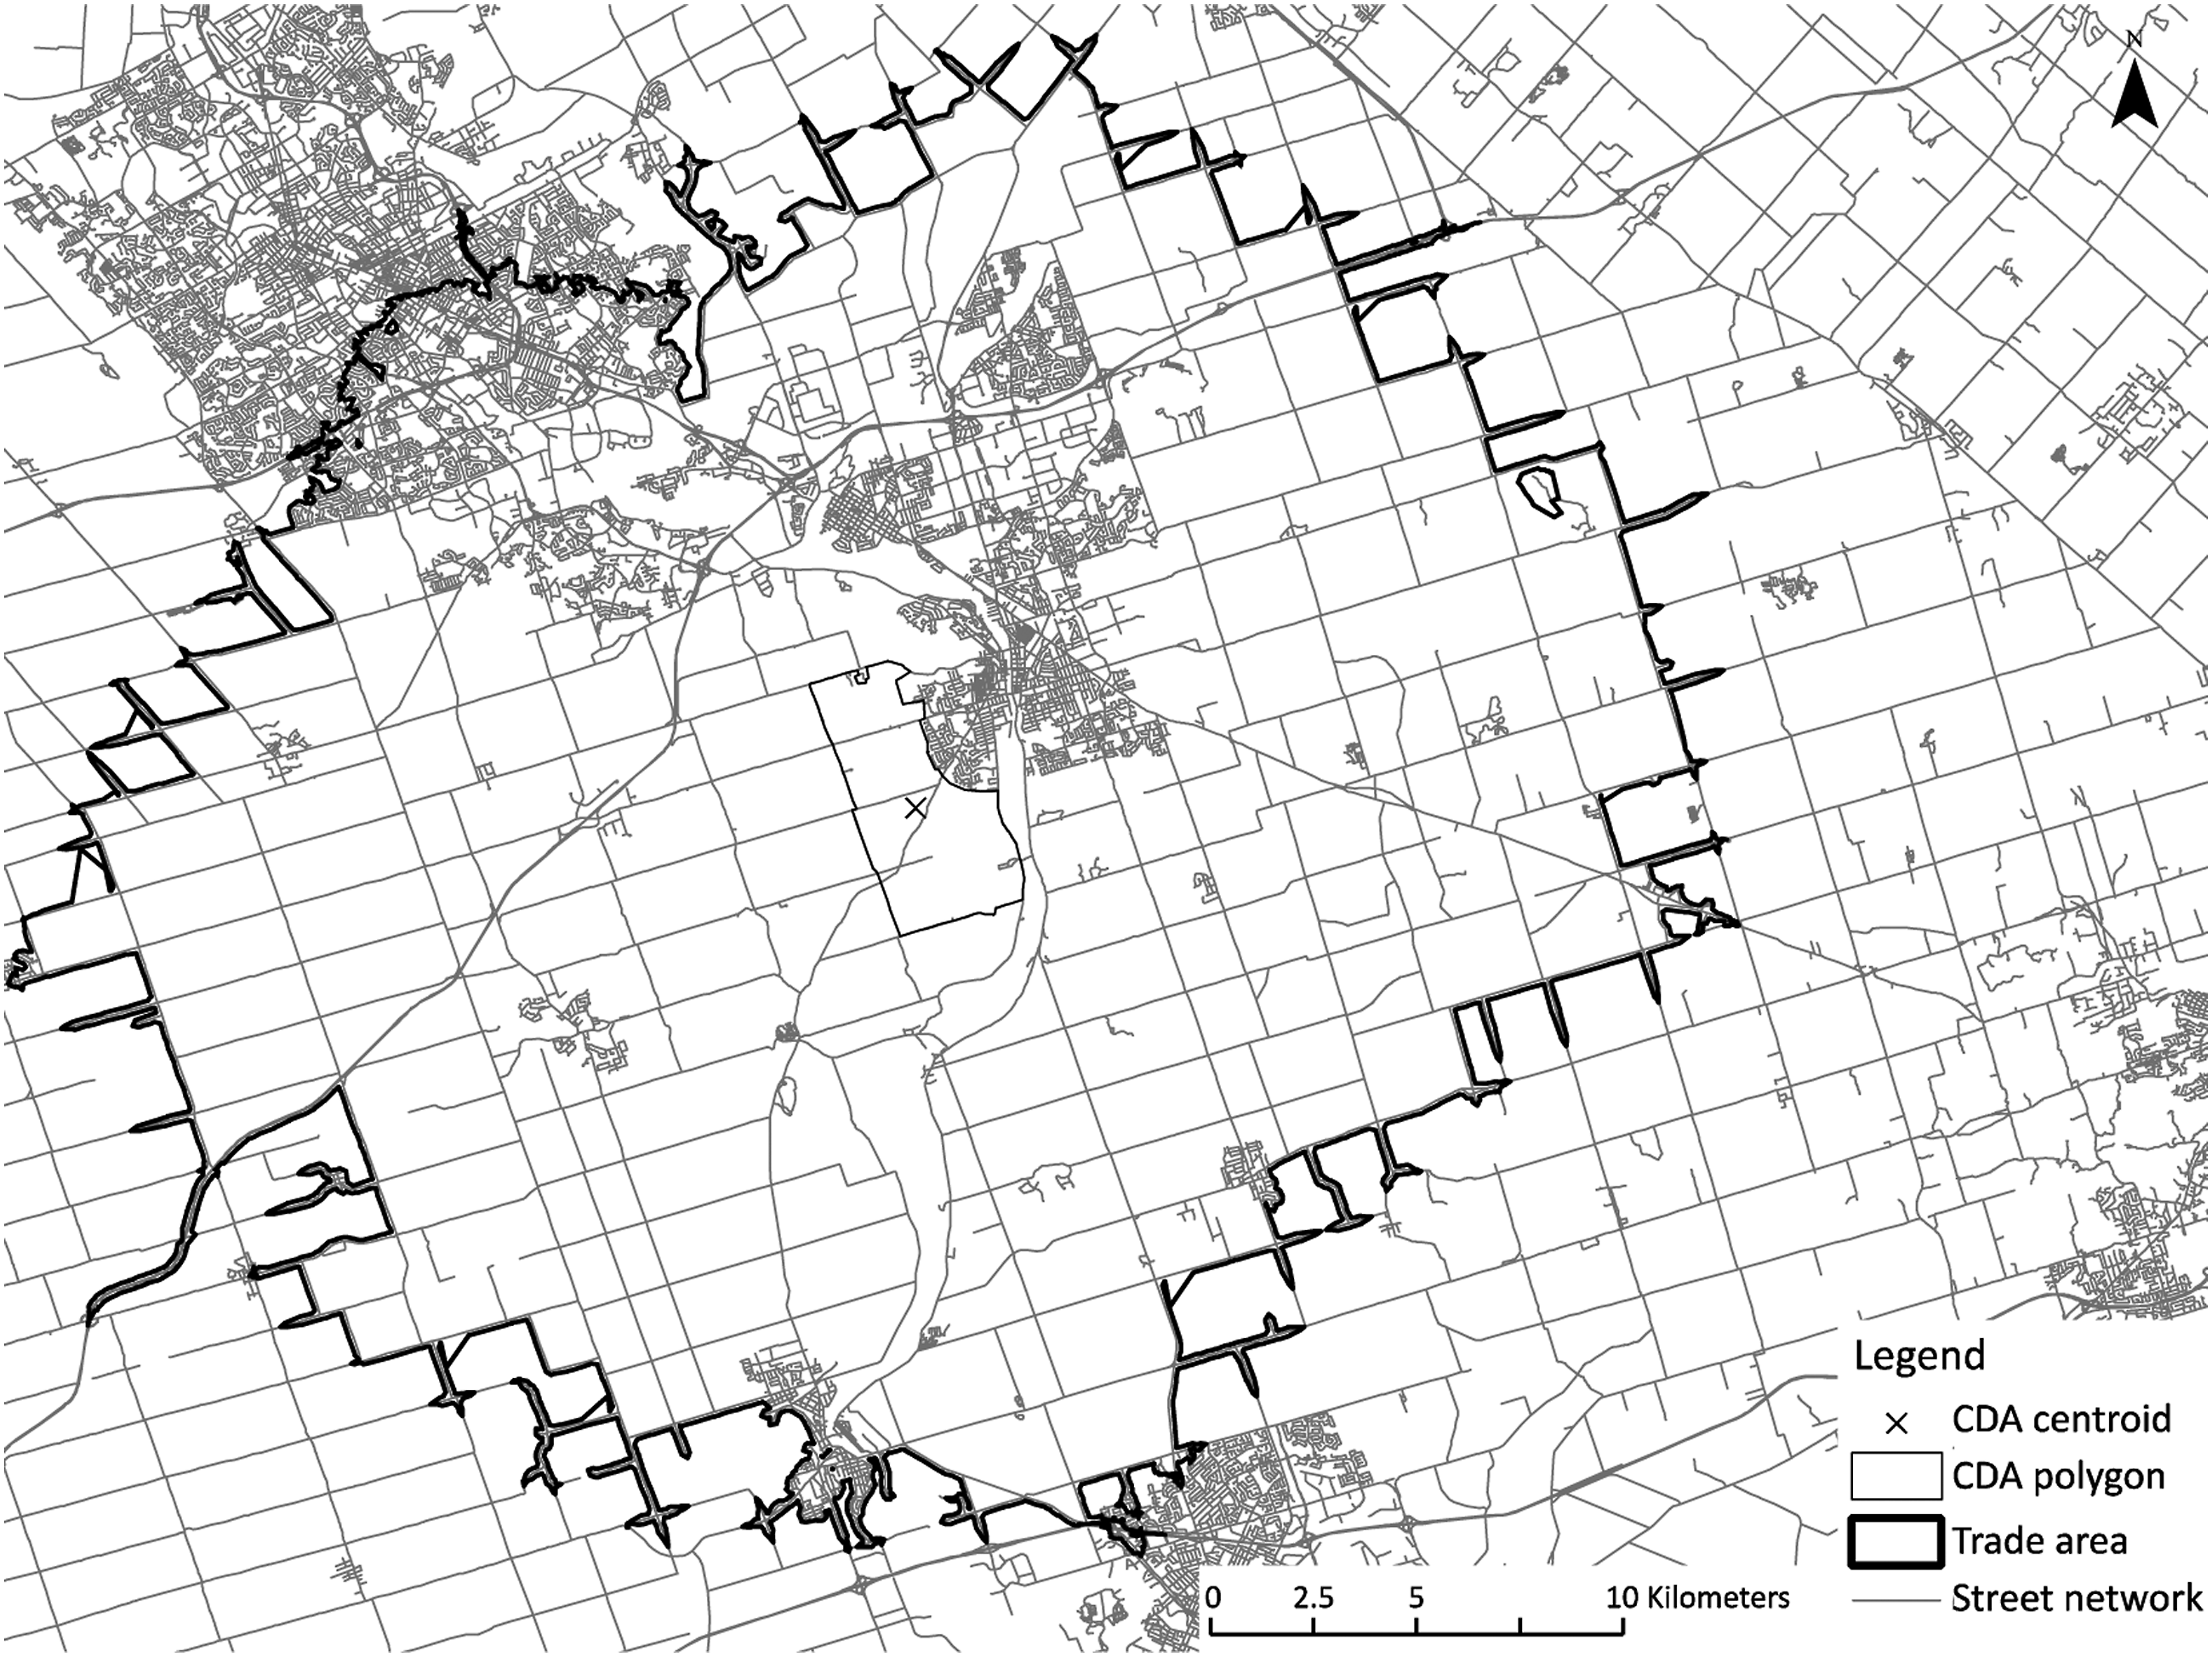
Market Representation
The degree of under- and over-market representation of a retail segment provides an indication of the level of unserviced demand or market saturation. Using the ratio of retail chains associated with home improvement products to all retail stores, we quantified market representation using a location quotient (LQ; Strother, Strother, and Martin 2009), which is expressed as the following:
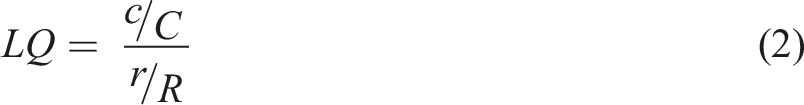
The location quotient expresses a ratio of proportions between two economic regions of different spatial extents (i.e. trade area representation relative to provincial representation). A location quotient value less than 1 represents an under-represented trade area relative to Ontario, and a location quotient value greater than 1 indicates a trade area with an over-representation of home improvement retail stores (Strother, Strother, and Martin 2009). Potential parcels with a location quotient value of 1 or greater were considered unsuitable and suitability increased as location quotient decreased.
Competitor and Retail Density
The number of competitors and retailers per square kilometre within a trade area were calculated, which provide measures of competition and agglomeration within the trade area of a potential site (Fotheringham 1985). Density was chosen rather than absolute quantities of competitors and retailers to account for variations in the size of trade areas throughout Ontario. 4 As the competitor density in a trade area increased the suitability of the potential location decreased. Conversely as the retailer density increased, the suitability score for that criterion increased. While these two criteria represent a significant simplification of the processes of competition and agglomeration, their density-based approach maintained spatial heterogeneity and mitigated the computational overhead required to represent these processes across such a large spatial extent.
Potential and Competitive Expenditures
We define potential and competitive expenditures as the allocation of demand (estimated with known consumer spending on home improvement products by Robinson and Balulescu 2018) to a potential store location in the absence and presence of competition. Trade areas are typically used to quantify potential expenditures that may be allocated to a store placed at a potential site (e.g. Öner 2014). The partitioning of demand among multiple stores in a trade area is often calculated using Huff’s model (Huff 1966). Huff’s model is a consumer choice model that determines the probability of patronage at a particular store as a function of the spatial interaction cost of travelling to that store and the attractiveness of a store. This representation reflects both the consumer’s preference to minimise costs and maximise opportunities (i.e. the purchasing desire of a consumer). While our industry partners provided average travel time, we were unable to acquire specific consumer sales data to formally calibrate Huff’s model (e.g. Suárez-Vega and Santos-penate 2015). In the absence of those data, we opted to use an inverse-distance weighting with an exponent of one to simplify interpretation of the distance relationship and avoid making additional assumptions related to the shape of various potential distance decay curves (e.g. Taylor 1975).
To calculate both potential and competitive expenditure criteria, Huff’s model was configured with one new potential store located and all consumer expenditures in the trade area allocated to that potential store (i.e. potential expenditures criterion) or among all competitors including that potential store (i.e. competitive expenditures criterion). Spatial interaction costs were calculated through the Ontario Road Network using travel time. Again, the large number of potential sites required the aggregation and representation of parcels by CDA centroid to achieve reasonable computing times. The demand allocated to each potential store location was summed per model iteration to obtain potential and competitive expenditures at each of the 19,964 CDA centroids. Expenditures were then disaggregated back to the parcels within each CDA and suitability scores were calculated such that greater potential and competitive expenditures led to an increase in the suitability score for each criterion. In computing competitive expenditures, unpublished location and retail area data on select home improvement retail chain stores were used to inform the attractiveness of competing stores. As a result, the competitive expenditures assume that all alternative stores are direct competitors that control for other factors that may influence store attractiveness (e.g. product ranges, pricing, availability, store hours and staff helpfulness among others).
Normalization of Criteria Values
Once the criteria values were calculated, they were normalised (0, 1) to enable their comparison and to establish a conceptual relationship between a criteria value and a suitability score (Jiang and Eastman, 2000). A value of 0 represents unsuitable and a value of 1 represents perfect suitability. The conceptual relationship between a criterion value and suitability score may be described using fuzzy membership functions that can provide non-linear suitability responses to criteria values (e.g. Jiang and Eastman 2000; Dixon 2005; Feizizadeh et al. 2014). In our suitability analysis, the relationship between a criterion value and suitability score was simplified to a linear relationship because the direction of the relationship was known, but the shape was not.
With the exception of the location quotient, criteria scores were based on the criteria value at a potential site as a proportion of the maximum criteria value observed in the province. This procedure has important implications with respect to the application of constraints. Our choice to apply constraints at the end of the suitability analysis process means that the maximum criteria value from the province is used regardless of what constraints are imposed.
Development and Application of Criteria Weights
The weight of a criterion is critical to the calculation of a suitability score, as weights directly inform the importance of criteria to the suitability of a potential site. To derive criteria weights, a social survey was administered to retail industry experts in upper management (e.g. senior vice president, executives of real estate and operations, market research managers and analysts) with experiential knowledge and decision-making influence on store location choices within the same home improvement retail company with significant market share in Ontario (n = 11). 5 Using a modified Delphi approach, respondents ranked our nine criteria according to their importance (1 being most important, 9 being least important) in affecting the suitability of a location for a home improvement retail store. Responses were averaged, their reciprocal was taken to ensure more important criteria reflected higher suitability scores, and a weight was derived by dividing the reciprocated criterion ranking by the sum of all reciprocated criteria rankings (Carr and Zwick 2007).
The set of criteria weights sum to one such that relative differences between criterion weights are normalised and directly comparable in their importance to suitability (Malczewski 2006). A weighted linear combination of criteria scores is used to calculate a suitability score for every potential site using the following formula:

Application of Constraints
Although suitability scores are calculated across all potential sites using preferential criteria and expert-informed criteria weights, constraints are applied to eliminate property parcels that are unsuitable for development. Parcel area, land cover, and spatial relationships with exclusive land uses such as protected parks or public infrastructure provided the basis for constraining site availability. Parcels with an area less than 80,000 square feet (7432 m2) were removed as a constraint on store size since it constituted the median store size of big-box stores with sales in the home improvement sector across Ontario, which included Canadian Tire, Home Depot, Rona, Sears, Target, The Bay, and Wal-Mart.
In addition to store size, a high proportion of forest cover (≥ 50%) within a parcel constrained parcel availability, due to potential issues with environmental assessment regulations. Other land uses and environmental constraints involved removing parcels that contained First Nations reserves, provincial and national parks, the Niagara Escarpment, wetlands, rivers and lakes, public schools, churches, cemeteries, railway stations, railway lines, and energy pipelines. In addition to these constraints, some parcels had high perimeter to area ratios and were likely owned by institutions or were part of property aligned with the road network. Parcels with a perimeter-to-area ratio greater than 0.05 were selected and visually interpreted with most being removed. While we did not implement an algorithm for the acquisition of multiple parcels (e.g. residential parcels) that when combined could be suitable for a new home-improvement store, our application of constraints after applying suitability scores for all parcels across the province enables the user to manually interrogate those opportunities. Following the application of constraints, the number of available parcels used in our analysis was reduced from approximately 4.7 million to 153,459 parcels.
Results
Criteria Weights Survey
Mean Rank and Weight of Suitability Criteria.
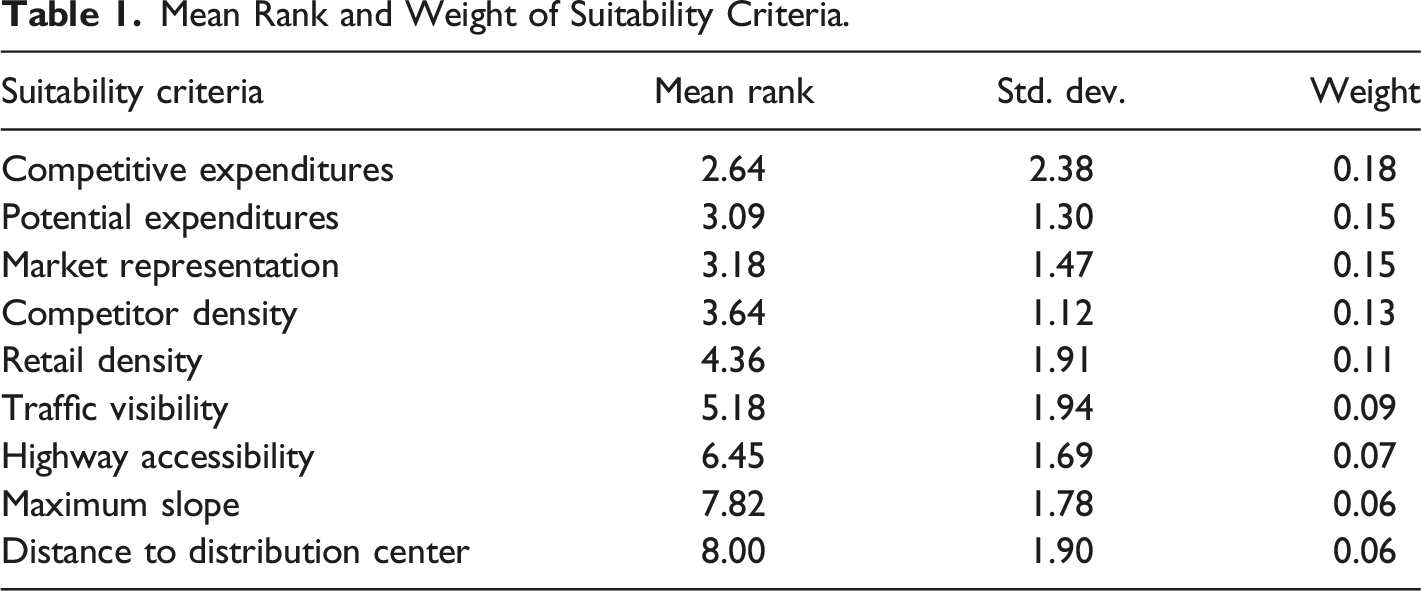
The criteria ranked from most important to least important are competitive expenditures, potential expenditures, market representation, competitor density, retail density, traffic visibility, highway accessibility, maximum slope, and lastly, distance to the distribution centre. Of the nine criteria, distance to the distribution centre was ranked lowest 7 of 11 times, suggesting that order and fulfilment of inventory (i.e. supply-chain travel) costs are of little priority relative to top-line revenue generation, market capacity, and other factors that are difficult to quantify like first to market. This finding is interesting given the amount of literature focused on the reduction of travel costs through centralized warehouse planning. Similarly, site development costs, using the maximum slope criterion as a proxy was also nearly uniformly ranked as the second least important variable. Both distance to the distribution centre and maximum parcel slope represent costs of operation and development, which were viewed as less important to the other seven criteria that are drivers of market demand (i.e. top-line revenue).
Reviewing the standard deviations of ranked criteria demonstrates that variation existed among expert rankings (Table 1). The lowest standard deviation in ranking occurred for the potential expenditures criterion and the highest occurred for the competitive expenditures criterion. Potential expenditures consistently ranked second, third, or fifth and in nine of 11 responses it was ranked immediately below competitive expenditures. While competitive expenditures ranked most important in seven of 11 responses, other responses ranked market representation, retail density, competitor density among other criteria higher. Overall, these results suggest that estimates of expenditures play a crucial role in retail site selection and criteria related to development and operations costs were least important.
Provincial CMA Summary
The distribution of suitability scores varies spatially across the province. When suitability scores are aggregated to the northern and southern regions, their distributions are significantly different from each other and both differ from the provincial distribution (p < 0.01). There are fewer CMAs in northern Ontario (8 of 43) and these CMAs offer fewer suitable sites per CMA (average of 800) and lower suitability scores compared to southern Ontario (average of 2,397; Figure 7) suggesting that store siting should proceed with extreme caution in northern Ontario. The southern CMAs produce a higher minimum suitability, wider range, higher mean (42.6), and higher 90th percentile mean (47.7) compared to the CMAs of northern Ontario. Summary statistics of CMA-based suitability scores, ordered by descending mean suitability score above the 90th percentile. Count refers to the number of suitable parcels in the CMA and S.O. = southern Ontario, N.O. = northern Ontario.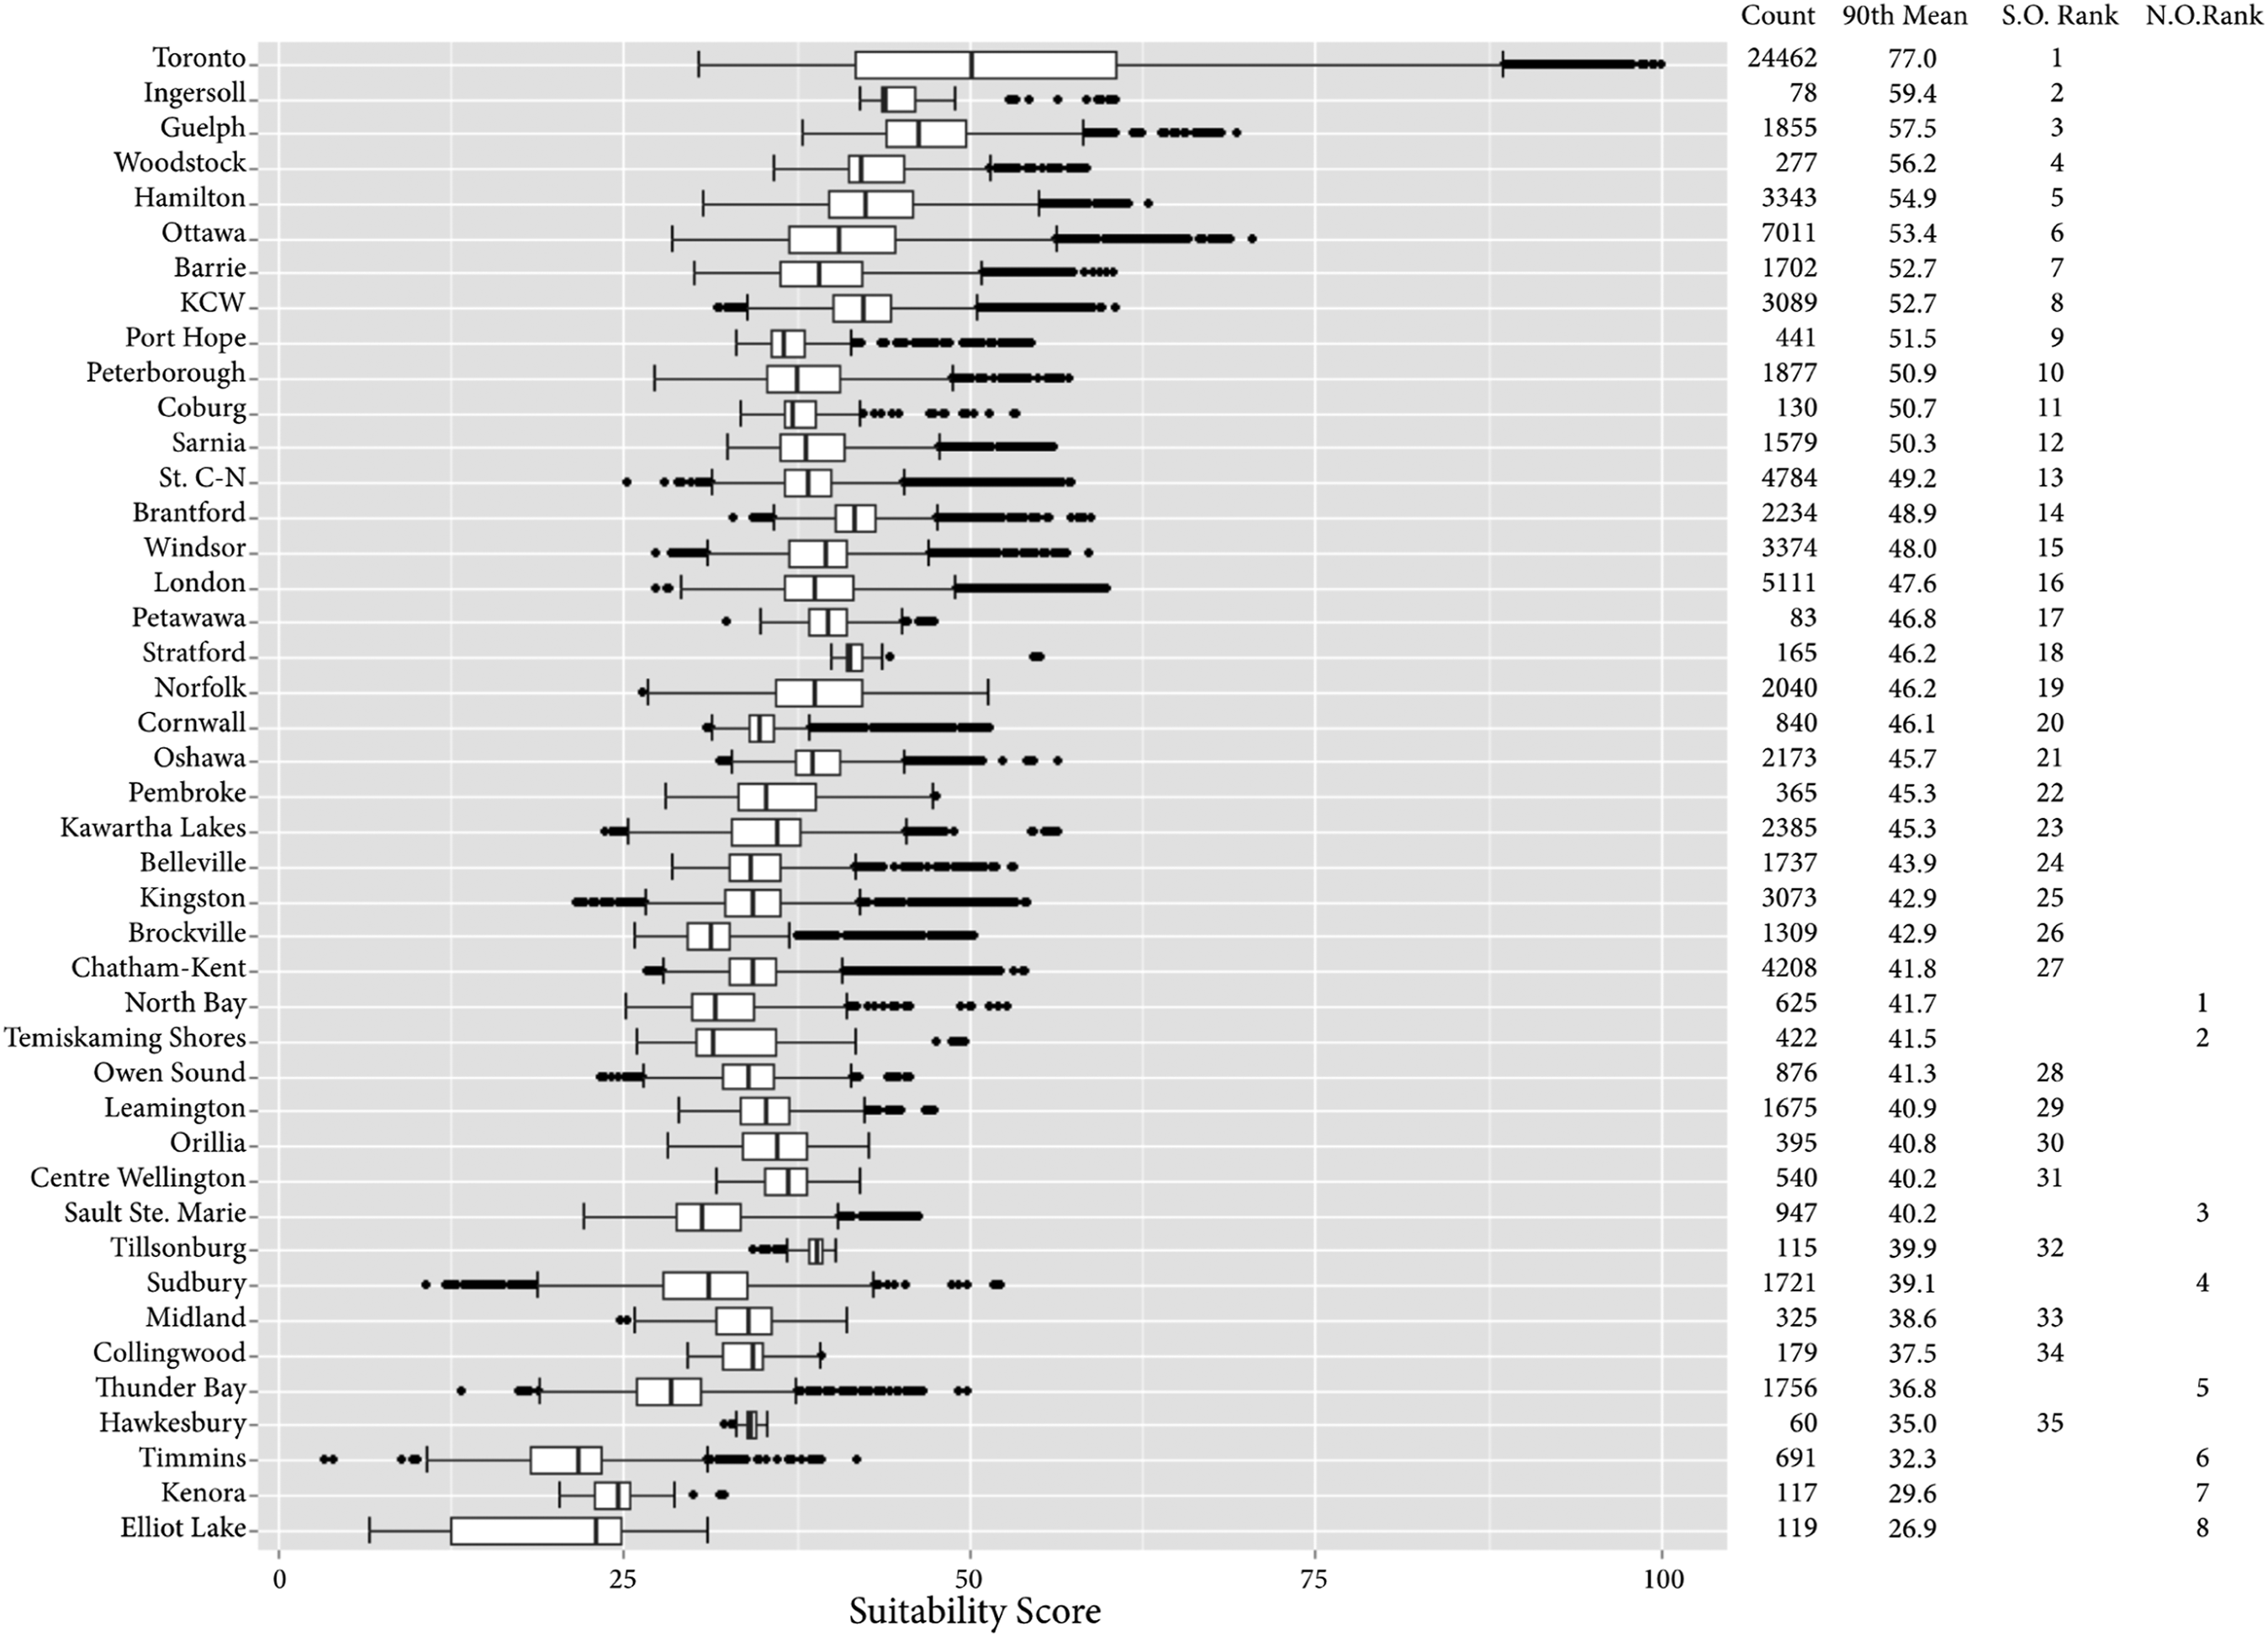
In southern Ontario, Toronto dominates the landscape of retail location suitability with both the highest mean 90th percentile score observed provincially and the largest number of potential sites of any CMA (Figure 7). These results are expected since the Greater Toronto Area is the most populous region in Ontario (Wolfson and Frisken 2000) and the Toronto CMA contains 27% of available parcels in all CMAs and 15% of all suitable parcels within the province. Of suitability scores at or above the provincial 75th percentile, which comprises 3,593 potential sites, only seven are located outside the Toronto CMA (one in Ottawa – Gatineau and six in Guelph). Among the selected criteria, the large population and economy of Toronto drive the demand underlying the potential and competitive expenditures as well as the accessibility of potential sites to major provincial highways and high traffic volumes.
In addition to Toronto, the other CMAs in the top five, ranked by mean 90th percentile suitability score are Ingersoll, Guelph, Woodstock, and Hamilton (Figure 7). While we expect Guelph and Hamilton to perform well, the high ranking of Ingersoll and Woodstock is interesting. Both Ingersoll and Woodstock have relatively small populations (approximately 12,000 and 38,000 respectively) and few potential parcels, 78 and 277 respectively. However, these small neighbouring CMAs are located along the province’s busiest highway (i.e. the 401) that has an average annual daily traffic greater than 60,000 vehicles (2010 Ministry of Transportation) and they are located less than 100 km (1 hour drive) of the city centres of Brantford, Cambridge, Hamilton, Kitchener, London, and Waterloo, whose suburbs all have substantial populations and many of which have clusters of households with high expenditures on home improvement products (Balulescu 2015).
While we do not speculate that Ingersoll and Woodstock are drawing substantial trade from multiple larger CMAs in their proximity, their location does coincide with Reilly’s Law of retail gravitation, where two cities competing for trade from a town located between them would attract trade in direct proportion to the city populations and in inverse proportion to the distance of each city to the town (Reilly, 1931). Rather than selecting a retail location site within one of the cities, the highly suitable areas theoretically based on Reilly’s law and observed in our calculations for Ingersoll and Woodstock suggest that an optimally located site relative to multiple cities could be successful. While we would exercise caution in interpreting these results as definitive, consumer’s typically travel further for higher priced items, which is likely why household and appliance sales remain a stable minority of total retail sales in downtown Toronto (Hernández and Jones 2005) and big-box retailing is often found in surrounding suburban regions (Jones and Doucet 2000).
Our summary of CMA suitability scores across the province demonstrates that while it is possible to conduct a criteria analysis across large spatial extents (e.g. Ontario) at fine spatial resolutions (e.g. the ownership parcel level), these data may be aggregated to spatial units that offer an initial scale of site selection that differs from traditional methods based solely on population and demographic characteristics or market share at large spatial units (e.g. CMAs). Because it is unlikely that the most optimal site (parcel) will be available for purchase or lease, we rank location opportunities using the mean suitability scores for parcels above the 90th percentile, which suggests multiple site selection opportunities are available. Furthermore, by creating a distribution of parcel suitability scores for each CMA, the abundance and variability of suitable locations is known and therefore the likelihood of finding a location meeting a satisfactory threshold for the retail chain is higher and the reasoning more transparent.
Census Metropolitan Area (CMA) Analogues
Often, due to the absence of sales and market data for a new region, retail companies will identify analogues for a city or trade area that has an existing and highly successful store as a potential future store location. To create a relationship between CMAs comprising one of our 25 home improvement stores with known store performance to potential storing location opportunities in other CMAs, we compared the mean suitability score among all 43 CMAs using a pairwise Wilcoxon rank-sum test, which showed that only 10% or 90 of 903 pairs were statistically similar (Figure 8). CMAs that show statistically similar mean suitability scores offer an objective approach to the identification of analogues that may facilitate the search for store location opportunities. For example, Peterborough, Coburg, Port Hope, and Tillsonburg are four cities that are isolated from large markets and have a statistically similar mean suitability score. In contrast CMAs with few analogues may require a unique approach to store location decisions. For example, Kenora and Thunder Bay are not statistically similar to any other CMA. Pairwise comparison of mean suitability score among 43 CMAs for Ontario. Grey boxes denote statistically similar mean suitability values. All tests were conducted with a p-value < 0.10 and Bonferroni correction.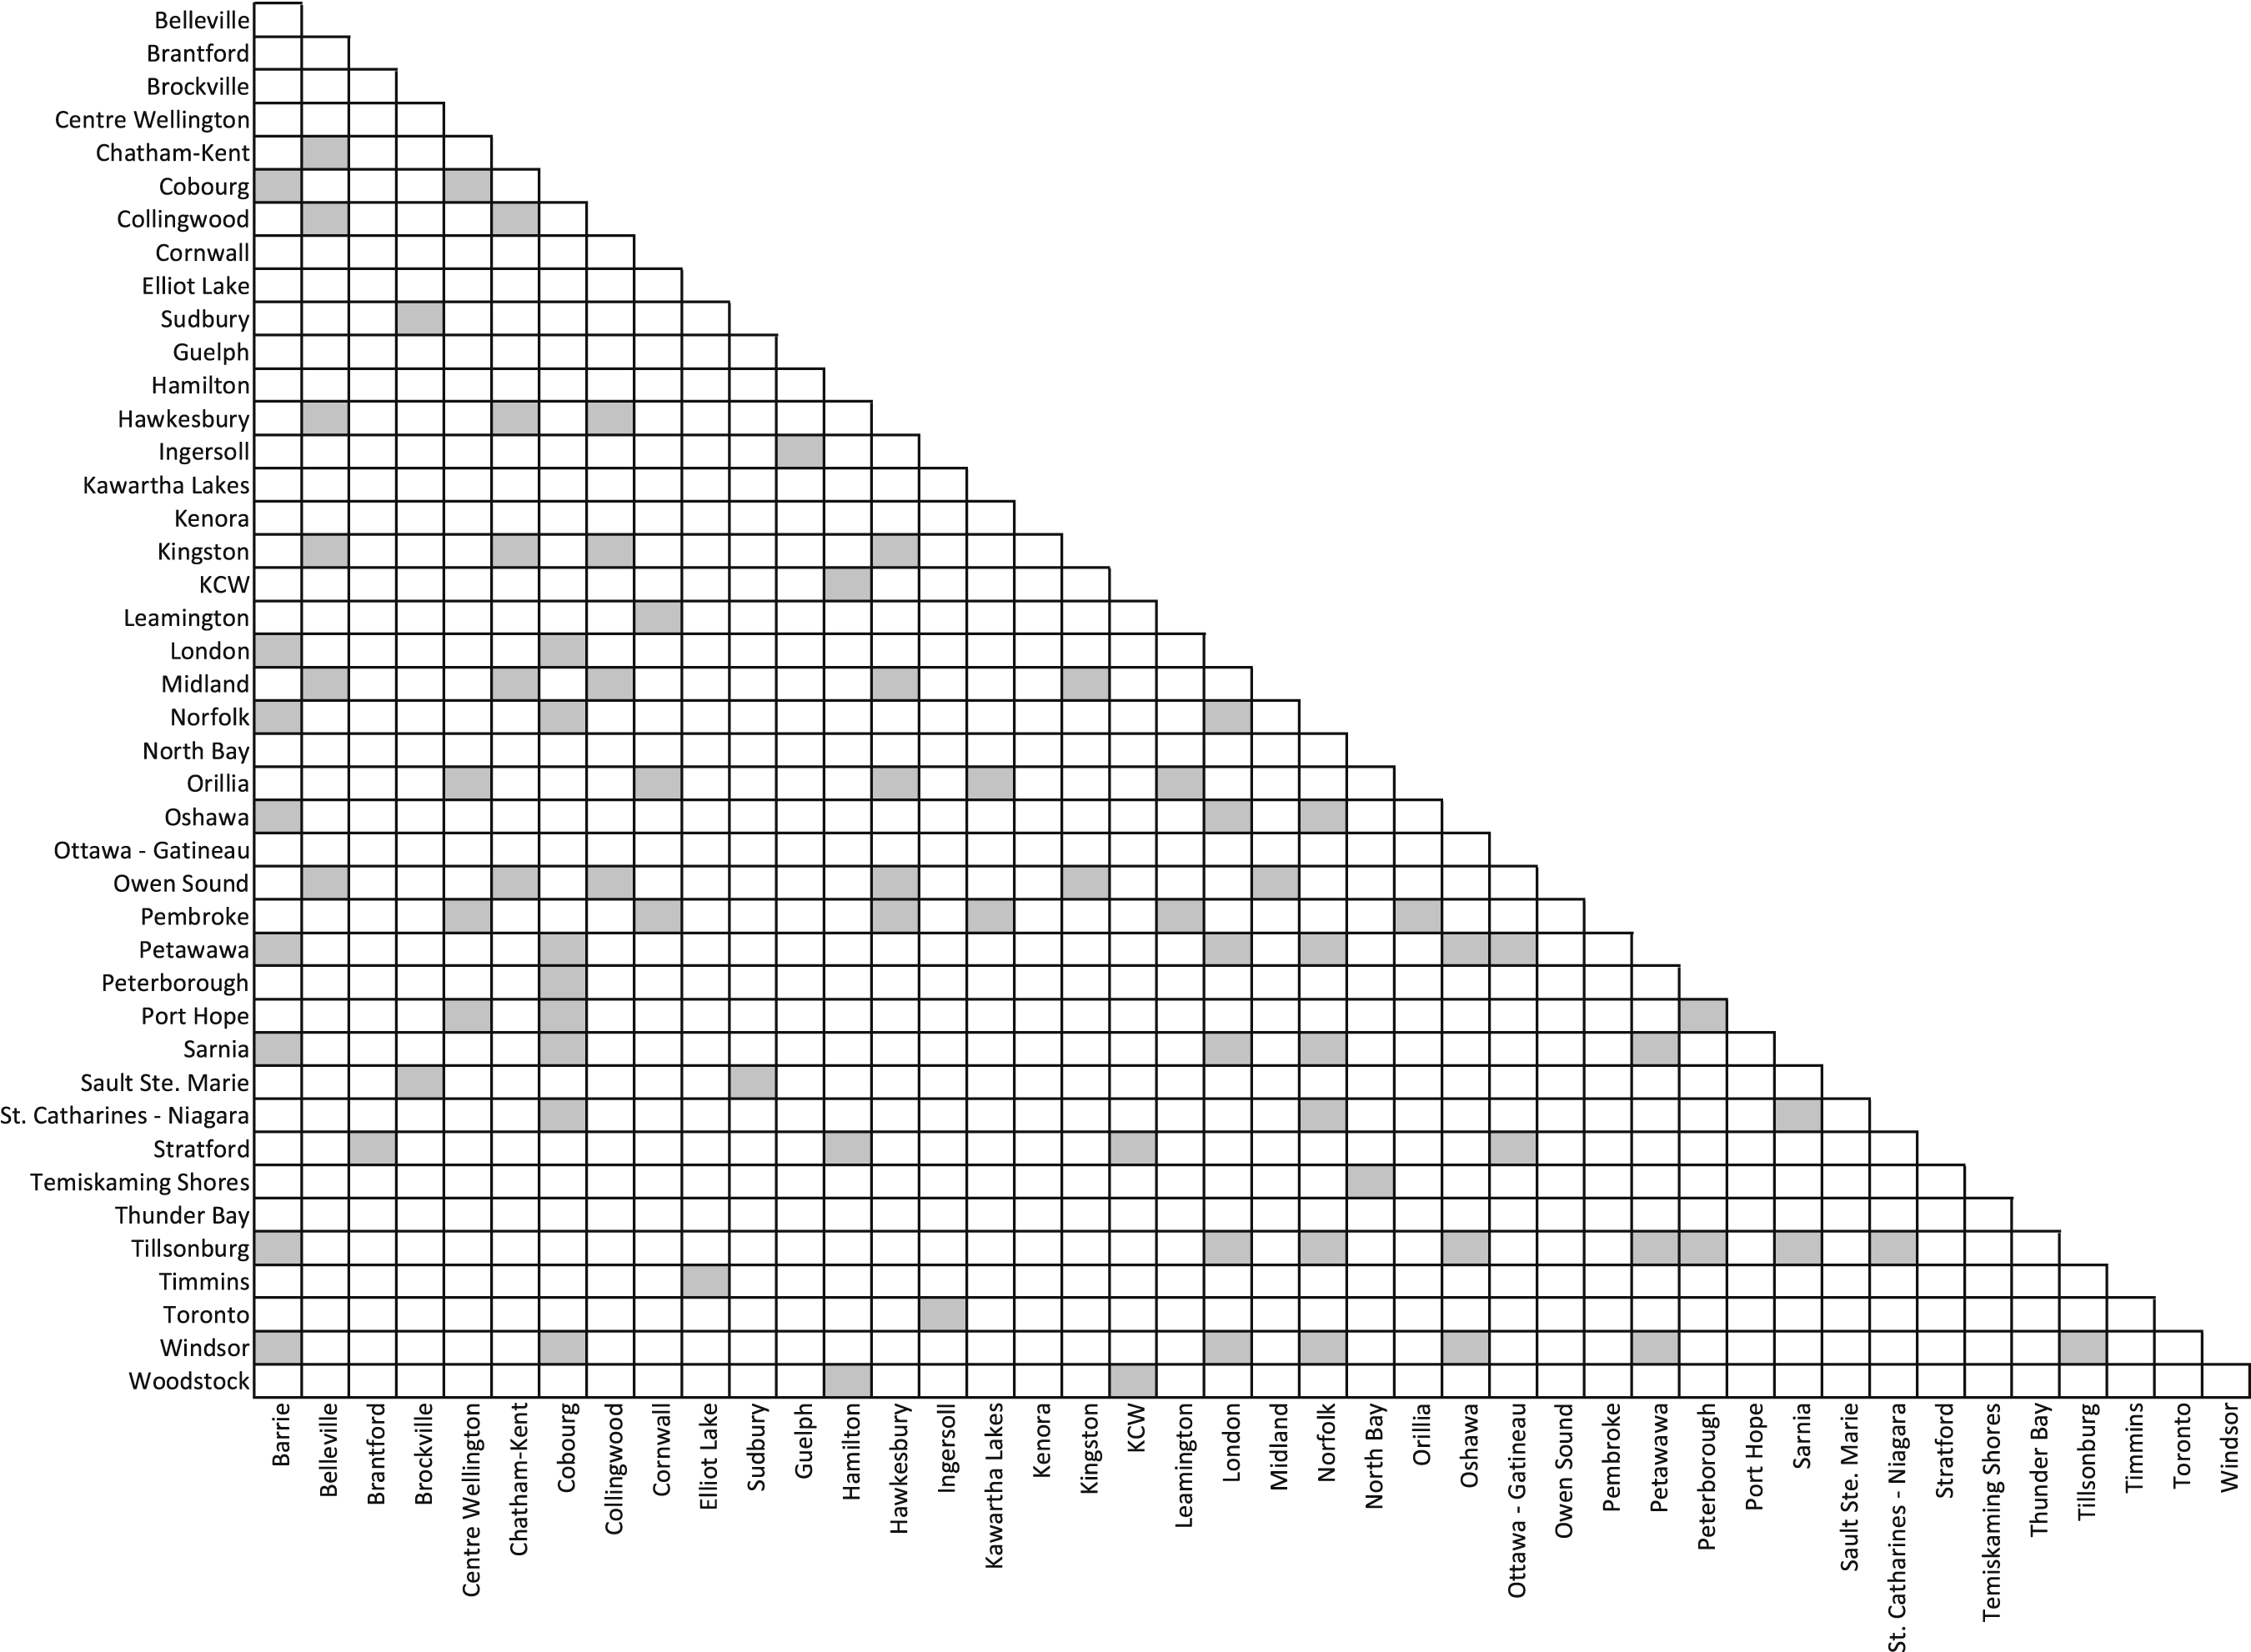
K-Means Cluster Analysis on Suitable Parcel Distributions for 43 CMAs of Ontario.
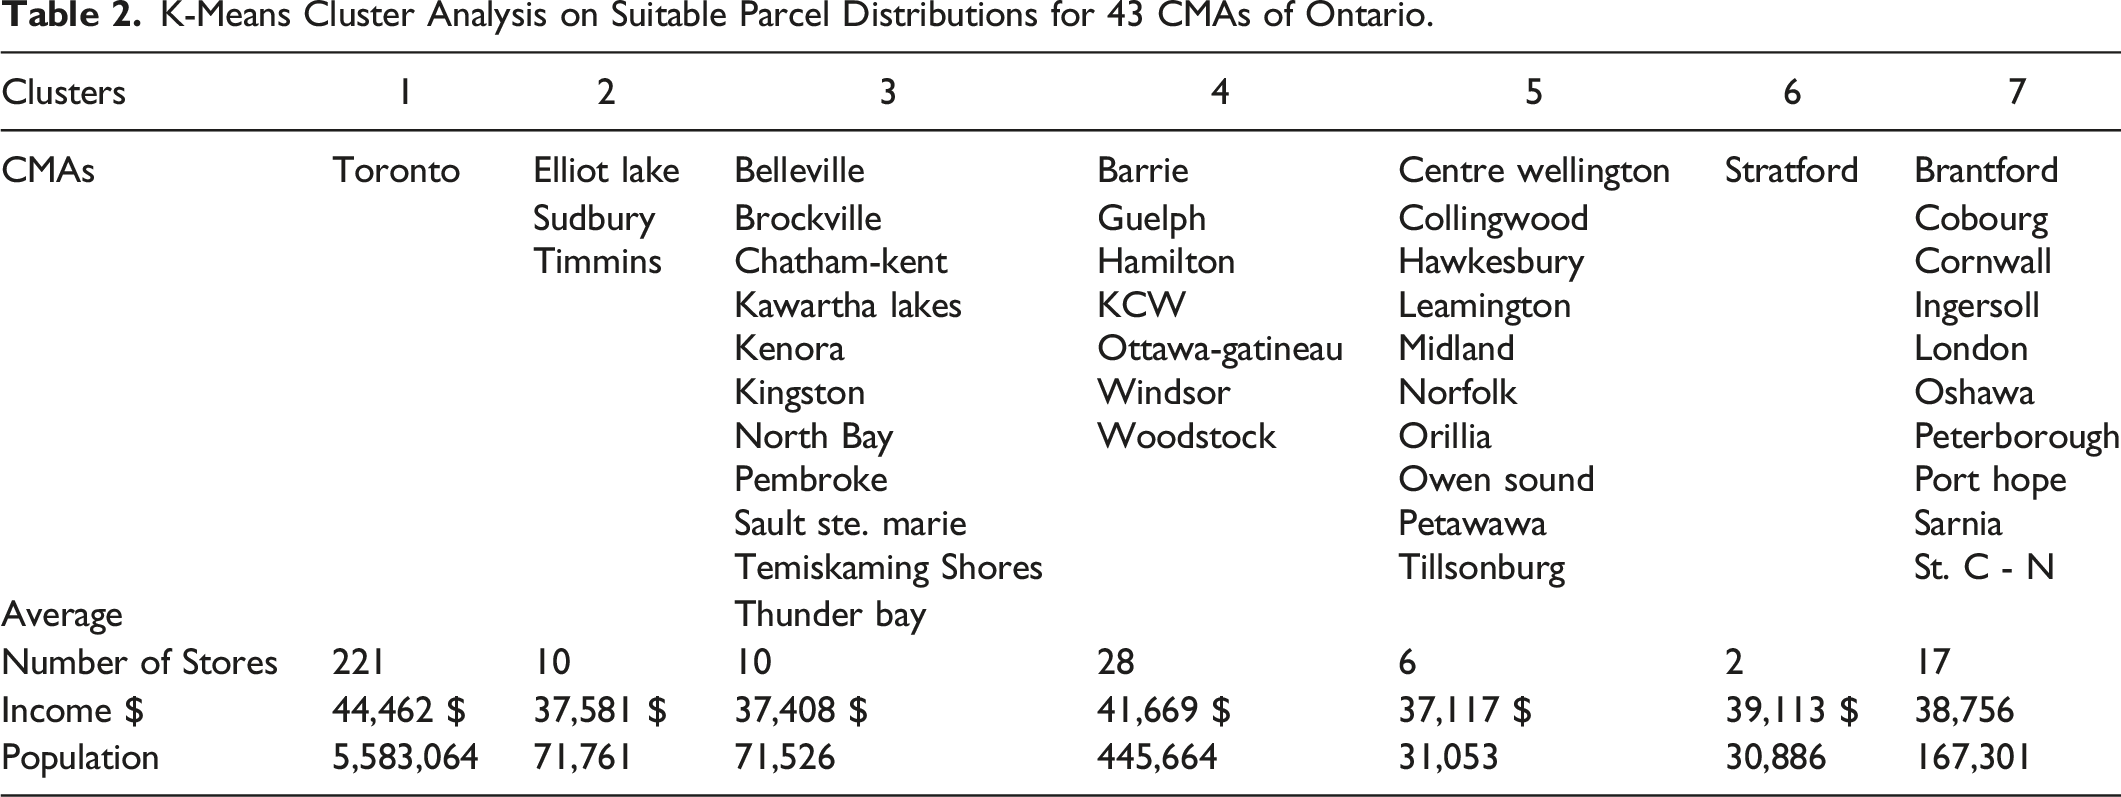
The cluster analysis groups CMAs that share similar distributions of suitable parcels for locating a home improvement store. Not surprisingly, Toronto forms a cluster of its own (Cluster 1) comprising the highest mean and 90th percentile suitability scores as well as the highest number of available parcels. Three northern CMAs (i.e. Elliot Lake, Sudbury, and Timmins) form Cluster 2 and share a high variance in suitability scores, low number of available parcels, and lower mean suitability among parcels in the 90th percentile within the CMAs. Cluster 3 CMAs have a low number of available parcels, a lower variation in suitability scores, a higher right skew, a higher mean, and a higher mean in the 90th percentile than Cluster 2. Cluster 4 is composed of medium sized cities and, after Cluster 1 (i.e. Toronto), have the highest mean suitability scores, highest means in the 90th percentile, and a large number of available parcels. Cluster 5 is made up of smaller CMAs that have a low standard deviation, low parcel count, and relatively high mean parcel suitability, but a low mean 90th percentile parcel suitability and therefore relatively low right skew. Cluster 6, Stratford, is unique as it has the highest right skewed distribution, few suitable parcels, a high mean and low standard deviation, and a low 90th percentile mean suitability score. All CMAs in Cluster 7 (except Peterborough) are located along the 400 series highways in Ontario and have suitability score distributions that are slightly less preferable (e.g. lower mean parcel suitability) than those in Cluster 4. 6
When we compute the average annual store sales (n = 25) for each of the seven clusters we find that they differ substantially. The proprietary nature of these data precludes a detailed description and the low n also limits statistical testing. However, we find that despite Cluster one having the largest number of stores, Cluster 4 has higher average annual sales. The difference, in multiple millions of dollars, would affect store location decisions. Clusters 3 and 7 have significantly lower average annual sales relative to Cluster 1 and 4. Other clusters have been censored and cannot be commented on in terms of sales. The result of tying sales data to our cluster analysis suggests that medium sized cities in Cluster 4 without stores should be pursued before locating stores in other clusters.
Spatial Distribution of Site Suitability
To investigate the spatial pattern of suitable retail locations across Ontario, suitable parcels were aggregated to one of 11,469 census dissemination areas (CDAs) covering the province. Mapping the maximum suitability for each CDA shows higher scores located in close proximity to major highways (Figure 9). We verified this outcome by calculating the Euclidean distance to highways and found that those in the 90th percentile had a mean distance of 1129.8 m and parcels in the 80th to 90th percentile had a mean distance of 1174.2 m from major highways. Suitability scores for census dissemination areas (CDAs) in southern Ontario, with inset showcasing scores for Toronto. CDA counts are shown in parentheses and the most suitable CDA in the province is shown in northwest Toronto.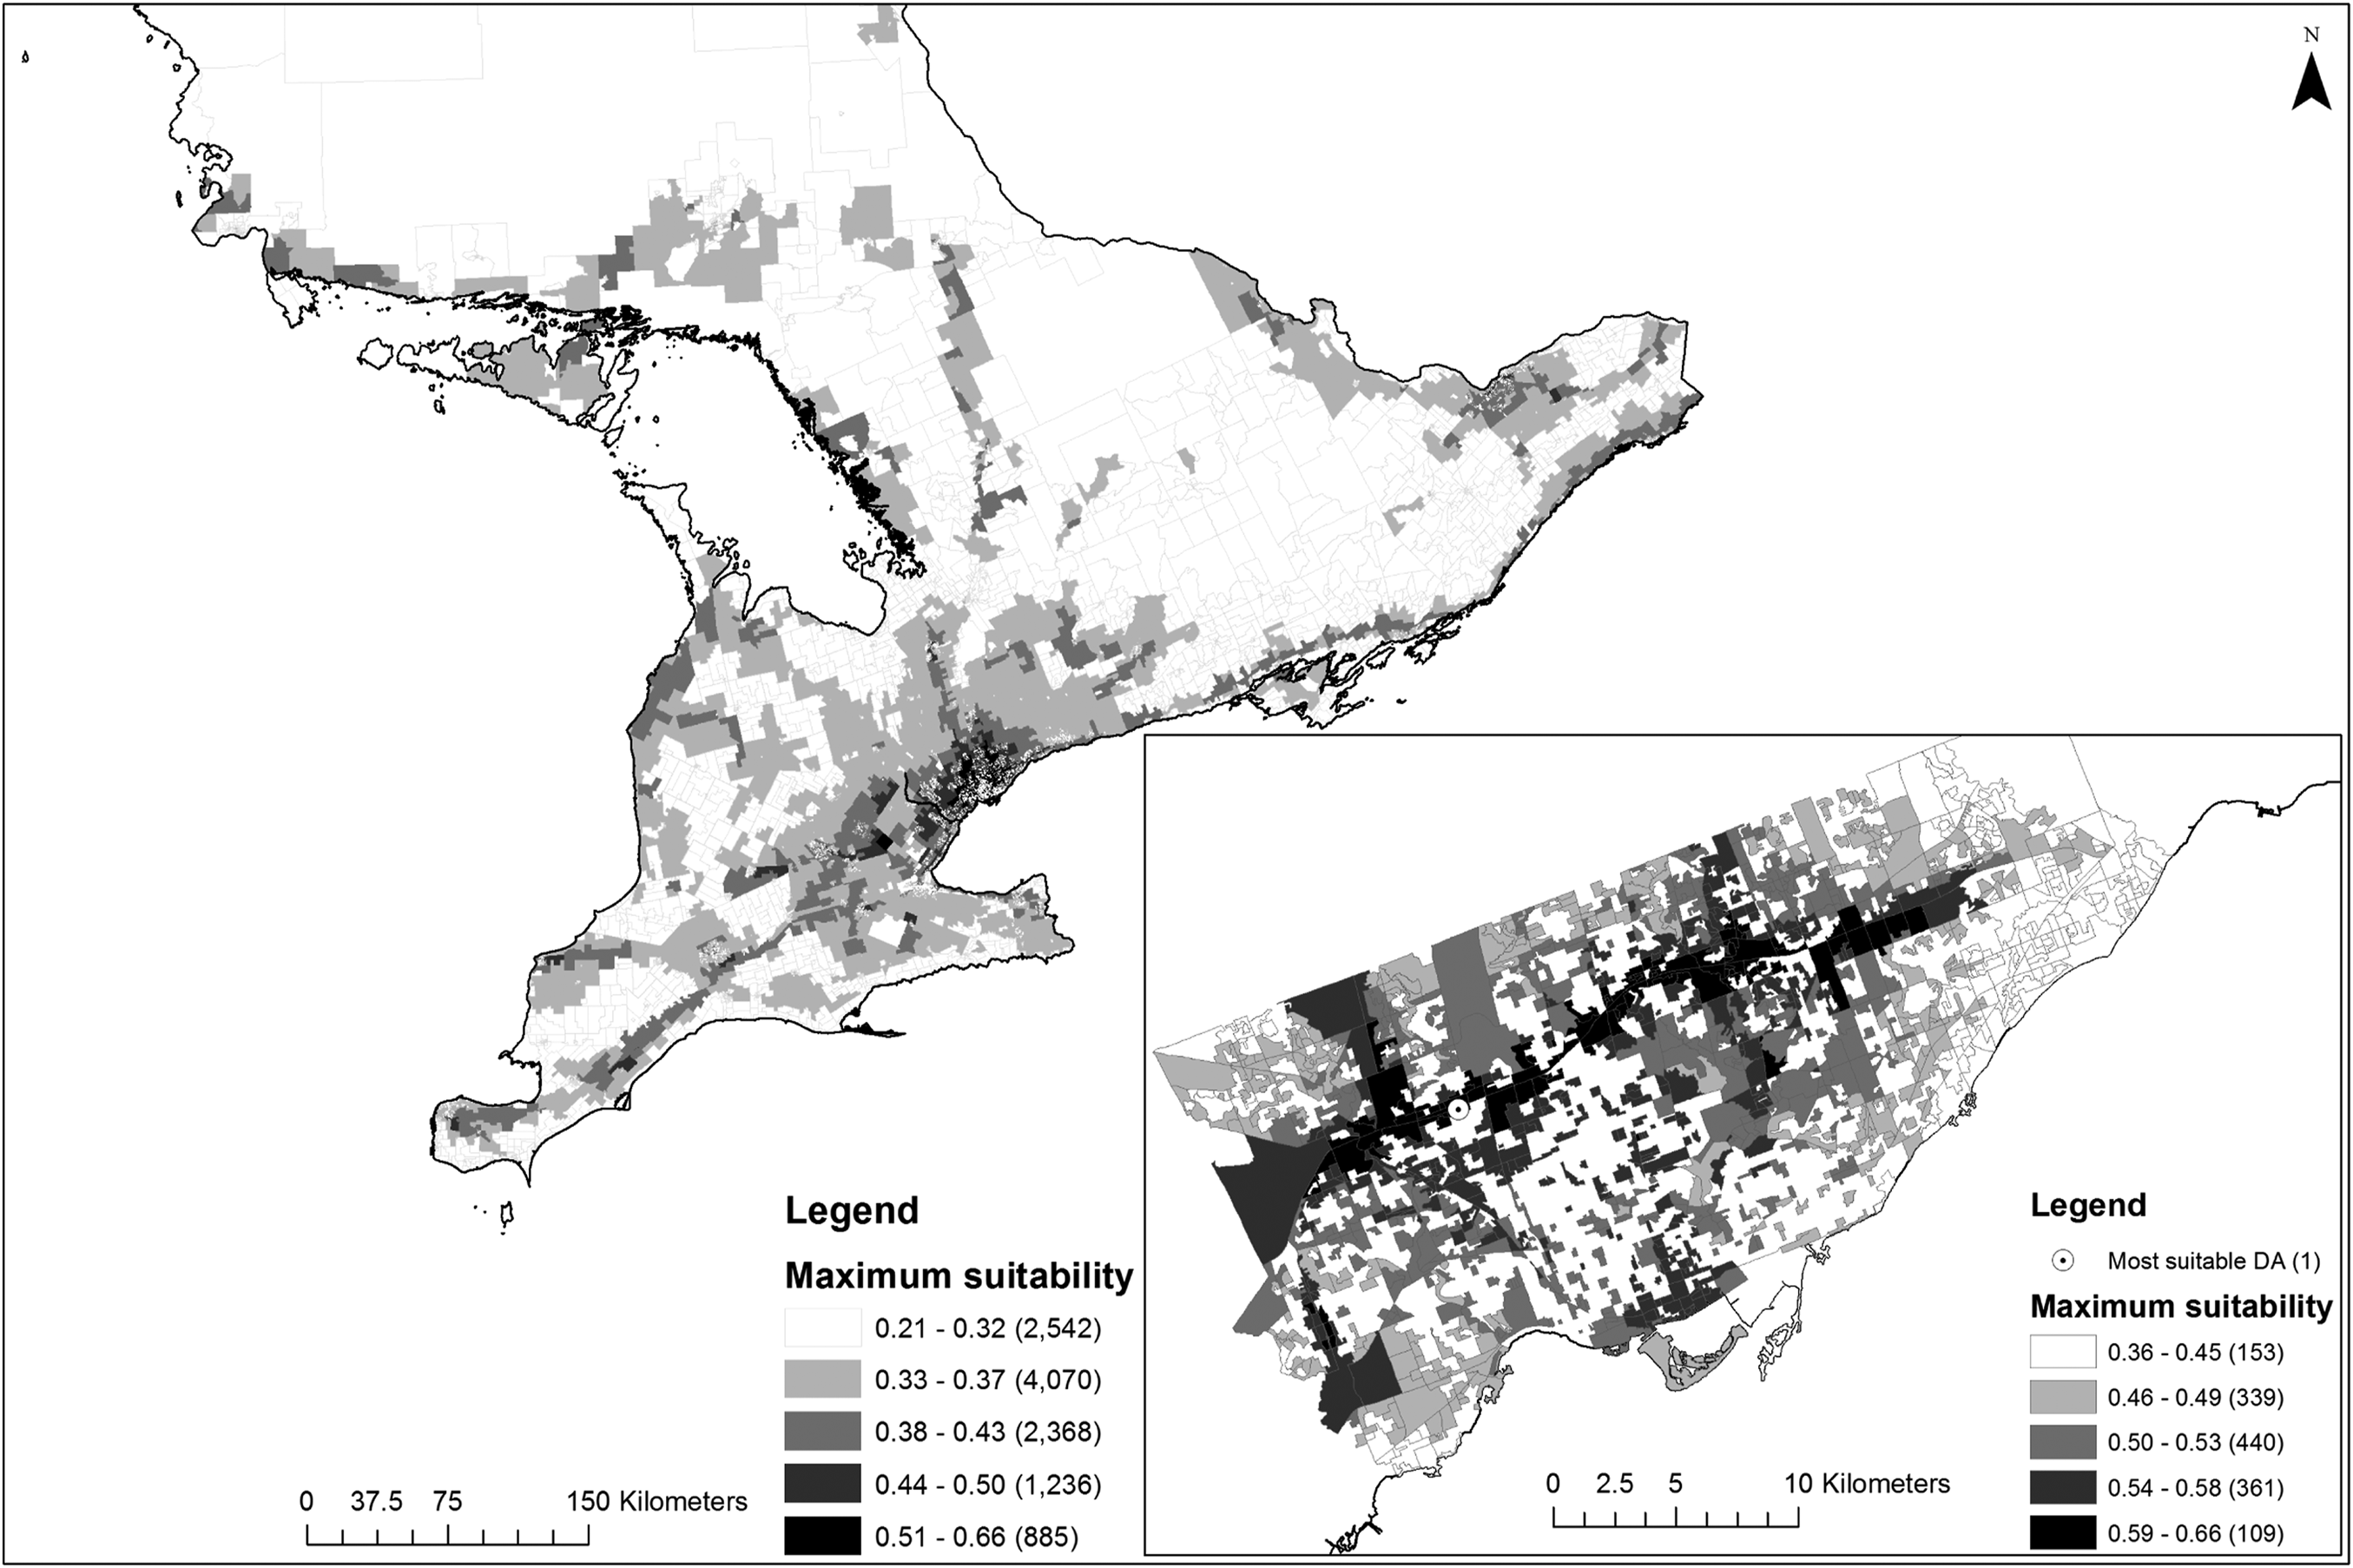
To identify if suitability scores were clustered spatially across the province, a global measurement of spatial autocorrelation in suitability scores was calculated. The global Moran’s I statistic (0.905) confirmed a strong and significant clustering tendency compared to a random spatial distribution of values (Expected value = -0.000,088, variance = 0.000,023, z-score = 189.20, p-value 0.0000). We then applied a local Moran’s I to identify spatial clusters of high-high, high-low, low-high, or low-low maximum suitability scores among CDAs across Ontario. Of the 11,469 CDAs, 21.3% are classified as high-high clusters, while 11.7% are classified as low-low clusters. The remaining 66.8% of CDAs were classified as not exhibiting significant clustering, while only 3 CDAs (in the Thunder Bay, Belleville, and Kingston CMAs) were classified as high suitability values surrounded by low values.
All high-high clusters were found within four of the top five southern CMAs by maximum suitability, with Toronto again dominating the landscape with 94.4% of all high-high clusters in the province. By contrast, Ottawa is the second largest in terms of containing highly autocorrelated CDAs of high suitability, with 5.3% of all high-high clusters. High-high CDA clusters extend southwest from Toronto and into the northwest of Hamilton along highway 403, producing two high-high clusters. Another two high-high CDA clusters are also located in the Guelph CMA. Despite these results, caution should be exercised since several of our criteria comprise explicit or implicit measurements of distance and relationships to the road network, which may over estimate suitability and inflate clustering in proximity to the road network.
Discussion
The outcome of our multi-scale suitability analysis yielded a number of results that specifically addressed our research questions. First, by surveying home-improvement retail industry experts from a multi-national company, it was clear that development and operation costs are a lower concern than top-line revenue generation related criteria. The value of high-quality data about consumer expenditures and estimates of revenue generation under competition and total market capacity were among the highest valued criteria.
An unanticipated outcome of collaborating with home-improvement retail experts was their desire to reduce the number of criteria and hesitancy to add additional criteria to the suitability analysis. Instead, they were more interested in having access to suitability scores for all 4.7 million parcels in addition to partitioning them based on our collective selection of constraints. This manual interrogation of the data supports industry’s desire for a multi-scale approach as the experts first investigated CMA scores, then began looking at clusters of high-suitability parcels within the CMA, finally they started exploring other parcels in and around those clusters based on their experiential knowledge. While this process was not formalized, it partly overcomes our lack of automating a process associated with the acquisition of multiple parcels to create a larger and possibly more suitable parcel.
Using the survey to weight nine criteria, the distribution of suitability scores was compared among census metropolitan areas (CMAs) across the province, which demonstrated significantly fewer opportunities for successful site selection in northern Ontario relative to southern Ontario. Therefore, new entrants to market or those seeking to expand should proceed with extra caution if contemplating establishing within Ontario’s northern CMAs. This finding was strengthened by a pair-wise comparisons and k-means clustering of the distributions of suitability scores of CMAs, whereby several northern Ontario CMAs were analogues.
A comparison of proprietary store sales data with our cluster analysis showed that store sales differed substantially among clusters and home-improvement industry retailers should strongly consider store placement in Cluster 4 (Barrie, Guelph, Hamilton, Kitchener – Cambridge Waterloo, Ottawa, Windsor, and Woodstock). Average annual sales from stores in Cluster 4 outperformed other clusters and the distribution of suitability scores for these CMAs had among the highest mean and mean of 90th percentile suitability scores relative to other CMAs. When individual suitability scores were assessed against average store sales (n = 20; consecutive 3-year average including 2011, but excluding first year of operation) using Spearman’s Rank Correlation, a correlation of 0.55 was obtained. However, even this simple comparison is difficult without matching time-series suitability data and further analyses since many stores had clear increasing or decreasing revenue trajectories. While the relationship between clusters and individual properties with suitability scores does not validate our survey-based criteria weighting, such an outcome was not expected by our collaborating industry experts since site suitability is only one of many strategic business practices (e.g. first to market, cut-off competitors, marketing through visibility, avoiding store closure to avoid bad publicity) that influence store location decisions and retail success.
At our second scale of analysis (census dissemination areas, CDAs), a spatial cluster analysis highlighted options within CMAs for locating a new home-improvement retail store. Results complemented the CMA analysis and identified clusters of CDAs with high suitability primarily within four CMAs (i.e. Toronto, Ottawa, Hamilton, Guelph). The multi-scale suitability analysis provides additional confidence for site selection within these CDA clusters since 1) these four CMAs contain the highest suitability scores and 2) Ottawa, Hamilton, and Guelph, all reside within Cluster 4 of our k-means cluster analysis that contained store sales well above those found in CMAs in other clusters.
The use of multiple scales in a suitability analysis offers an approach that can be applied to other study areas, and other types of retail, to increase the likelihood of finding successful retail store locations. However, the capacity for companies to replicate our analysis will be human-resource dependent and it is unlikely that the same criteria will align with the needs of independent or small-chain stores since those used were derived for large retail companies seeking to capture market share across large spatial extents. As a result of our collaboration with a large international retailer, our criteria were focused on revenue generation and situation characteristics rather than site conditions more relevant to small retailers (e.g. building size, parcel acquisition costs). Therefore, additional site criteria may be required for small scale operators seeking to use the presented methods.
Challenges and Future Directions
To the authors’ knowledge, no examples of retail location or the application of spatial interaction models at such a large scale exists in literature. The amount of data and computational overhead quickly reached software and hardware limitations and required a network of machines and an approach that iterated through census divisions and other spatial units. 7
We surveyed a sample of retail experts (in person) to obtain relative rankings that were converted to criteria weights, but it is possible that these experts did not fully understand one or more criteria, how they were represented in our analysis, or how they may interact to yield a suitability score. Therefore, the final spatial representation of suitability values may differ among expert opinions and subsequent survey work.
Our expert collaborators, and other retailers, are also interested in how changes to an existing store or market conditions will impact sales over time (O’Kelly 2008). However, the suitability analysis described in this study is static and lacks the representation of process (e.g. arrival of new competitors, closures, housing starts). In some cases, existing approaches can be modified and iterated as in a scenario analysis to ask ‘what if’ questions about contextual changes to market demand and supply. However, to explicitly incorporate processes such as competition, closure, site location decisions, urban growth or demographic change into suitability analysis and making a site location decision requires the use of a simulation-based approach.
One approach that is increasingly used to represent spatially explicit and dynamic systems is agent-based modelling (ABM). An agent is a virtual representation of a real-world actor, which in retail location analysis could be a consumer, a retail store, or a governing body (e.g. a planning board or township). The capacity for agent-based modelling to contribute to retail location analysis is only now being realized, whereby processes like retail competition, market entry and exit, and timing can be interrogated (e.g. Zhang and Robinson, 2022). Literature on the topic is rare and non-peer reviewed except for research on price changes among petrol retailers in the United Kingdom (Heppenstall, Evans, and Birkin 2005). Not only is ABM rarely used in site location analyses, but retail and commercial actors and land uses are rarely represented in a multitude of ABMs developed in the field of land-use science. Instead, research in this field remains focused predominantly on farmers and residential households leaving a wide gap for exploitation and a need for the advancement of retail-site selection.
Conclusions
We demonstrated the conceptualization, methodology, and application of a multi-scale suitability analysis for locating new home improvement retail stores across a large spatial extent (Province of Ontario) with a large number of potential sites (approximately 4.7 million parcels). The use of multiple scales aided visualization of results, related the suitability analysis to existing retail decision-making approaches (i.e. analogues), and provided clusters of high-scoring site location options to minimize issues of uncertainty of availability of individual highly suitable parcels. The combination of these efforts suggests that a decision-support system is needed to increase decision-making capacity and facilitate a multi-scale site-location analysis.
The construction and deployment of such a decision-support system (DSS) is beyond the scope of the presented research. However, from our experience, a DSS should incorporate at least the following three levels of analysis: 1) CMA, 2) CMA sub-regions, 3) parcel-level. The CMA provides a broad focus for development and links to retail upper-management who have specific goals to place a store in a specific city or area. Within the CMA, clusters of high expenditures or other factors can be used to identify sub-regions that provide real-estate teams with specific areas for planning and portfolio analysis as well as provide marketing teams with trade areas for demographic analysis (Hernández and Thrall 2007). Lastly, at the parcel level, real-estate teams can develop site-specific analyses, conduct field visits, and focus acquisition efforts. Ideally, such a DSS would be deployed online via a GeoWeb interface that facilitates the use of the DSS content in the field on smartphones and tablets as well as in the office.
The capacity for suitability analysis to enhance (retail) site selection beyond qualitative checklists and analogues is substantial. However, the process is static and limits the degree to which sales forecasting and store viability can be assessed in the medium-to-long term. Future research is needed to capture and model the processes driving top-line revenues for retailers, which includes dynamic competition and land-use change. Empirical analysis and modelling of these processes are critical to unlocking additional understanding of the drivers of sales and the explanation of their variance across space.
Footnotes
Acknowledgments
We acknowledge with gratitude the intellectual support and inputs of our Estimating Market Potential for Land Use Modelling project, especially our industry partners and Andrei Balulescu. We gratefully acknowledge support in the form of grants and internships from the Mathematics of Information Technology and Complex Systems (Mitacs IT02443) Research Council and additional support from the Department of Geography and Environmental Management, and the Office of Research at the University of Waterloo. Lastly, we would like to thank our two anonymous reviewers for their time and valuable input.
Declaration of Conflicting Interests
The author(s) declared no potential conflicts of interest with respect to the research, authorship, and/or publication of this article.
Funding
The author(s) disclosed receipt of the following financial support for the research, authorship, and/or publication of this article: This work was supported by Mitacs