
Abstract
Innovation is generally regarded as critical to long-run economic growth. Recent work, at different spatial scales, suggests economies that develop more complex technologies that are related to their existing knowledge stocks enjoy a growth premium. Thus, “smarter” forms of innovation may accelerate growth. These claims are examined using Chinese patent data distributed across 286 cities over the period 1991–2015. Fixed-effects panel models report that city-level GDP growth in China has a significant and positive relationship with diversification into more related and complex technologies, after controlling for the overall pace of innovation and other covariates. Robustness checks focusing on spatial autocorrelation and endogeneity affirm the core findings.
Keywords
Introduction
In 2019, China filed more patent applications with the World Intellectual Property Organization (WIPO) than the United States, thereby becoming the top-ranked country in terms of global knowledge production. While the meaning of statistics such as this is sure to generate significant debate around questions of patent quality and subsidies (Lei, Sun, and Wright 2012; Dang and Motohashi 2015; Jiang, Shi, and Jefferson 2020), there is little doubt that China views innovation as key to its future growth and competitive advantage, as the “Made in China 2025” and “Industry 4.0” programs make clear (Li 2018). The last few decades have seen China prioritize investment in innovation, with gross domestic spending on overall R&D now being second only to the United States (China Power Team 2019) and with venture capital funding in China topping that in the United States for the first time in 2018 (Economist 2019). It remains to be seen whether China will implement the institutional reforms that might leverage these investments to accelerate domestic innovation and self-sustaining growth. In this light, the development of an intellectual property rights regime in China, initiated by joining WIPO in 1980, was a positive step in promoting indigenous knowledge creation (Bosworth and Yang 2000; Liegsalz and Wagner 2013).
As in most other countries, the technology boom in China is not evenly distributed over space (Sun 2003; Wang and Lin 2008; Crescenzi, Rodríguez-Pose, and Storper 2012; Ning, Wang, and Li 2016). Indeed, in the period 2001-05, the top-5 most inventive Chinese cities produced approximately 47% of the nation’s patents. Since that time, the production of technology in China has become significantly less spatially concentrated. In part, this reflects processes of state restructuring and a downscaling of state power manifest in a growing number of prefecture-level science and technology parks that have become new technology hubs (Zhang and Sonobe 2011; Prodi, Nicolli, and Frattini 2017), as well as the growing role of market-based forces shaping innovation. Thus, we have seen a marked expansion in the role of firms in Chinese invention (Sun and Du 2010; Prodi, Nicolli, and Frattini 2017), of the rising importance of human capital (Su and Liu 2016), venture capital funding (Cheng et al. 2019), foreign direct investment, and related technological spillovers (Madariaga and Poncet 2007; Ning, Wang, and Li 2016). These factors are linked to differences in rates of economic growth across spatial scales in China (Su and Liu 2016).
At least since the theoretical work of Solow (1956) and Swan (1956), that long-run economic growth is largely a function of the pace of technological change is well understood (Grossman and Helpman 1991, Aghion and Howitt 1998). However, recent work within the fields of international development and evolutionary economic geography (Hidalgo et al. 2007; Frenken, Van Oort, and Verburg 2007; Hidalgo and Hausmann 2009; Balland et al. 2019) argues that the complexity of new technology and its relatedness to existing knowledge stocks also shape the growth process in fundamental ways. For Balland and Rigby (2017), extending the claims of Hidalgo and Hausmann (2009), complexity refers to the difficulty of producing specific kinds of technological knowledge. Firms and, in aggregate, regions that have the capabilities to produce complex knowledge sustain economic growth by generating competitive advantage through innovation (Kogut and Zander 1992; Maskell and Malmberg 1999). The relatedness of technology refers to the cognitive proximity between different knowledge types (Breschi, Lissoni, and Malerba 2003; Kogler, Rigby, and Tucker 2013). When two knowledge types are related, experience in working with one eases the transition to working with the other. Thus, technological relatedness is shown to condition patterns of diversification within the knowledge stocks of firms and regions and is linked to the development of new growth paths (Boschma and Iammarino 2009; Miguelez and Moreno 2018).
Evidence supporting the importance of the concepts of complexity and relatedness to the growth process is emerging at the national scale (Hausmann, Hwang, and Rodrik 2007; Ferrarini and Scaramozzino 2016; Petralia, Balland, and Morrison 2017) and somewhat more slowly for (sub-national) regional economies (Balland et al. 2019; Rigby et al. 2019; Mewes and Broekel 2020; Pintar and Scherngell 2021). While research on Chinese cities and regions has examined the influence of relatedness on processes of industrial and product diversification (Guo and He 2017; Zhu, He, and Zhou 2017; Poncet and De Waldemar 2013), the importance of complexity and relatedness to sub-national economic growth in China remains understudied, particularly in terms of knowledge production. Thus, the primary concern of this paper is whether the rate of economic growth in Chinese cities is significantly related to the development of more complex technologies and to technologies that are more closely related to the city’s existing knowledge stocks, after controlling for the pace of overall technological change. Fixed-effects panel regressions indicate that cities building capabilities in more complex technologies and in technology classes related to existing patterns of urban specialization have higher GDP growth rates. These results open new dimensions for urban growth policy in China and elsewhere.
The rest of this paper is separated into four main parts. The Literature Review discusses key arguments on technological change and regional economic growth. It then highlights new work on technological relatedness and complexity that is linked to regional economic performance. In the Data and Methods section, the Chinese patent data that underpins the empirical work are described and descriptive statistics presented. The following section details the core results of the empirical analysis. A final section offers a brief conclusion.
Literature Review
Technological Relatedness, Complexity, and Regional Economic Growth
Links between technological progress and economic growth reach at least as far back as Adam Smith (1776). More than a century later, Marshall (1890) sketched the outlines of a model of regional growth resting upon the localized production and diffusion of technology. However, it was not until the growth models of Solow (1956) and Swan (1956) that technological change was formally positioned at the core of the growth process. While for them new technology emerged exogenously, and notwithstanding the important efforts of Arrow (1962) on learning by doing, it was another three decades before the development of endogenous growth models resting on knowledge spillovers (Romer 1986) or human capital externalities (Lucas 1988) successfully integrated the creation of ideas with the neoclassic framework. Of course, outside economic orthodoxy, the production of knowledge and its application in new technologies have long been seen as key to spatial and temporal variations in economic performance (Schumpeter 1942; Schmookler 1966; Rosenberg 1974; Nelson and Winter 1982; Malecki 1991). By this time, there is broad theoretical agreement on the importance of new technology to growth (Grossman and Helpman 1991; Aghion and Howitt 1998; Mulder, De Groot, and Hofkes 2001) and ample empirical support (see Fagerberg 1994; Jones 2016). At the international level, the institutional foundations that undergird the technology‐growth nexus are explored by Rodrik, Subramanian, and Trebbi (2004) and Acemoglu and Robinson (2012).
Differences in technology are linked to variations in urban and regional growth (Malecki 1991; Glaeser et al. 1992; Rigby and Essletzbichler 1997; Acs and Varga 2002). A larger body of research frames knowledge production as a key source of regional competitive advantage. Thus, models of learning regions (Lundvall and Johnson 1994), of regional innovation systems (Asheim and Gertler 2005), and of localized technological spillovers (Jaffe, Trajtenberg, and Henderson 1993; Bottazzi and Peri 2003) and non-local flows (Bathelt, Malmberg, and Maskell 2004) all shape the pace and direction of local and regional innovation. In turn, the geographical evolution of knowledge plays a fundamental role in spatial uneven development and the production of regional economies (Storper 1997; Essletzbichler and Rigby 2007).
It is important to note that knowledge and the technologies that it generates vary across a series of dimensions including, but not limited to, those of complexity and codifiability (Simon 1962; Polanyi 1966; Machlup 1980). The character of knowledge has important implications for the way in which it may be combined (Kauffman 1993; Fleming and Sorenson 2001), to how firms organize its production and safeguarding (Kogut and Zander 1992; Galunic and Rodan 1998), and its potential to support firm and regional performance (Grant 1996; Maskell and Malmberg 1999). While considerable attention within evolutionary economic geography has focused on the tacit-codified dimension of knowledge and its role in generating competitive advantage (Gertler 2003; Maskell and Malmberg 1999), until recently, much less attention has been paid to knowledge complexity.
The recent growth of interest in the concepts of economic relatedness and complexity can be tied to the work of Hidalgo et al. (2007) on the product space and that of Hidalgo and Hausmann (2009) on the foundations of complexity. This work has a long history focused on how structural change within economies impacts the nature of goods produced and how this, in turn, is linked to patterns of economic growth and development (Singer 1950; Hirschman 1958). Lall, Weiss, and Zhang (2006) and Kemeny (2011) update analysis of these questions, while Hausmann, Hwang, and Rodrik (2007) show that what countries actually produce (and export) matters for future growth. In a series of papers, Hidalgo and Hausmann (2009) formalize these ideas showing that a bipartite matrix of countries and their exports yields measures of the relatedness between products (and thus a guide to the ease of diversification), and the complexity of products and of the countries in which they are produced. For them, the economic complexity of nations reflects the diversity and the relative scarcity of the capabilities that they possess. Most importantly, Hidalgo and Hausmann (2009) show that their measure of complexity is a useful predictor of economic growth.
At the sub-national level, there has been growing interest in the relatedness and complexity of different kinds of economic activity. Using export data, Boschma et al. (2011) report that regions are much more likely to diversify into products and sectors that are related to their existing export baskets. The logic here is that diversification is less costly when existing capabilities can be leveraged in new ways. Neffke and Henning (2013) report similar findings in their analysis of firm diversification in Sweden using employment data. Guo and He (2017) also use employment data to show the importance of sectoral relatedness in shaping industrial diversification across Chinese regions. Boschma et al. (2015) and Rigby (2015) use patents to measure the relatedness between technologies and link this measure to technological diversification within US cities.
Until recently, there has been much less work on complexity at the sub-national level. In an early paper, Poncet and De Waldemar (2013) explore patterns of export upgrading using measures of product and place complexity in a panel of Chinese cities. Following Hidalgo and Hausmann (2009), they report that deviations from correlations between city complexity and income are strong predictors of growth. In more recent research, Balland and Rigby (2017) show that the complexity of technology, as recovered from patent data, varies significantly over US metropolitan areas. Balland et al. (2020) report that complex economic activities concentrate in larger cities and that such concentration has increased over time. Analysis within the EU also finds that complex knowledge is unevenly distributed over space and that regions with higher levels of technological complexity enjoy faster GDP growth (Mewes and Broekel 2020; Pintar and Scherngell 2021).
Interest in the complexity and relatedness of technology at the sub-national level is linked through Balland et al. (2019) to the smart specialization program adopted by the European Union to combat regional uneven development (see Foray, David, and Hall 2011; McCann and Ortega-Argiles 2015). Smart specialization is a “bottom-up” policy program that seeks to identify the knowledge and industrial foundations of regional economies and to leverage those foundations in generating new growth possibilities (new specializations resulting from diversification). Balland et al. (2019) offer a framework for operationalizing smart specialization policy by combining the dimensions of relatedness and complexity, building on the earlier work of Hausmann et al. (2014). The key claims are outlined in Figure 1. It is clear from the relatedness literature that diversification has a greater chance of being successful (less risky) if regions diversify into activities that are related to their existing capabilities, technological or otherwise. All else considered, regions would prefer to diversify into activities characterized by higher levels of complexity, for these are likely to produce higher rents and sustain competitive advantage (Maskell and Malmberg 1999). Combining the relatedness and complexity dimensions of diversification, moves into the top-right quadrant of Figure 1 are to be preferred, while moves into the lower left quadrant should be avoided. Strategies associated with quadrants 2 and 4 of Figure 1 might make sense under more restrictive conditions. Relatedness and complexity space. Source: Based on Balland et al. (2019).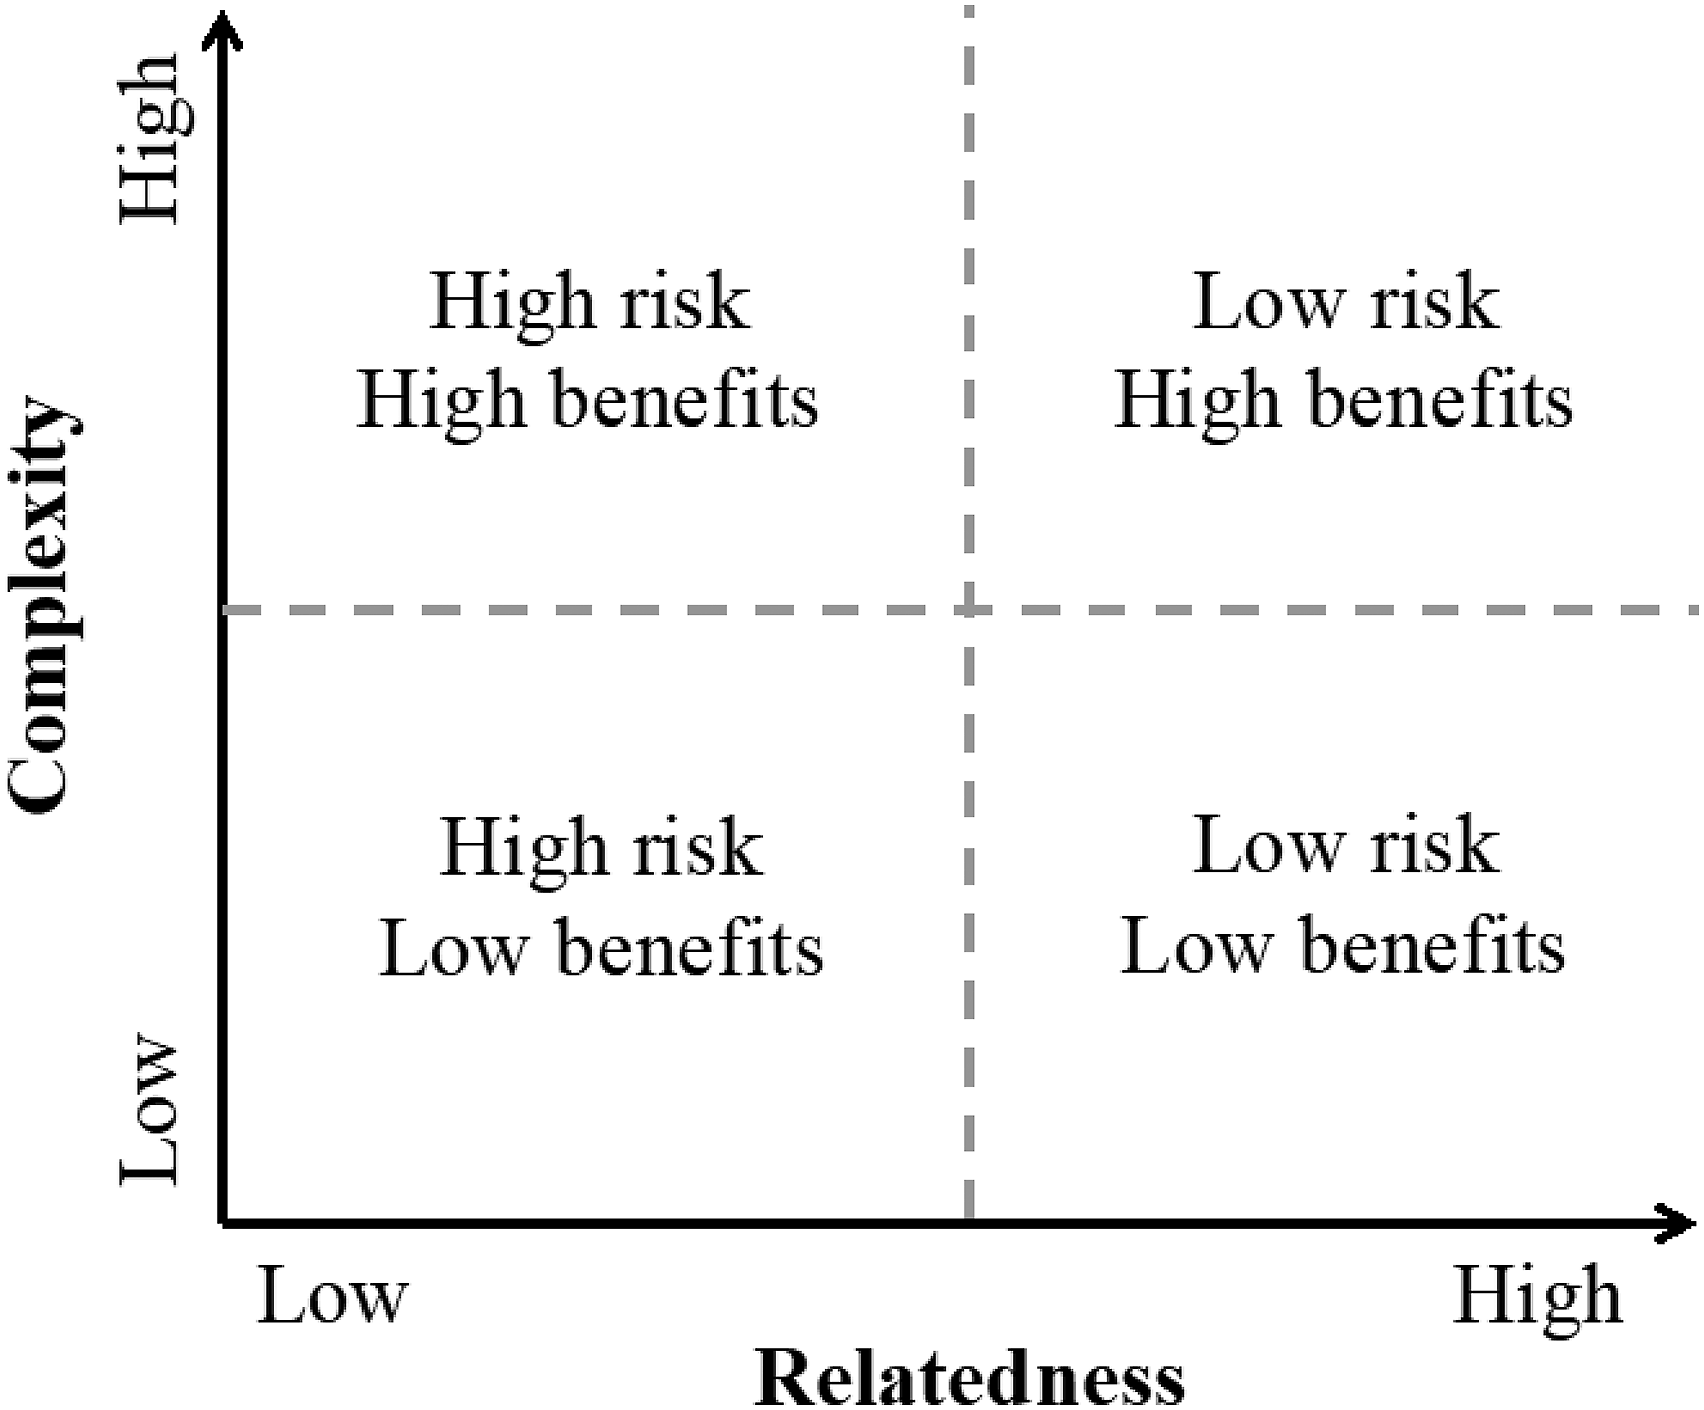
Rigby et al. (2019) operationalize this framework using historical patent data and report EU regions that diversified their technological capabilities into patent classes that were more complex and more closely related to their existing knowledge bases enjoyed higher rates of growth. It is this finding that motivates the core research question in this paper: after controlling for the overall pace of technological change, do Chinese cities that diversify into more related and more complex technologies experience faster economic growth?
Smarter Specialization in the Chinese Context
So far, the debate on smart specialization has been mainly conducted in the EU for obvious policy reasons. However, this same framework may be used to evaluate the importance of historical patterns of diversification in different national settings. Extending the analysis of smarter forms of specialization to China, a fast growth, emerging economy, characterized by unprecedented rates of innovation over the last three decades (Fan 2014; Zhou, Lazonick, and Sun 2016; Appelbaum et al. 2018), would provide useful information on at least three issues. First, there is existing evidence that smarter forms of specialization have played a role in technological upgrading and city growth through the attraction of foreign direct investment (FDI). FDI inflows to China have long been seen as a source of complex knowledge. However, studies have shown that the positive effects of FDI on regional innovation in China depend on a region’s industrial structure (Ning, Wang, & Li 2016; Wang et al. 2016; Tang et al. 2020) and industrial development level (Ouyang & Fu 2012). Evidence on the spatial spillover of FDI is mixed (Madariaga and Poncet 2007; Ning, Wang, and Li 2016). This suggests that not all Chinese cities can benefit from the complex knowledge embodied in FDI. Following the arguments of Cohen and Levinthal (1990), only those cities with sufficient absorptive capacity have been able to extend their existing capabilities with FDI and leverage new growth possibilities.
Second, smarter specialization offers possibilities for cities and regions with lower levels of overall innovation to raise their technology profile and stimulate growth. Existing studies have shown that China’s rapid technological development has been mainly characterized by an uneven distribution of innovation (Crescenzi, Rodríguez-Pose, & Storper 2012; Fan 2014). In fact, unlike regional innovation hubs such as Beijing, Shanghai, and Shenzhen, most Chinese cities only have comparative advantages in a limited number of technologies (Tang et al. 2020). Smarter specialization offers these cities effective policy tools to identify their technological strengths and to build on those more efficiently. Indeed, in early work on Chinese economic complexity, Gao and Zhou (2018) report that economic complexity in provinces is positively correlated with GDP per capita and negatively correlated with income inequality. Zhou, Zhu, and He (2019) use detailed firm-product export data available at the city-level to examine how firm and regional resources influence the upgrading of firm capabilities. Lee and Lin (2020) explore complexity measures for cities around the Pearl River Delta.
Third, smarter specialization is also of significance for effective place-based innovation policy, reflecting the heterogeneity of innovation in China and elsewhere (Lin et al. 2011; Prodi, Nicolli, and Frattini 2017). As the world’s largest emerging economy, China has strong incentives to innovate and the Chinese government at different levels has issued a variety of policies to promote innovation-driven development. Various kinds of subsidies and tax reductions have generally played an important role in China’s technological development (Li 2012; Zhang & Guan 2018). Dong et al. (2019) link local government use of land subsidies to the diversification of Chinese cities into more complex industries. However, policies that favor inappropriate technologies may result in the misallocation of resources. Cities that adopt smarter specialization strategies might be able to make the best use of resources, thus bolstering their economic growth. Clearly, much more work is required to understand how technological and other forms of relatedness and complexity are changing across China’s economic landscape and the impact of such changes on growth and development.
Data and Methods
The production of knowledge and the application of those ideas to the economy is a well-known driver of economic growth. In addition to the overall volume of knowledge production, do regions perform better if they develop new technology that is more complex and that is more closely related to their existing knowledge stocks? In other words, building on the discussion above, is there evidence that Chinese cities that diversified their technological cores in “smart ways”, following the logic of Balland et al. (2019), out-performed cities that did not? In this section of the paper, we briefly review sources of data before presenting some background statistics as prelude to the analysis that follows.
Information on the domestic production of knowledge across Chinese cities is gathered from “invention” patent data made available by the China National Intellectual Property Administration (CNIPA). The application date on the patents is used to track inventions over time. Four-digit International Patent Classification (IPC) codes indicate the nature of technology introduced on each patent. Those patents are located geographically, based on the addresses of patent assignees, typically the organizations that own the intellectual property listed on the patent. For single-plant firms, use of the assignee address to identify the site of knowledge production is probably accurate. However, in the case of multi-plant firms, there is a question as to whether invention that may occur in different parts of the firm is all recorded as taking place at a single headquarter’s location. To check this issue, the authors examine assignee locations reported on the patents of multi-plant firms. These firms are identified with Orbis business data. Overall, we find that multi-plant firms operating in China do not register all their patents at a single location. For some multi-plant firms, most patents are registered in one location, but in many others, patents are widely distributed (and registered) across the cities where the firm’s plants are located. In addition, patents with multiple assignees are fractionally split between the cities where those assignees are located. At this time, patents are widely used to trace the patterns of knowledge production because of their widespread availability and the rich information they contain. However, Pavitt (1985) and Griliches (1990) list some of the shortcomings of patent data.
We generate patent counts and other characteristics of inventions for 286 Chinese cities, at the prefecture level and above, covering the years 1991–2015. Our analysis begins in the early 1990s reflecting the limited availability of Chinese patent records before this time. The period of analysis ends in 2015 because of right truncation in patent data generated by the time lag between application and grant dates. We bin the patent records into 5-year windows that run 1991-95, 1996-00, …, 2011-15 in order to smooth annual fluctuations in data, especially for smaller cities. For each city, data on GDP, on population levels, educational characteristics, and FDI flows are obtained from the China City Statistical Yearbooks. These data are available for entire cities as well as the urban core. The data reported here cover the entire city. The population and education data cover city residents with hukou and thus differ from some of the data available in the China Population Census (Alder, Shao, and Zilibotti 2016).
Aggregate “Invention” patent counts in China.
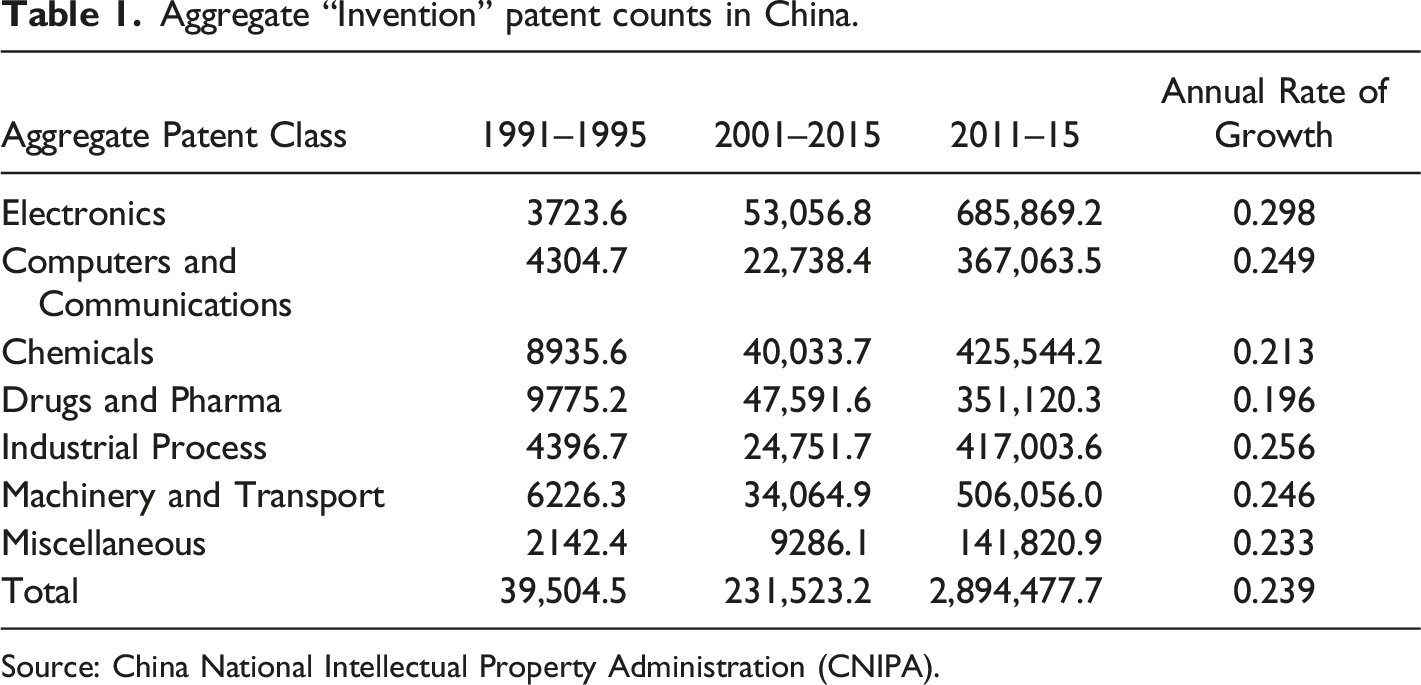
Source: China National Intellectual Property Administration (CNIPA).
Top 10 sites of invention in China by patents.
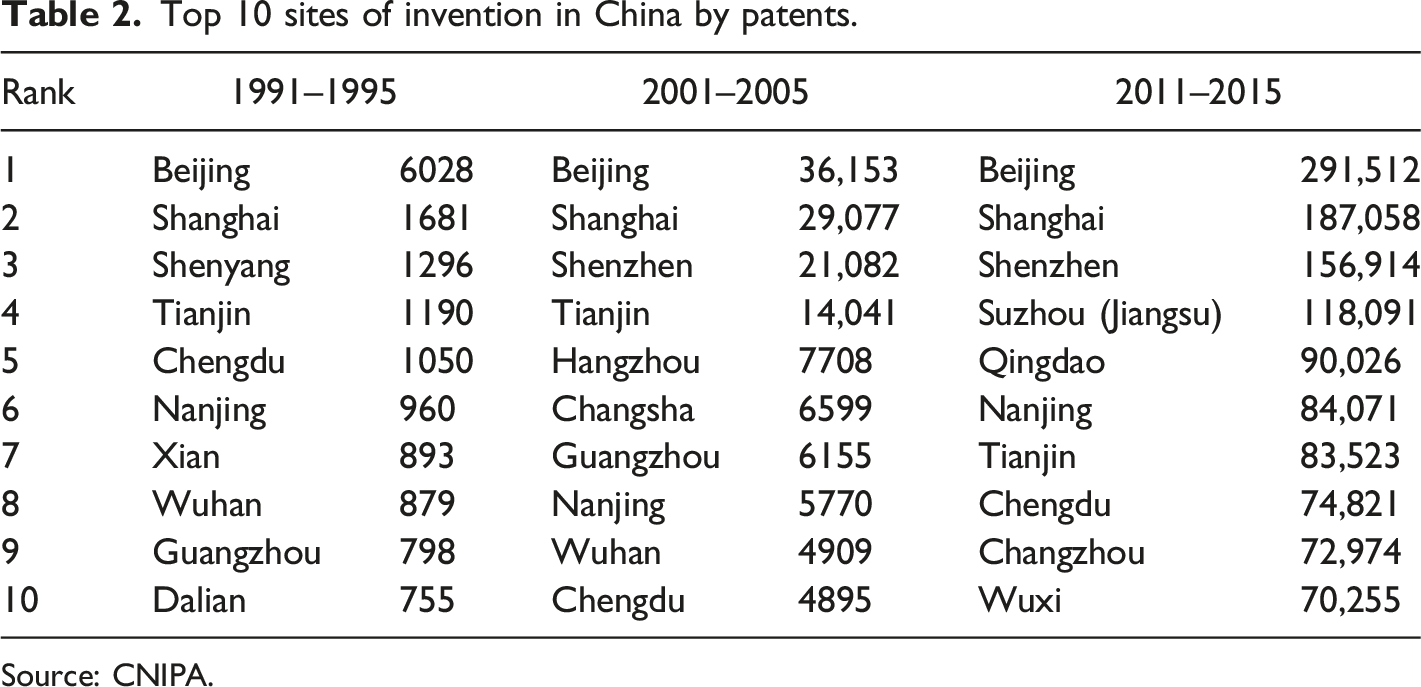
Source: CNIPA.
Overall, a north-to-south shift in the geography of Chinese domestic invention is apparent from patent data. During the period examined, more cities in the south (e.g., Shenzhen, Suzhou, Changzhou, and Wuxi) have emerged as key centers of knowledge growth. Though detailed explanation for this change is beyond the scope of the current paper, the rapid growth of high-technology firms across many cities in southern China is undoubtedly a contributing factor.
To answer the question of whether cities that adjusted their mix of technologies in a fashion consistent with a smart specialization strategy enjoyed above average economic growth requires operationalization of the framework developed by Balland et al. (2019). This demands identification of the relatedness distance between patent classes and measures of complexity for patent classes and the cities where patents are generated. These efforts utilize the Chinese patent data.
Measuring Technological Relatedness and Relatedness Density
To measure technological relatedness between IPC classes for a given time period, we count the number of Chinese patents that contain a co-class pair, say i and j, and then standardize this count by the number of patents in total that record knowledge claims in IPC classes i and j. Relatedness
The relatedness between technologies can be visualized as a network in knowledge space. Figure 2 maps the relatedness between IPC technology classes in China for the periods 1991-95 and 2011-15, illustrating the changing structure of Chinese knowledge production. The nodes in Figure 2 represent the different technology fields of the IPC. The node colors correspond to the seven aggregate technology groupings recognized by Schmoch (2008), and their size indicates the number of patents generated in each class. Classes or nodes with high relatedness values are located close to one another. Hence, we see individual technologies of different aggregate types (colors) clustering together in the knowledge space, capturing the cognitive proximity between those classes. The electronics cluster (red nodes) is clear for the period 2011-15. The link between the chemicals classes (black) and the drugs and pharma (yellow) technologies is also apparent. The nodes are scaled within each time period. In 1991-95, the largest node (A61K = preparations for medical, dental, or toilet purposes) registered 5289 patents. In 2011-15, the largest node (G06F = electric digital data processing) contains 133,275 patents. Chinese knowledge space, 1991-95 and 2011-15. Notes: Red = Electronics (1), Green = Computers and Communications (2), Chemicals = Black (3), Yellow = Drugs and Pharma (4), Blue = Industrial Process (5), Purple = Machinery and Transport (6), and Grey = Miscellaneous (7).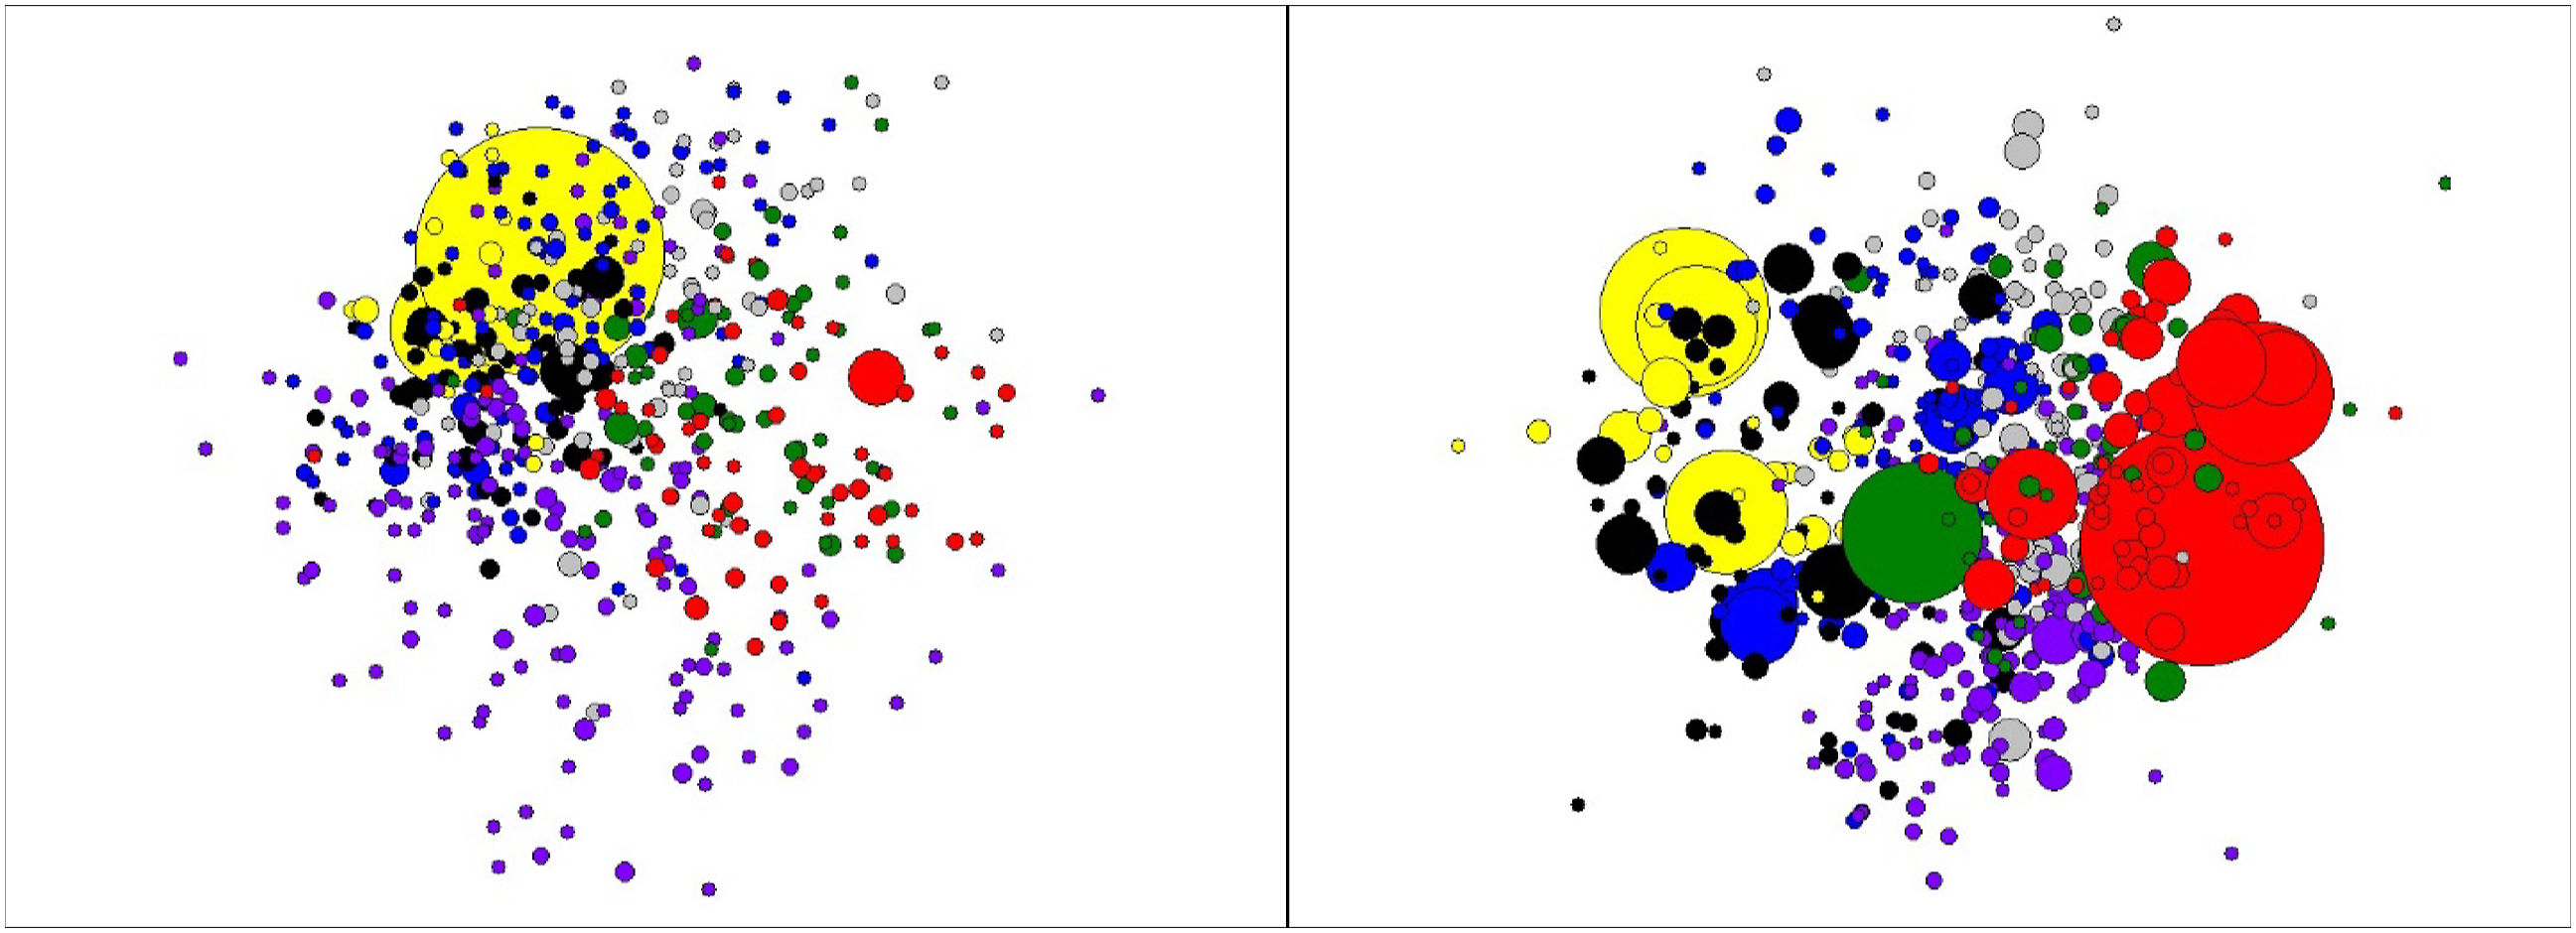
While Figure 2 illustrates the relatedness between technology classes in China, it is also possible to measure the degree to which patents cluster in knowledge space around a particular technology field. This measure of clustering is referred to as the relatedness density of a technology and indicates the potential of a region to develop new technologies based on existing capabilities (Hidalgo et al. 2007). The relatedness density of technology class i in city r time t is found as the technological relatedness 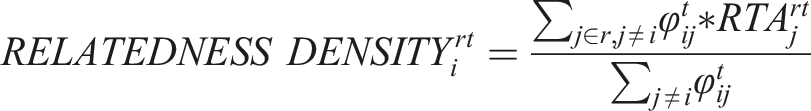
and where RTA is a binary variable that assumes the value 1 (0) when a city possesses a larger (smaller) share of patents in a particular technology than the reference region (the sum of all cities in China) for a given period. More formally, city r has RTA in technology i at time t such that 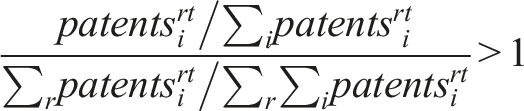
In the analysis that follows, revealed technological advantage, technological relatedness between patent classes, and the relatedness density of all technology fields are constructed for each of the 286 cities in all the time periods examined.
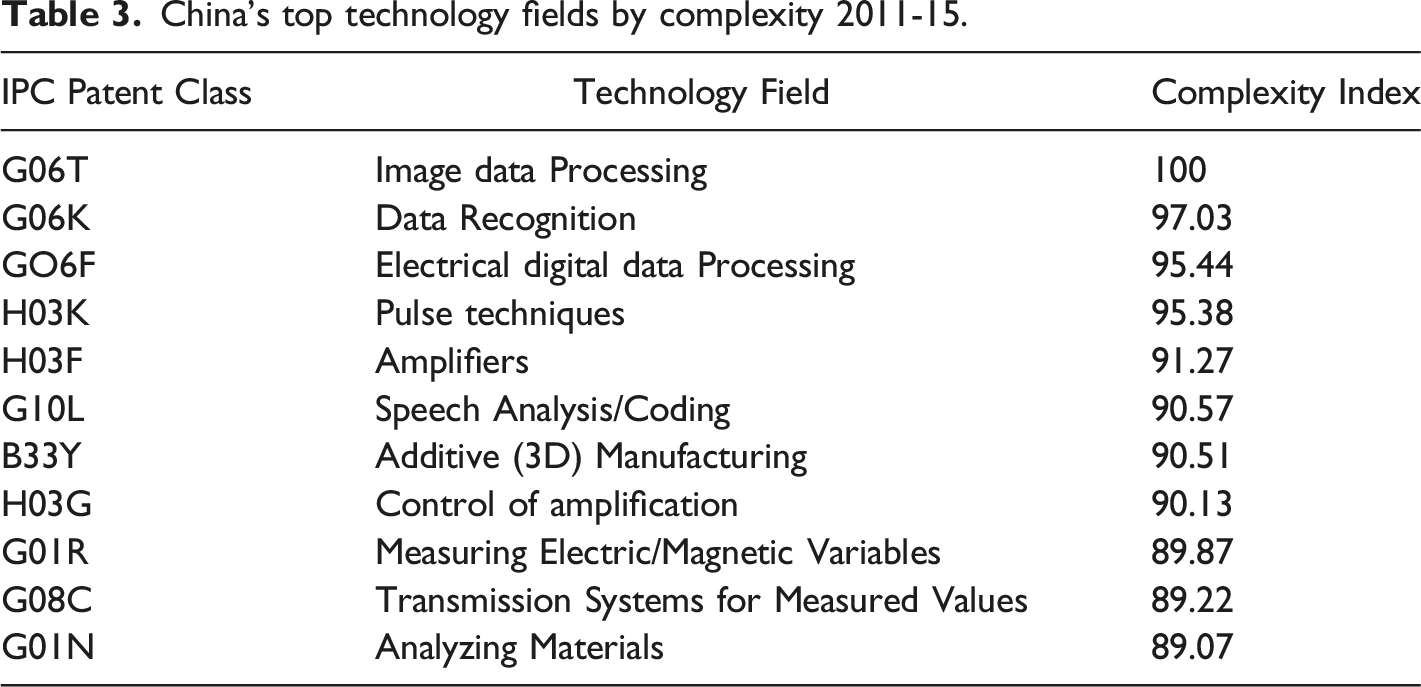
Measuring Knowledge Complexity
Attempts to measure the complexity of knowledge, as represented by distinct technologies, rest on the difficulties of combining different knowledge subsets. Fleming and Sorenson (2001) and Broekel (2019) use direct measures of the difficulty of technological recombination in their estimates of knowledge complexity. Hidalgo and Hausmann (2009) build a model of economic complexity at the level of individual products and countries. Their methodology is indirect, claiming that complex goods are produced in relatively few locations that possess the diverse sets of capabilities that complex forms of production entail. In contrast, goods that are widely produced across countries that possess few capabilities are of low complexity. Using a bipartite matrix of goods production (exports) across a large set of countries, Hidalgo and Hausmann (2009) develop an iterative technology that identifies both the complexity of individual goods and of the countries where they are produced. Tacchella et al. (2012) offer a similar methodology resting on different assumptions. A great deal of new theoretical work explores these latter representations of complexity (Mealy, Farmer, and Teytelboym 2019; Morrison et al. 2017; Sciarra et al. 2020) and applications linking complexity to economic growth in different national and regional settings are rapidly emerging (Davies and Maré 2021; Hane-Weijman, Eriksson, and Rigby 2021; Mewes and Broekel 2020).
China’s top technology fields by complexity 2011-15.
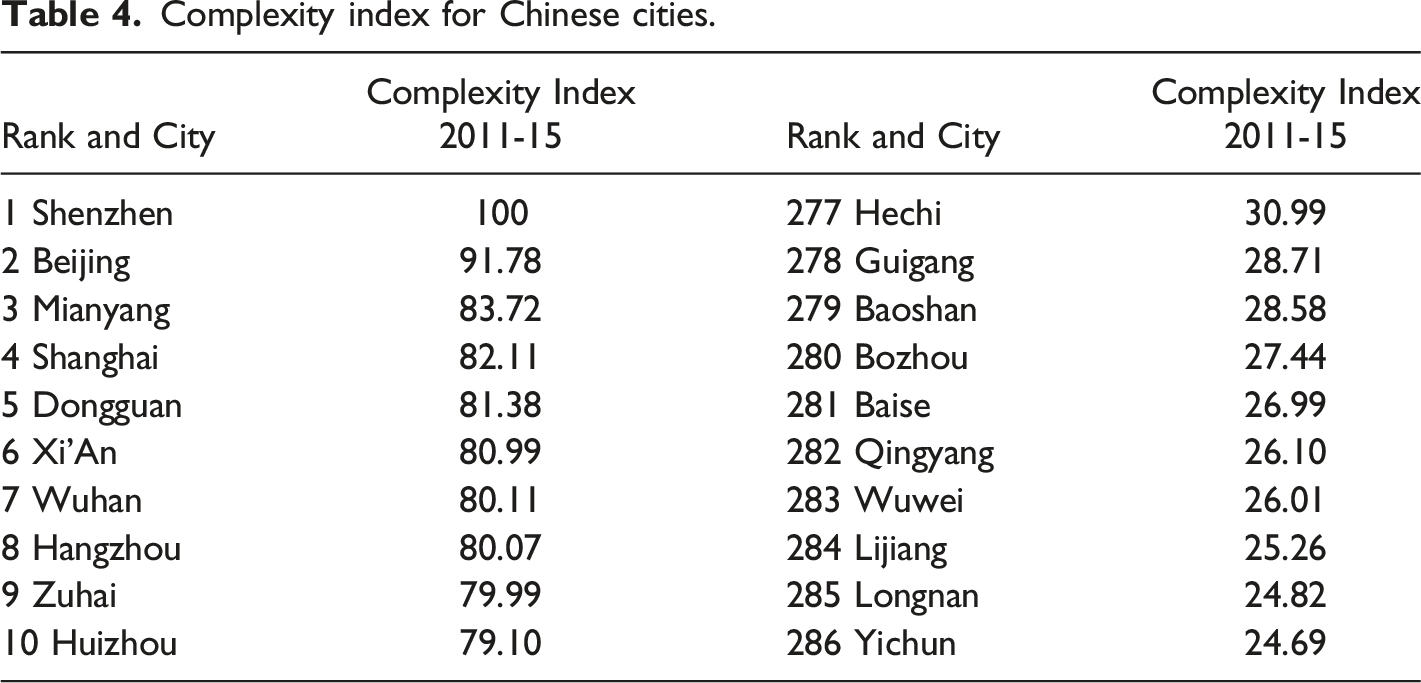
Complexity index for Chinese cities.
Smarter Specialization in Chinese Cities, 1991–2015
Using the methods and data above, it is possible to identify all technology fields in which Chinese cities have developed RTA. To these measures we add the knowledge complexity of each technology and the relatedness density of those technologies within each city across the 5-year time-periods examined. Using these variables, individual cities can be mapped in the smart specialization framework of Figure 1 to highlight the relatedness density and complexity of the technology fields in which they gain and lose RTA between time periods (Balland et al. 2019).
The coordinates of this mapping are developed in the following way. In the case of technological entry, all technology classes in which the RTA of a city takes the value 0 in period t are identified. These classes are candidates for technological entry (gaining RTA). The relatedness density and complexity scores of these potential entry classes are recorded. Next, the actual technological fields in which a city gains RTA between period t and period t+1 are noted along with the relatedness density and complexity values of these fields. The mean relatedness density and complexity scores of the potential entry classes are then subtracted from the relatedness and complexity scores of the technology classes in which a city actually develops new RTA. The result indicates whether a city builds RTA in technology classes that have relatedness density and complexity scores above or below the average of those classes in which it has not yet developed competitive advantage. These measures of relative relatedness and complexity are required to overcome biases in absolute measures (see Pinheiro et al. 2018).
Summing these deviations across time-periods generates an overall index of entry complexity and relatedness density values for each city. We develop the same index for technological exit. Exit occurs when a city has RTA in time period t, but loses it by period t+1. Again, we identify the technology classes in which cities lose RTA and calculate the sum of the complexity and relatedness density measures for those cities across technology classes and time periods, relative to the set of all technology classes in which RTA may be lost. Calculating the difference between the potential and realized relatedness density and complexity values for entry and exit controls for differences in knowledge cores between Chinese cities and yields measures that report how well cities exploit the potential to upgrade to technologies characterized by high relatedness density and high complexity, while also abandoning those technologies with low relatedness density scores and low complexity.
Figure 3 reveals the results of this exercise for the Chinese cities examined, with the data on entry shown in the top panel and that for exit in the bottom panel. The relatedness density and complexity deviations in this figure are normalized. (Note that the locations of some cities are fuzzed to aid legibility. Appendix 2 reproduces the sections of these figures for which city names remain difficult to read.) It is advantageous to enter technology classes in the top-right quadrant, where relatedness density to the knowledge core of the city is high and where the average complexity value of the technology classes that are entered is also high. Entering technology classes in the bottom-left quadrant, where density and complexity values are low compared to those available, is unlikely to improve city performance. In terms of technological exit (bottom panel of Figure 3), cities located in the lower left quadrant, where complexity and relatedness density values are lower than the average of all technology classes in which RTA is established, should experience the largest gains in performance as they are shedding the least attractive technologies. Smart specialization in Chinese cities by entry and exit 1991–2015.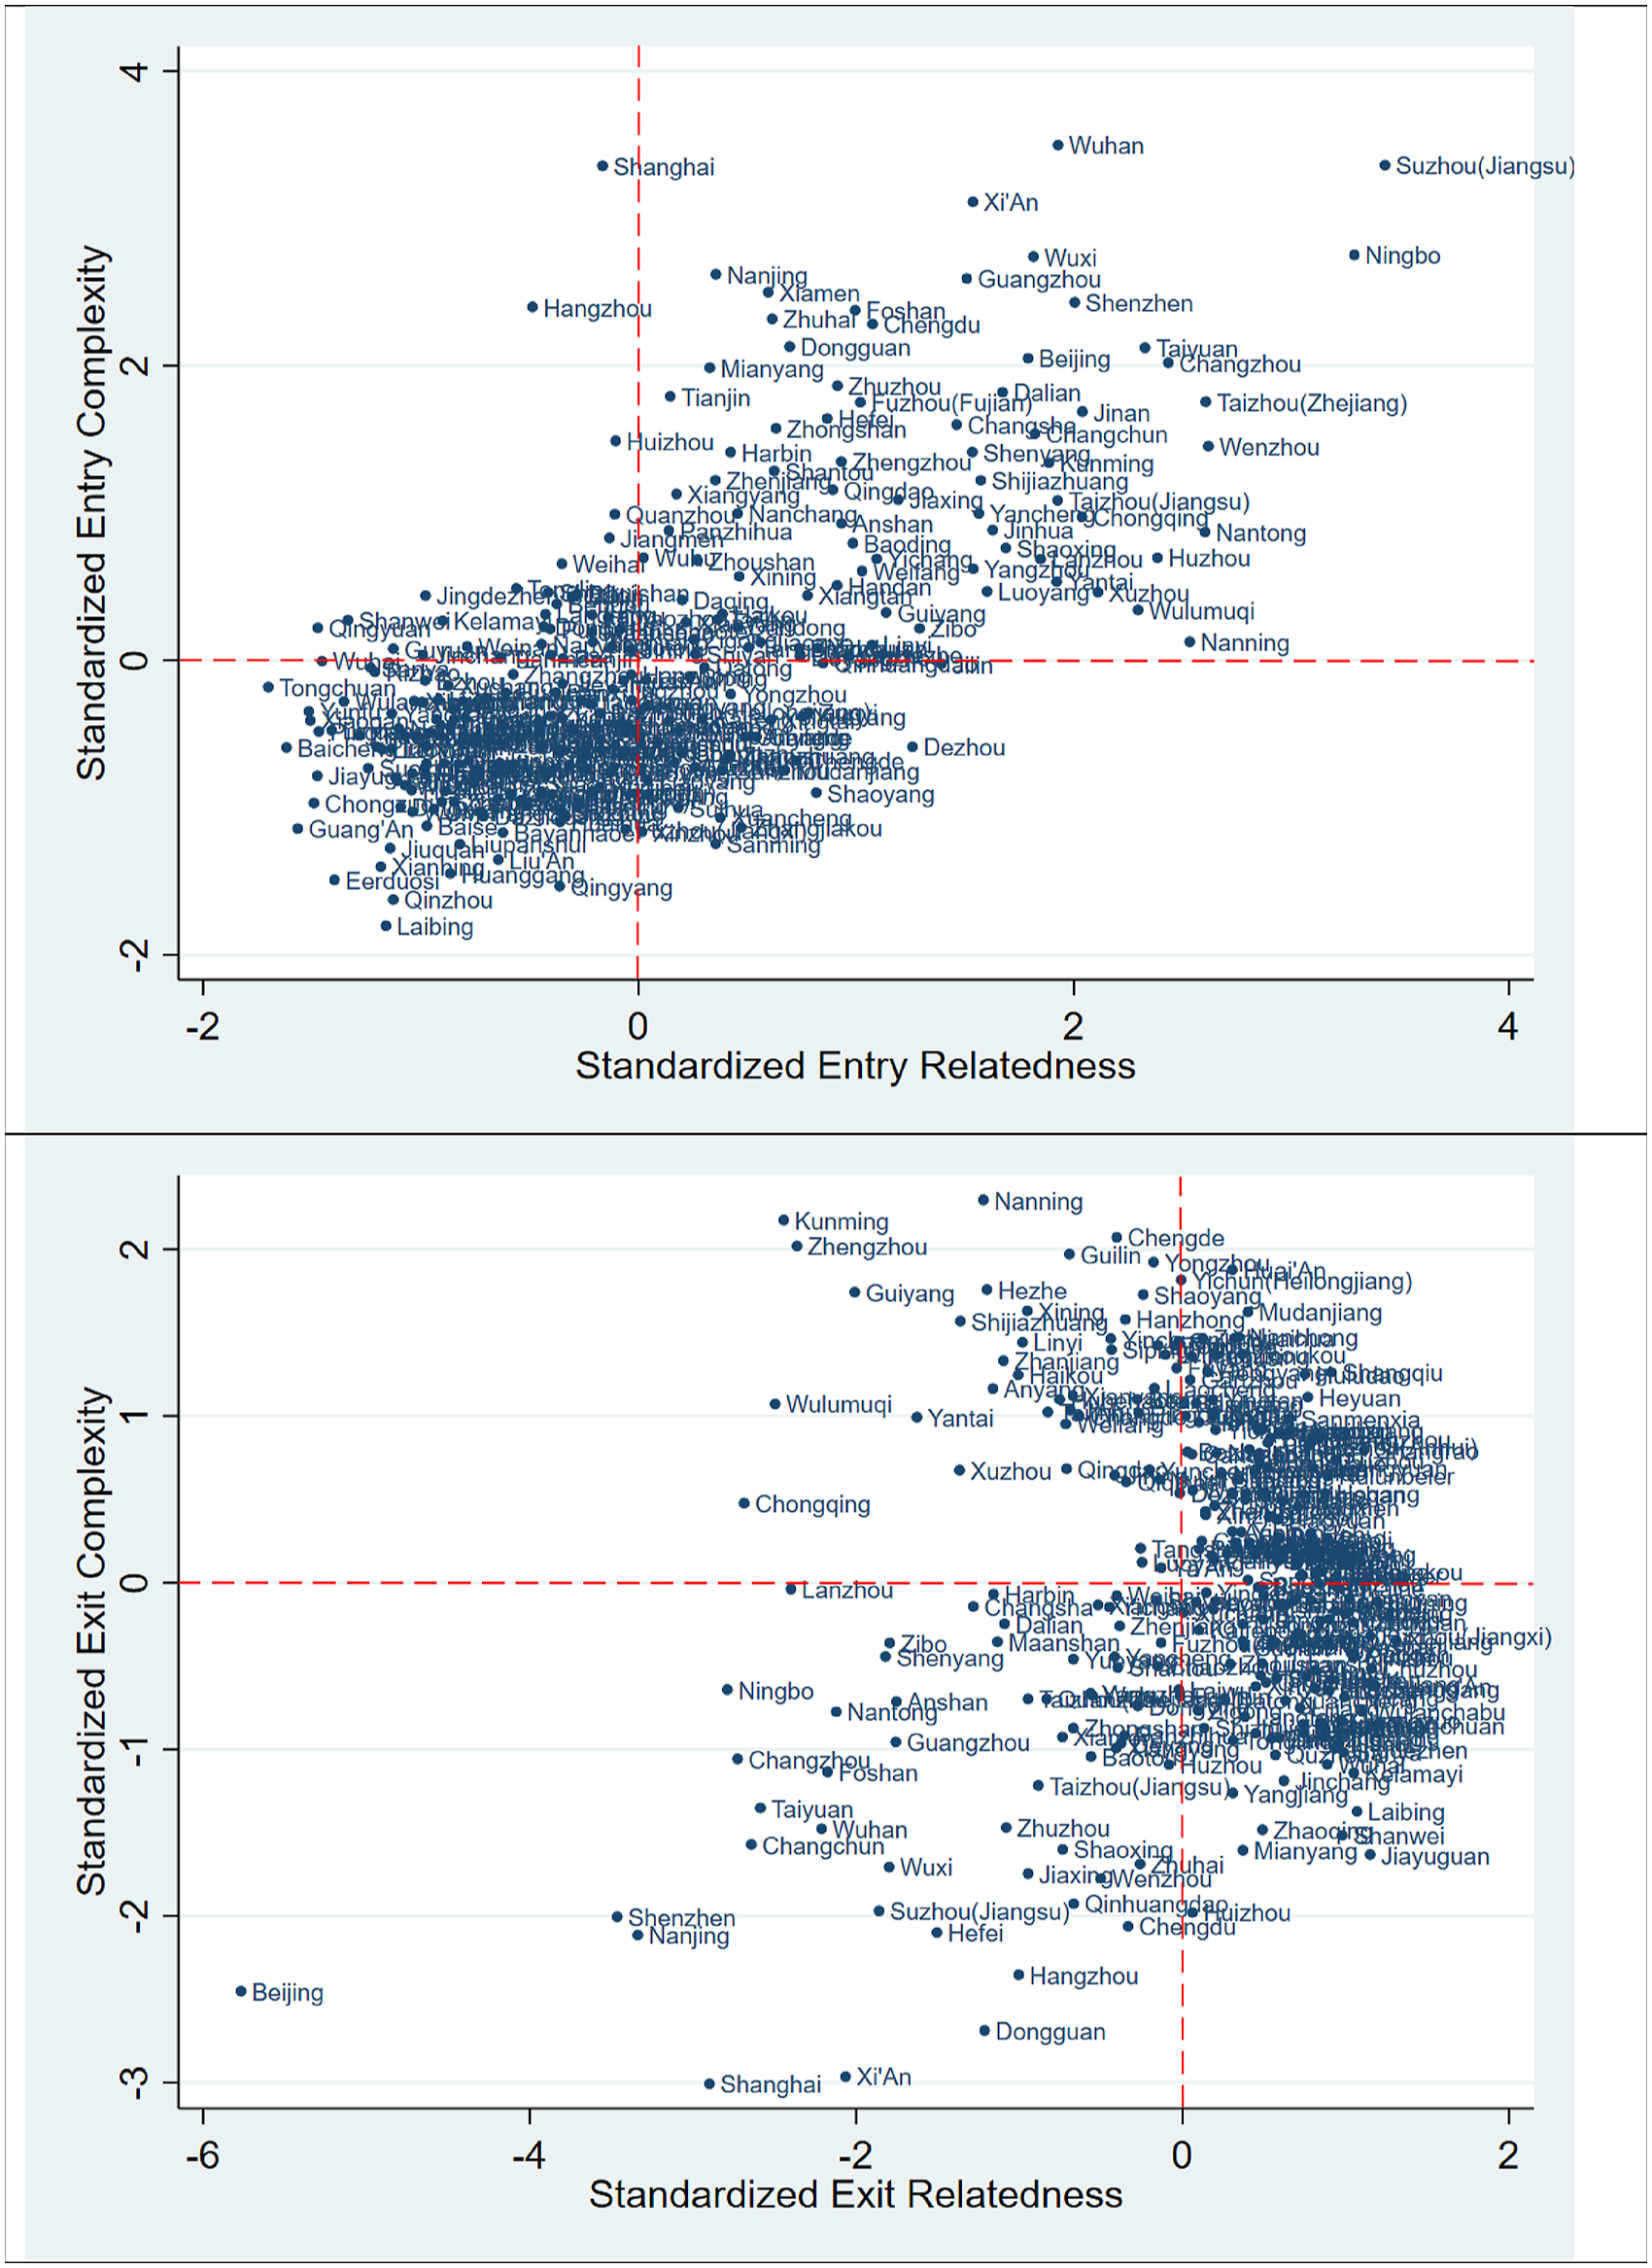
Subtracting the exit scores from the entry scores for relatedness and for complexity yields overall measures of whether cities have built specialization in patent classes that are related to their existing technological base and which are more or less complex than average. Cities that are in the top-right quadrant for entry and the lower-left quadrant for exit will have the highest smart specialization scores. Further, summing the normalized scores for relatedness and complexity generates an overall index of smart specialization. The cities that have performed best in terms of smart specialization are Beijing, Suzhou (Jiangsu), Shenzhen, Xi’an, Ningbo, Wuhan, Shanghai, Nanjing, Taiyuan, and Changzhou. In terms of entry, Figure 3 shows that Shanghai and Hangzhou, more than most top-technology cities, have chased complexity rather than relatedness in their development of new RTA.
Does Smart Specialization Improve Economic Performance?
To examine whether technological relatedness and complexity are related to economic growth, we turn to regression analysis. Because the objective is to show how changes in relatedness and complexity, driven by technological entry and exit, impact economic growth within cities rather than across them, a fixed-effects panel model is employed. A series of city-level covariates are included in the regression model to control other influences on the growth process. Any unobserved heterogeneity across the city units will be swept up in the fixed-effects model so long as that heterogeneity is constant over time.
The dependent variable is the real GDP growth rate within each city measured across the end-years of each 5-year panel. A one-period lag of GDP levels is added to the model to explore whether there is evidence of convergence or divergence in city growth trajectories, following standard practice in econometric models of growth (see Barro 1991). The key variables in the analysis measure the relatedness and complexity of technologies that enter and exit city knowledge stocks. The relatedness and complexity variables map changes between the 5-year panels and as change variables they should be well-suited to accounting for variations in rates of growth. Raw relatedness scores for exit are subtracted from those for entry to yield an aggregate relatedness variable in the regression model. A quick glance at Figure 3 should make clear that cities scoring high in terms of entry relatedness have large positive values for relatedness and those cities that score high in terms of exit have large negative values for relatedness. Thus, a large positive minus a large negative generates the highest scores for cities in terms of relatedness. The same structure is used to generate an aggregate score for changes in a city’s complexity. In the regression model, the aggregate scores for relatedness and complexity are each normalized and added together into a composite smart specialization index. The normalization is performed to ensure that the two variables have a roughly even weight in that index.
Descriptive Statistics for the Period 2006-10 (across all cities).
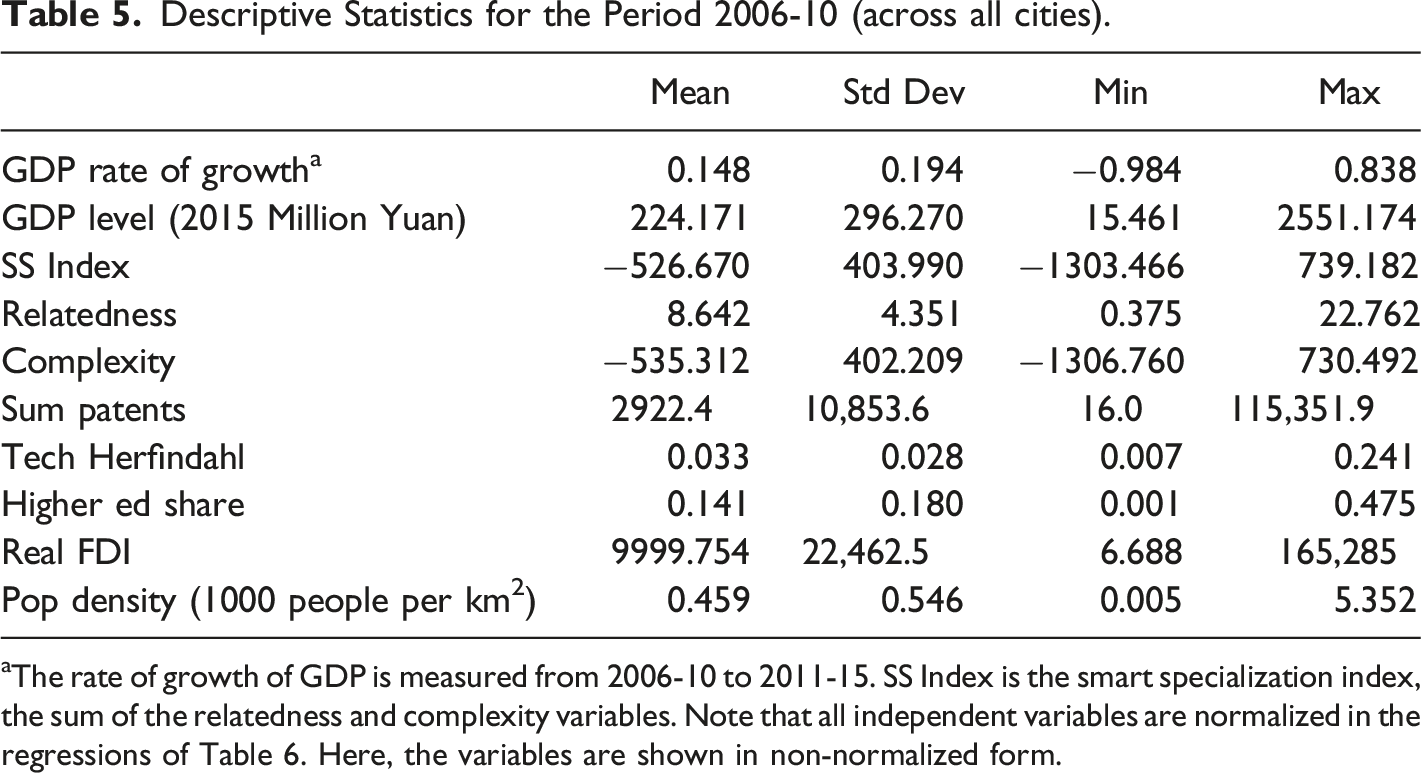
aThe rate of growth of GDP is measured from 2006-10 to 2011-15. SS Index is the smart specialization index, the sum of the relatedness and complexity variables. Note that all independent variables are normalized in the regressions of Table 6. Here, the variables are shown in non-normalized form.
Fixed Effects Panel Model of GDP Growth and Smart Specialization.
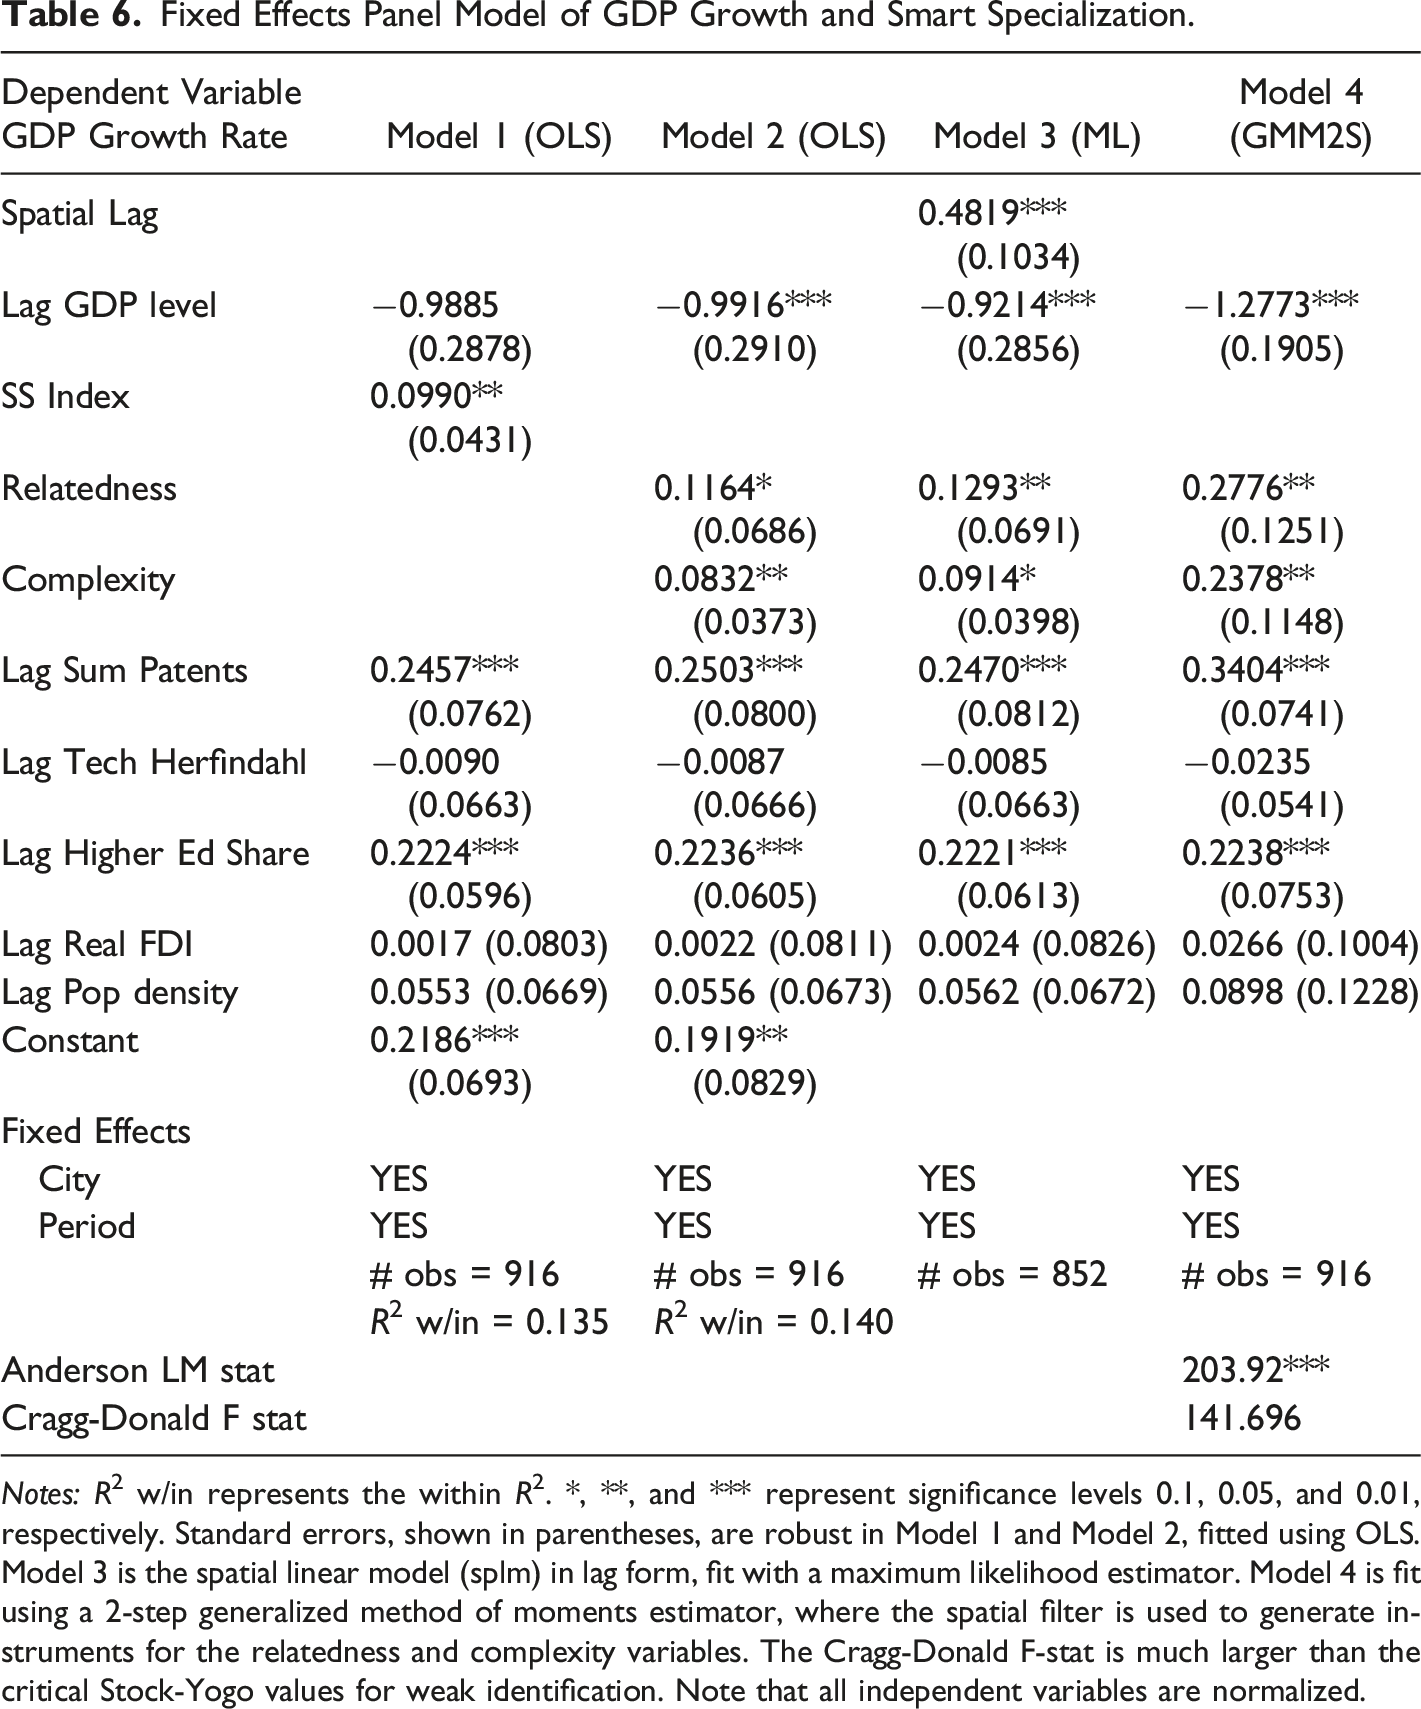
Notes: R2 w/in represents the within R2. *, **, and *** represent significance levels 0.1, 0.05, and 0.01, respectively. Standard errors, shown in parentheses, are robust in Model 1 and Model 2, fitted using OLS. Model 3 is the spatial linear model (splm) in lag form, fit with a maximum likelihood estimator. Model 4 is fit using a 2-step generalized method of moments estimator, where the spatial filter is used to generate instruments for the relatedness and complexity variables. The Cragg-Donald F-stat is much larger than the critical Stock‐Yogo values for weak identification. Note that all independent variables are normalized.
Model 2 indicates that both the relatedness and complexity variables are statistically significant and positively related to the rate of growth of GDP. The partial regression coefficients for these variables are similar. Thus, an increase of one standard deviation in the relatedness and complexity variables increases the rate of growth of GDP by about 0.12 units and 0.08 units, respectively, over a 5-year period. To provide some perspective, a one unit increase in the standard deviation of overall invention (sum patents) increases the rate of growth of GDP by an average of 0.25 units. Thus, the individual impacts of relatedness and complexity on GDP growth are somewhere between one-third and one-half that of technological change in general.
Turning to the other covariates in Models 1 and 2 of Table 6, the negative slope on the lagged level of GDP suggests convergence in GDP across Chinese cities. As expected, the overall measure of invention (sum patents) is positive and significant and so is the higher education share variable. Note that the impact of the higher education share on growth is only slightly below that of overall invention. These results are consistent with most of the literature. The technology Herfindahl in Chinese cities is not significantly related to GDP growth and neither are population density or real foreign direct investment. We note that Madariaga and Poncet (2007) find a significant and positive relationship between FDI and city growth in China, though the covariates in their model are quite different than those assembled here. Ning, Wang, and Li (2016) also report a significant, positive influence of FDI on rates of invention at the city level in China.
The results reported in Models 1 and 2 raise two immediate questions in terms of estimation. First, our units of observation are cities and thus we should be concerned with spatial dependence in the data that renders standard tests of regression coefficients suspect. Second, there is the possibility of endogeneity resulting from simultaneity bias in our model if GDP growth fuels the introduction of new technology that might be related to our measures of relatedness and complexity. To examine the issue of spatial autocorrelation, we run the spatial linear model (splm) in R. A spatial weights matrix (inverse distance) was computed using coordinates of the centroids of our sample of 286 cities taken from 2010. That spatial weights matrix was used in fixed-effects spatial models of error and lag form. Diagnostic checks suggested use of the spatial lag framework and the results are reported in Model 3 of Table 6. Those results are consistent with those for Model 2. We lose a few observations in the spatial fixed-effects model which requires a balanced panel, and some variables were missing for specific cities and years.
In terms of endogeneity, the standard recourse is an instrumental variables approach. Lacking readily available instruments, in particular for our smart specialization variables, we turn to a spatial filter approach (see Griffith 2003 and Le Gallo and Páez 2013). However, an immediate concern is the significant spatial autocorrelation of the dependent variable reported in the spatial lag model of Table 6. That model was constructed using inverse distance weights between all pairs of Chinese cities. In the spatial filter approach, we test whether the binary spatial contiguity matrix used has significantly reduced spatial dependence in the dependent variable.
The steps involved in the development of the spatial filter are briefly outlined below: 1. A spatial contiguity matrix between all pairs of Chinese cities in our sample was constructed using coordinates for the centroids of each city. The distance between cities defined as “neighbors” was set such that all cities have at least one neighbor. Many contiguity matrices satisfy this condition. We chose one that minimized the number of neighbors for each city. The (286 × 286) spatial contiguity matrix was then made binary with the value 1 indicating that a pair of cities are neighbors. Re-running the splm model from Table 6 with this new contiguity matrix weakened the spatial lag of the dependent variable such that it was significant only at the level p = .08. 2. Find all 286 eigenvectors associated with the binary contiguity matrix. Spatial filters for variables considered endogenous are constructed using a linear combination of a subset of these eigenvectors. 3. The filter for a specific endogenous variable is found by regressing the variable against all eigenvectors and keeping those eigenvectors that have a p-value below some threshold in the regressions. We used a p-value of .1 as cutoff that balances the desire to keep the p-value relatively low with the need to insure that the instruments pass rank and weak instrument tests. 4. The result is a “synthetic variable” that is exogenous by construction: it comprises only eigenvectors that each represent a portion of the variance of the binary spatial contiguity matrix. 5. We built instruments, using the spatial filter technique, for the relatedness and complexity variables that are the key components of the smart specialization index. These instruments were constructed for all cities across each of the 5-year time-periods for which the raw data were available. The instruments exhibited correlations with the original variables ranging from 0.54 to 0.7 across the time steps in the data.
Model 4 reports the fixed-effects panel model, estimated with a GMM approach, incorporating instruments in place of the relatedness and complexity variables that are potentially endogenous with the rate of growth of GDP. Note that in Model 4, spatial dependence is ignored, for there is no obvious way in which it can be included in an instrumental variables framework. Model 4 replicates the findings of Model 2, showing once more the significance of relatedness and complexity on city growth. The regression coefficients and their standard errors for the instrumented variables are larger in Model 4 than in Model 2, that being a common finding with this technique. The diagnostic tests for Model 4 suggest that our instrumental variables pass rank tests and that they are not weak. Model 4 is exactly identified as presented in Table 5. A Sargan test was run for Model 4, adding the variable population as one more instrument. The resulting over-identified equation did not reject the null hypothesis of the Sargan test that the instruments are exogenous. We hope that these results dampen concerns regarding endogeneity. However, we should note two caveats with respect to these findings. First, given the correlated nature of most economic variables, we might have developed instruments for all the independent variables in our model. Second, although spatial autocorrelation in the dependent variable was reduced by using the binary contiguity matrix in the spatial filter, ideally one would employ a spatial filter approach when there is no spatial dependence in the dependent variable.
Finally, we did engage in some robustness checks of the results presented. To allay concerns with the (1991) start year for our 5-year panels, we ran models with a start year of 1989 with no appreciable change in results. In addition, concerns with tracking significant changes in city technology using the binary RTA index also prompted us to add a threshold for changes in RTA to be considered significant. In this case, we limited our analysis of changes in RTA within city-technology pairings to only those observations where change in the absolute value of RTA exceeded 0.5 and where such change resulted in the binary RTA value changing from 0 to 1 or vice versa. Again, the core results were not qualitatively different from those reported.
Conclusion
This paper explored the determinants of economic growth in Chinese cities since 1990. The primary aim was to assess whether cities that developed new technologies in a manner consistent with the logic of “smart specialization” experienced higher GDP growth rates after controlling for the pace of overall technological change and other factors that drive growth. Smart specialization was defined as developing complex technologies in knowledge fields that are related to existing capabilities. Through its focus on technological relatedness and complexity, smart specialization offers a trajectory of knowledge development that should enhance regional competitive advantage as complex technologies are more difficult to imitate and more difficult to move than less complex technologies (Balland and Rigby 2017; Maskell and Malmberg 1999). At the same time, building knowledge stocks that are closely related to existing capabilities is thought to lower the cost of innovation and raise the probability of its successful deployment (Balland et al. 2019).
Chinese patent data were used to capture the knowledge profiles of cities over 5-year periods since 1990. Analysis focused on the evolution of those profiles, examining patterns of technological entry and exit across different patent classes by city and time period. Measures of complexity were generated for technology classes and for cities as a whole, along with measures of the relatedness of technologies entering and exiting each city’s knowledge stocks. Fixed-effects panel models were employed to link GDP growth to the relatedness and complexity of changes in urban knowledge stocks. The results showed that the index of smart specialization and the two components of that index, relatedness and complexity, were statistically significant and positively related to the rate of growth of GDP within Chinese cities over time. In terms of economic significance, a one-standard deviation change in relatedness and complexity combined can be linked to changes in GDP growth that represent about 80% of the impact of a one-standard deviation change in the overall pace of invention.
These findings have important policy implications for cities and regions in China and, potentially, for those elsewhere. Economic growth is not limited solely by how much regions invest in innovation. Equally important is to make sure that investment is directed toward technologies that are related to a region’s existing knowledge capabilities. Technological development in related domains increases the prospects of successful innovation. Stated differently, related diversification is less costly than other forms of knowledge growth as it builds upon existing strengths. Leveraging capabilities into related knowledge fields that raise complexity has the added benefit of strengthening urban and regional competitive advantage in that more complex technologies are difficult to imitate and difficult to move.
Technological complexity is not static, it changes over time as some forms of tacit knowledge become codified and as new types of complex and tacit knowledge are developed. In periods of normal growth, as more technologically advanced cities and regions search for the most complex new technologies, they tend to abandon other knowledge subsets that are less sophisticated. In turn, the development of these technologies by cities and regions that are lower in technological complexity has the potential to raise their economic performance, if they have the capabilities to exploit these possibilities. In periods of economic crisis, the capabilities that count may be less predictable and thus regional fortunes less secure. Whether new technological trajectories are more likely to emerge in cities and regions in period of growth or crisis remains an open question.
Forms of unrelated diversification in cities and regions also require much more attention (Boschma 2017; Tanner 2014). Do local and regional economies change their repertoires of technological and industrial capabilities only slowly, or are they able to transition rapidly when new opportunities emerge? Furthermore, are these possibilities shaped only by the market, directing economic agents toward more profitable ventures, or are they guided by institutional hands? In China, state as well as market forces direct flows of capital and thus guide the development and geography of capabilities. Yet how does the state determine the technologies that will be developed in particular places? Is the state also guided by market logics, by existing geographies of knowledge accumulation and potential, and by patterns of growth and performance?
Finally, there are a number of limitations to this work. First, the research presented relies heavily on patent records. Questions remain as to whether patent data provide a useful proxy for innovation overall. Second, we use patent classes as representations of different technology fields. Whether the 4-digit classes of the IPC can be used in this way remains an open question. Third, the CNIPA data do not report inventor locations. The development of geographical information for Chinese inventors would significantly enhance spatial analysis of innovation within China. Finally, concerns with spatial dependence in the data demand further analysis, especially in relation to the use of the spatial filter approach for generating instrumental variables.
Footnotes
Declaration of Conflicting Interests
The author(s) declared no potential conflicts of interest with respect to the research, authorship, and/or publication of this article.
Funding
The author(s) received no financial support for the research, authorship, and/or publication of this article.
The Dynamics of Technological Complexity in Chinese Cities,1991–2015.
Chinese Cities in Smart Specialization Space (Lower Left Quadrat for Entry (Top) and Upper Right Quadrat for Exit (Bottom)).
List of Complexity Values for all IPC Classes,2011-15. Please See Attached Table ( Appendix 3 ).
G06T 100.00
G06K 97.03
G06F 95.44
H03K 93.38
H03F 91.27
G10L 90.57
B33Y 90.51
H03G 90.13
G01R 89.87
G08C 89.22
G01N 89.07
G02B 88.77
H03B 88.73
GO5B 88.65
G01C 88.08
G04R 87.94
H01S 87.75
G01D 87.68
H04N 86.99
H03L 86.88
H04B 86.32
G03H 86.26
G09G 86.24
G01M 85.57
H04S 85.55
H04K 84.47
G06Q 84.18
G08G 83.62
H04L 83.61
G03B 83.45
B82Y 83.30
H03H 83.21
B82B 83.01
G11B 82.88
G01H 82.76
G01P 82.62
G07C 82.52
G01L 82.49
H02M 82.24
H02J 81.96
G01S 81.88
H04J 81.71
H03D 81.57
G02F 81.51
G01J 81.45
H01Q 81.39
C40B 81.10
G07B 81.07
G06N 80.88
H04H 80.56
G04F 80.21
H03M 80.19
F41F 80.14
B81C 79.80
G05D 79.66
H01L 79.63
H02H 79.50
G07G 79.36
H04M 78.53
G01Q 78.45
C23C 78.22
H04W 77.55
G01B 77.48
G05F 77.41
G21K 77.39
H05F 77.06
H05H 76.36
C12Q 75.94
G01K 75.84
G01T 75.54
G07F 75.50
C12N 75.32
C06D 75.30
B81B 75.18
G11C 75.06
G04G 74.98
G21G 74.35
H01P 74.08
G03F 74.05
B60W 74.01
G21C 73.62
H03C 73.61
H01J 73.54
A61B 73.40
C07K 72.95
B01J 72.84
G01W 72.80
A62D 72.38
B09C 72.23
H05G 72.00
F23R 71.97
F03H 71.77
H03J 71.76
E01D 71.70
G21F 71.69
F15D 71.63
H01M 71.54
G04C 71.45
B41J 71.27
H04Q 71.06
F41J 71.04
G21B 70.87
H01C 70.79
H01G 70.77
C25B 70.62
B64D 70.25
H02P 70.06
G21H 69.88
C30B 69.82
F22G 69.28
G21D 68.95
C25F 68.62
G04D 68.43
G10H 68.18
G10K 68.12
C02F 67.43
C08F 67.41
H05B 67.12
C08J 66.99
F42C 66.55
B41M 66.51
B65C 66.48
B64B 66.43
F01K 66.41
B64G 66.17
C08G 65.93
G01F 65.78
C07F 65.67
B60V 65.60
C06C 65.54
F02C 65.50
F41A 65.49
C09K 65.43
G01V 65.39
H05K 65.28
B61F 64.89
G07D 64.60
G08B 64.38
F02K 64.29
C01G 64.23
F02G 64.17
C07B 64.07
G06E 63.99
B60F 63.86
H04R 63.49
F41G 63.47
C08H 63.42
B06B 63.38
C07J 63.31
B64C 62.95
A24C 62.88
B60M 62.65
B61G 62.64
F21K 62.58
G03D 62.18
G09F 62.15
F23N 61.89
B61L 61.88
B41C 61.63
F16T 61.55
A99Z 61.53
H05C 61.10
A24D 61.07
F01C 61.06
A63J 61.05
G09C 60.97
B41K 60.80
B60R 60.78
B63J 60.74
F42D 60.63
B42C 60.52
G06M 60.51
G16H 60.48
F41C 60.46
G05G 60.32
G12B 60.27
A44C 60.23
B63B 60.19
E02D 60.18
G09D 60.01
E02C 59.97
B31D 59.95
B62C 59.77
F15C 59.69
G03C 59.60
C10H 59.52
C08C 59.31
A61L 59.25
F28G 59.23
C23F 59.21
C23D 59.03
B44F 58.96
F01D 58.81
B23H 58.70
B25J 58.47
G10C 58.27
F17D 58.25
G10F 58.10
C07G 57.95
A41C 57.67
G06G 57.43
B01L 57.40
B41B 57.37
F16M 57.25
F02D 57.12
C12S 57.04
A63D 56.96
F24F 56.91
F25J 56.79
B41G 56.6
A63F 56.56
G06C 56.52
B42B 56.51
F28B 56.33
B21G 56.32
E21D 56.22
C25D 56.16
A61C 56.14
C12M 55.9
F17B 55.89
A01J 55.83
F02P 55.78
C09H 55.63
B01B 55.61
A63K 55.51
B67D 55.49
F21V 55.48
B41N 55.45
B68F 55.44
F16P 55.43
C06F 55.43
C10C 55.4
D21G 55.21
B61K 55.2
B68C 55.16
B63G 54.35
B61H 54.33
D21J 54.3
G04B 54.29
C05B 54.28
A24B 54.27
B41L 54.24
B68G 54.2
C12F 54.19
F23C 54.08
F23M 53.84
F25B 53.82
B21H 53.77
B66B 53.73
B22F 53.56
C14C 53.56
D04G 53.52
C03C 53.43
D04D 53.38
C12R 53.37
B64F 53.29
D06J 53.28
E01B 52.98
F41H 52.95
F25C 52.92
F21S 52.79
G03G 52.77
A42C 52.7
C12L 52.68
F04C 52.31
B25C 52.23
F24S 52.23
F03D 52.13
H02S 52.11
C11C 51.89
D06Q 51.81
G99Z 51.78
C14B 51.71
H01T 51.66
A41H 51.6
H02N 51.6
C12C 51.58
A01L 51.56
B60D 51.53
B27H 51.25
A24F 51.19
E04B 51.19
C10F 51.08
B61J 51.06
A41F 50.96
H01H 50.91
E21B 50.77
C12B 50.73
B60Q 50.67
C13K 50.53
G21J 50.41
B31C 50.35
D04C 50.35
G10B 50.35
D04H 50.33
C08L 50.27
G09B 50.17
F41B 50.11
C12P 50.09
F01B 50.05
B07C 50.01
D01C 50
H01R 49.92
G01G 49.9
B61C 49.9
B24D 49.89
B27F 49.81
F25D 49.74
F23H 49.72
D02J 49.71
F21H 49.62
F16F 49.61
A43C 49.57
C22F 49.55
B60H 49.42
E02B 49.36
D21D 49.25
B67B 49.25
B60L 48.97
B68B 48.93
F01L 48.68
B23K 48.63
C09F 48.56
B29K 48.52
C10J 48.5
C09G 48.5
F03C 48.42
F04F 48.39
D01D 48.37
E01C 48.34
D02H 48.32
C07D 48.26
B21B 48.21
C06B 48.14
B31F 48.1
B31B 48.06
B21L 47.85
B05C 47.84
B62L 47.79
D01F 47.71
B61B 47.7
F22D 47.62
C10M 47.59
C10K 47.47
C01B 47.42
F21L 47.38
D03C 47.35
B27J 47.27
H01K 47.27
B42F 47.17
D04B 47.1
E04G 47.07
B63C 46.99
F01M 46.87
C21B 46.51
B04C 46.33
D01H 46.33
C09B 46.31
F42B 46.3
B62D 46.28
C05D 46.27
B60N 46.27
F16G 46.08
A61N 46.01
A63C 46
B63H 45.97
C08K 45.81
E05G 45.76
E01F 45.69
G02C 45.66
A44B 45.62
C07C 45.61
D06N 45.6
C21C 45.51
C01F 45.47
B25D 45.45
D06B 45.44
F04B 45.4
A61D 45.37
C10G 45.29
A62C 45.28
A23J 45.16
C13B 45.02
B25F 44.96
E03F 44.94
B23F 44.86
D03J 44.81
F28C 44.65
B04B 44.55
H01F 44.55
C08B 44.54
F16C 44.35
B23C 44.3
A43D 44.23
A47F 44.08
B21J 43.81
F17C 43.71
B61D 43.68
C05C 43.66
F01N 43.61
A63H 43.51
D06M 43.36
D05C 43.28
C09D 43.17
E04D 43.1
G10G 43.09
F23Q 43.03
B05D 43
F01P 42.98
C22C 42.97
B60S 42.96
C22B 42.69
B66C 42.52
F02N 42.48
D21B 42.48
F28D 42.47
F23D 42.38
A46D 42.26
D06G 42.23
C21D 42.18
F15B 42.18
E21F 42.16
B23G 42.15
B09B 42.15
E05F 42.12
C07H 42.08
B25H 42.07
B43M 41.92
F28F 41.85
D03D 41.84
C23G 41.81
F04D 41.67
B29C 41.57
B42D 41.46
B21D 41.4
D02G 41.36
F02F 41.34
D05B 41.33
B62H 41.28
D01B 41.2
F16S 41.14
D06P 41.13
F16J 41.11
B03D 41.06
B60J 41.02
B21K 41.01
D06F 40.96
B26F 40.93
B27L 40.86
A22B 40.83
B32B 40.75
D21F 40.71
C01C 40.7
C10B 40.43
E03B 40.43
H02K 40.43
H02B 40.4
G10D 40.37
C09C 40.28
E06C 40.18
A01H 40.17
B44D 40.16
B03C 40.15
B24C 40.04
B60G 39.91
F23L 39.7
H01B 39.51
B44B 39.5
C01D 39.47
B41F 39.41
F24C 39.38
C25C 39.3
C12H 39
E05D 39
B67C 38.96
B25G 38.87
B65B 38.86
D06H 38.85
A61M 38.55
A41D 38.42
D06L 38.38
D21H 38.31
A45F 38.28
C09J 38.21
A61F 38.19
B29D 38.06
B21C 38.05
A63G 38.04
A41G 37.94
B27G 37.85
F03G 37.77
A01N 37.65
A21C 37.43
F22B 37.39
B27K 37.38
D07B 37.16
C03B 37.05
B29B 37
D21C 36.97
F03B 36.56
E21C 36.48
A45B 36.45
B23Q 36.07
F16K 36.04
D06C 36.02
F23J 35.88
A21B 35.8
E05C 35.7
A41B 35.62
A42B 35.61
A61J 35.39
A45C 35.38
B60K 35.3
F02M 35.18
F23K 35.02
E04C 35.02
B24B 34.94
B27M 34.8
F24D 34.54
A47H 34.49
B28D 34.39
B65F 34.21
F16H 34.21
B21F 33.96
C11D 33.75
B44C 33.32
B30B 33.32
B26B 32.98
F23G 32.86
D01G 32.74
A45D 32.62
B28C 32.61
A46B 32.54
C10L 32.49
B62J 32.47
F16L 32.44
F23B 32.43
B01D 32.43
B23P 32.34
C04B 32.3
A23D 32.23
A22C 32.22
B27N 32.06
B65H 31.99
A47K 31.81
A47D 31.59
B27C 31.52
B05B 31.34
B66F 31.08
A62B 31.05
B60C 30.98
F27D 30.88
A47J 30.79
B23D 30.62
B60 B 30.58
E04H 30.54
B23B 30.47
B22D 30.43
A61Q 30.26
H02G 30.13
B66D 29.66
B60T 29.47
F16B 29.4
B60P 29.25
B62M 29.23
B62B 29.06
B25B 28.97
B27D 28.95
F16D 28.93
B27B 28.53
F16N 28.34
F02B 27.77
A63B 27.44
E03D 27.41
E06B 27.34
B02B 27.22
A61H 27.18
B03B 27.14
B62K 27
E01H 26.93
A43B 26.84
B01F 26.62
A47L 26.07
E05B 25.98
E02F 25.49
E03C 25.37
E04F 25.36
A61G 25.32
B43L 25.12
C12J 24.91
F24J 24.76
B22C 24.72
A23P 24.45
B43K 24.42
A47G 24.17
A47C 24.11
A23G 23.79
B08B 22.37
F27B 22.22
B26D 21.3
A47B 21.23
A61P 18.99
B65G 18.4
C05F 17.71
B02C 17.56
A23C 17.43
A21D 17.37
A23N 16.8
B07B 16.21
C11B 16.04
A23B 15.76
A23K 15.59
B65D 15.03
B28B 14.65
F24H 14.4
A61K 14.05
A01C 13.61
F24B 13.07
A01M 11.85
F26B 9.14
A01F 9.05
A23F 7.96
A01K 6.23
C05G 4.89
A01D 4.74
A01B 3.14
C12G 1.37
A23L 1.14
A01G 0.85